


Highlights
- Uptrend across the Nifty 50
- Traders can note the corroborating signals given by RSI and MACD
- Gauge market direction and make informed decisions.
Latest news
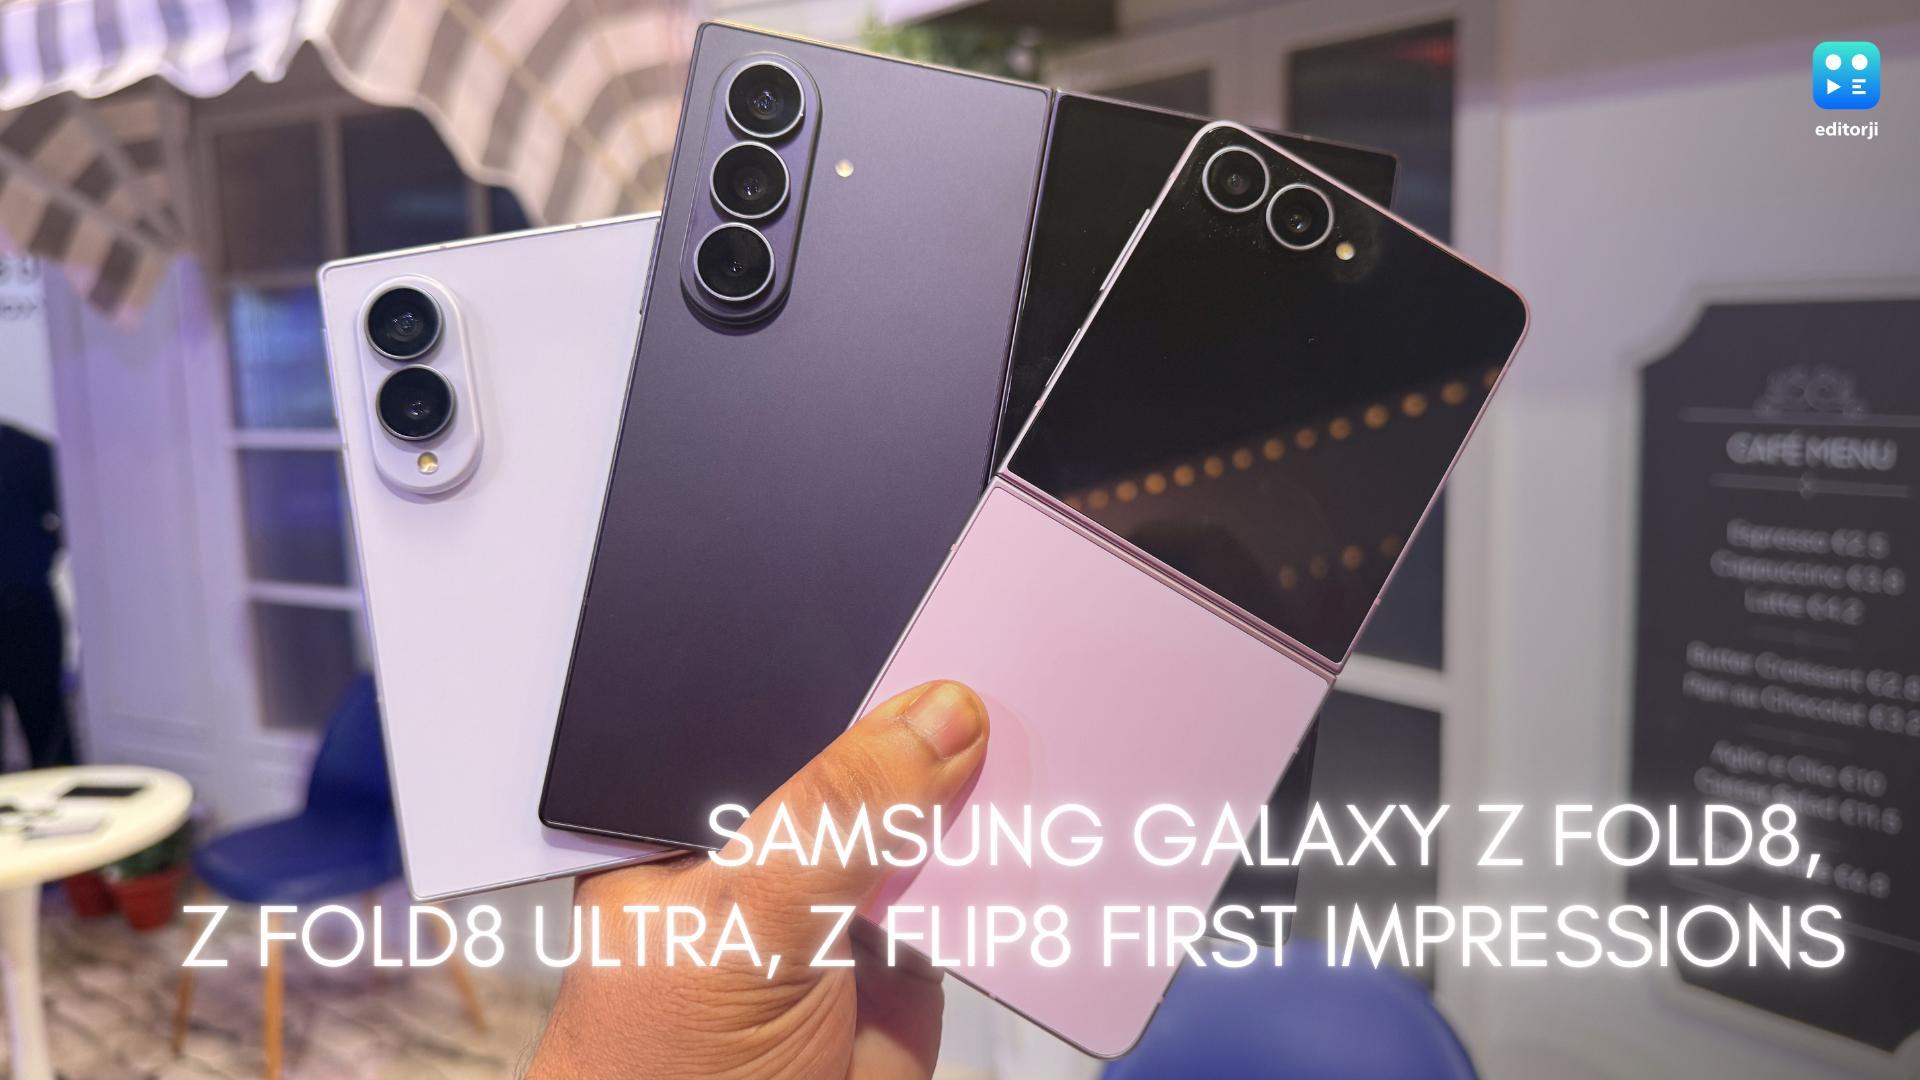
Samsung Galaxy Z Fold 8, Fold 8 Ultra & Z Flip 8: A More Mature Foldable Family

Dell Launches New Alienware 16X Aurora, 16 Area-51 and 18 Area-51 Gaming Laptops in India
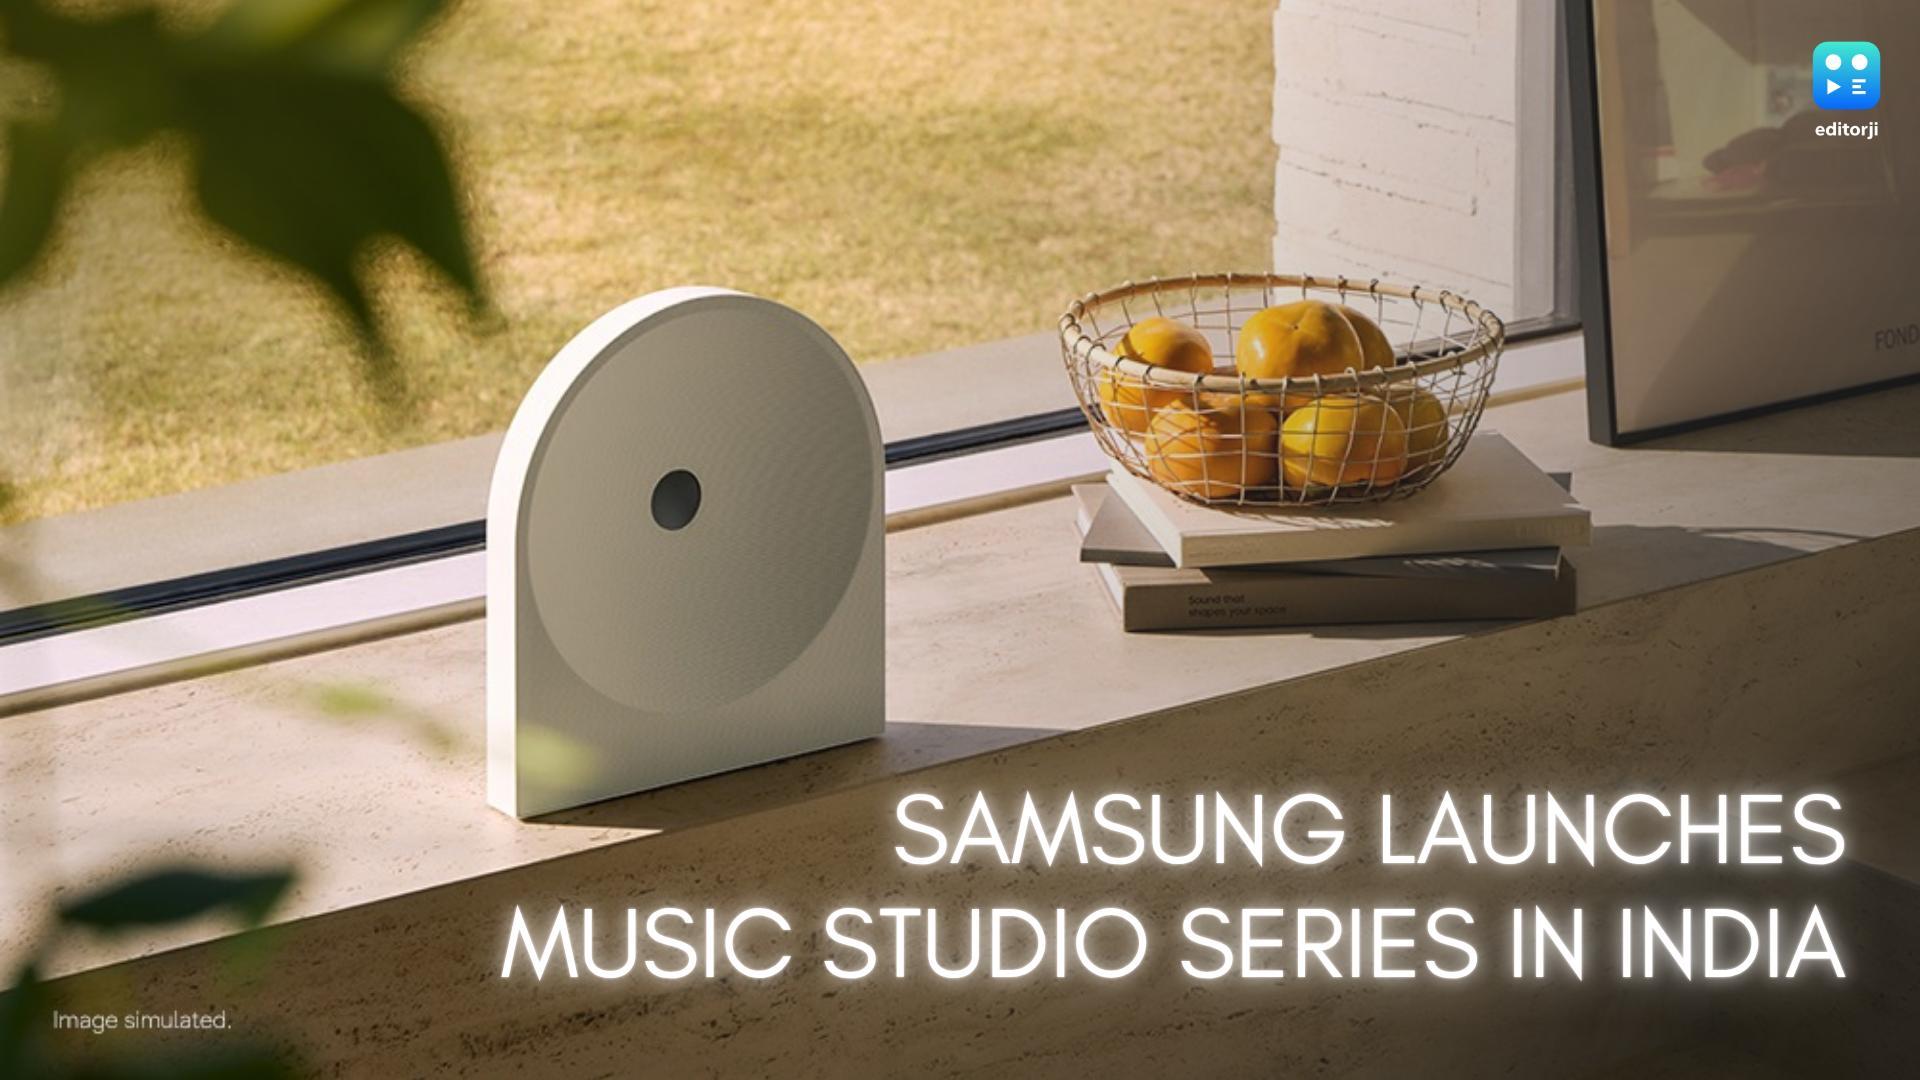
Samsung Takes on Premium Home Audio With New Music Studio Series

The End of OxygenOS: OnePlus Confirms Shift to Oppo's ColorOS

Fujifilm Instax Mini Evo Cinema Review: A Hybrid Camera That Prints Memories Differently

iQOO Teases Z11 Lite With AI Tools, Military-Grade Durability and a 6500mAh Battery

Editorji Launches Hook Global, Its International Digital News Brand
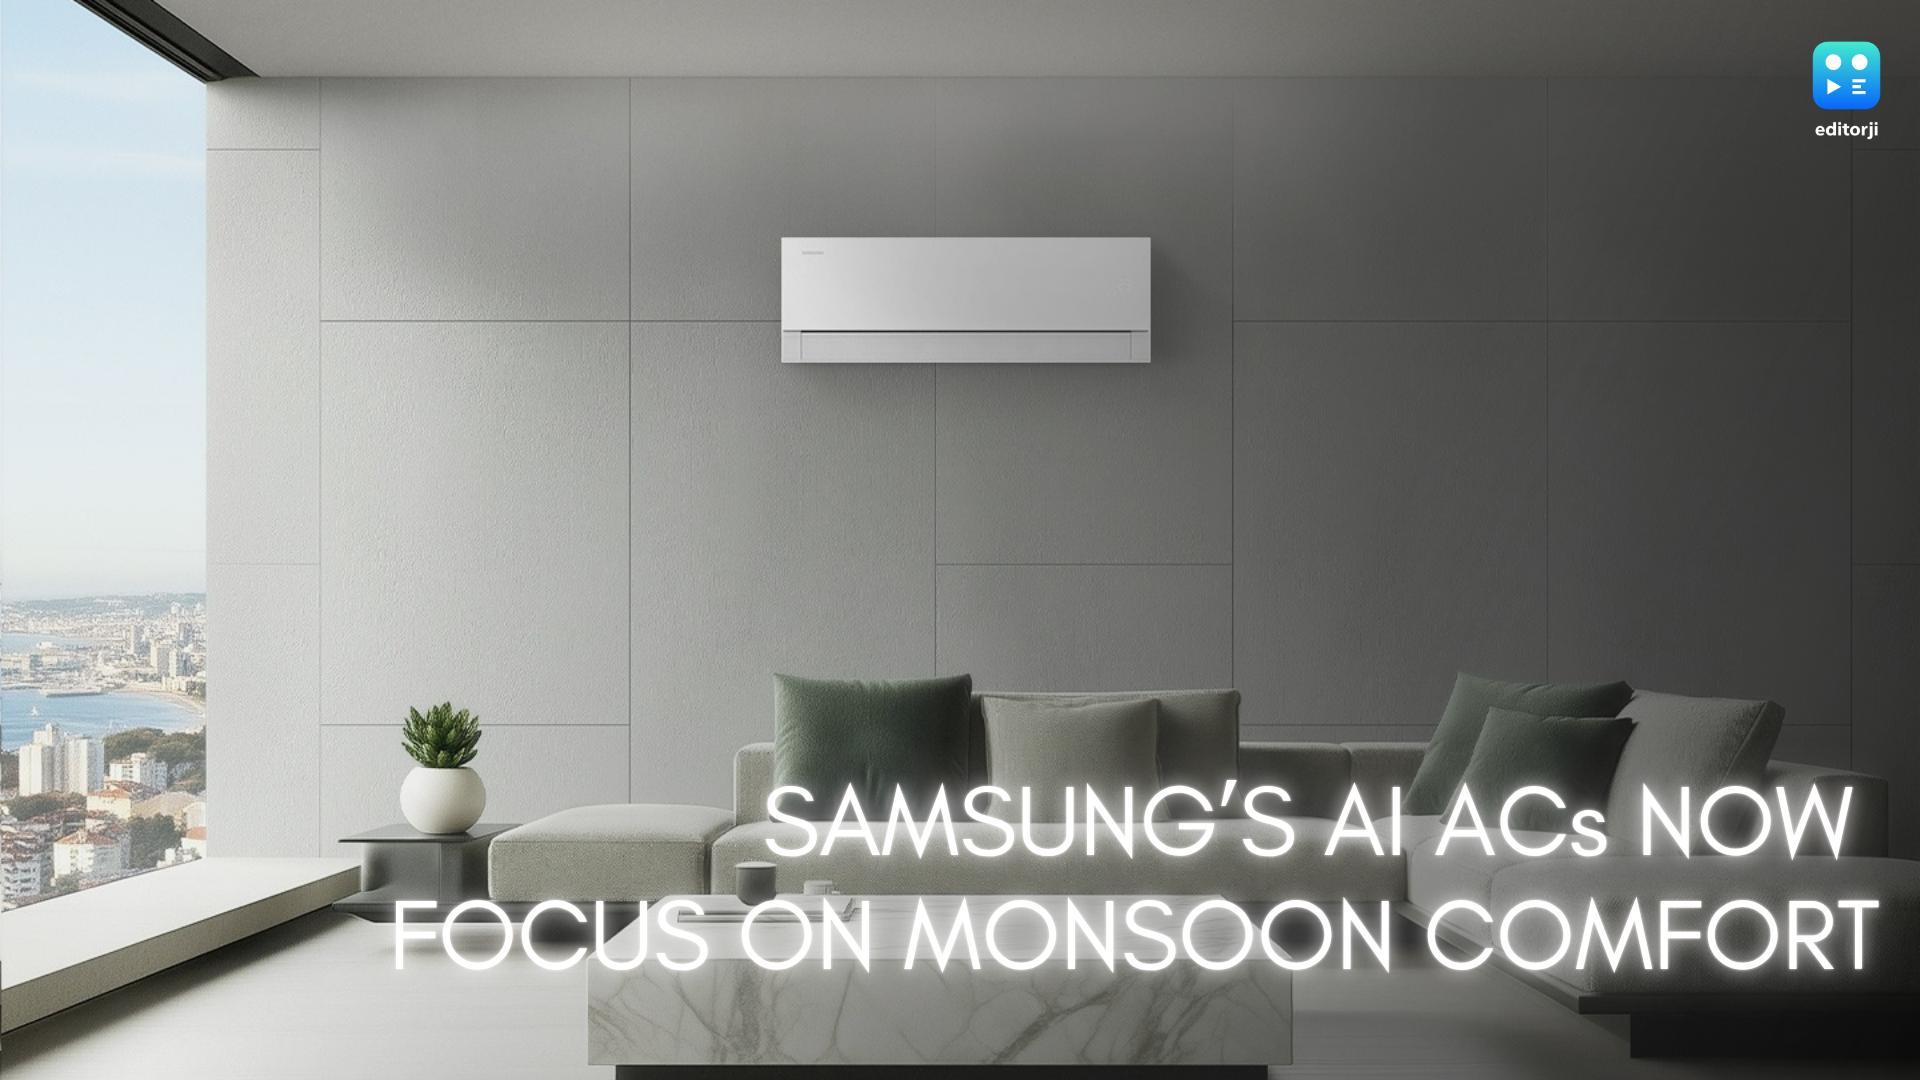
Samsung's Bespoke AI ACs Focus on Humidity, Hygiene and Smarter Cooling
Top 5 Nifty 50 gainers today – February 10, 2025: Biggest stock moves



In this article, we will explore the technical indicators of some of the high-performing stocks on the Indian stock market, including BHARTIARTL, BRITANNIA, HCLTECH, KOTAKBANK, and TATACONSUM.
By looking at these stocks through the lens of key technical factors, we aim to better understand their price movements, trends, and potential future performance.

Analysis for Bharti Airtel - February 10, 2025

**Bharti Airtel** has shown a positive performance, with a close price of 1693.05, up by 0.97% from the previous close. It has a strong market presence with a market cap of 10,134,293 million INR, and its PE ratio stands at 41.04, indicating investor confidence in future earnings. The company operates within the Communication Services sector in India.

Relationship with Key Moving Averages
The current close price for Bharti Airtel at 1693.05 is above the 10-day EMA (1652.13), 20-day EMA (1638.28), and 50-day EMA (1621.85), indicating a short to medium-term upward trend. Additionally, it is significantly above the 200-day EMA (1507.66), suggesting a long-term bullish trend continuation.
Moving Averages Trend (MACD)
The MACD for Bharti Airtel is 15.45, which is above its MACD Signal line of 10.33. This indicates a potential bullish trend, suggesting that the stock's upward momentum may continue.

RSI Analysis
The Relative Strength Index (RSI) for Bharti Airtel is 62.07, which suggests that the stock is in a neutral zone slightly leaning toward being overbought. Typically, an RSI above 70 indicates that a stock may be overbought, whereas an RSI below 30 might suggest it is oversold. With the current RSI value, the stock does not present extreme conditions.

Analysis for Britannia - February 10, 2025
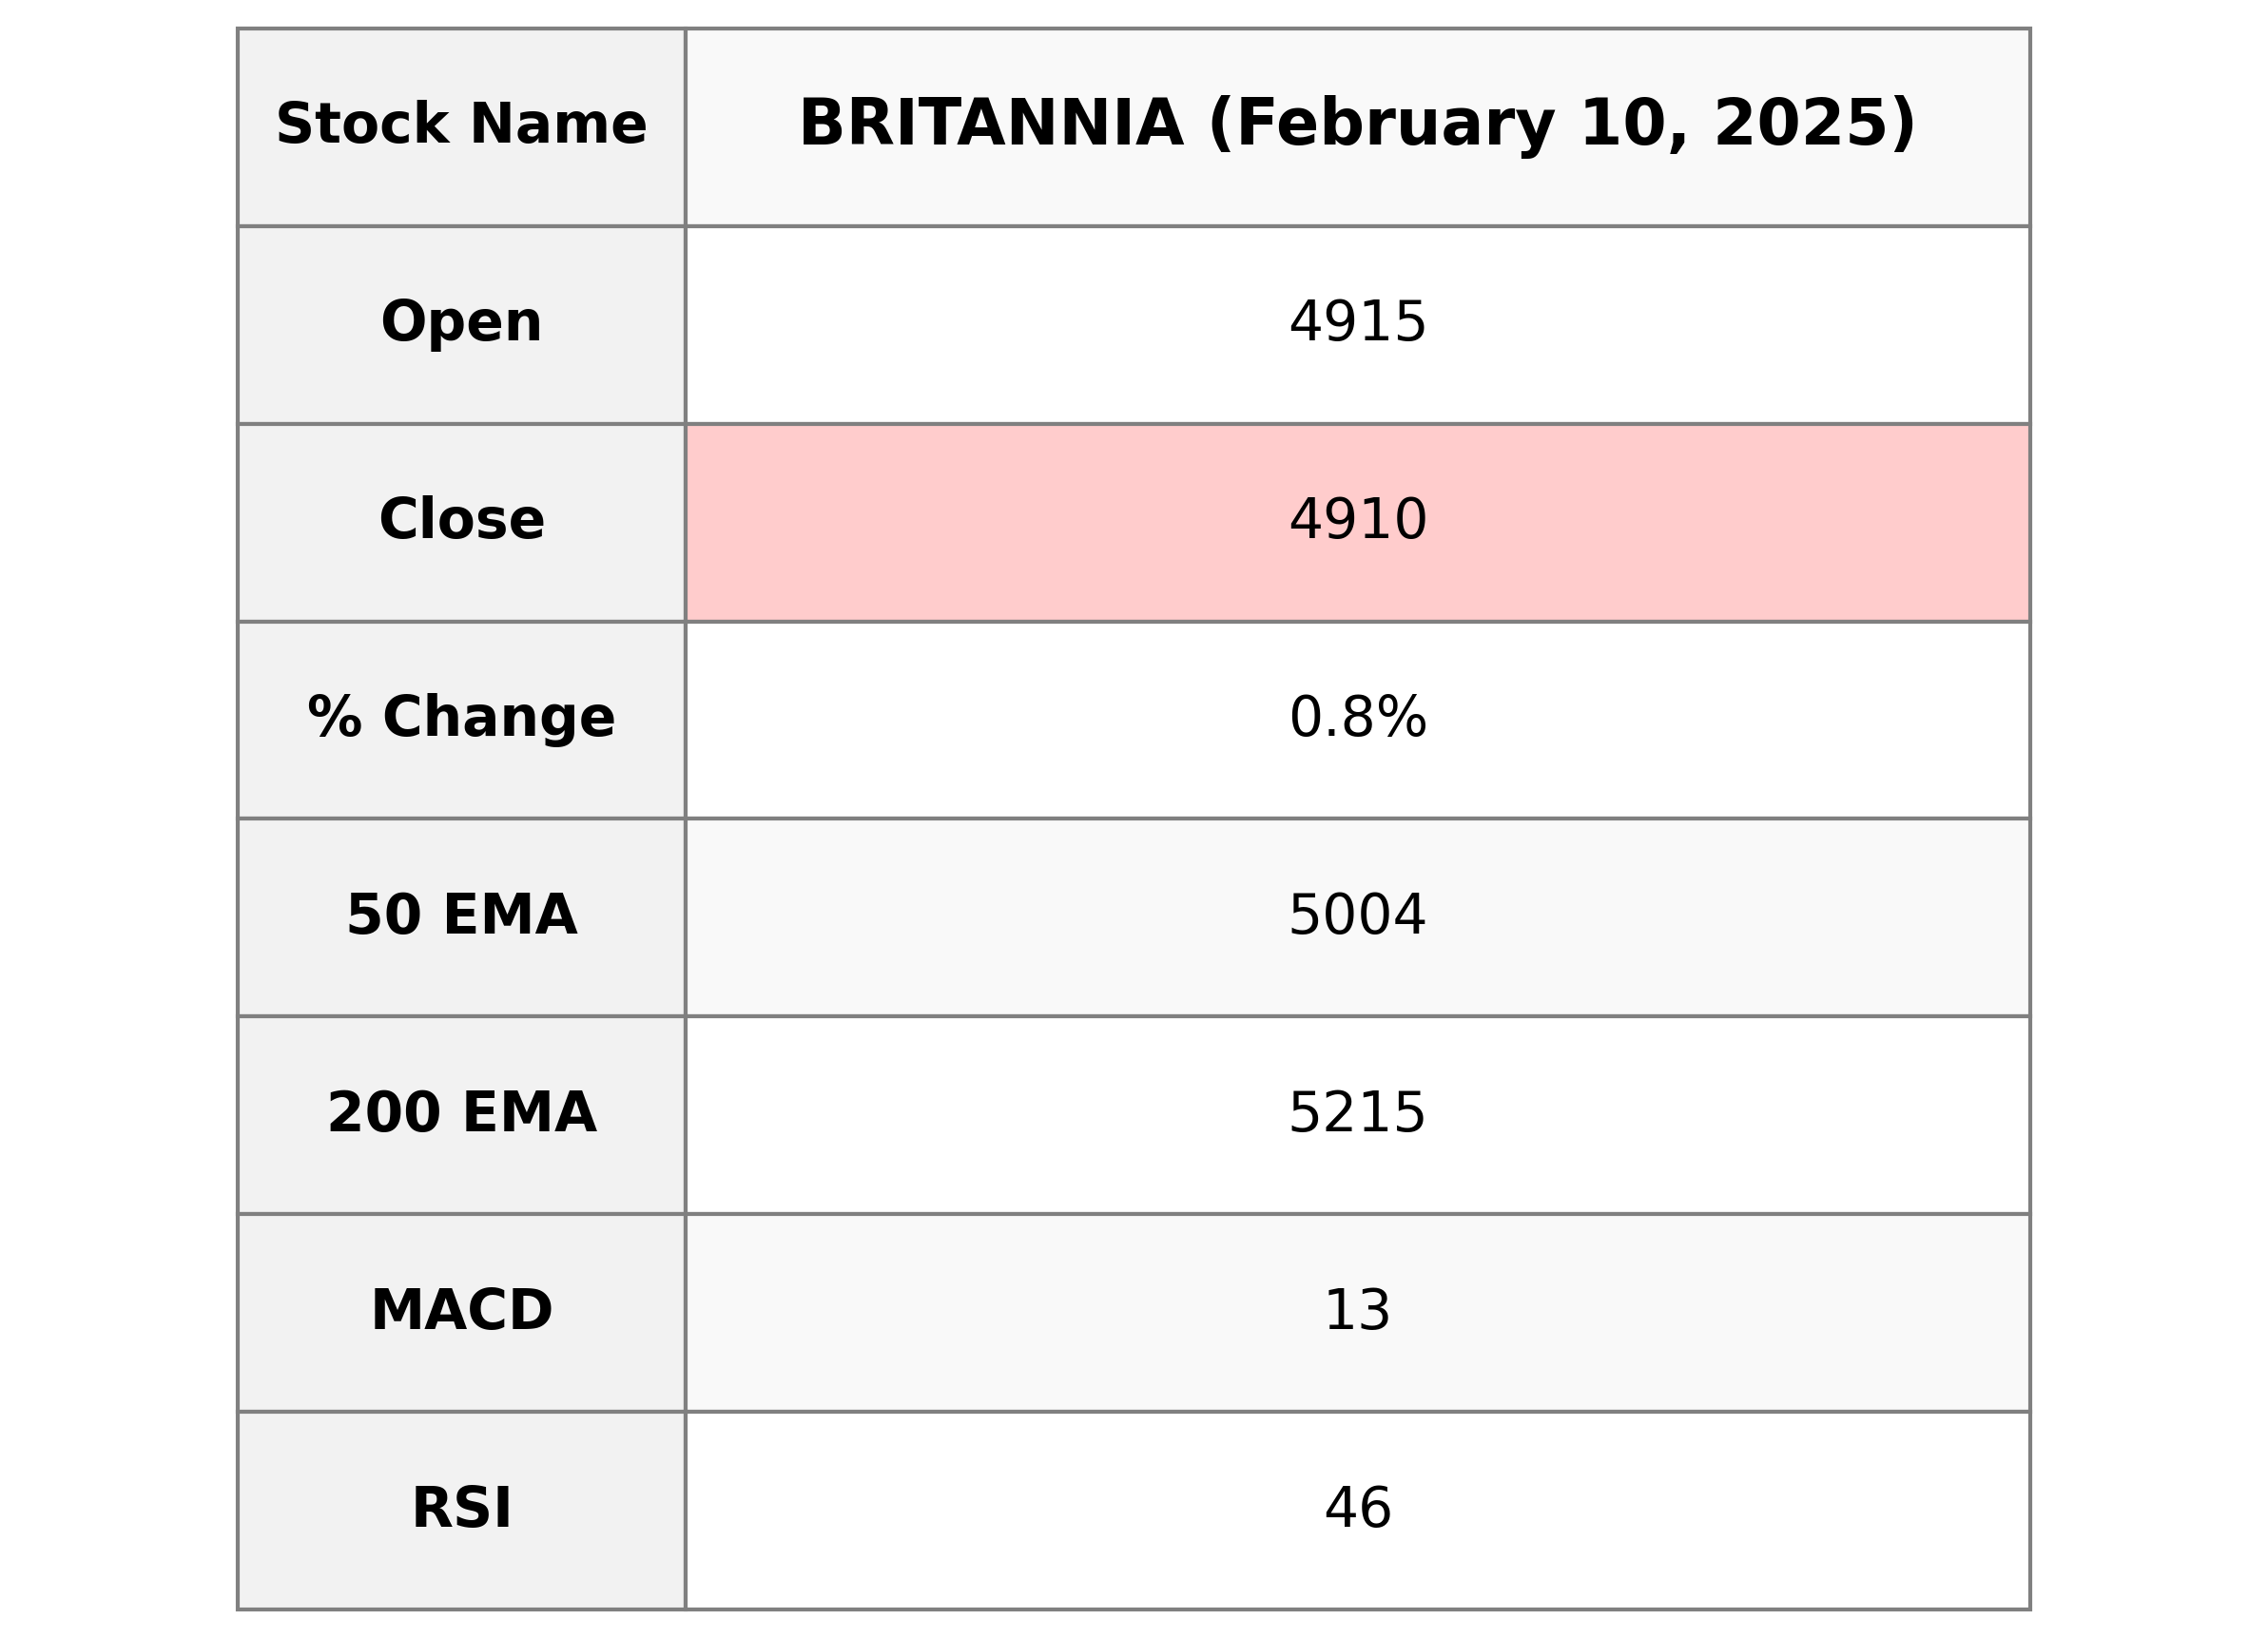
### Britannia Performance Overview Britannia performed modestly with a closing price at 4909.65, representing a 0.80% increase from its previous close of 4870.5. The stock traded between a high of 5009.0 and a low of 4877.0, on a volume of 624,947 shares. This consumer defensive company, operating in the packaged foods industry, showed a market capitalization of 1,183,633,113,088 INR and a PE Ratio of 54.78. The RSI of 45.91 indicates a neutral stance on the momentum, while the MACD suggests a downward trend.

Relationship with Key Moving Averages
Britannia's stock closed below its 50-day EMA, 10-day EMA, and 20-day EMA, indicating a potential short-term bearish trend. However, it's well below the 200-day EMA, suggesting a longer-term bearish sentiment. The RSI is also below 50, supporting potential weakness in the stock's momentum.
Moving Averages Trend (MACD)
The MACD for Britannia shows a value of 12.98, which is below the MACD Signal line at 31.85. This suggests a bearish sentiment, indicating that the stock might continue its downward trend unless there is a reversal in momentum.

RSI Analysis
Britannia's RSI is currently at 45.91, which indicates a neutral position as it is neither in the overbought nor oversold territory. Generally, an RSI below 30 or above 70 may suggest potential buying or selling pressure, respectively, so Britannia is currently in a relatively balanced state.

Analysis for HCL Technologies - February 10, 2025

**HCL Technologies** opened at 1723.95, reached a high of 1740.00, and closed at 1733.85, marking a slight positive change of 0.48% from its previous close. The stock's current performance indicates it trades below the 50-day EMA but above the 200-day EMA, with a MACD suggesting a bearish trend. Despite a relatively low RSI of 41.50, the company's market cap remains robust at approximately 4.7 trillion INR, reflective of its significant presence in the Information Technology Services sector in India.

Relationship with Key Moving Averages
HCL Technologies' current stock price is above its 200-day EMA, indicating a long-term upward trend, but below its 50-day EMA and 20-day EMA, which may signal potential short-term weakness. The price is very close to its 10-day EMA, suggesting recent stability in its movement.
Moving Averages Trend (MACD)
**HCL Technologies** - The current MACD value of -41.85, which is higher than the MACD Signal of -43.59, suggests a potential shift toward a bullish trend. However, as both values are negative, it indicates the stock is experiencing overall bearish momentum.

RSI Analysis
The RSI for HCL Technologies is currently 41.50, which places it in the neutral zone. This suggests that the stock is neither overbought nor oversold, indicating a balanced market sentiment.

Analysis for Kotak Mahindra Bank - February 10, 2025

**Kotak Mahindra Bank** experienced a positive trading session with a close of 1960.15, indicating a 1.60% increase from the previous close. The stock showed strong performance with both the 50-day and 200-day EMAs well below the current price, indicating a bullish trend. With a market cap of 3.897 trillion INR and a PE Ratio of 17.52, the bank is positioned strongly within the financial services sector in India.

Relationship with Key Moving Averages
Kotak Mahindra Bank's closing price of 1960.15 is currently above its 10-day EMA of 1914.67, 20-day EMA of 1886.00, 50-day EMA of 1839.51, and 200-day EMA of 1799.12, indicating bullish momentum. This suggests strong short-term and long-term trends compared to its key moving averages.
Moving Averages Trend (MACD)
**MACD Analysis for Kotak Mahindra Bank:** The MACD for Kotak Mahindra Bank is 36.19, which is above the MACD Signal line of 32.82. This suggests a bullish trend, indicating potential upward momentum in the stock's price.

RSI Analysis
The Relative Strength Index (RSI) for Kotak Mahindra Bank is 65.40, which suggests that the stock is in a strong position, heading towards overbought territory. Generally, an RSI above 70 is considered overbought, while below 30 is oversold; hence, it's important to monitor any further moves above this level.

Analysis for Tata Consumer - February 10, 2025

**Tata Consumer Performance** Tata Consumer exhibited a slight upward momentum with a closing price of 1027.5, marking a 0.62% increase from the previous close. The stock shows strength above its 10 EMA and 50 EMA, with a supportive RSI of 60.64, indicating positive technical signals. The company operates in the Consumer Defensive sector, specifically in Packaged Foods, in India.

Relationship with Key Moving Averages
Tata Consumer closed at 1027.5, which is above its 50 EMA of 982.48 and also above its 10 EMA of 1015.77, indicating short-term bullishness. However, it remains below the 200 EMA of 1032.11, suggesting potential longer-term resistance.
Moving Averages Trend (MACD)
**MACD Analysis for Tata Consumer:** The MACD line is above the Signal line, indicating a bullish momentum. With the MACD at 21.16 and the Signal at 18.55, the stock is showing signs of upward movement, suggesting potential continued positive performance in the near term.

RSI Analysis
Tata Consumer's RSI stands at 60.64, indicating a moderately strong momentum. With the RSI below the 70 threshold, the stock is not currently in overbought territory, suggesting potential for further upward movement if other conditions are favorable.

Up Next
Top 5 Nifty 50 gainers today – February 10, 2025: Biggest stock moves

Step-by-step guide to apply for a mortgage loan online with minimal documentation
Honda Activa 6G: Everything You Need to Know Before Buying

How much does a ULIP plan really cost? A break-down of all charges

Centre plans to borrow Rs 8.20 lakh cr from market in first half of FY27

Reliance denies buying Iranian oil amid US sanctions waiver

More videos
Premium petrol price up Rs 2, industrial diesel up Rs 22; no change in normal petrol, diesel rates

India's GDP expected to register over 8 pc growth in Sep-Dec: Report

Govt announces seven measures to help boost exports
RBI keeps interest rates on hold after US trade deal boosts outlook

RBI proposes to compensate customers up to Rs 25,000 loss due to fraud
RBI raises GDP growth projection of Q1, Q2 of FY27
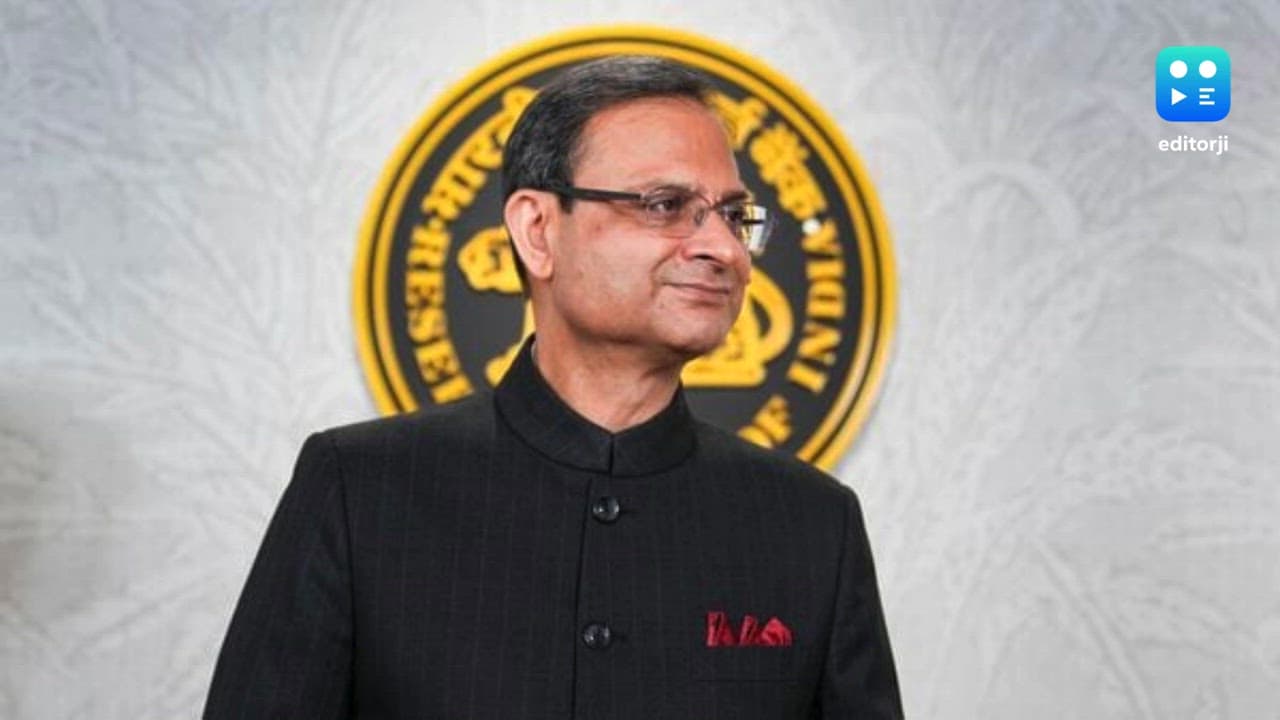
RBI pauses rate cuts, retains interest rate at 5.25 pc

Rupee jumps 122 paise to close at 90.27 against US dollar on India-US trade deal

Stock markets cheer India-US trade deal: Sensex, Nifty surge 2.5 pc

UPI transactions hit record high of Rs 230 lakh crore in 2025-26 till Dec: Govt