


Highlights
- BPCL emerged as the top loser in the Nifty 50 market
- Bearish sentiment evident
- RSI and MACD signal a downtrend
Latest news

India's private sector expansion eases to three-month low in June, says HSBC
 From Meta")
CRED to Raise INR 8,550 Crore (~USD 900M) From Meta

US Trade representative Jamieson Greer in Delhi for key meetings with Piyush Goyal

India's textile exports set for boost as China loses global apparel market share: Report

MaitriBodh Parivaar Celebrates a Unique International Day of Yoga Blending Maitri, Sanskriti, and Holistic Well-being

Gold may remain under pressure as stronger dollar, hawkish Fed weigh on sentiment: WGC

Crafting Bharat - Season 3 launches its seventh episode featuring Sandeep Jethwani of Dezerv

The Top PG in Whitefield for IT Pros and Students
NSE Nifty 50: Top 5 stock losers of January 23, 2025


In this article, we will explore the technical indicators of some of the low-performing stocks on the Indian stock market, including BPCL.NS,HCLTECH.NS,KOTAKBANK.NS,POWERGRID.NS, and RELIANCE.NS.
By looking at these stocks through the lens of key technical factors, we aim to better understand their price movements, trends, and potential future performance.
Stock Performance for January 23, 2025:
The stock "BPCL.NS" opened at 283.0, reached a high of 285.0, and a low of 270.30 before closing at 271.25. The percentage change is -2.29%, with a points change of -6.35 from its previous close of 277.60.

RSI Analysis:
The RSI value is 279.29, suggesting an overbought condition as the typical RSI range is between 0 and 100, and values above 70 are considered overbought. This could indicate a potential reversal or correction.
MACD Analysis:
The MACD is -4.26, while the Signal Line is -4.32. The small positive crossover indicates a minor bullish momentum, suggesting that the stock could be in line for a potential upward movement, albeit with caution due to the negative MACD.

Moving Averages Trend:
Currently, BPCL.NS is trading below its 50-EMA of 286.53 and the 20-EMA of 283.74, signaling a bearish trend. However, the stock is above the 200-EMA of 275.77, indicating a mixed trend in long-term momentum. The 10-EMA appearing incorrect implies short-term anomalies, possibly due to data issues.
Stock Performance for January 23, 2025: The stock HCLTECH.NS opened at INR 1817.05, reached a high of INR 1828.95, and closed at INR 1807.00 after hitting a low of INR 1804.20. This resulted in a points change of -20.70 and a percentage change of -1.13% from the previous close of INR 1827.70.

Relative Strength Index (RSI): The RSI value is 1861.23, which is unusually high and may indicate an overbought condition. Typically, RSI above 70 suggests overbought conditions. However, this RSI seems incorrect, needing reevaluation.
MACD Analysis: The MACD value of -28.38 compared to the signal line of -19.44 indicates a bearish crossover. This suggests a potential downtrend continuation, as the MACD is moving below the signal line.

Moving Averages: The 10-EMA is unexpectedly low at 38.88 compared to the 50-EMA of 1895.21, 20-EMA of 1883.93, and 200-EMA of 1833.94. The stock's current price is below these key moving averages, indicating a bearish trend. A consistent position below these averages suggests selling pressure may persist.
Stock Performance for January 23, 2025: The stock "KOTAKBANK.NS" opened at 1907.10 INR and closed at 1894.85 INR. It reached a high of 1923.95 INR and a low of 1892.10 INR. The stock experienced a percentage change of -1.18% and a points change of -22.65.

RSI Analysis: The RSI for KOTAKBANK.NS is at 1820.09, which is significantly above the typical scale of 0 to 100. This indicates an atypical data error or potentially a system miscalculation, as RSI commonly signals overbought conditions above 70 and oversold conditions below 30. Further analysis may be required.
MACD Analysis: The MACD value is 25.53 with a signal line of 11.52. Since the MACD is above the signal line, there may be a bullish momentum, indicating that it might be a favorable time for buying. However, investors should be cautious as the overall trend needs further confirmation.

Moving Averages: KOTAKBANK.NS is close to its 10-EMA of 61.45, and below the 20-EMA of 1802.43, the 50-EMA of 1794.83, and the 200-EMA of 1846.72. This indicates the stock is currently in a bearish trend, as it is trading below most of its key moving averages, suggesting a downward momentum.
Stock Performance (January 23, 2025): The stock "POWERGRID.NS" opened at 297.5, reached a high of 299.6, and a low of 293.6, closing at 294.35. It experienced a percentage change of -1.08% and a points change of -3.20.
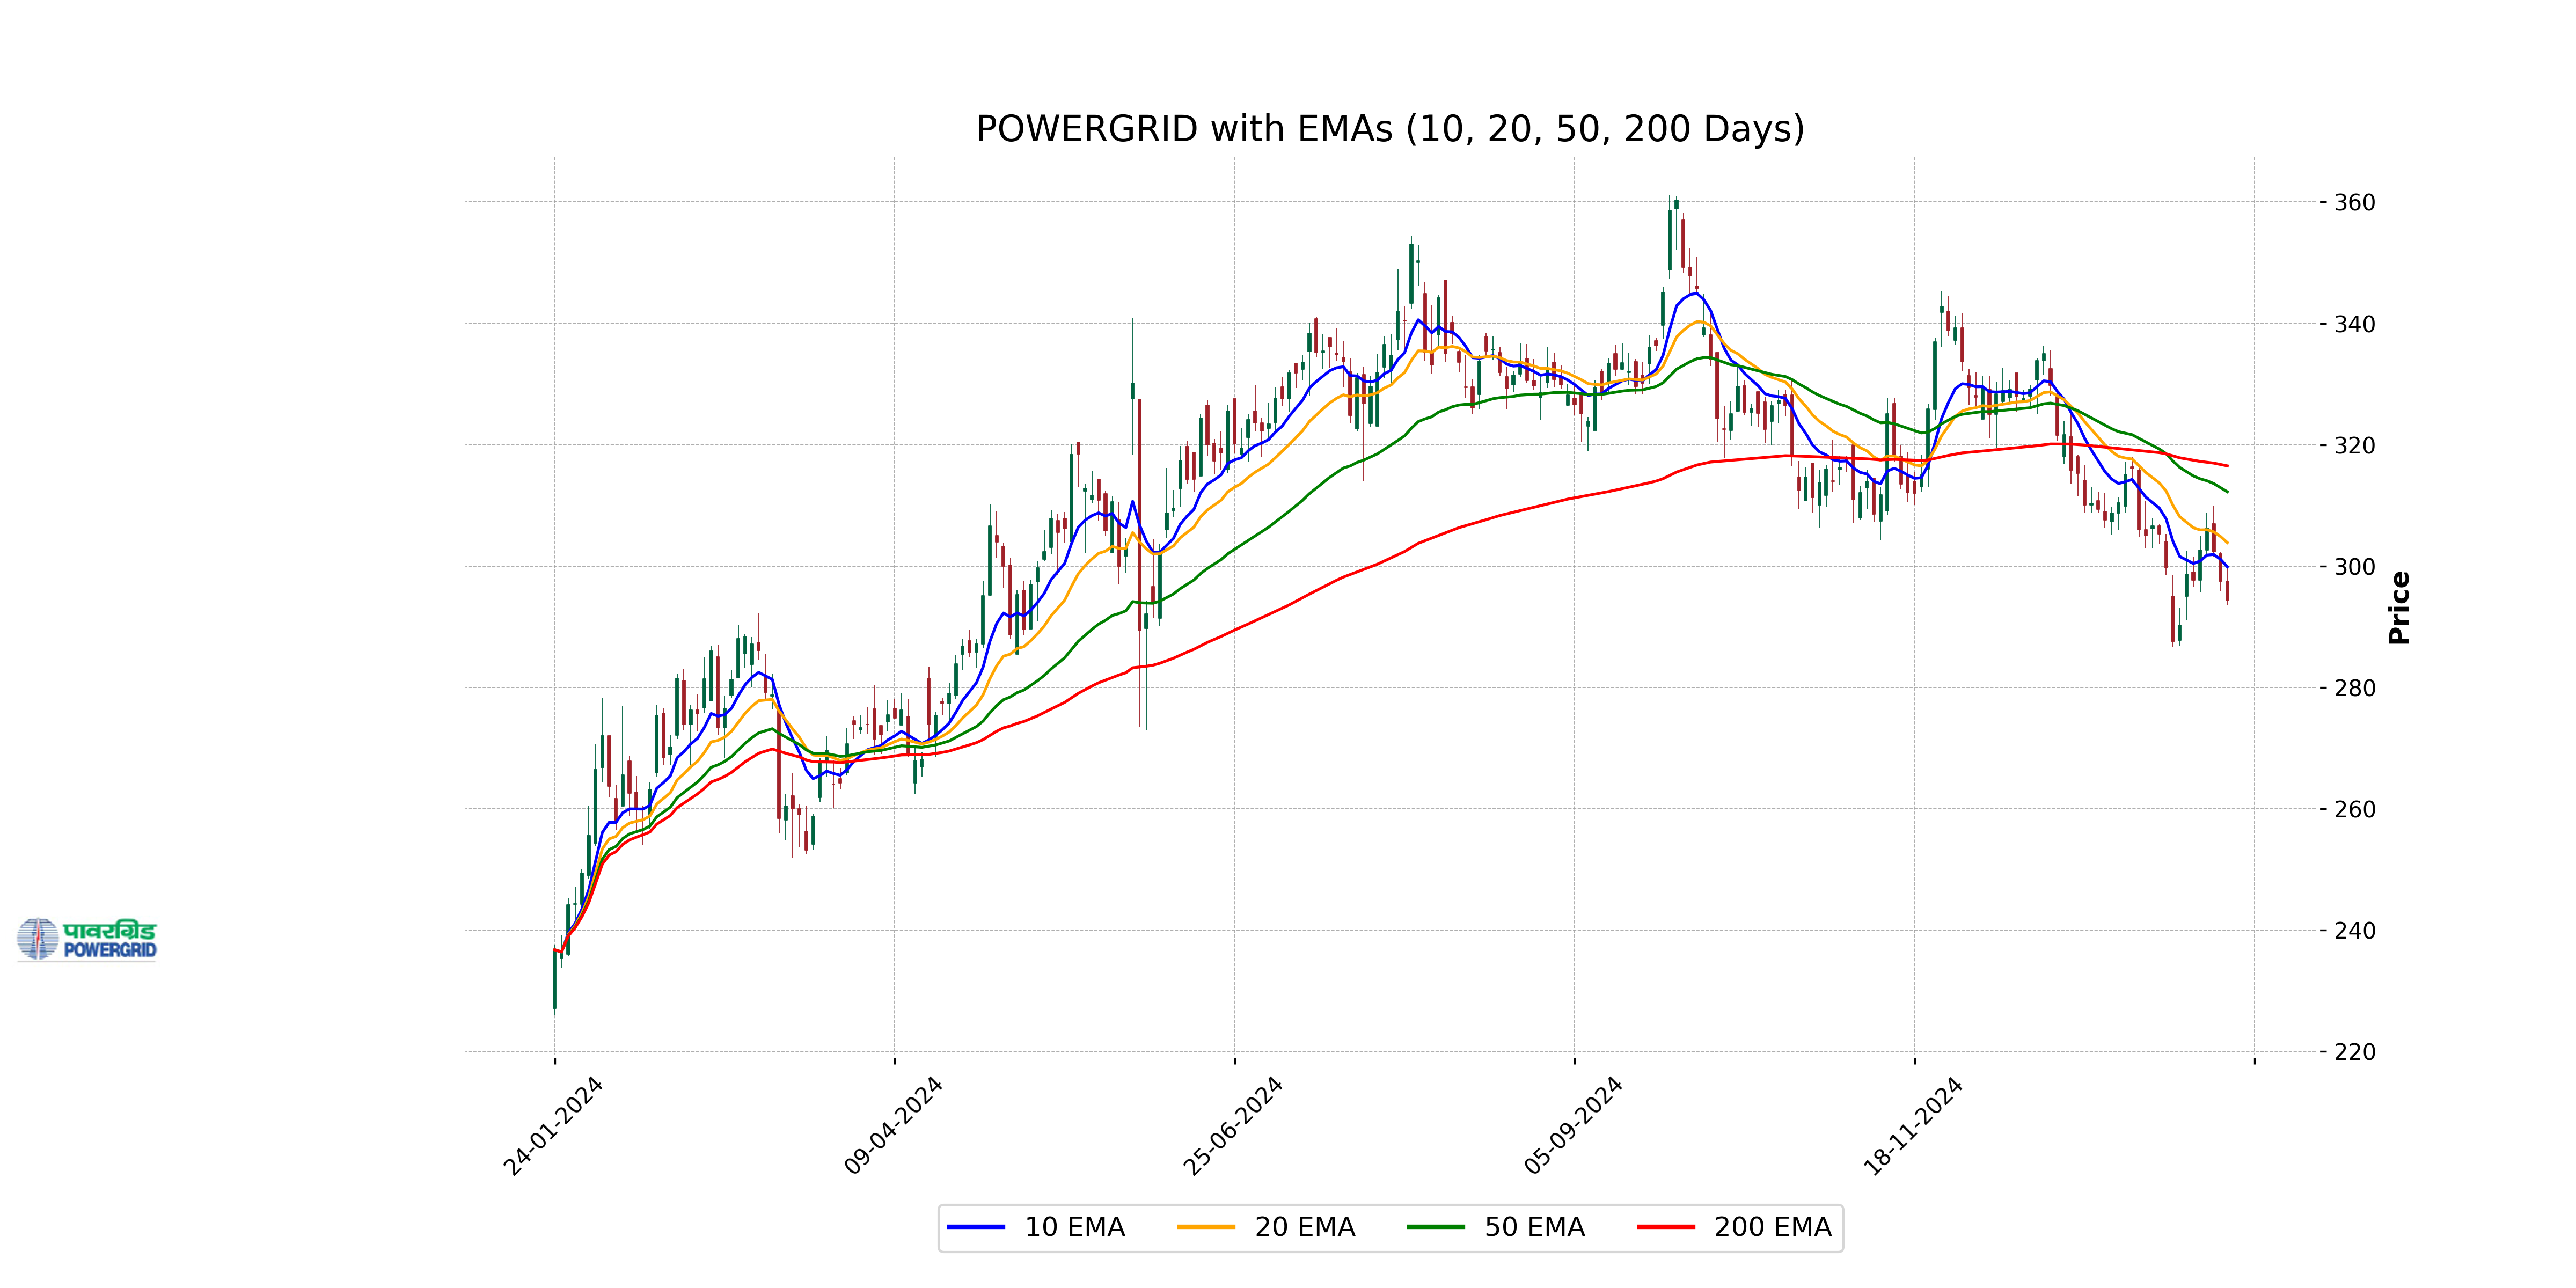
RSI (Relative Strength Index): With an RSI of 302.9992, the stock is significantly overbought. This typically suggests that the stock might be overvalued and could be due for a price correction.
MACD (Moving Average Convergence Divergence): The MACD value is -3.8877 with a signal line at -3.9716, indicating a pending crossover as the MACD is approaching the signal line. A crossover above the signal line could suggest bullish momentum, but currently, it's still in the bearish zone.

Moving Averages Analysis: The stock price is below its 50-EMA of 310.29 and 200-EMA of 299.85, indicating a bearish trend in the long term. It is significantly lower than the 10-EMA of 36.49 and the 20-EMA of 307.34, suggesting the stock is currently in a bearish phase with considerable downward momentum.
Stock Performance: On January 23, 2025, RELIANCE.NS opened at INR 1270.0, reached a high of INR 1277.35, and a low of INR 1261.60, closing at INR 1263.65. The stock experienced a percentage change of -1.05% and a points change of -13.45 from its previous close of INR 1277.10. 
RSI Analysis: The RSI for RELIANCE.NS is 1259.23, indicating an overbought condition and suggesting potential for a price pullback or consolidation in the stock's current movement.
MACD Analysis: The MACD is at 9.08, while the signal line is at 6.21. The presence of the MACD above the signal line suggests a bullish trend, though any recent crossover points should be monitored for potential trend reversals. 
Moving Averages: RELIANCE.NS is above its 50-EMA (1250.72) but close to the 200-EMA (1268.09), indicating a generally bullish momentum in the near term with some pressure resistance. However, the proximity to the 200-EMA warrants caution as it may act as resistance, counterbalancing the bullish pressure indicated by shorter-term moving averages.
Up Next
NSE Nifty 50: Top 5 stock losers of January 23, 2025

Honda Activa 6G: Everything You Need to Know Before Buying

How much does a ULIP plan really cost? A break-down of all charges

Centre plans to borrow Rs 8.20 lakh cr from market in first half of FY27

Reliance denies buying Iranian oil amid US sanctions waiver

Premium petrol price up Rs 2, industrial diesel up Rs 22; no change in normal petrol, diesel rates

More videos

India's GDP expected to register over 8 pc growth in Sep-Dec: Report

Govt announces seven measures to help boost exports

RBI keeps interest rates on hold after US trade deal boosts outlook

RBI proposes to compensate customers up to Rs 25,000 loss due to fraud

RBI raises GDP growth projection of Q1, Q2 of FY27

RBI pauses rate cuts, retains interest rate at 5.25 pc

Rupee jumps 122 paise to close at 90.27 against US dollar on India-US trade deal

Stock markets cheer India-US trade deal: Sensex, Nifty surge 2.5 pc

UPI transactions hit record high of Rs 230 lakh crore in 2025-26 till Dec: Govt

Explained: India-US trade deal, tariffs and trade benefits