


Highlights
- Bajaj Finance shows bullish momentum with strong RSI
- IndusInd Bank in oversold zone with bearish trend
- Shriram Finance near overbought levels with upward trend
Latest news

Nitin Gadkari reveals how he met Hamas chief Ismail Haniyeh hours before assassination in Tehran

BNP acting chairman Tarique Rahman returns to Dhaka after 17 years in exile

India revamps tax regime in 2025, new I-T Act to take effect from April 1

BNP's acting chief Tarique Rahman set to return to Bangladesh after 17-year exile

Navi Mumbai International Airport starts commercial flight operations

PM Modi attends Christmas service at Delhi church, greets citizens

Gujarat AAP MLA Chaitar Vasava refutes Rs 75 lakh extortion claims by BJP MP

AAP MLA Gopal Italia alleges bullying, extortion at Visavadar groundnut centre
NSE Nifty 50: Top 5 stock losers of March 20, 2025


In this article, we will explore the technical indicators of some of the low-performing stocks on the Indian stock market, including BAJFINANCE, INDUSINDBK, SHRIRAMFIN, and TRENT.
By looking at these stocks through the lens of key technical factors, we aim to better understand their price movements, trends, and potential future performance.

Analysis for Bajaj Finance - March 20, 2025

Bajaj Finance experienced a minor decline, with the stock closing at 8679.65, down by 0.59% from the previous close. The stock has a healthy RSI of 62.05, indicating strong momentum, and a significant market cap of over 5 trillion INR, reflecting its robust position in the financial services sector.
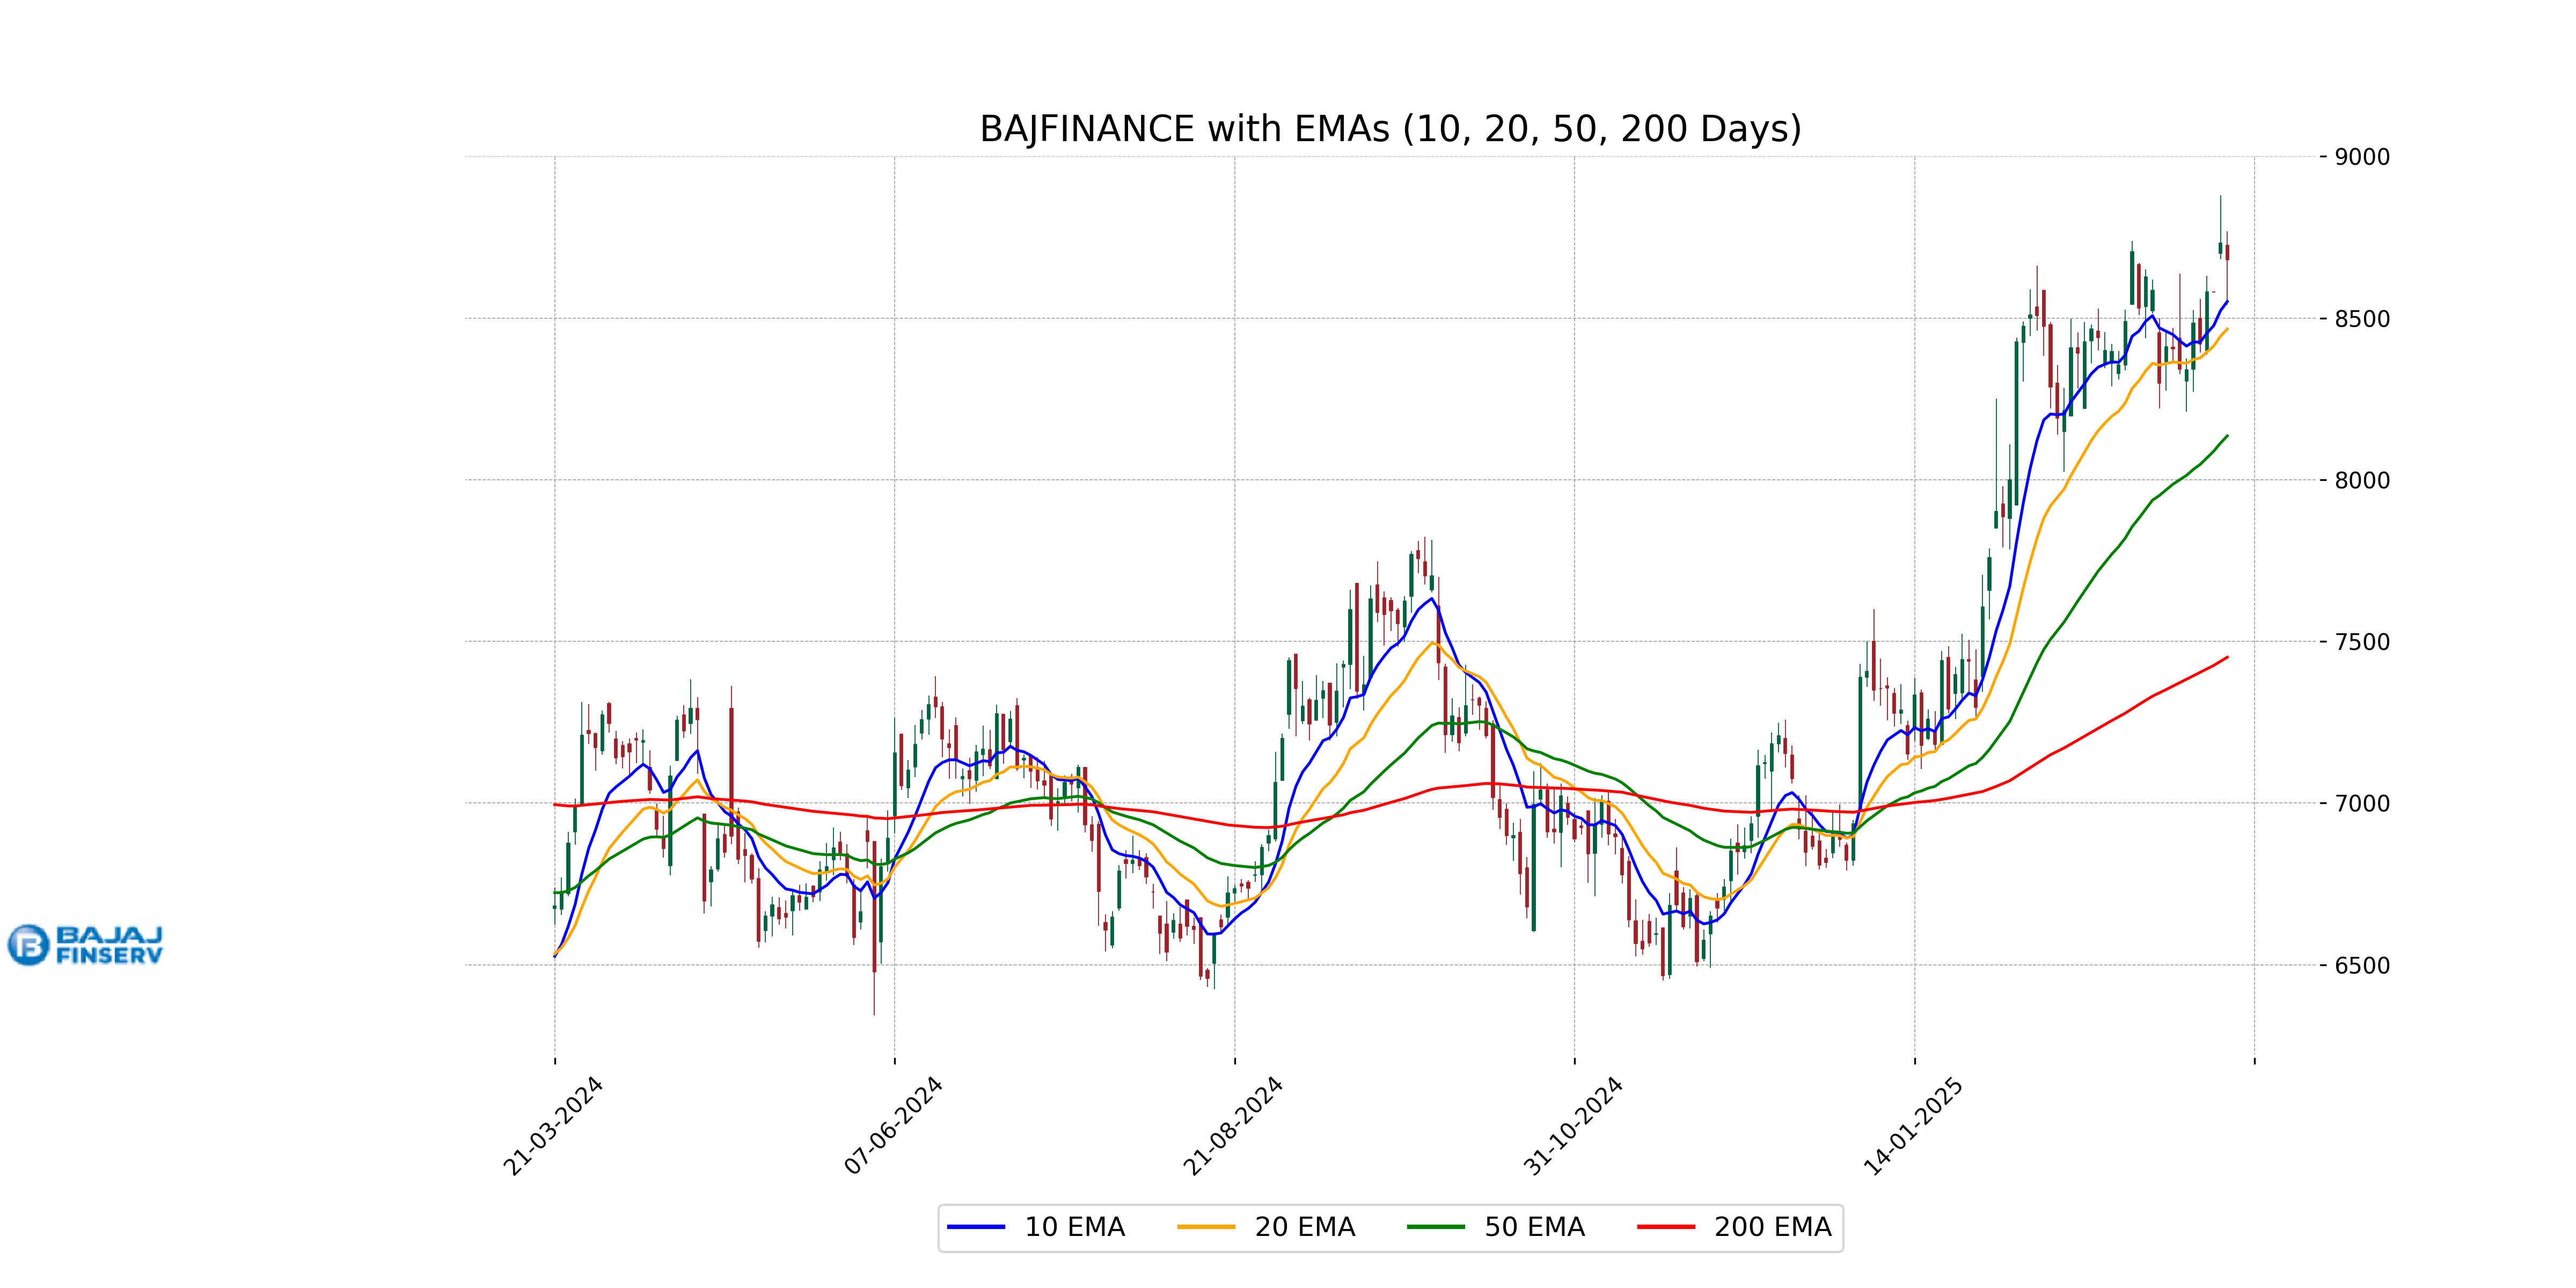
Relationship with Key Moving Averages
Bajaj Finance is trading above its 50-day EMA (8135.63), indicating short-term bullish momentum, and also above its 200-day EMA (7450.96), suggesting long-term strength. However, its current price of 8679.65 is above the 10-day EMA (8551.42) but below the recent high, implying cautious short-term sentiment.
Moving Averages Trend (MACD)
Bajaj Finance's MACD line is at 130.81, which is below the MACD Signal line at 134.97. This indicates a bearish momentum in the stock's price trend as the MACD is making a crossover below the signal line. Traders may consider this as a potential signal for a continued downward trend in the stock price.

RSI Analysis
Bajaj Finance's RSI (Relative Strength Index) is at 62.05, which indicates that the stock is in a mildly overbought condition. An RSI above 70 is typically considered overbought, while below 30 is oversold. At 62.05, the stock is approaching overbought levels but is not yet considered to be in the overbought territory.

Analysis for IndusInd Bank - March 20, 2025

IndusInd Bank's recent performance shows a slight decline, with the stock closing at 684.10, down by 1.24% compared to the previous close of 692.70. The 50 and 200-day EMA are significantly higher than the current price, indicating a bearish trend. The RSI of 21.84 suggests the stock is in the oversold territory. IndusInd Bank operates in the Financial Services sector within the Banks - Regional industry in India.

Relationship with Key Moving Averages
The current closing price of IndusInd Bank is significantly below its key moving averages, with the 50-day EMA at 927.01, the 20-day EMA at 835.21, and the 10-day EMA at 752.38. This indicates a bearish trend as the stock price is trading lower than all key EMAs, suggesting downward momentum.
Moving Averages Trend (MACD)
IndusInd Bank's MACD value of -91.44 indicates a bearish trend, as it is below its signal line of -64.44. This suggests a potential downward momentum, aligning with the bank’s other technical indicators like a low RSI of 21.84, which points to oversold conditions.

RSI Analysis
IndusInd Bank RSI Analysis: The RSI (Relative Strength Index) for IndusInd Bank is 21.84, which is well below 30. This indicates that the stock is currently in the oversold territory and could potentially be undervalued. RSI levels below 30 could suggest a possible buying opportunity if other technical indicators align.

Analysis for Shriram Finance - March 20, 2025

Shriram Finance showed a slight decline with a close at 667.90, a marginal decrease of -0.007% from the previous close. The stock remained above its 50 EMA and 200 EMA, signaling a positive short to mid-term trend, while high RSI implies potential overbought conditions. Its market cap stands at 1.25 trillion INR, and it operates in the financial services sector within the credit services industry in India.

Relationship with Key Moving Averages
Shriram Finance's current closing price of 667.90 is above the 50-day EMA of 595.28 and the 200-day EMA of 565.95, indicating a positive trend. The 10-day EMA of 637.75 and the 20-day EMA of 619.75 further reinforce the stock's bullish momentum.
Moving Averages Trend (MACD)
The MACD for Shriram Finance is 22.27, which is above the MACD Signal of 19.69. This indicates a bullish signal, suggesting that the stock may continue its upward trend. Additionally, with an RSI of 70.44, the stock is close to being overbought.

RSI Analysis
The RSI (Relative Strength Index) of Shriram Finance is currently at 70.44, indicating that the stock is nearing overbought levels. Typically, an RSI above 70 suggests that the stock might be overvalued, and a reversal or pullback could occur soon. However, further analysis and confirmation from other indicators are advisable.

Analysis for Trent - March 20, 2025

Trent Performance Trent Limited, operating in the Apparel Retail industry within the Consumer Cyclical sector, experienced a slight decline in its recent stock price performance. The stock closed at 5221.55, a marginal decrease of 0.18% from its previous close, despite a high trading volume of 759,416 shares. The company's RSI of 51.38 suggests a balanced momentum, while a MACD of -78.53 indicates potential bearish sentiment in the short term. With a market cap of 1.86 trillion INR, Trent maintains a strong position, albeit with a high PE Ratio of 95.98.

Relationship with Key Moving Averages
The stock price of Trent, with a current close of 5221.55, is below its 50 EMA of 5475.47 and well below its 200 EMA of 5784.44, indicating potential resistance and a bearish trend in the longer term. However, the stock is trading above its 10 EMA of 5108.93 and 20 EMA of 5124.63, suggesting a short-term bullish sentiment.
Moving Averages Trend (MACD)
MACD Analysis for Trent: The MACD for Trent is -78.53, while the MACD Signal is -147.92. This indicates that Trent's stock is in a bearish trend, as the MACD line is above the MACD Signal line but still in the negative territory.

RSI Analysis
*RSI Analysis:* The RSI of 51.38 for Trent indicates that the stock is in a neutral zone. It is neither overbought nor oversold at the moment, suggesting limited momentum in either direction.

Up Next
NSE Nifty 50: Top 5 stock losers of March 20, 2025

New Zealand commits USD 20 bn investment in India under FTA in 15 yrs; on lines of EFTA pact

India, New Zealand conclude FTA talks; pact to offer duty-free access, USD 20 bn FDI

FTA with New Zealand to significantly deepen bilateral economic engagement: Govt

Rupee breaches 91-mark against US dollar for first time in intra-day trade

Microsoft commits USD 17.5 billion investment in India: CEO Satya Nadella

More videos

CBI books Anil Ambani's son, Reliance Home Finance Ltd. in Rs 228 crore bank fraud case

RBI raises FY26 GDP growth projection to 7.3 pc

RBI trims policy interest rate by 25bps to 5.25pc, loans to get cheaper

Rupee slumps to all-time low of 90.25 against US dollar in intra-day trade

Reliance completes merger of Star Television Productions with Jiostar

India to lead emerging market growth with 7pc GDP rise in 2025: Moody’s

Nifty hits record high after 14 months; Sensex nears all-time peak

Reliance stops Russian oil use at its only-for-export refinery to comply with EU sanctions

ED attaches fresh assets worth over Rs 1,400 cr in case against Anil Ambani's Reliance Group

India signs one-year deal to import 2.2 million tonnes of LPG from US