


Highlights
- Axis Bank RSI at 20.63, deeply oversold
- TCS trades below all key EMAs
- Titan MACD and RSI confirm weak momentum
Latest news

Samsung Galaxy M17 5G Review: Best Budget Samsung Phone Under ₹15,000?

OnePlus 15R first look: OnePlus changes the R-series playbook

India's retail inflation rises to 0.71% in November

Cabinet approves CoalSETU window for auction of coal to boost industrial use and export

Cabinet approves Minimum Support Price for Copra for 2026 season

Fire never left: Vinesh Phogat comes out of retirement, targets LA Olympics

Flexible office segment in India set to grow faster, over 25% annually by 2027: Report

Rahul Gandhi flags issue of air pollution, seeks discussion in Lok Sabha
NSE Nifty 50: Top 5 stock losers of July 29, 2025


In this article, we will explore the technical indicators of some of the low-performing stocks on the Indian stock market, including AXISBANK, HDFCLIFE, SBILIFE, TCS, and TITAN.
By looking at these stocks through the lens of key technical factors, we aim to better understand their price movements, trends, and potential future performance.

Analysis for Axis Bank - July 29, 2025
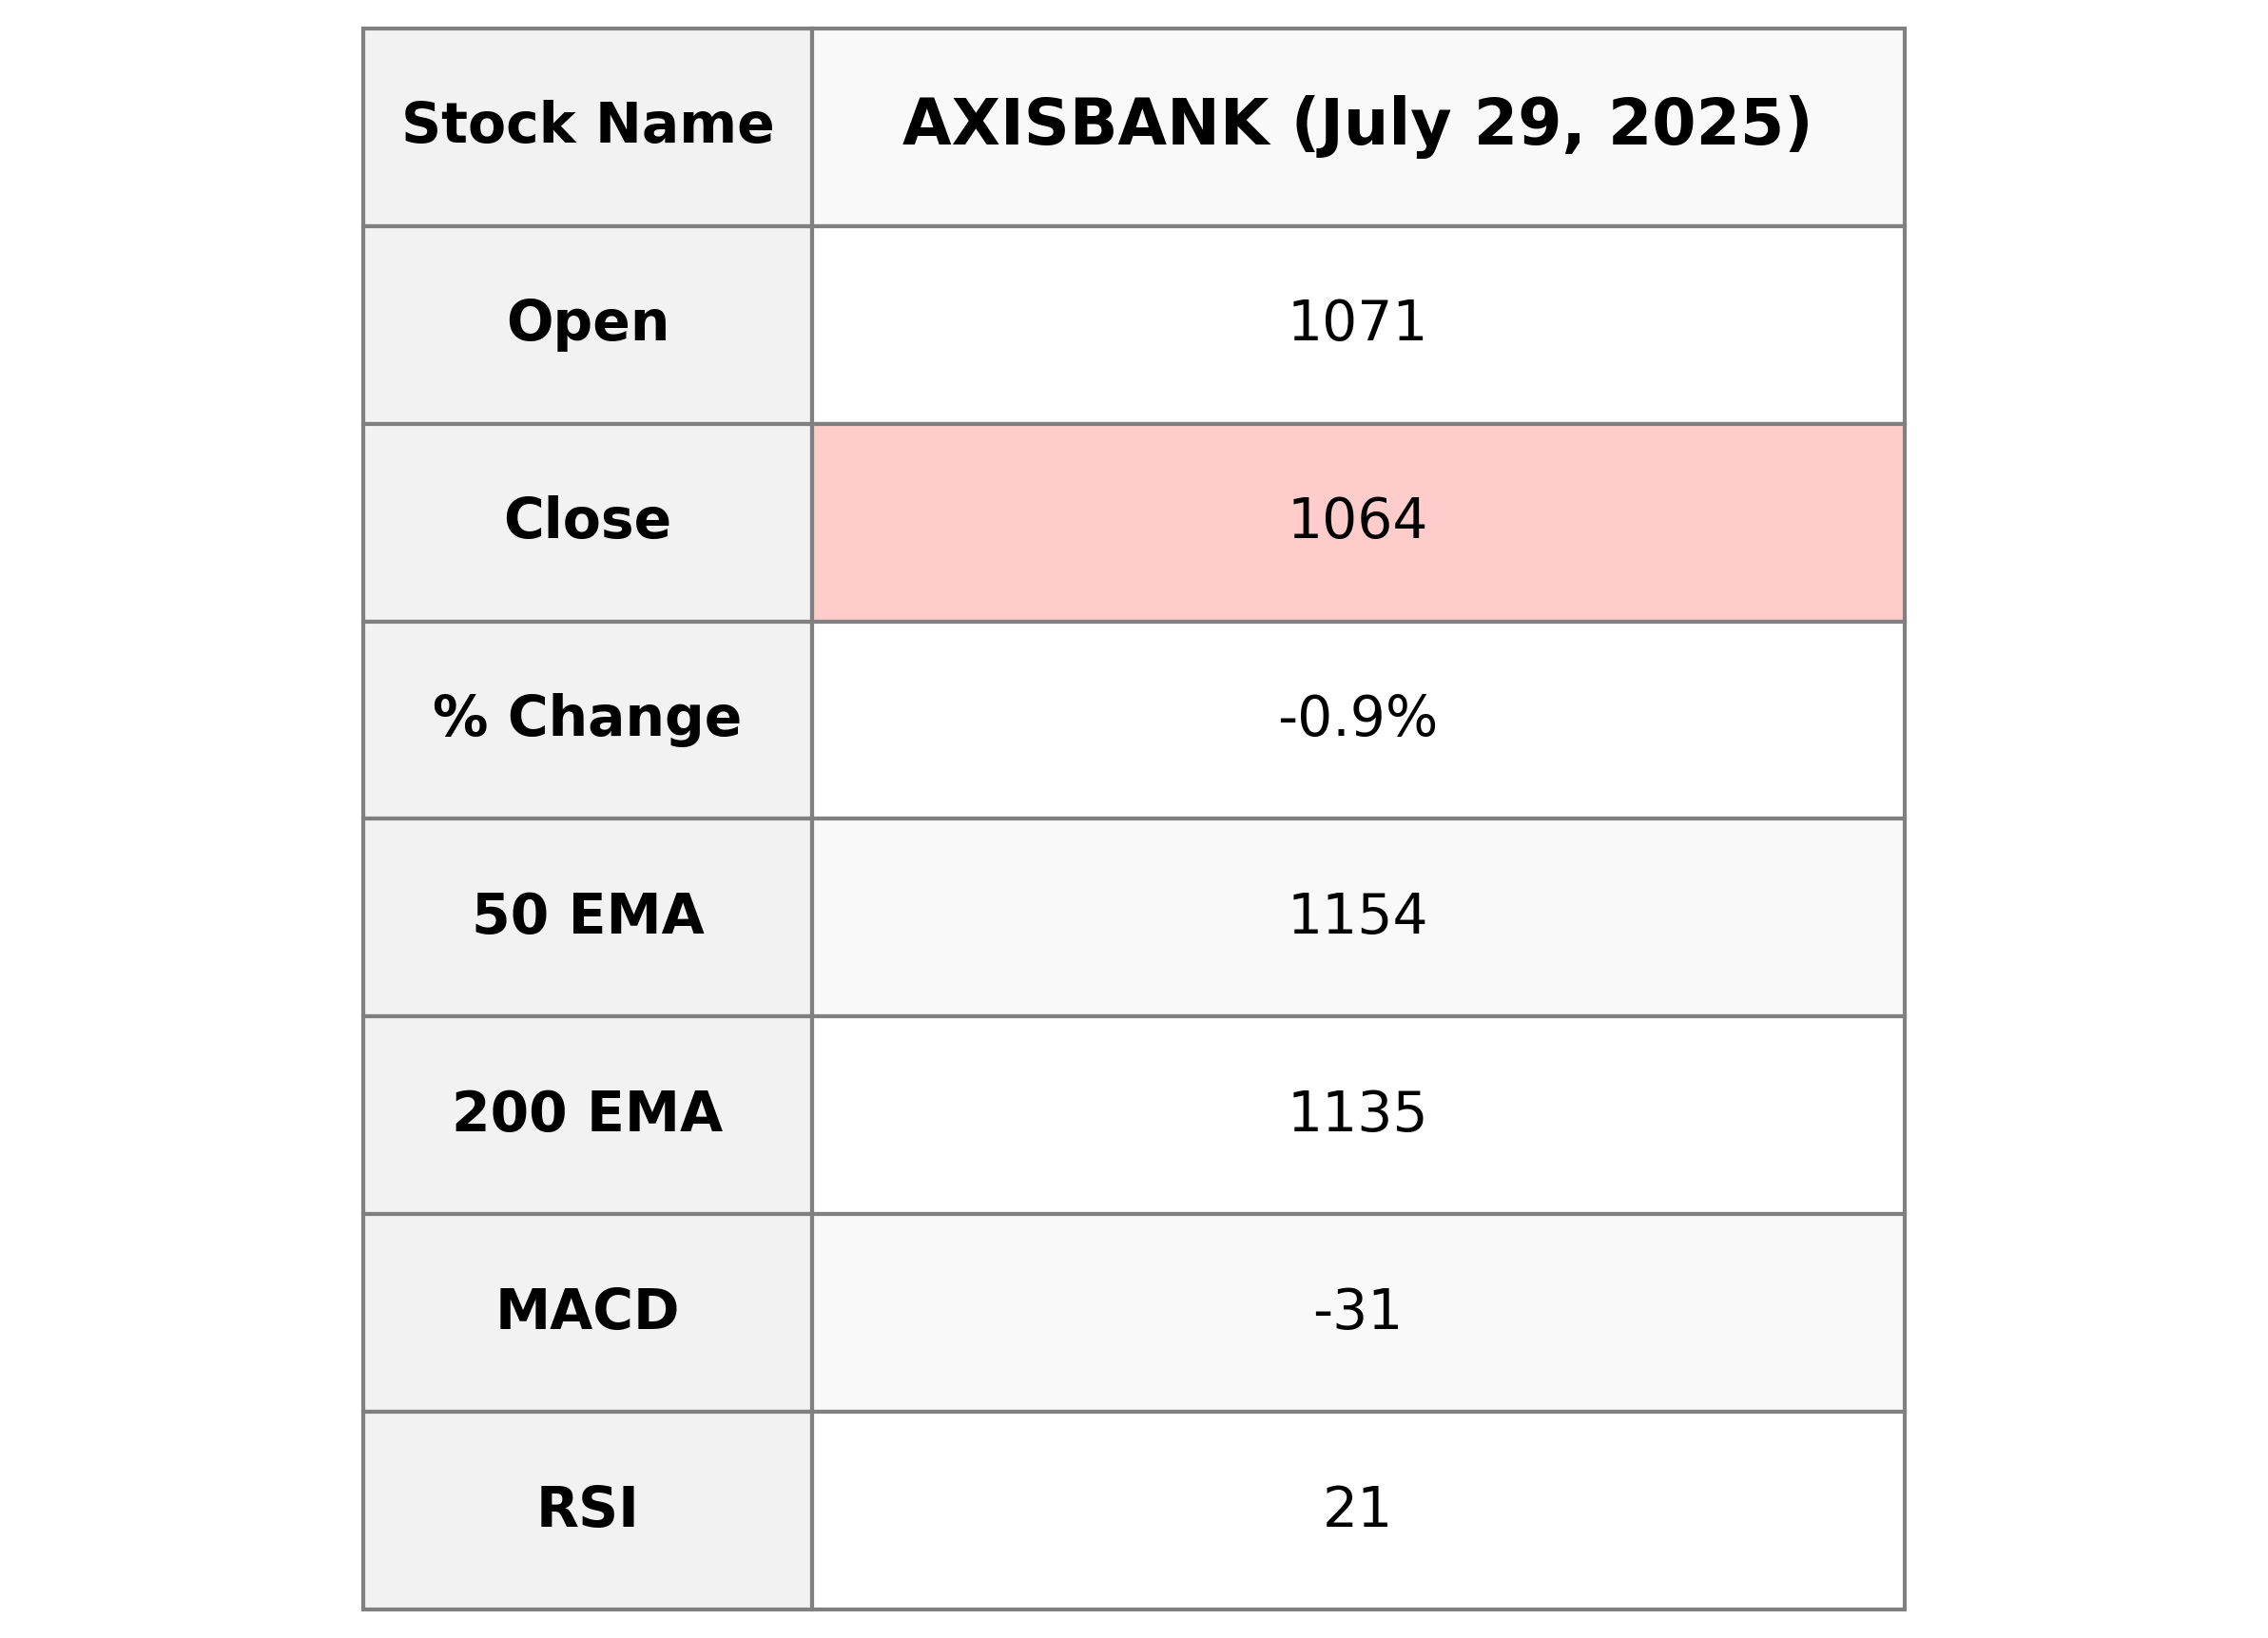
Axis Bank had a closing price of 1064.20, which represents a decrease of approximately 0.88% from the previous close of 1073.60. The day's trading saw a high of 1078.70 and a low of 1055.40, with a trading volume of over 15.5 million shares. The bank is in the Financial Services sector, specifically within the Banks - Regional industry in India.
Relationship with Key Moving Averages
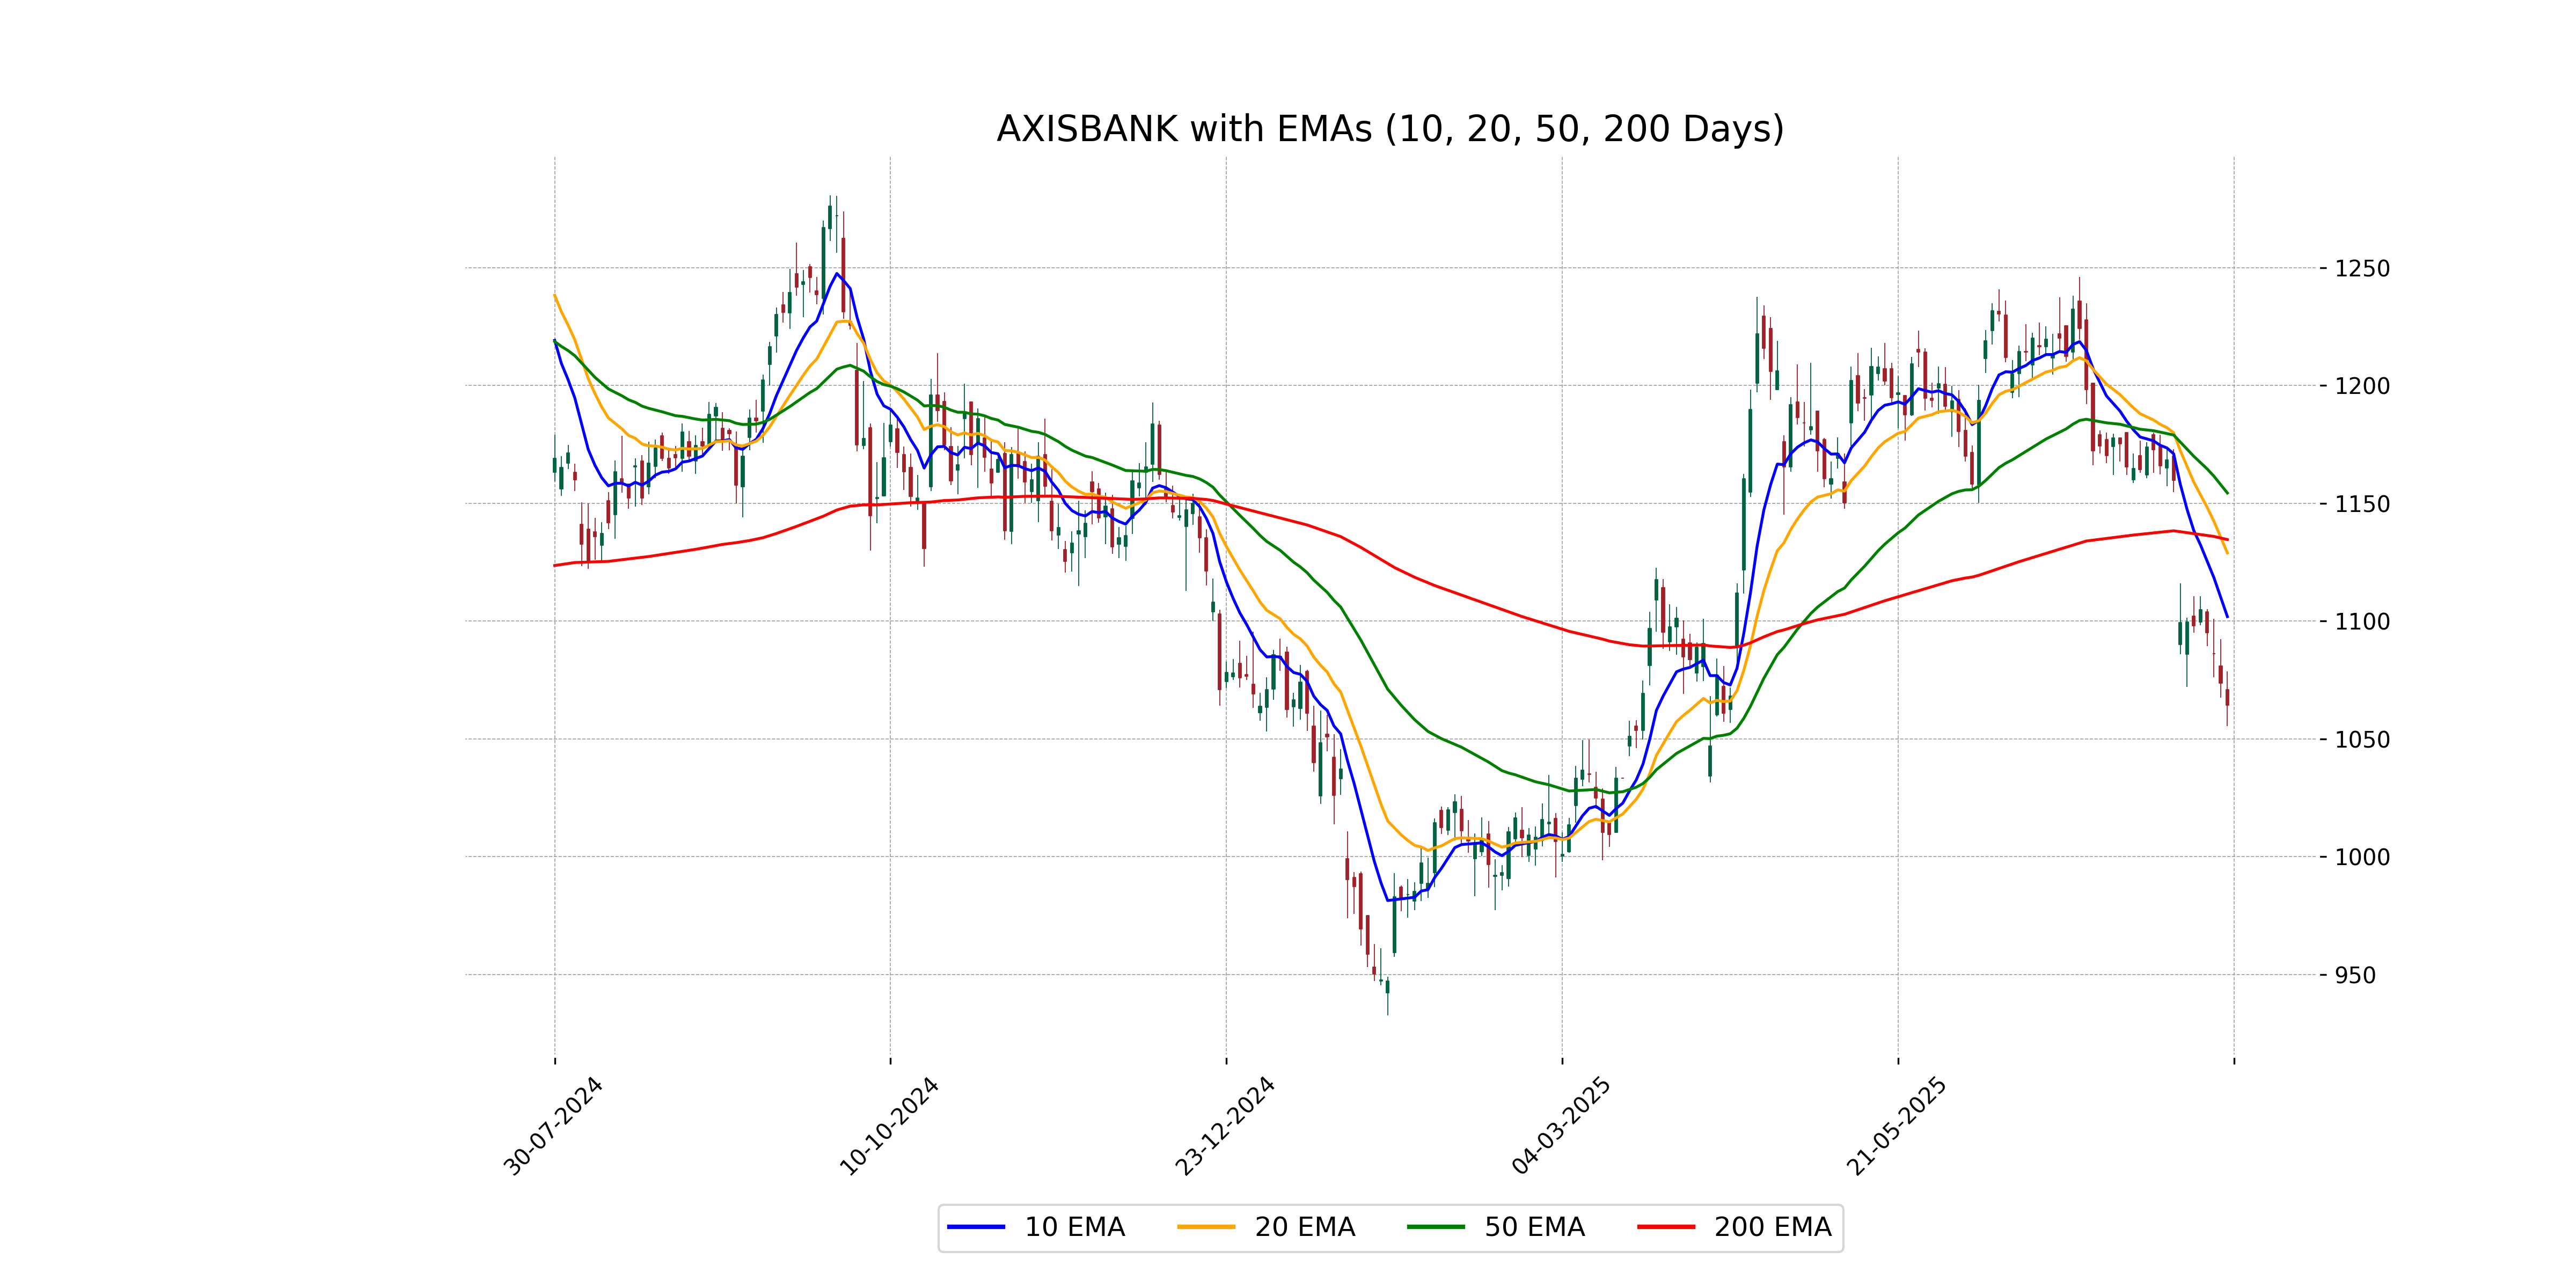
Axis Bank is currently trading below its key moving averages, with its closing price of 1064.20 falling below the 10-day EMA of 1101.84, 20-day EMA of 1128.90, 50-day EMA of 1154.30, and 200-day EMA of 1134.55. This indicates a potential bearish trend as the price is not only below the short-term averages but also below the longer-term averages.
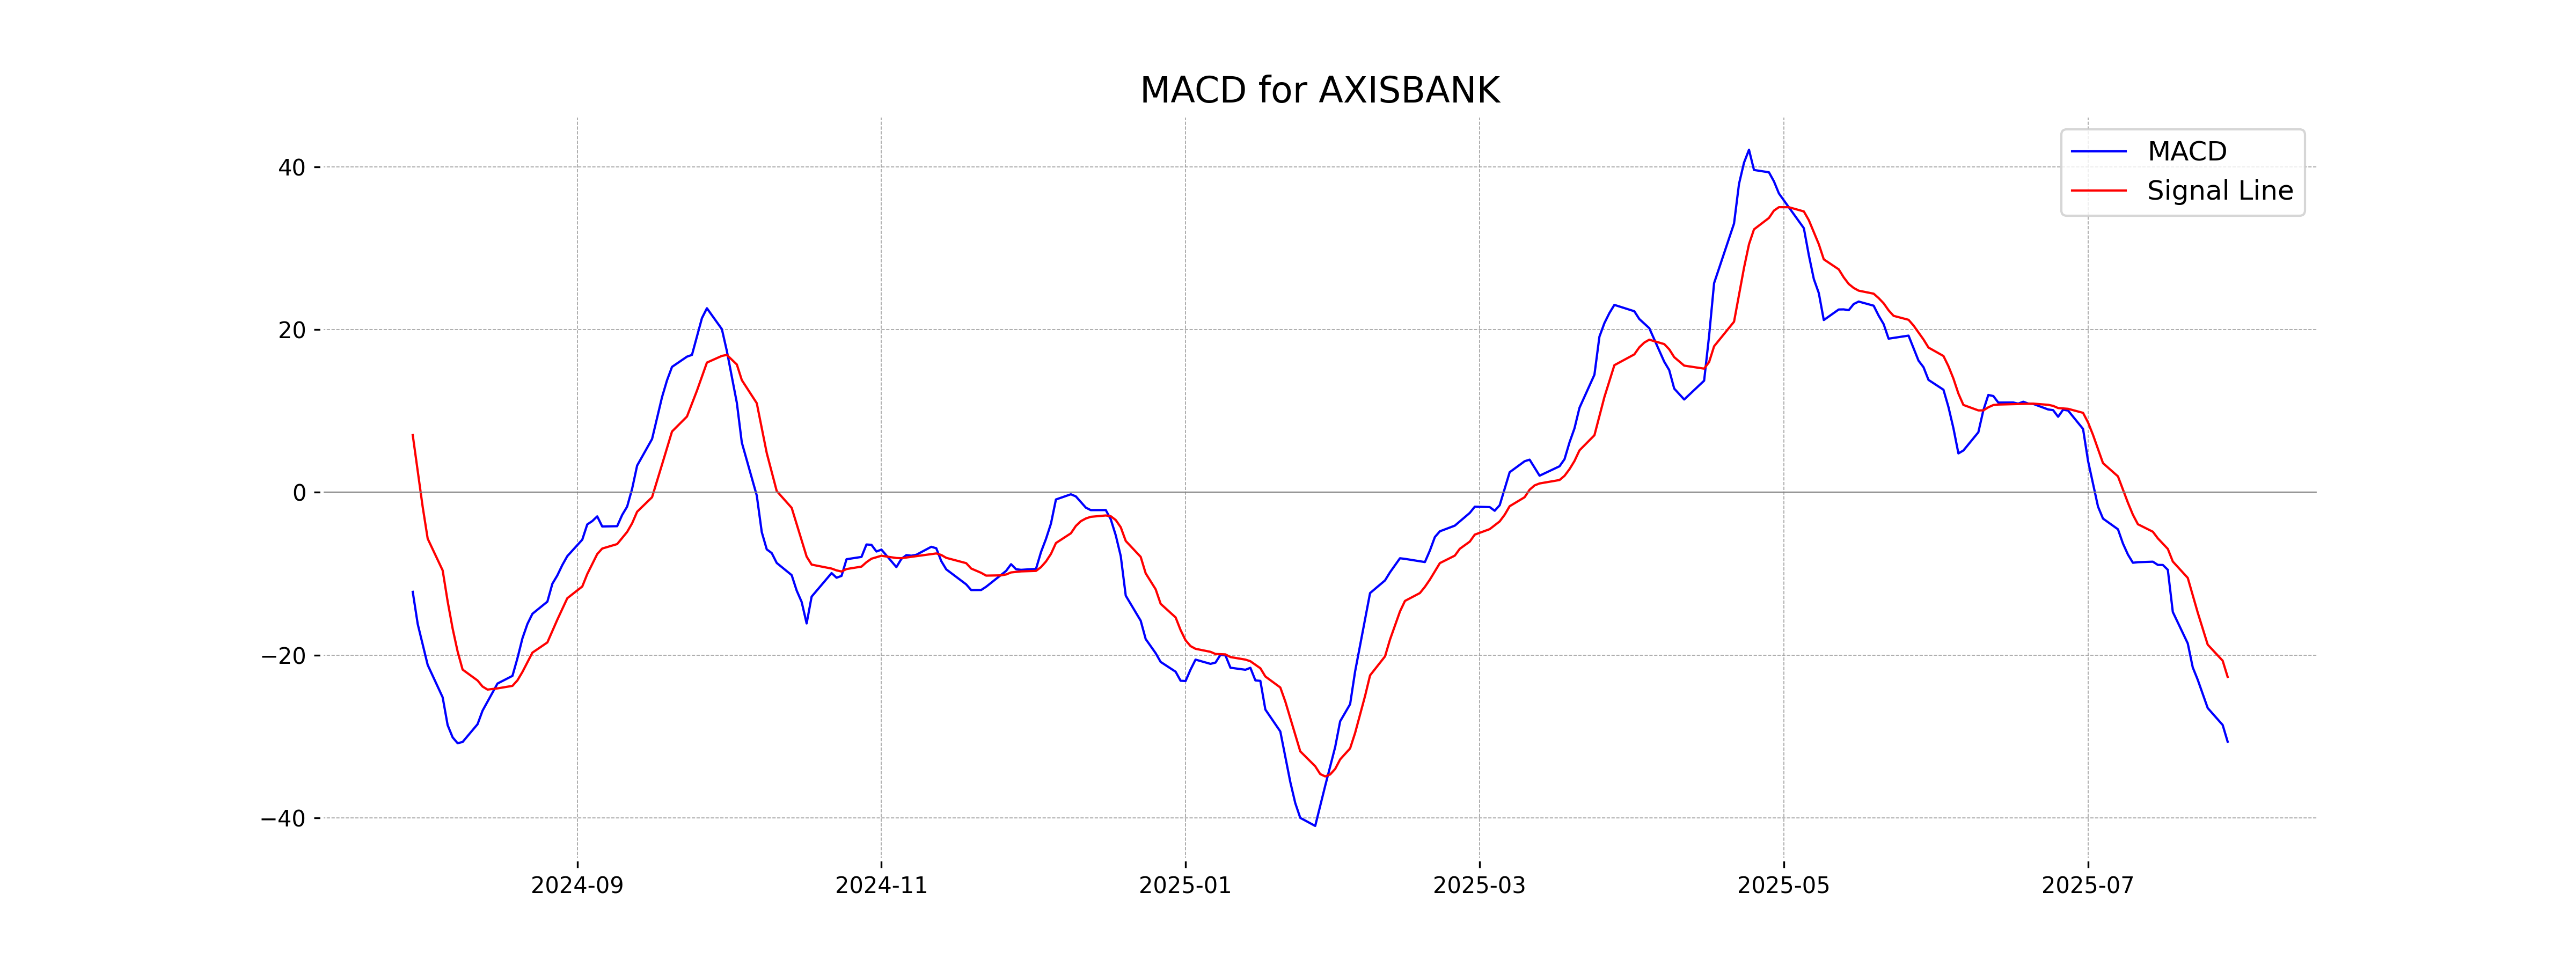
Moving Averages Trend (MACD)
Axis Bank's MACD is currently at -30.65, which is below the MACD Signal line of -22.69. This negative MACD value suggests a bearish momentum, indicating that the stock might continue to face selling pressure in the short term.
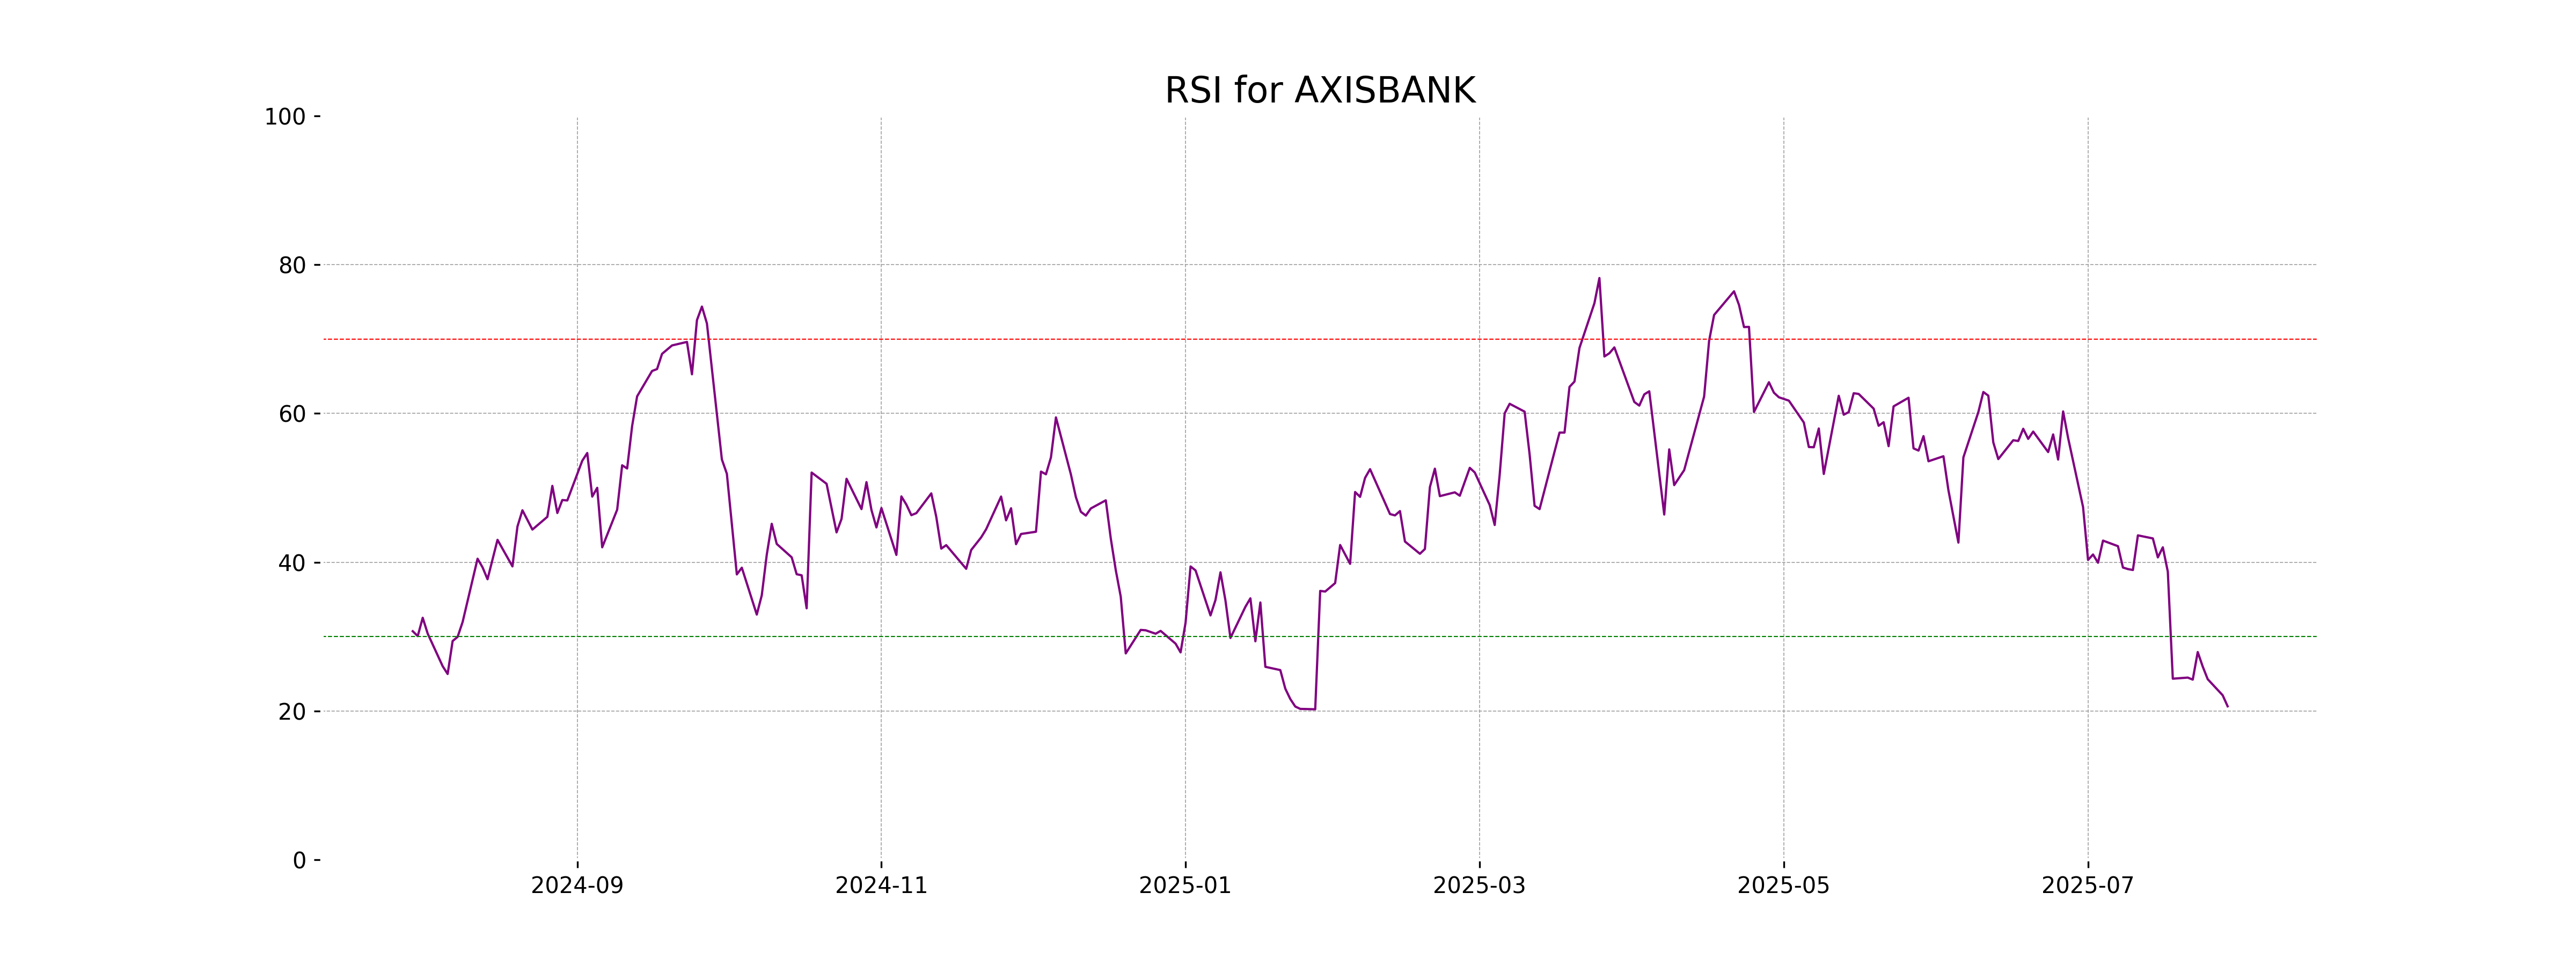
RSI Analysis
Axis Bank's RSI (Relative Strength Index) is at 20.63, indicating that the stock is in the oversold territory. This suggests a potential buying opportunity, as it may indicate that the stock has been under significant selling pressure.
Analysis for HDFC LIFE - July 29, 2025
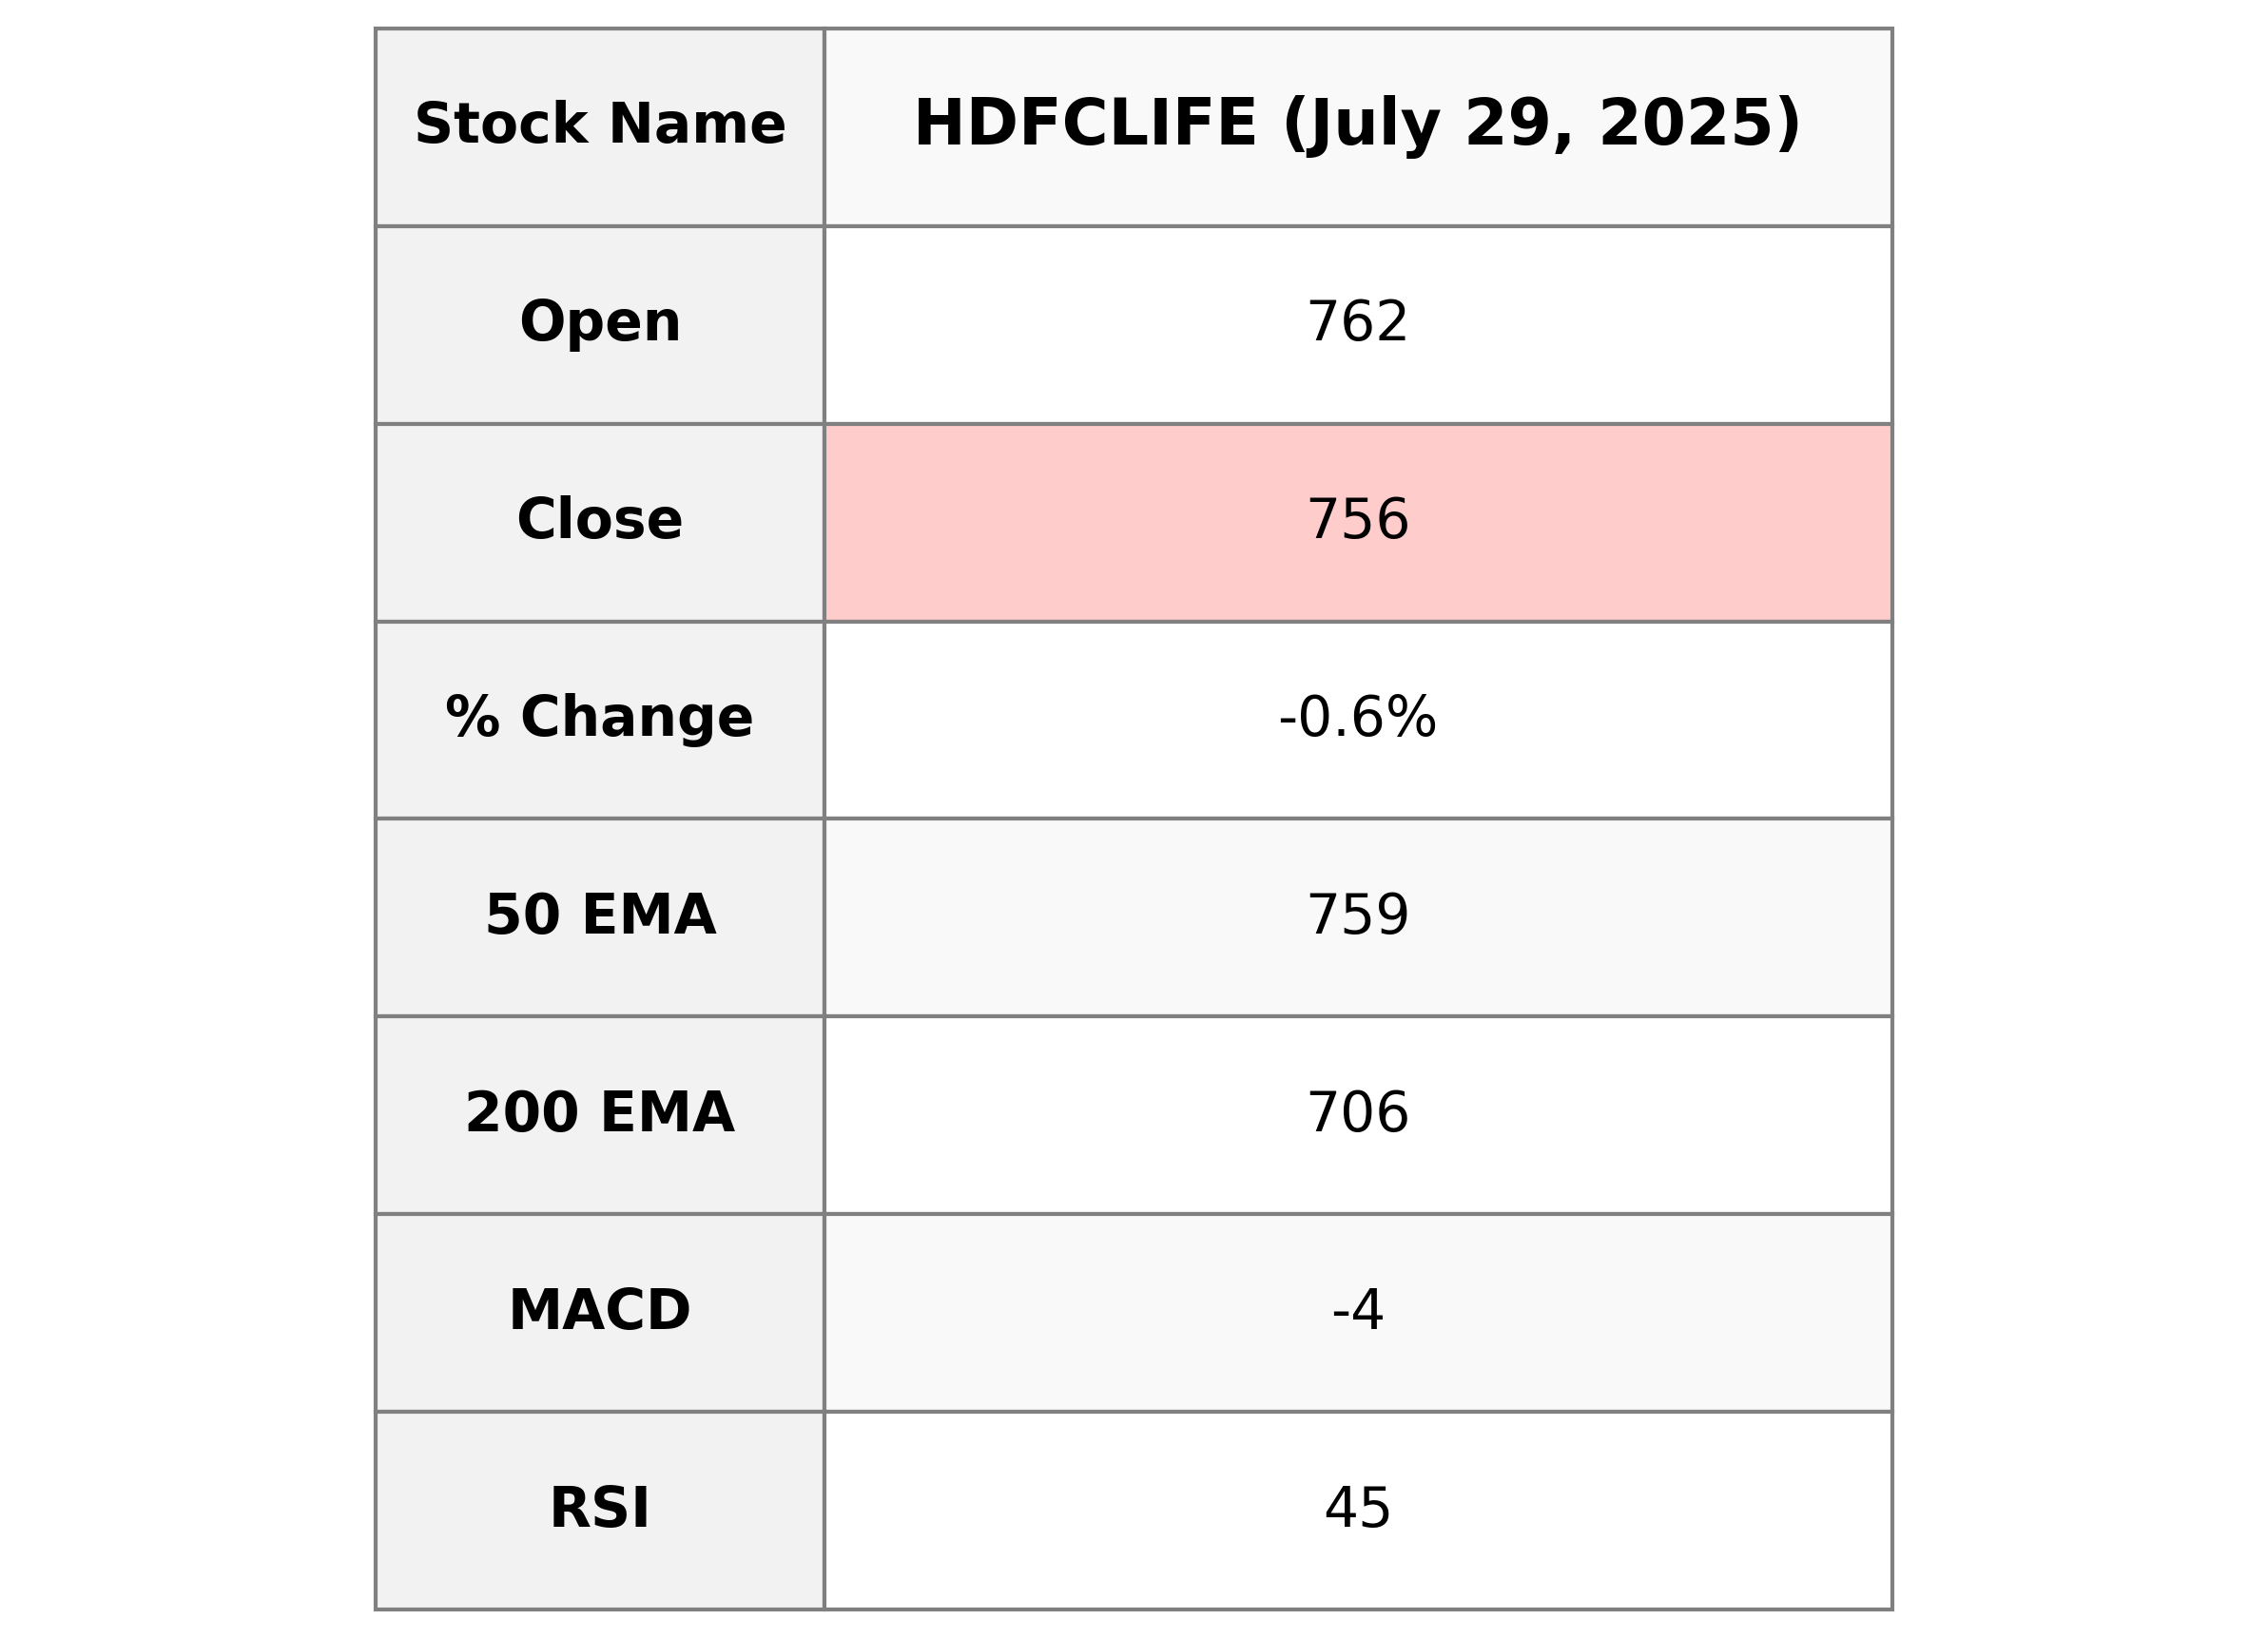
HDFC LIFE exhibited a slight decline in its stock performance, with a close price of 756.35 INR, down from the previous close of 761.20 INR, resulting in a percentage change of -0.64%. The stock's trading volume was 1,129,225 shares, and it remained below key EMAs, with a relatively low RSI of 44.83 indicating weaker momentum. The PE ratio stands at 86.44, reflecting its valuation in the financial services sector in India, particularly within the life insurance industry.
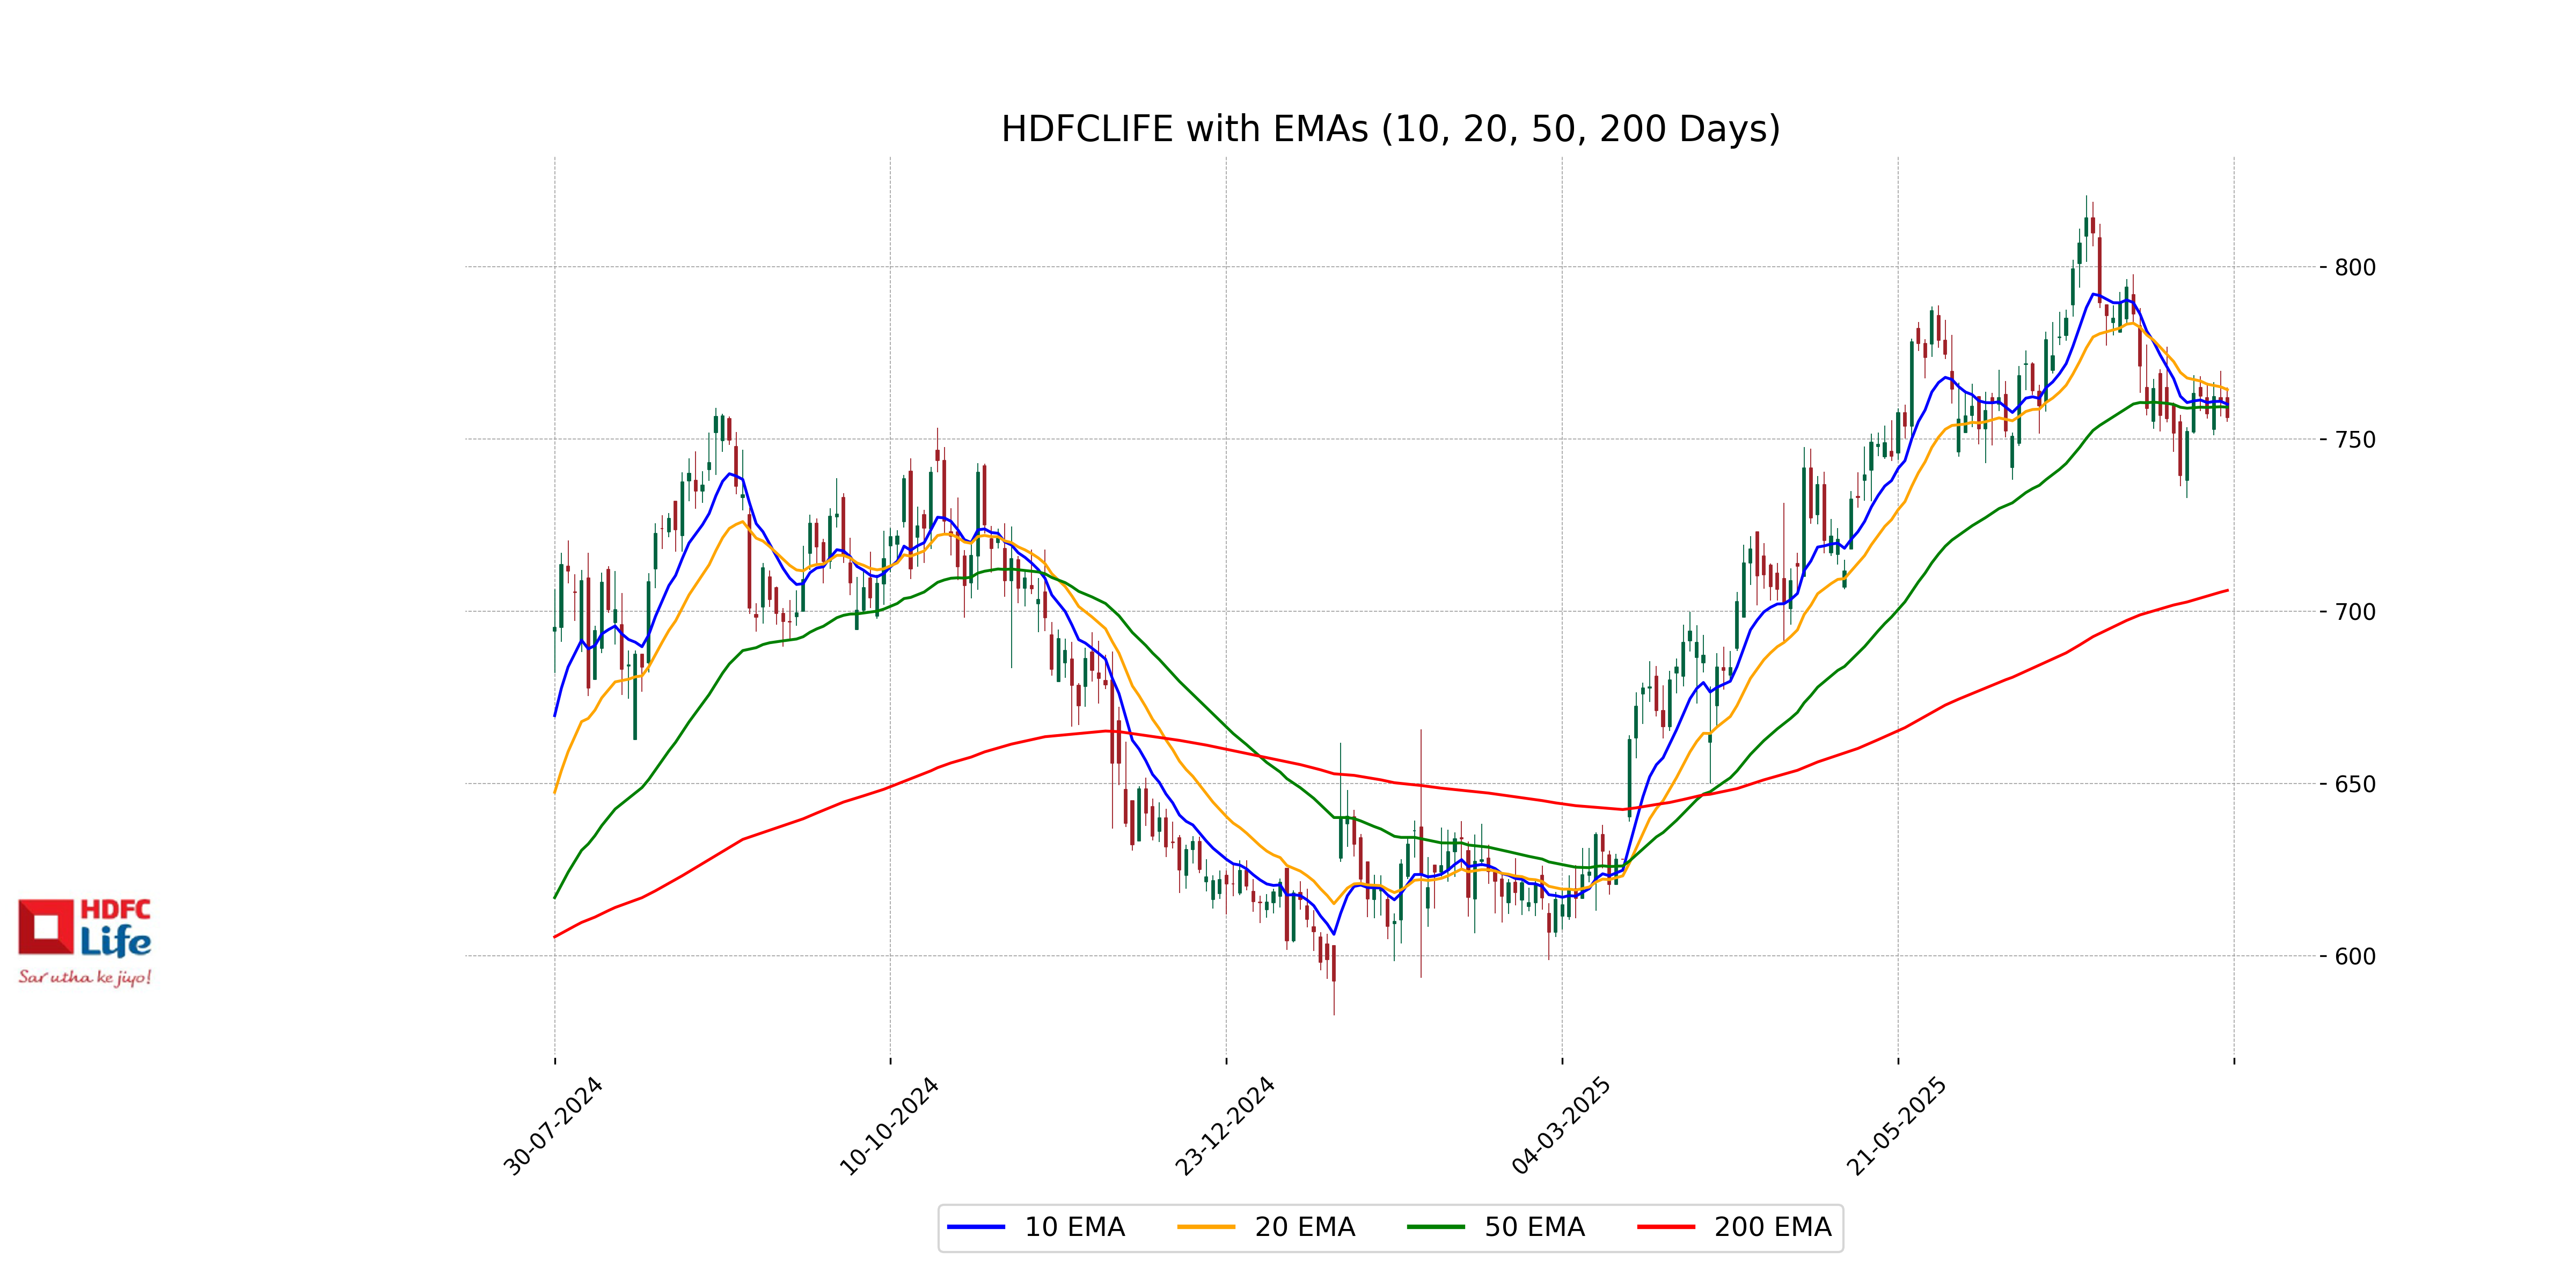
Relationship with Key Moving Averages
For HDFC Life, the closing price of 756.35 is below its 10-day EMA of 760.14, indicating a short-term bearish trend. It is also below the 50-day EMA of 759.29 but above the 200-day EMA of 706.07, suggesting medium-term weakness but long-term strength.
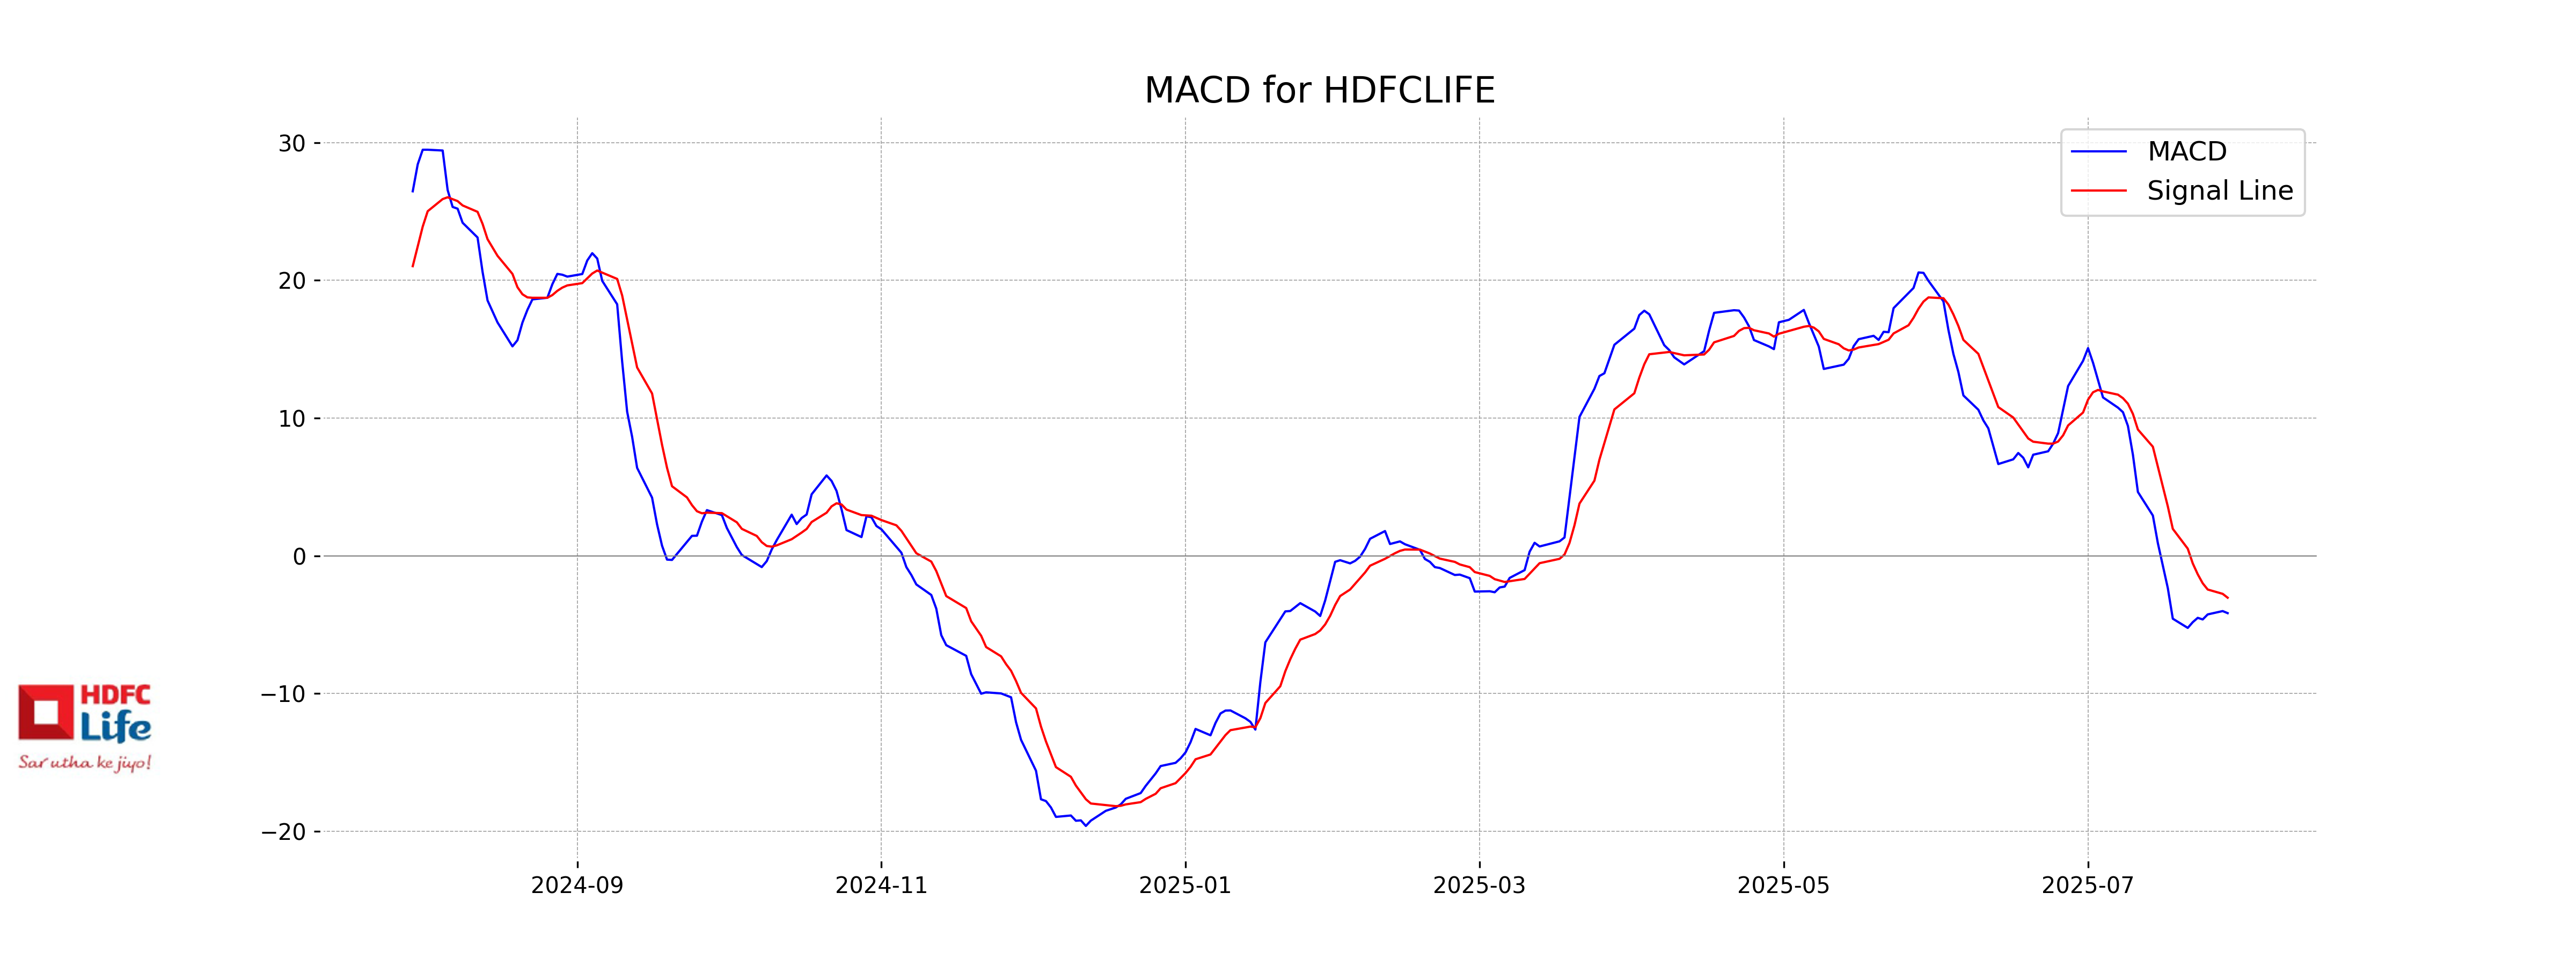
Moving Averages Trend (MACD)
MACD Analysis for HDFC Life: The MACD value for HDFC Life is -4.17, which is below the MACD Signal of -3.05. This suggests that the stock is currently in a bearish phase, as the MACD line is below the signal line, indicating potential downward momentum.
RSI Analysis
The Relative Strength Index (RSI) for HDFC Life is currently 44.83, which is below the neutral mark of 50. This suggests that the stock is in a slight bearish phase and may not be overbought or oversold. Investors could consider this a signal for potential consolidation or slight bearish sentiment in the market.

Analysis for SBI Life - July 29, 2025
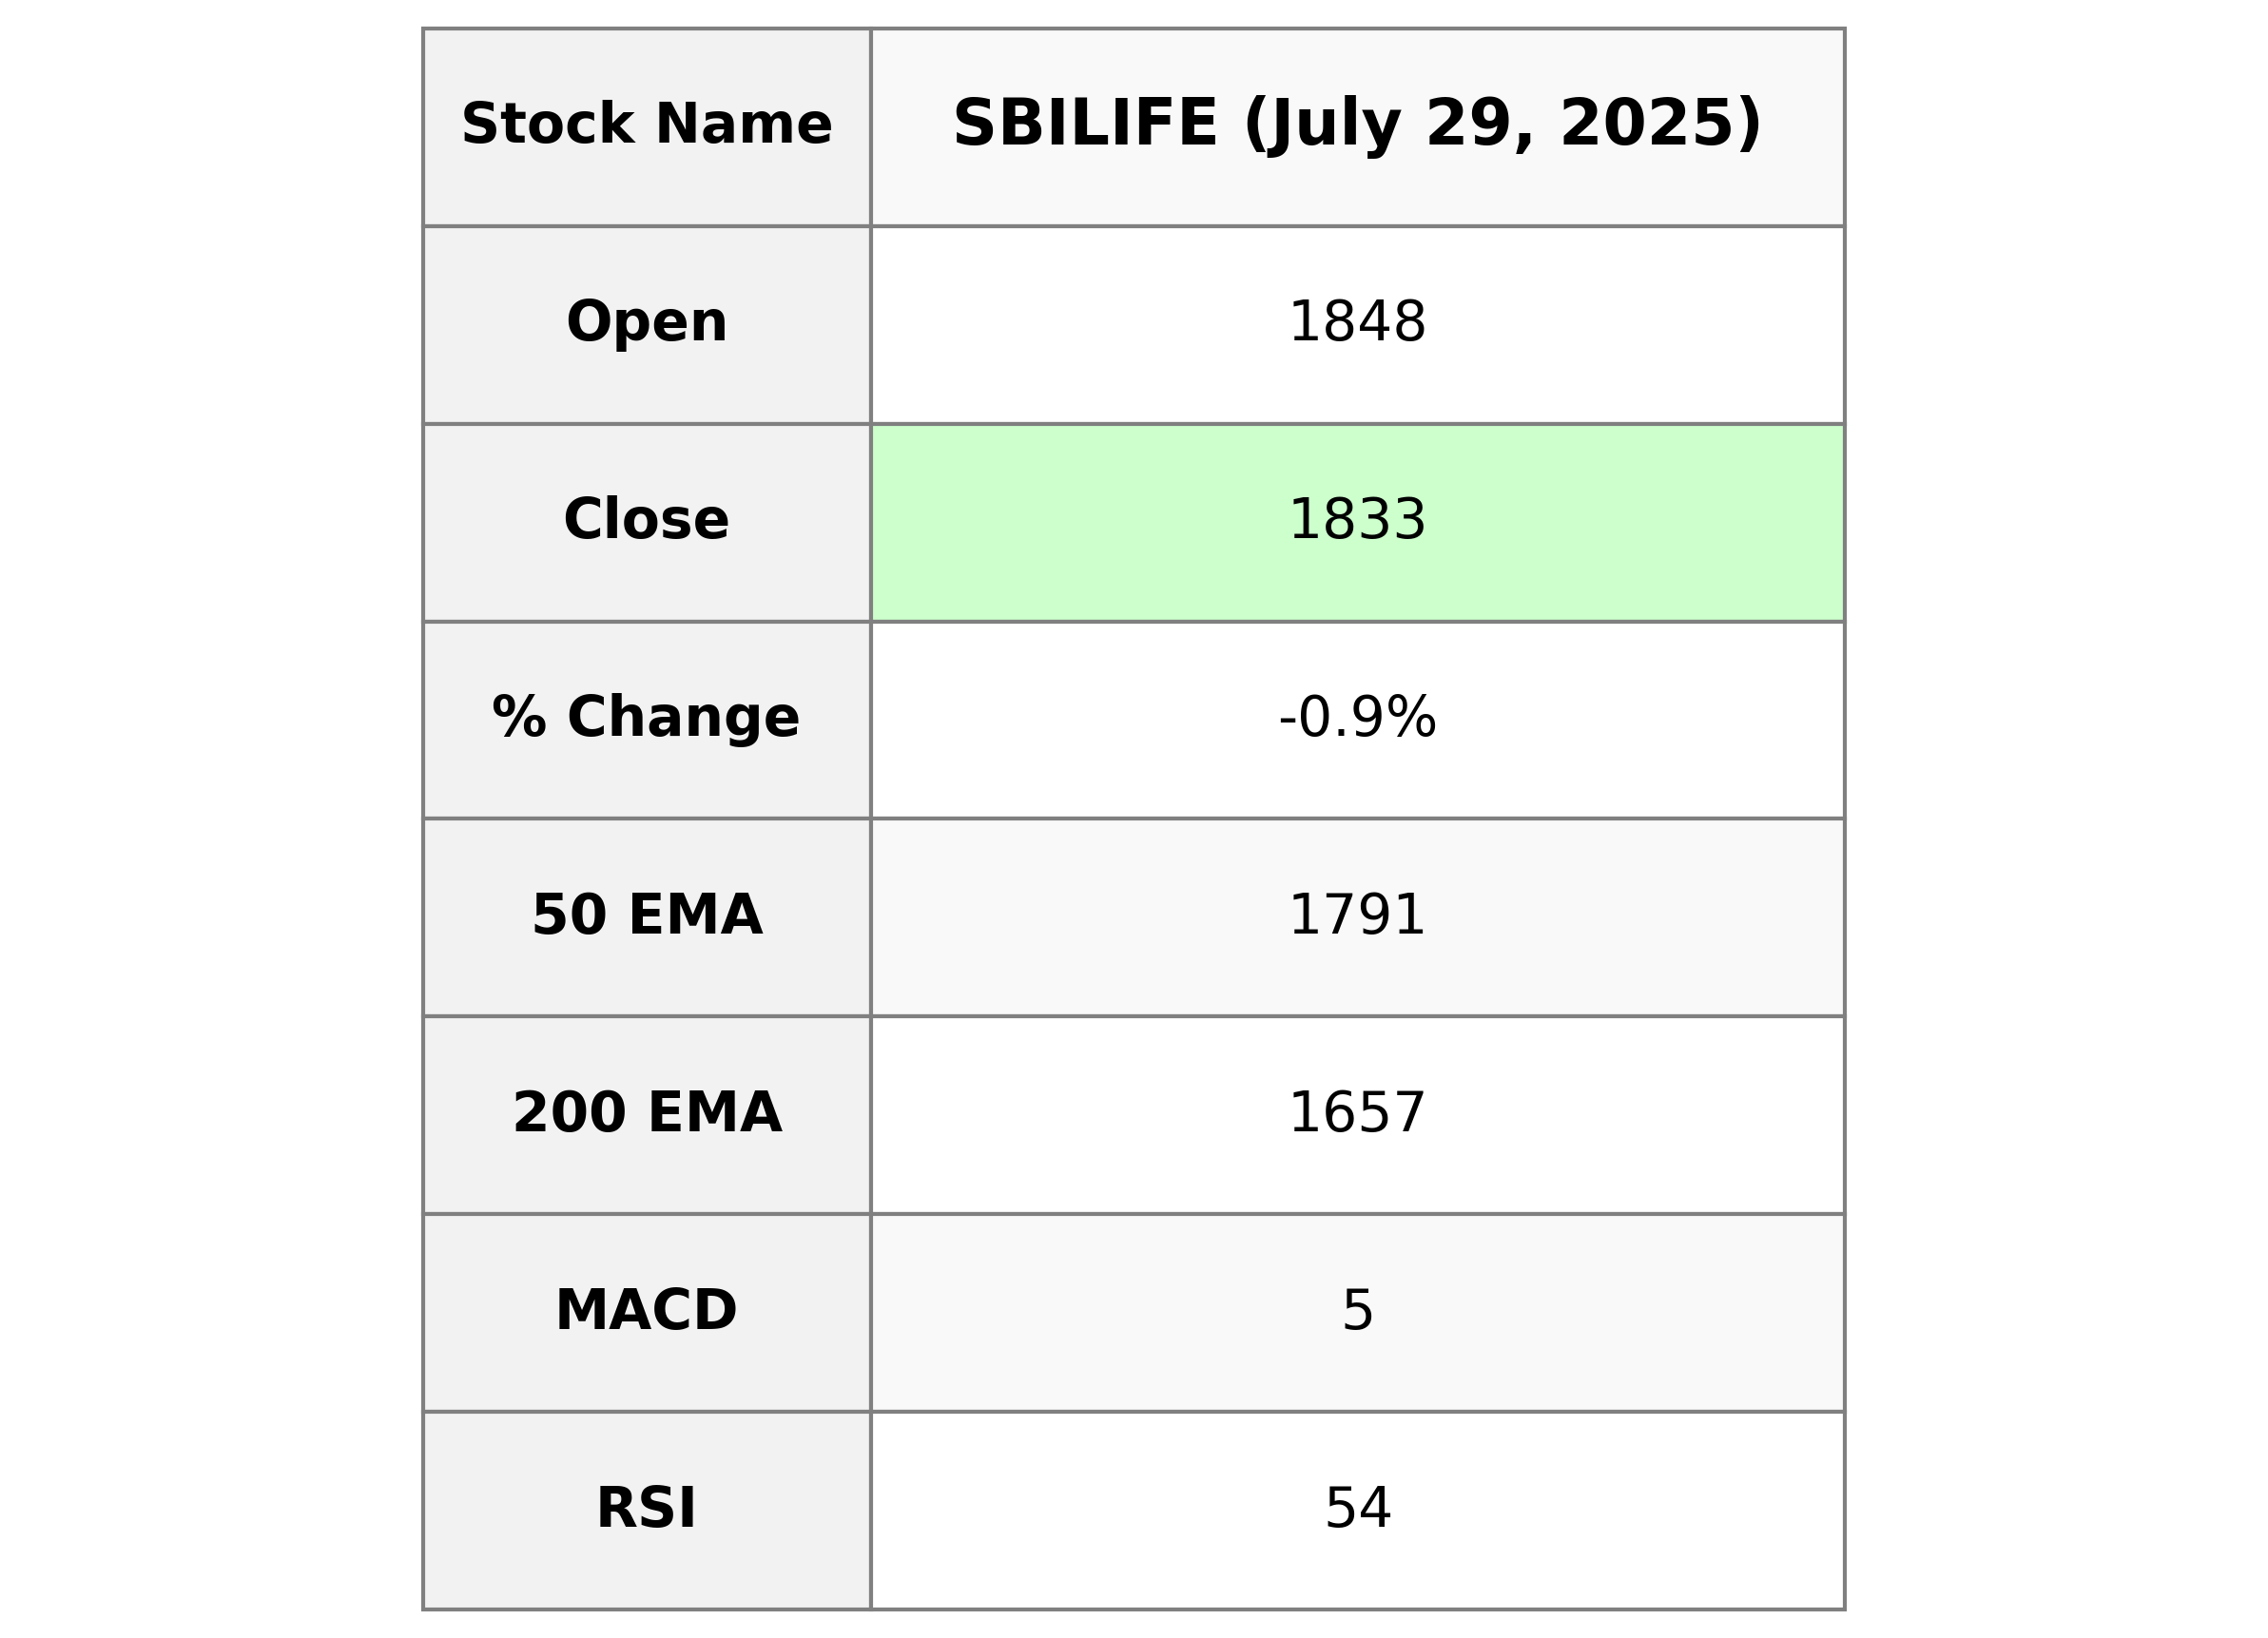
SBI Life Performance: The stock opened at 1848.0 and closed at 1833.4, marking a percentage change of -0.92% from its previous close of 1850.5. The company's financial indicators show a stable outlook, with a Market Cap of 1,837,708,607,488 and an EPS of 24.8, indicating a strong position in the Financial Services sector, specifically in the Insurance - Life industry in India.
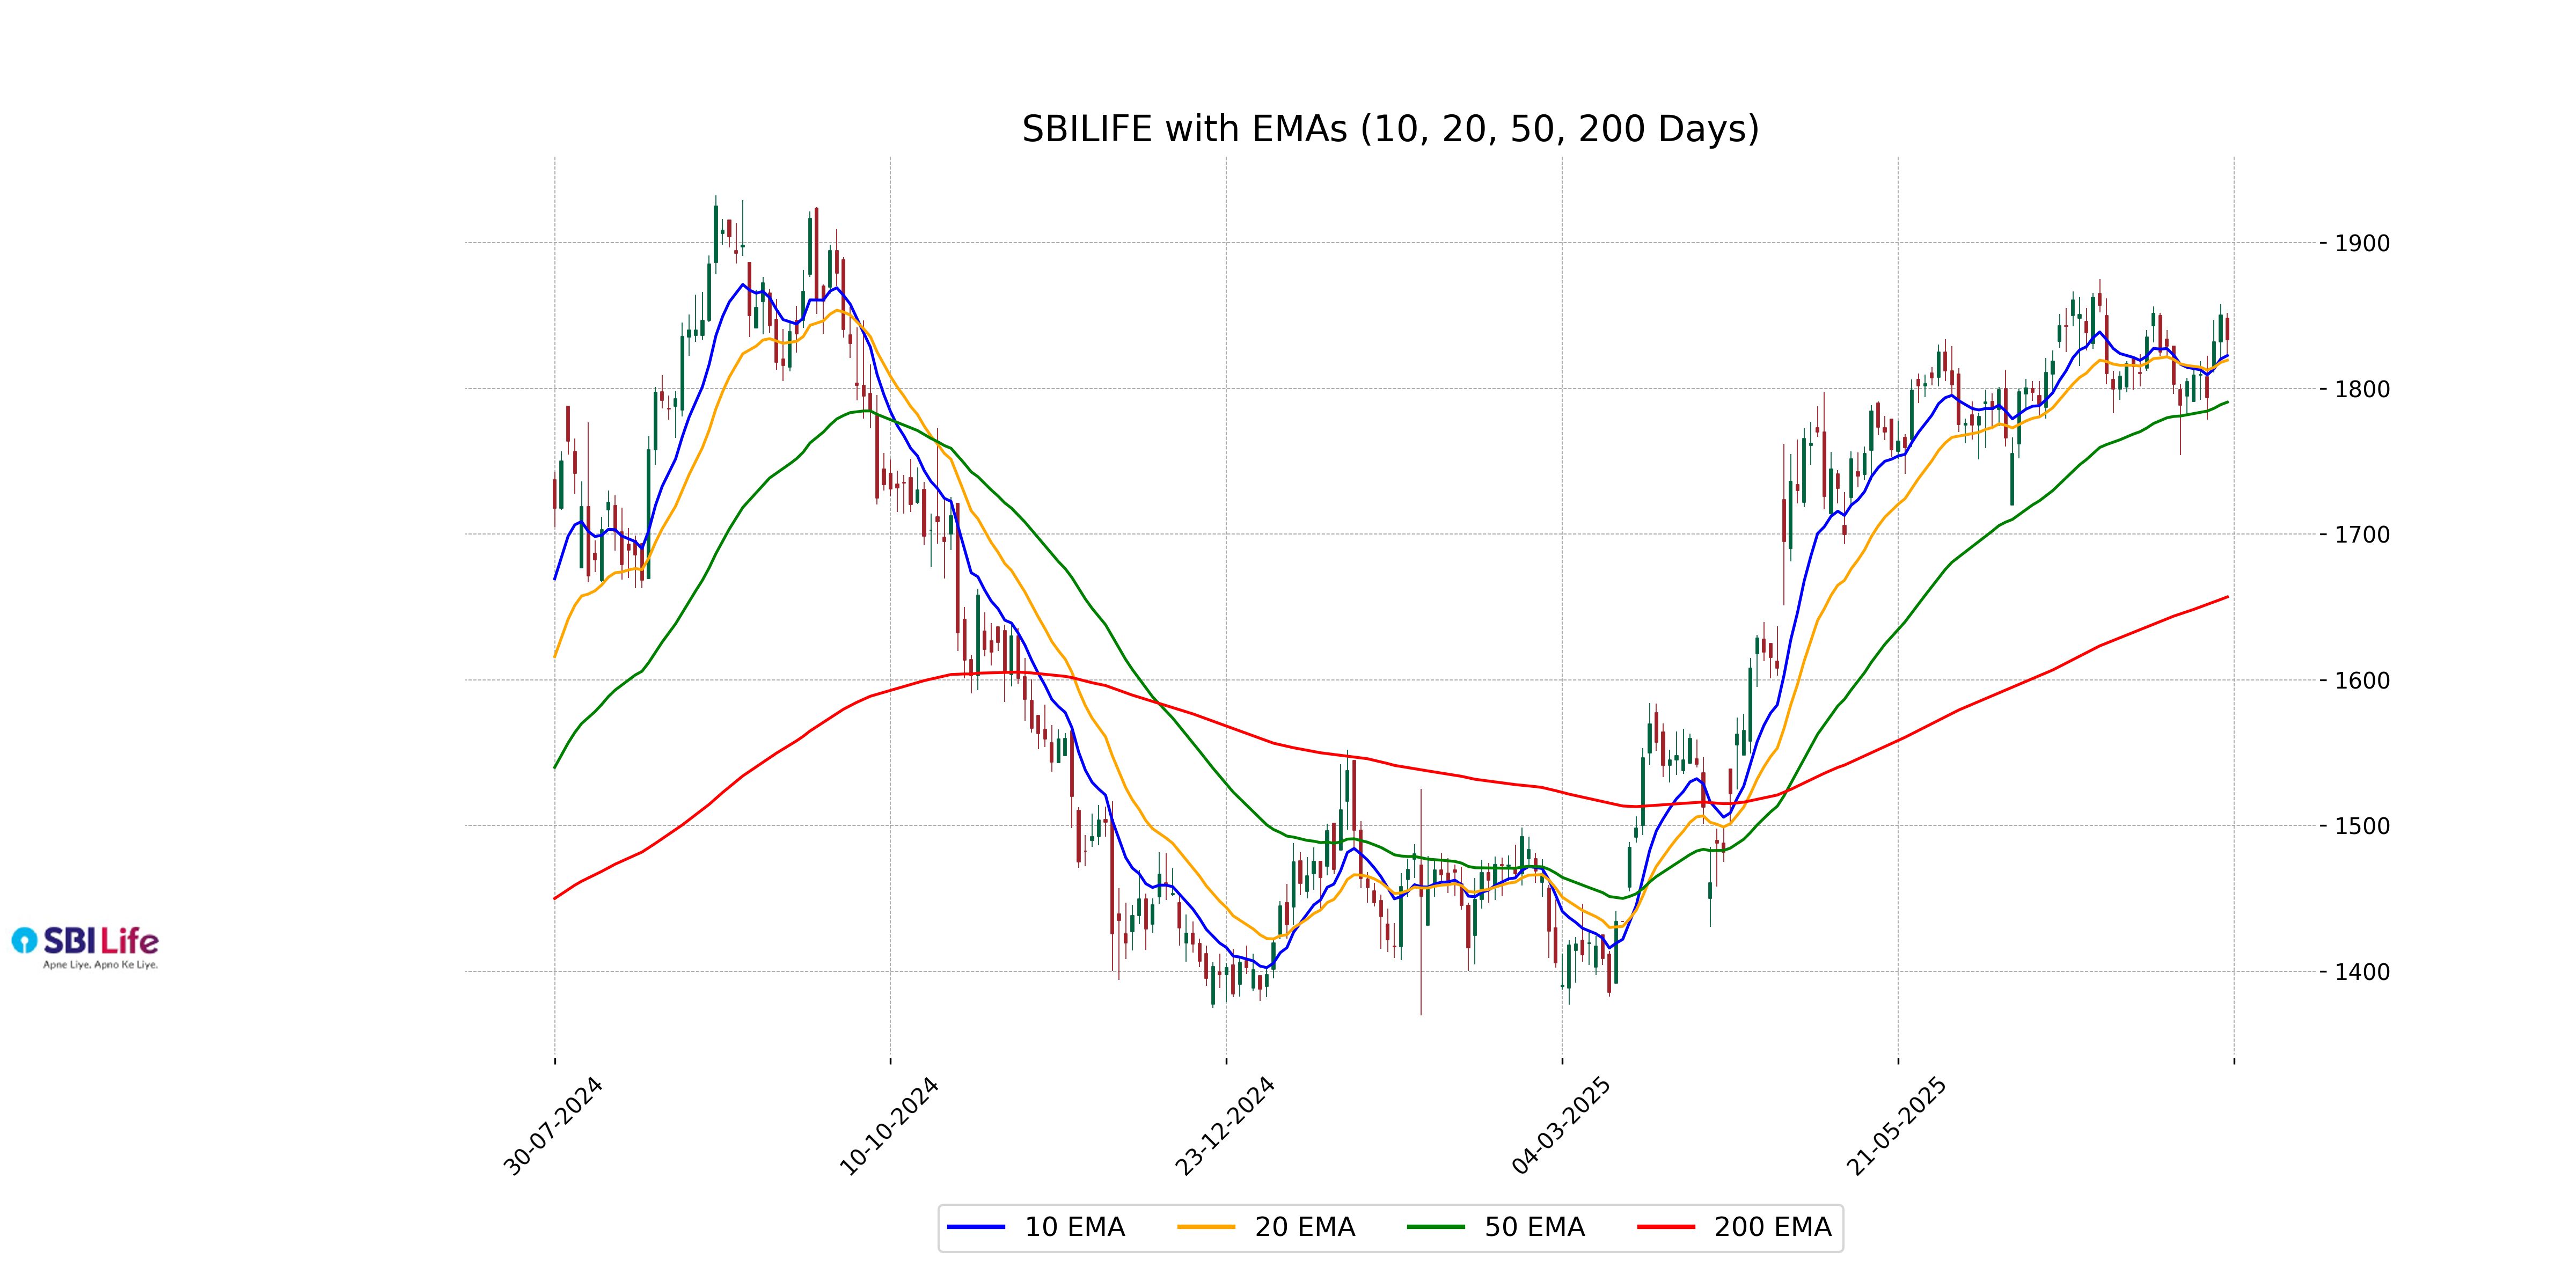
Relationship with Key Moving Averages
SBI Life's latest closing price of 1833.40 is slightly above its 10 EMA of 1822.56 and 20 EMA of 1819.33, indicating a short-term bullish position. However, it is slightly below its previous close of 1850.5 and is above its 50 EMA of 1790.58 and significantly above its 200 EMA of 1656.97, reflecting a longer-term upward trend.
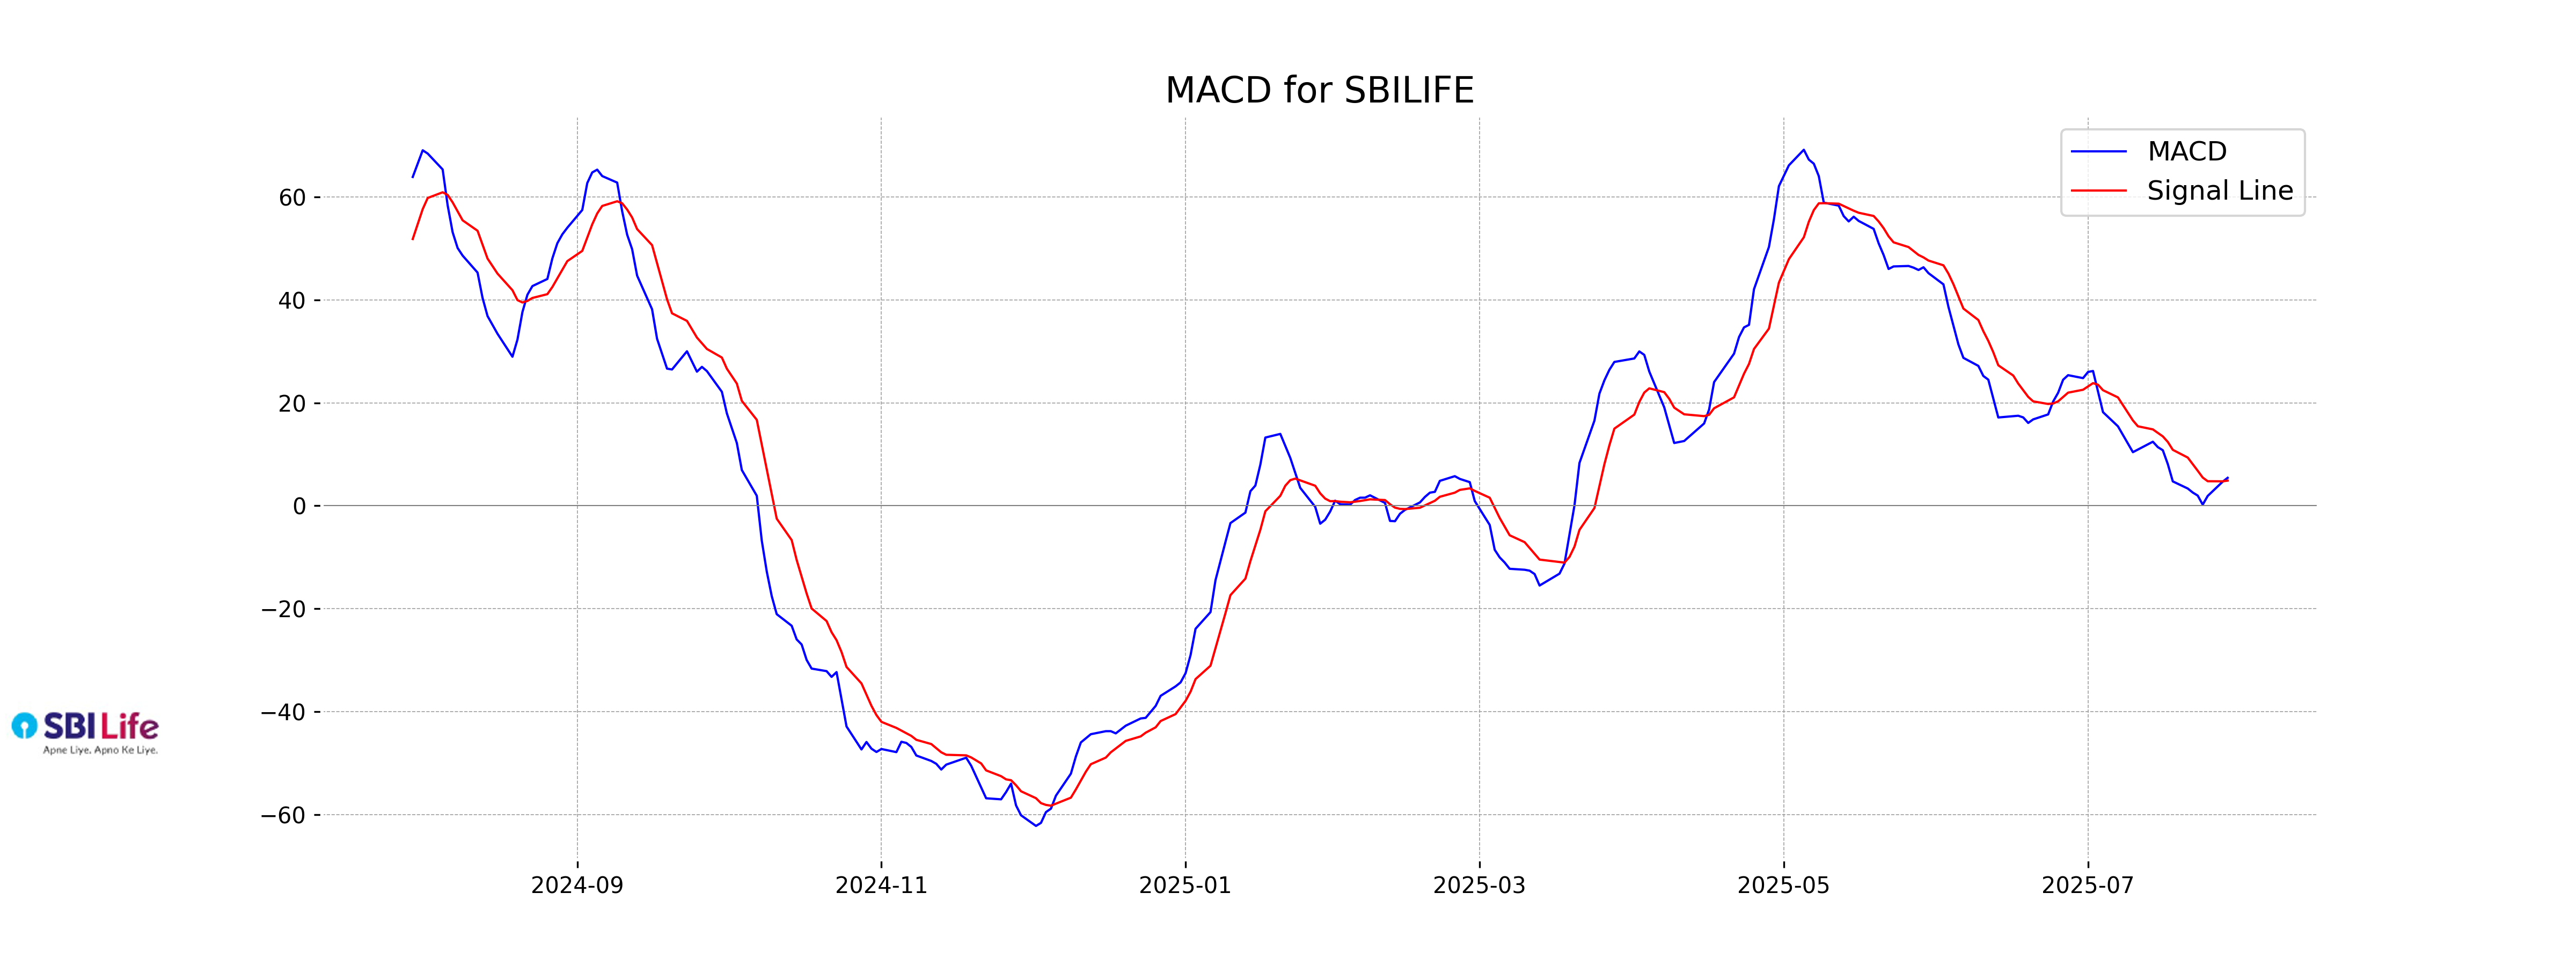
Moving Averages Trend (MACD)
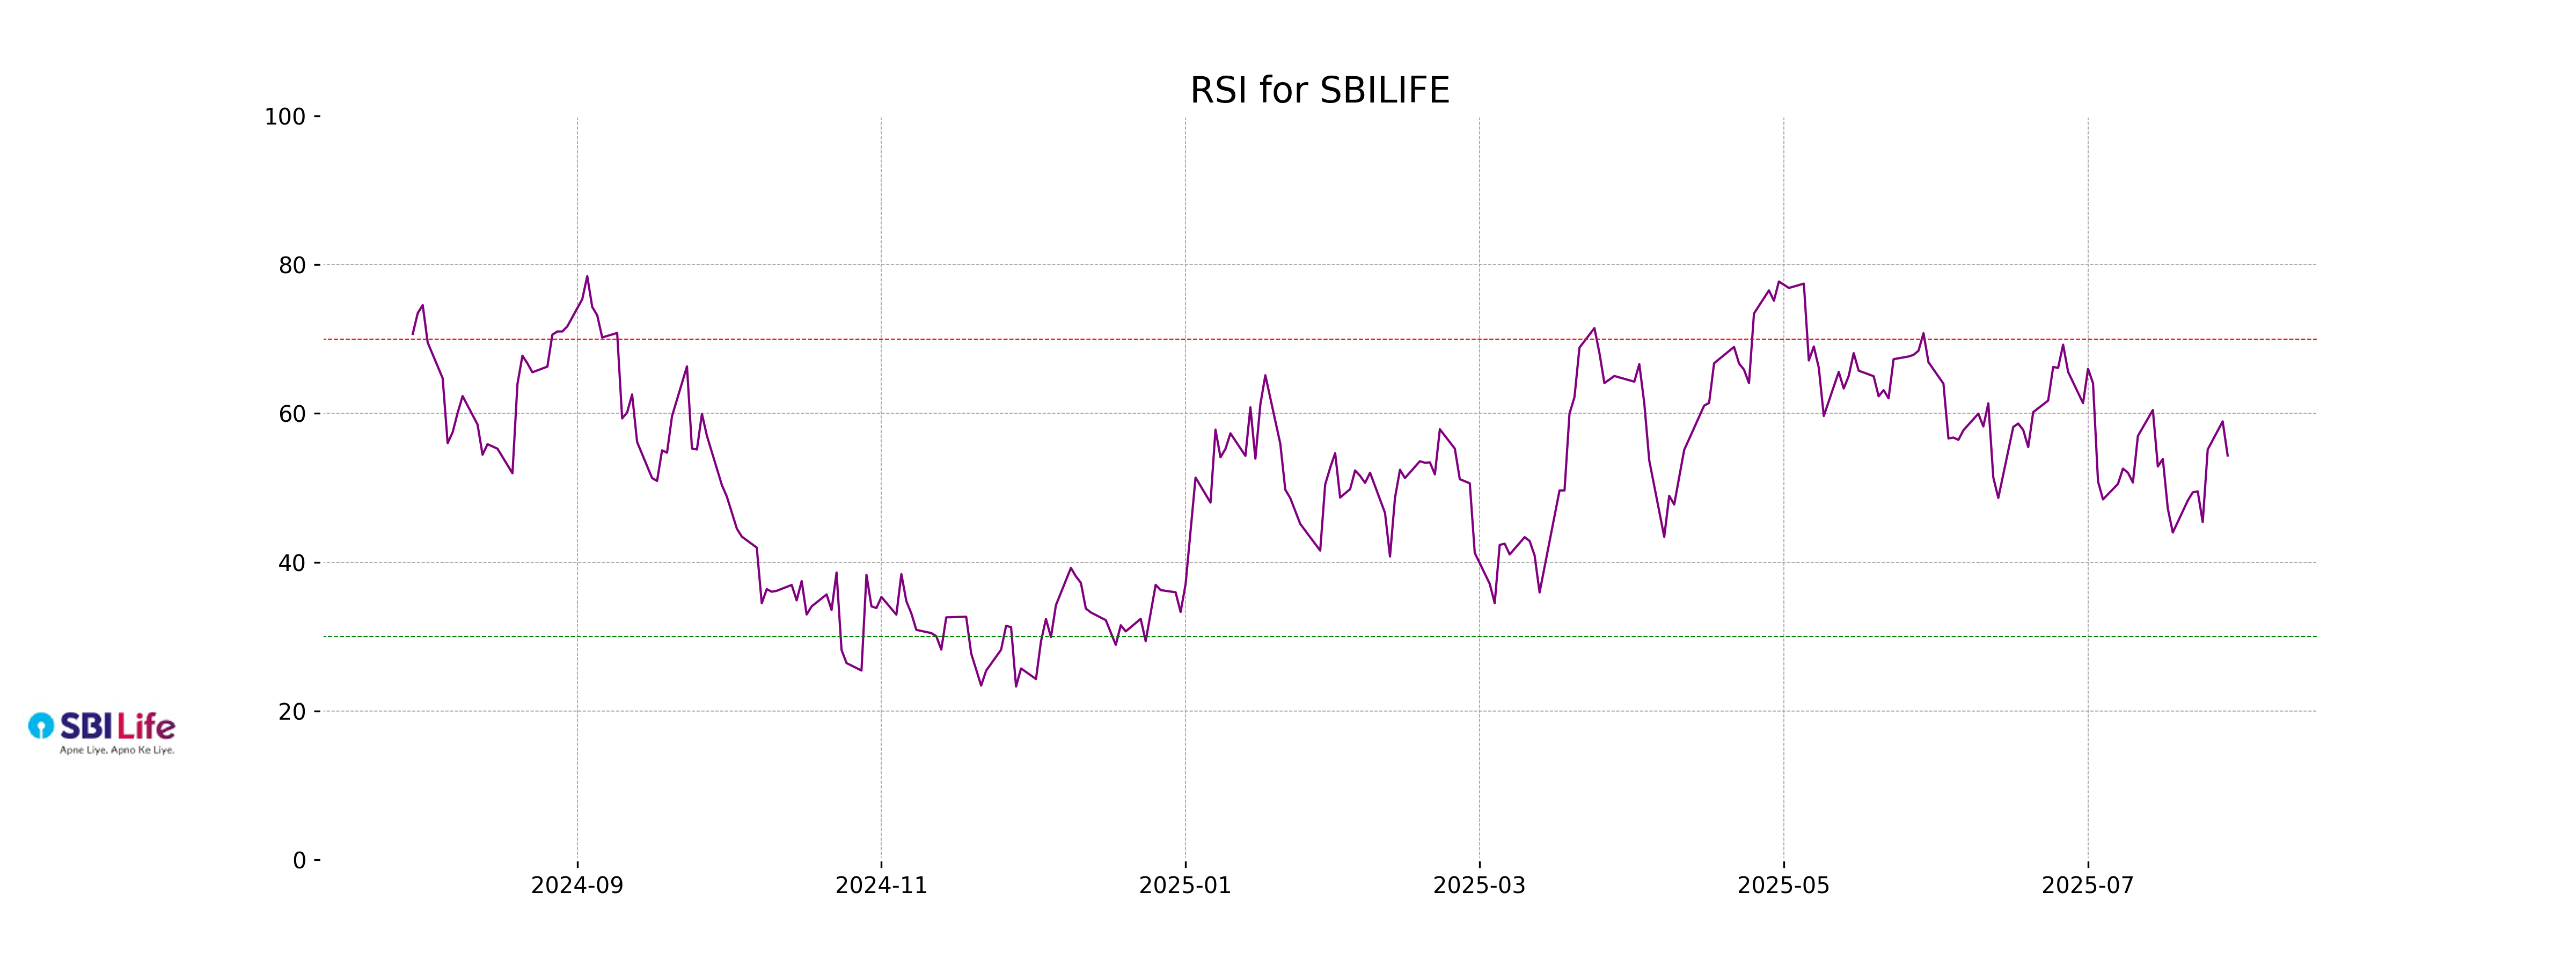
SBI Life's MACD value is 5.43, which is higher than its MACD Signal of 4.89. This indicates a bullish signal, suggesting potential upward momentum in the stock's price. The current RSI is 54.35, placing it in the neutral zone, which implies that the stock is not overbought or oversold.
RSI Analysis
RSI Analysis for SBI Life: The RSI (Relative Strength Index) for SBI Life is 54.35, indicating that the stock is in a neutral zone. It neither shows overbought tendencies nor does it suggest that the stock is oversold. Investors might consider this level as a balanced point, without immediate upward or downward pressure.
Analysis for TCS - July 29, 2025
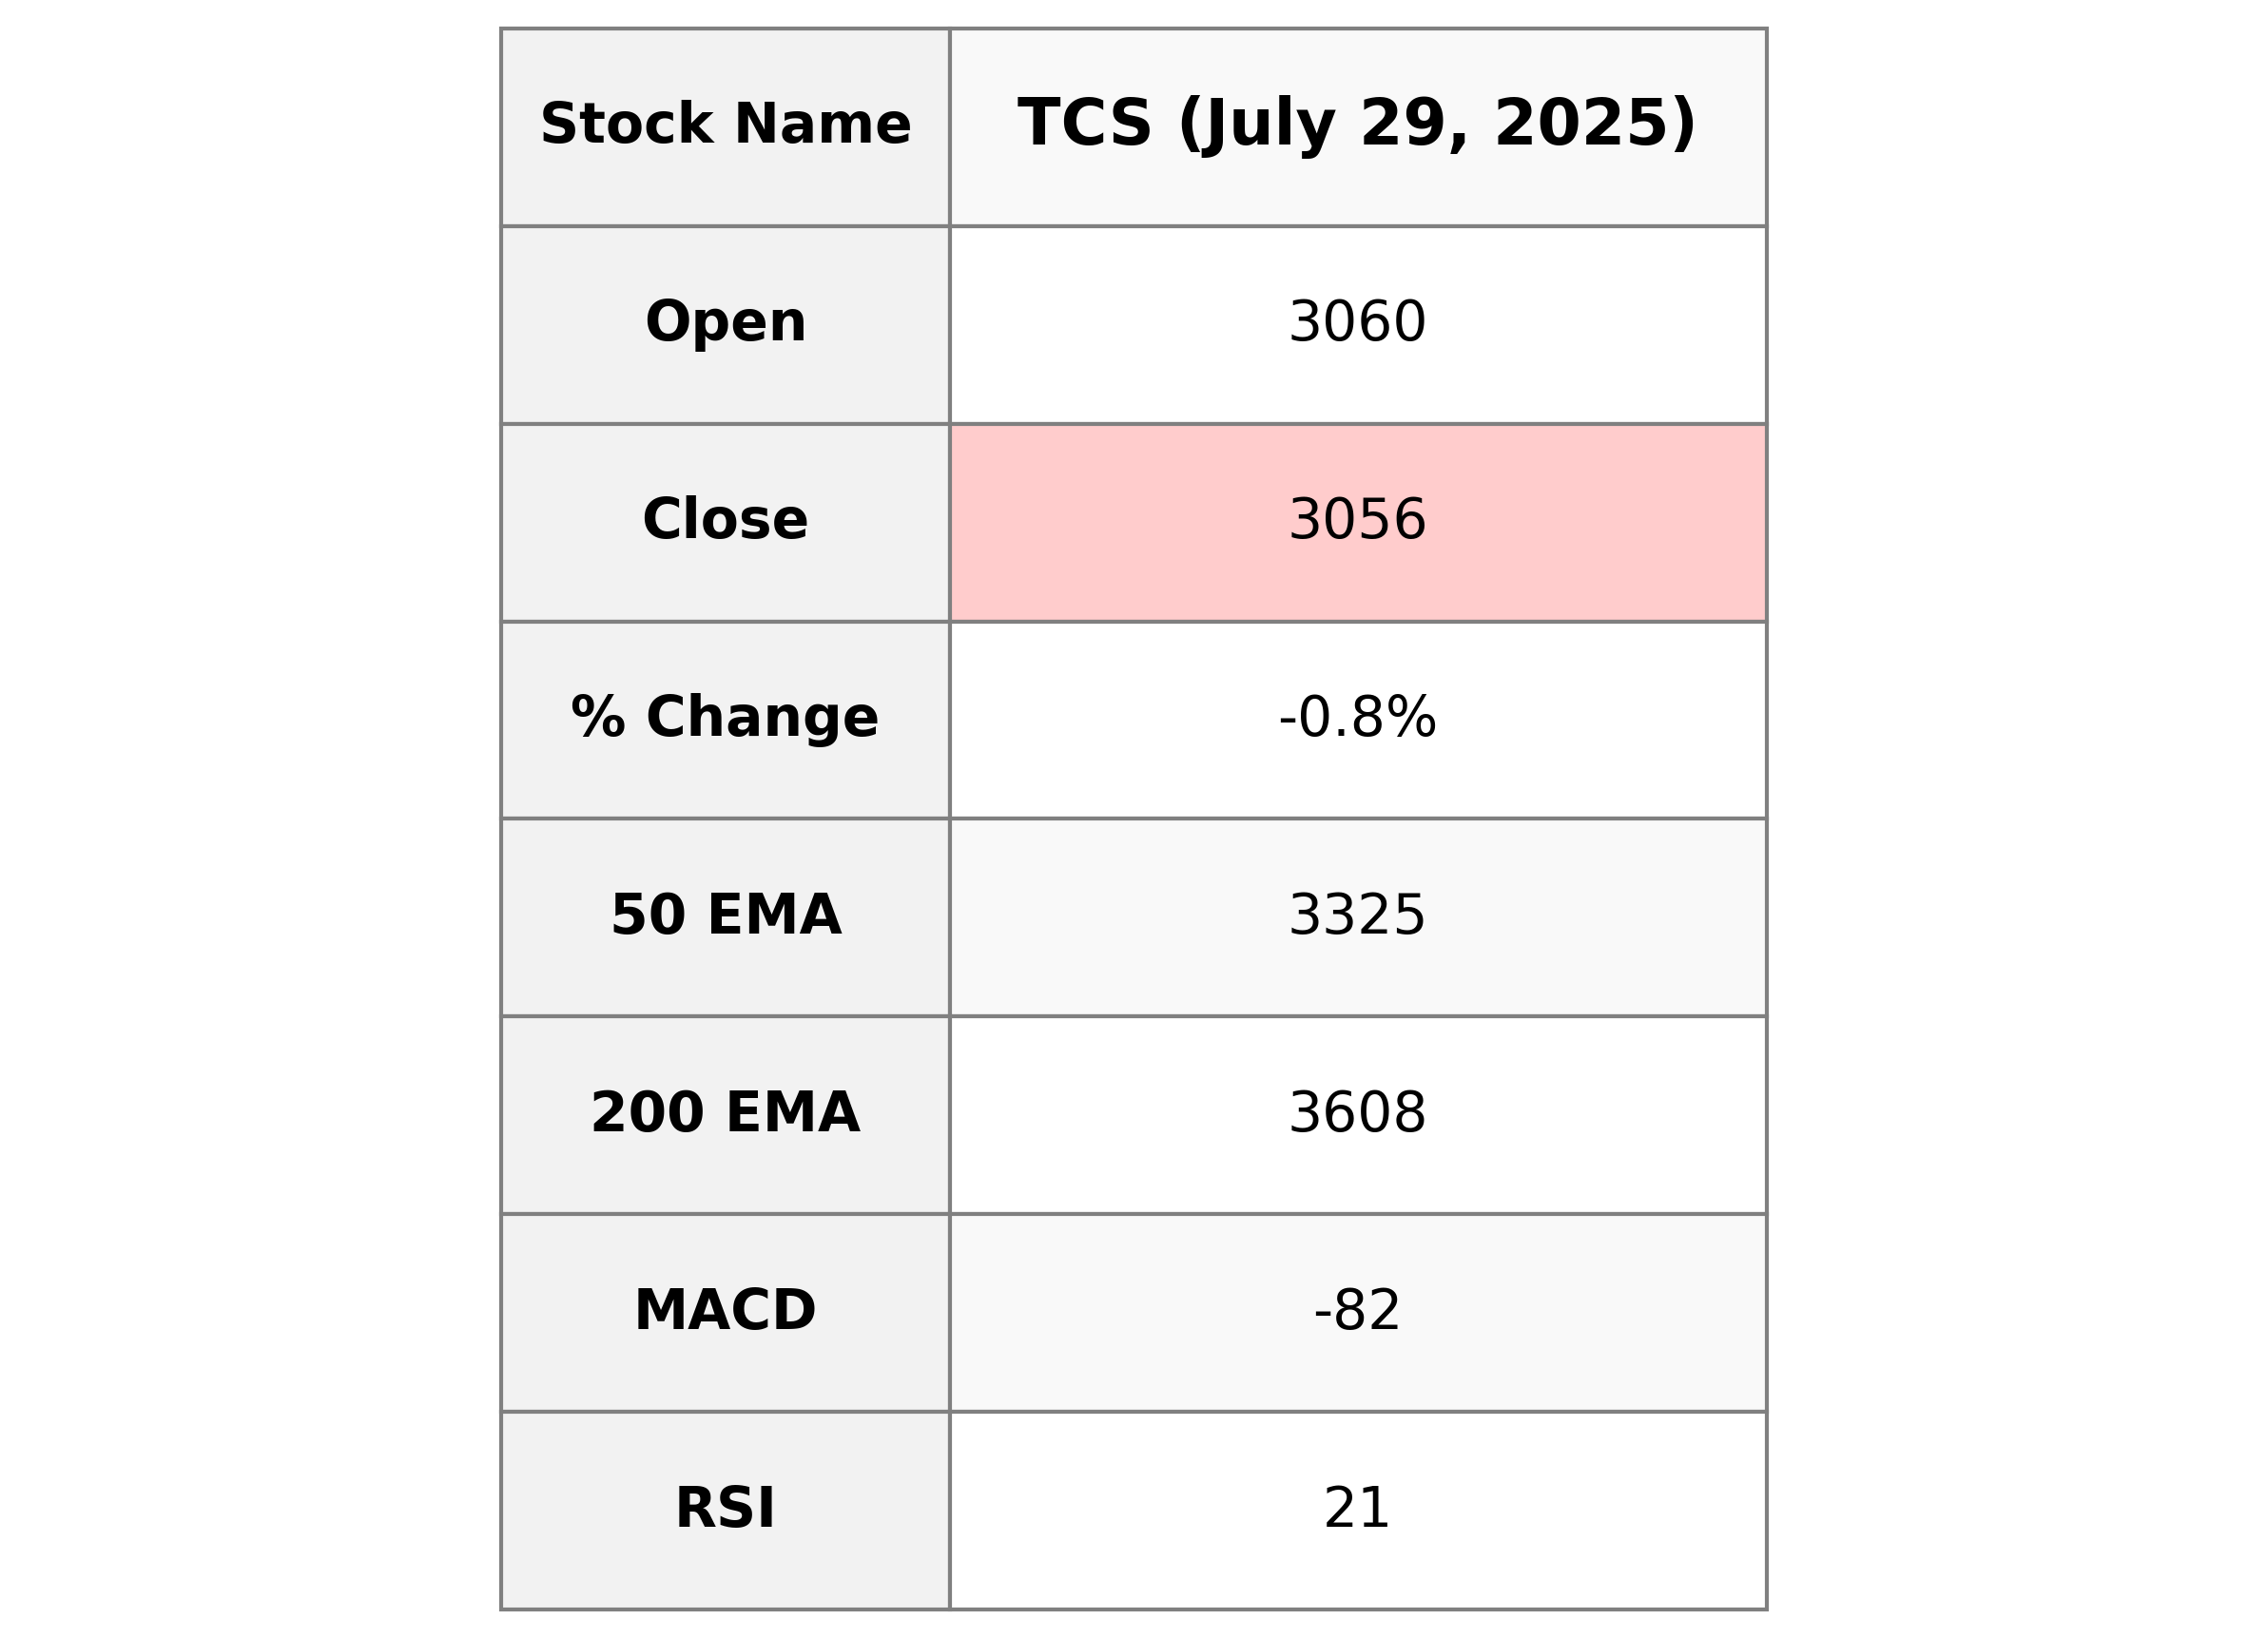
### TCS Performance Overview TCS has witnessed a minor decrease in its stock price, closing at 3056.0, reflecting a percentage change of -0.76% from its previous close. The stock's current RSI is relatively low at 20.53, suggesting potential oversold conditions. Despite the market cap standing strong at over 12 trillion, it is trading below its 50 and 200 EMA, showing a downtrend. The P/E ratio of 22.45 indicates the stock's valuation relative to its earnings. ### Sector & Industry TCS operates within the Technology sector, specifically in Information Technology Services, and is headquartered in India.
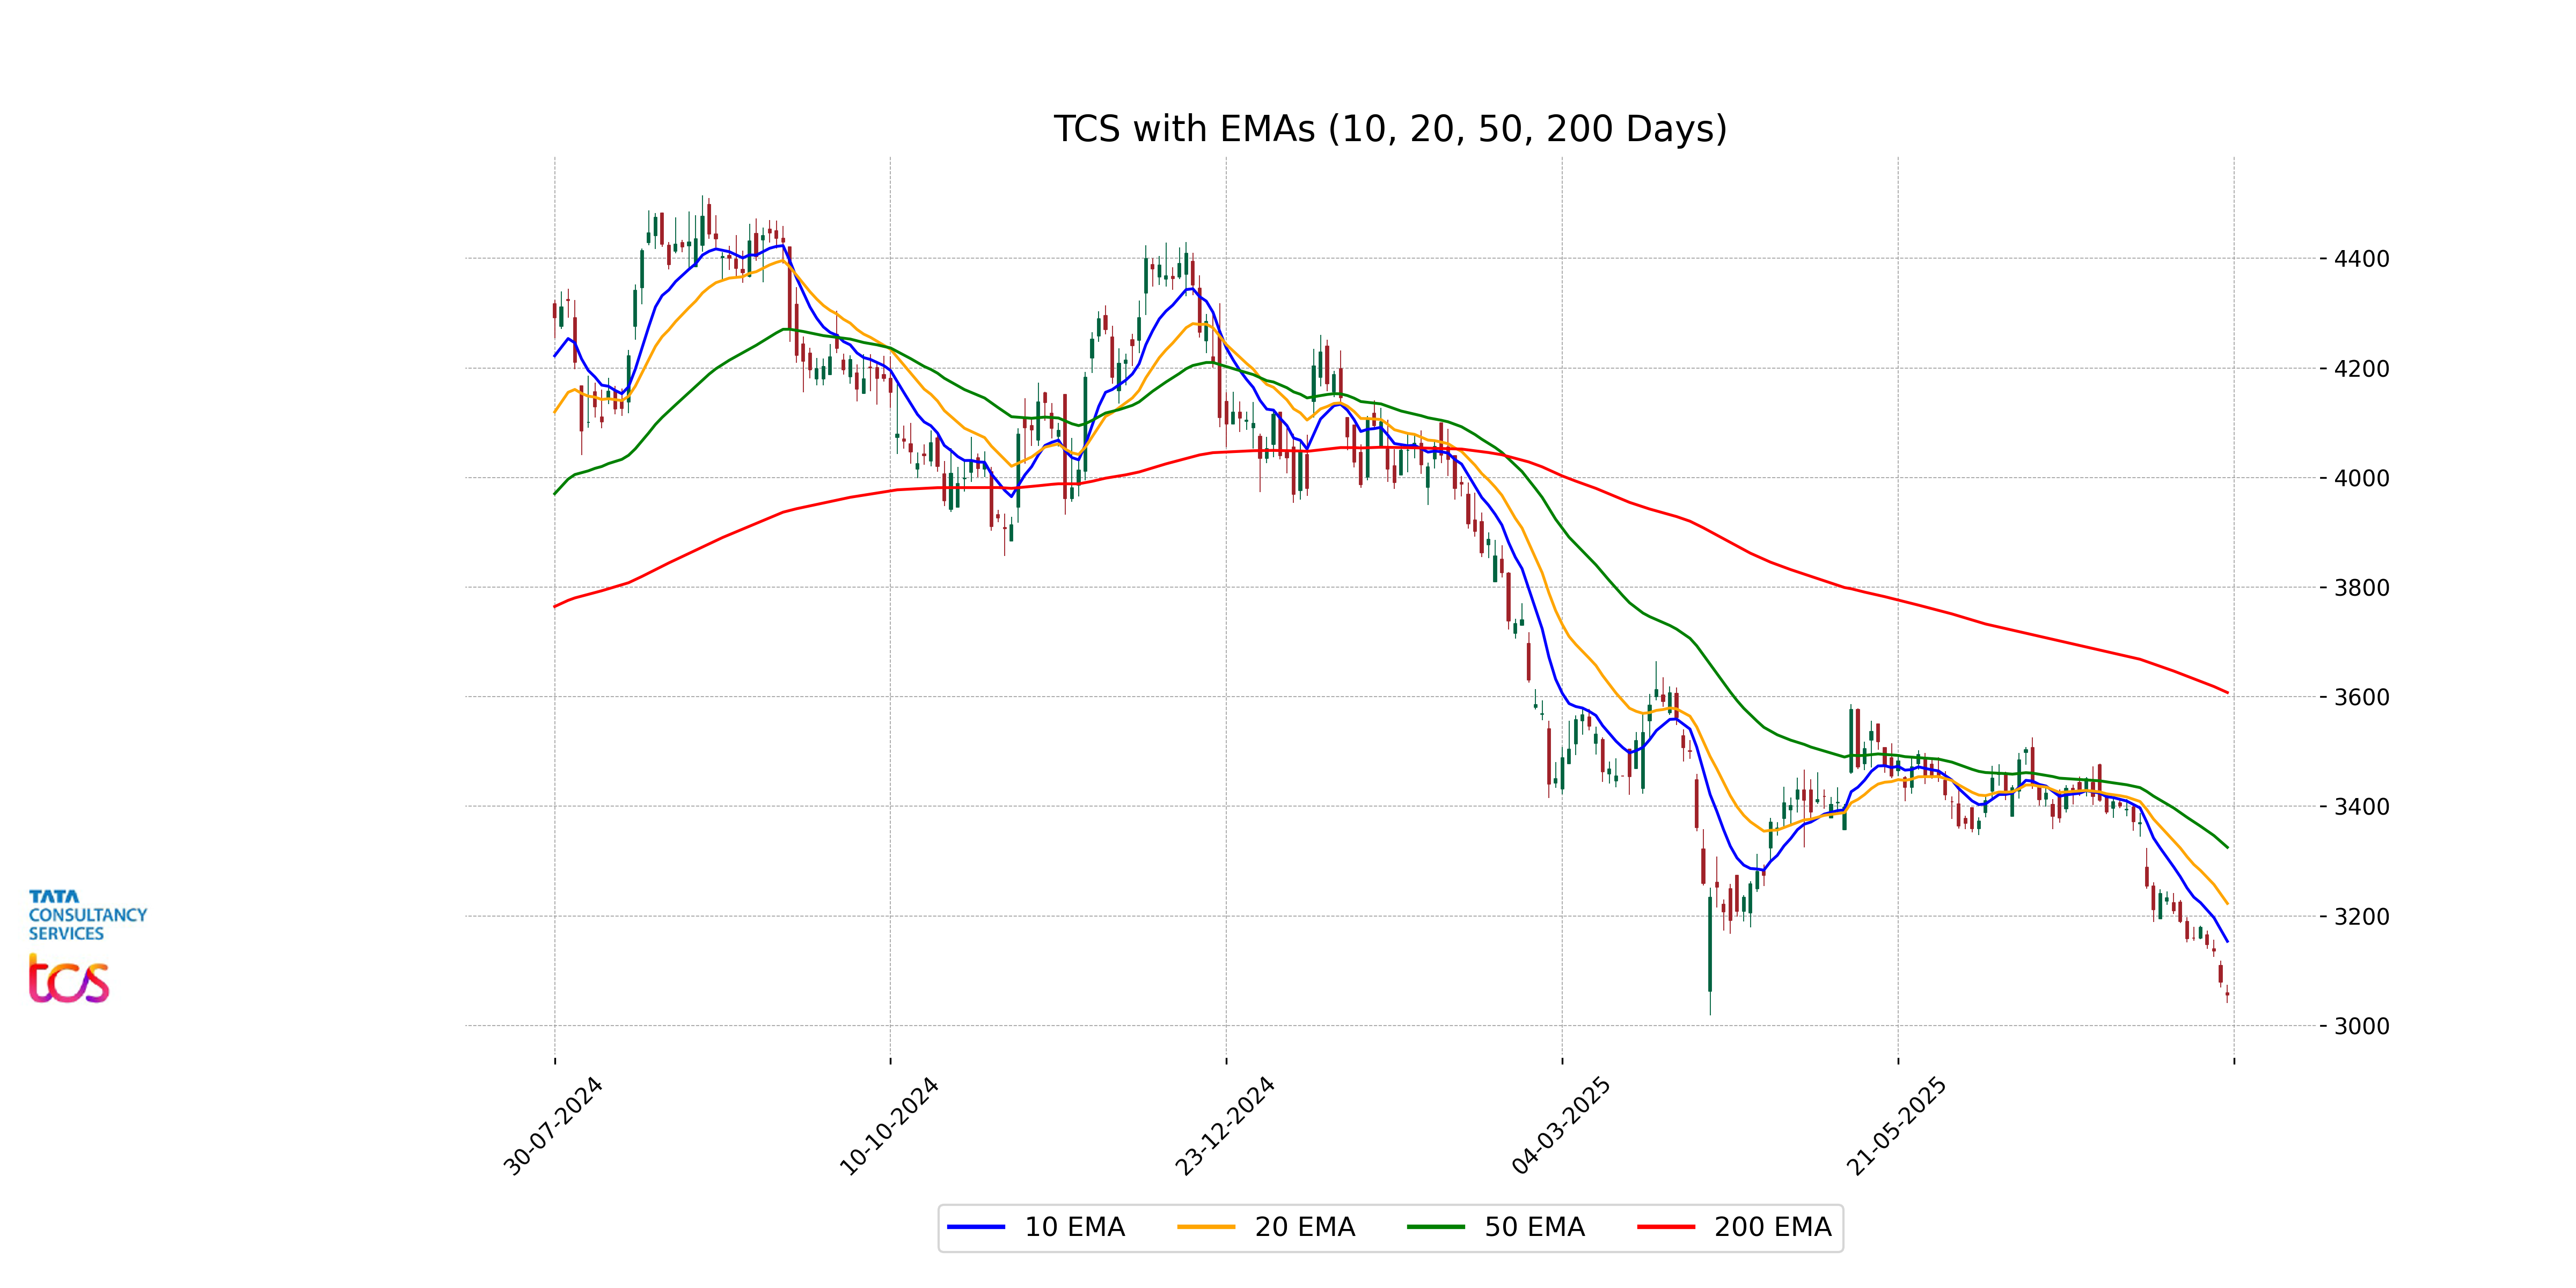
Relationship with Key Moving Averages
Based on the provided data, TCS is currently trading below its key moving averages, with the current price of 3056.0 below the 10 EMA (3153.72), 20 EMA (3222.80), 50 EMA (3325.16), and 200 EMA (3607.67), indicating potential bearish sentiment. The RSI value of 20.53 suggests that the stock may be in oversold territory.
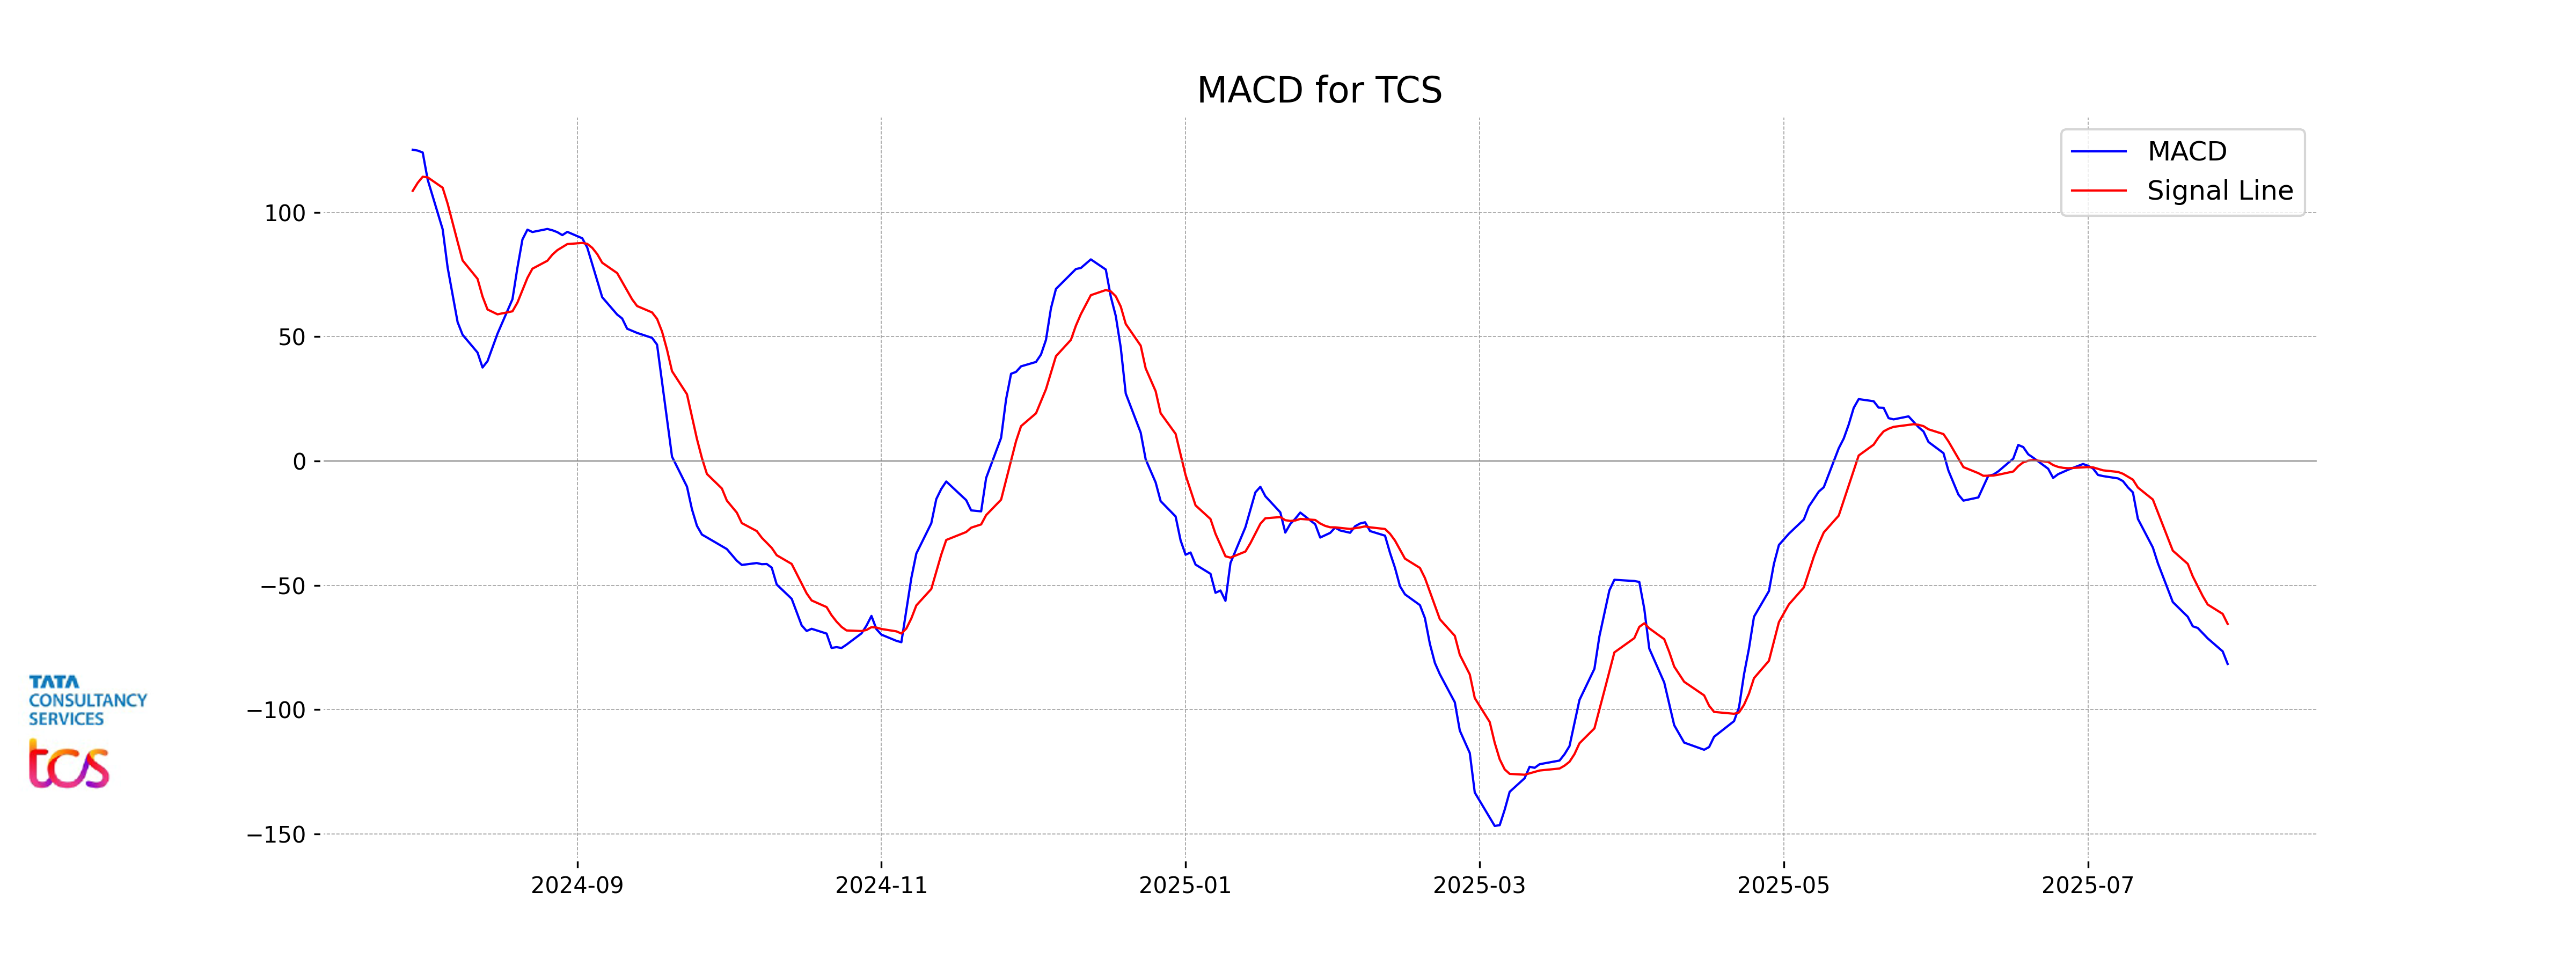
Moving Averages Trend (MACD)
Based on the data, the MACD for TCS is at -81.67, which is below the MACD signal line of -65.55. This indicates bearish momentum, suggesting that the stock may continue to face downward pressure in the short term.
RSI Analysis
TCS currently has an RSI of 20.53, indicating it is in the oversold territory. An RSI below 30 typically suggests that the stock may be undervalued or experiencing strong downward momentum, potentially presenting a buying opportunity if other factors align. However, it is crucial to conduct further analysis or consult with a financial advisor for a comprehensive investment decision.

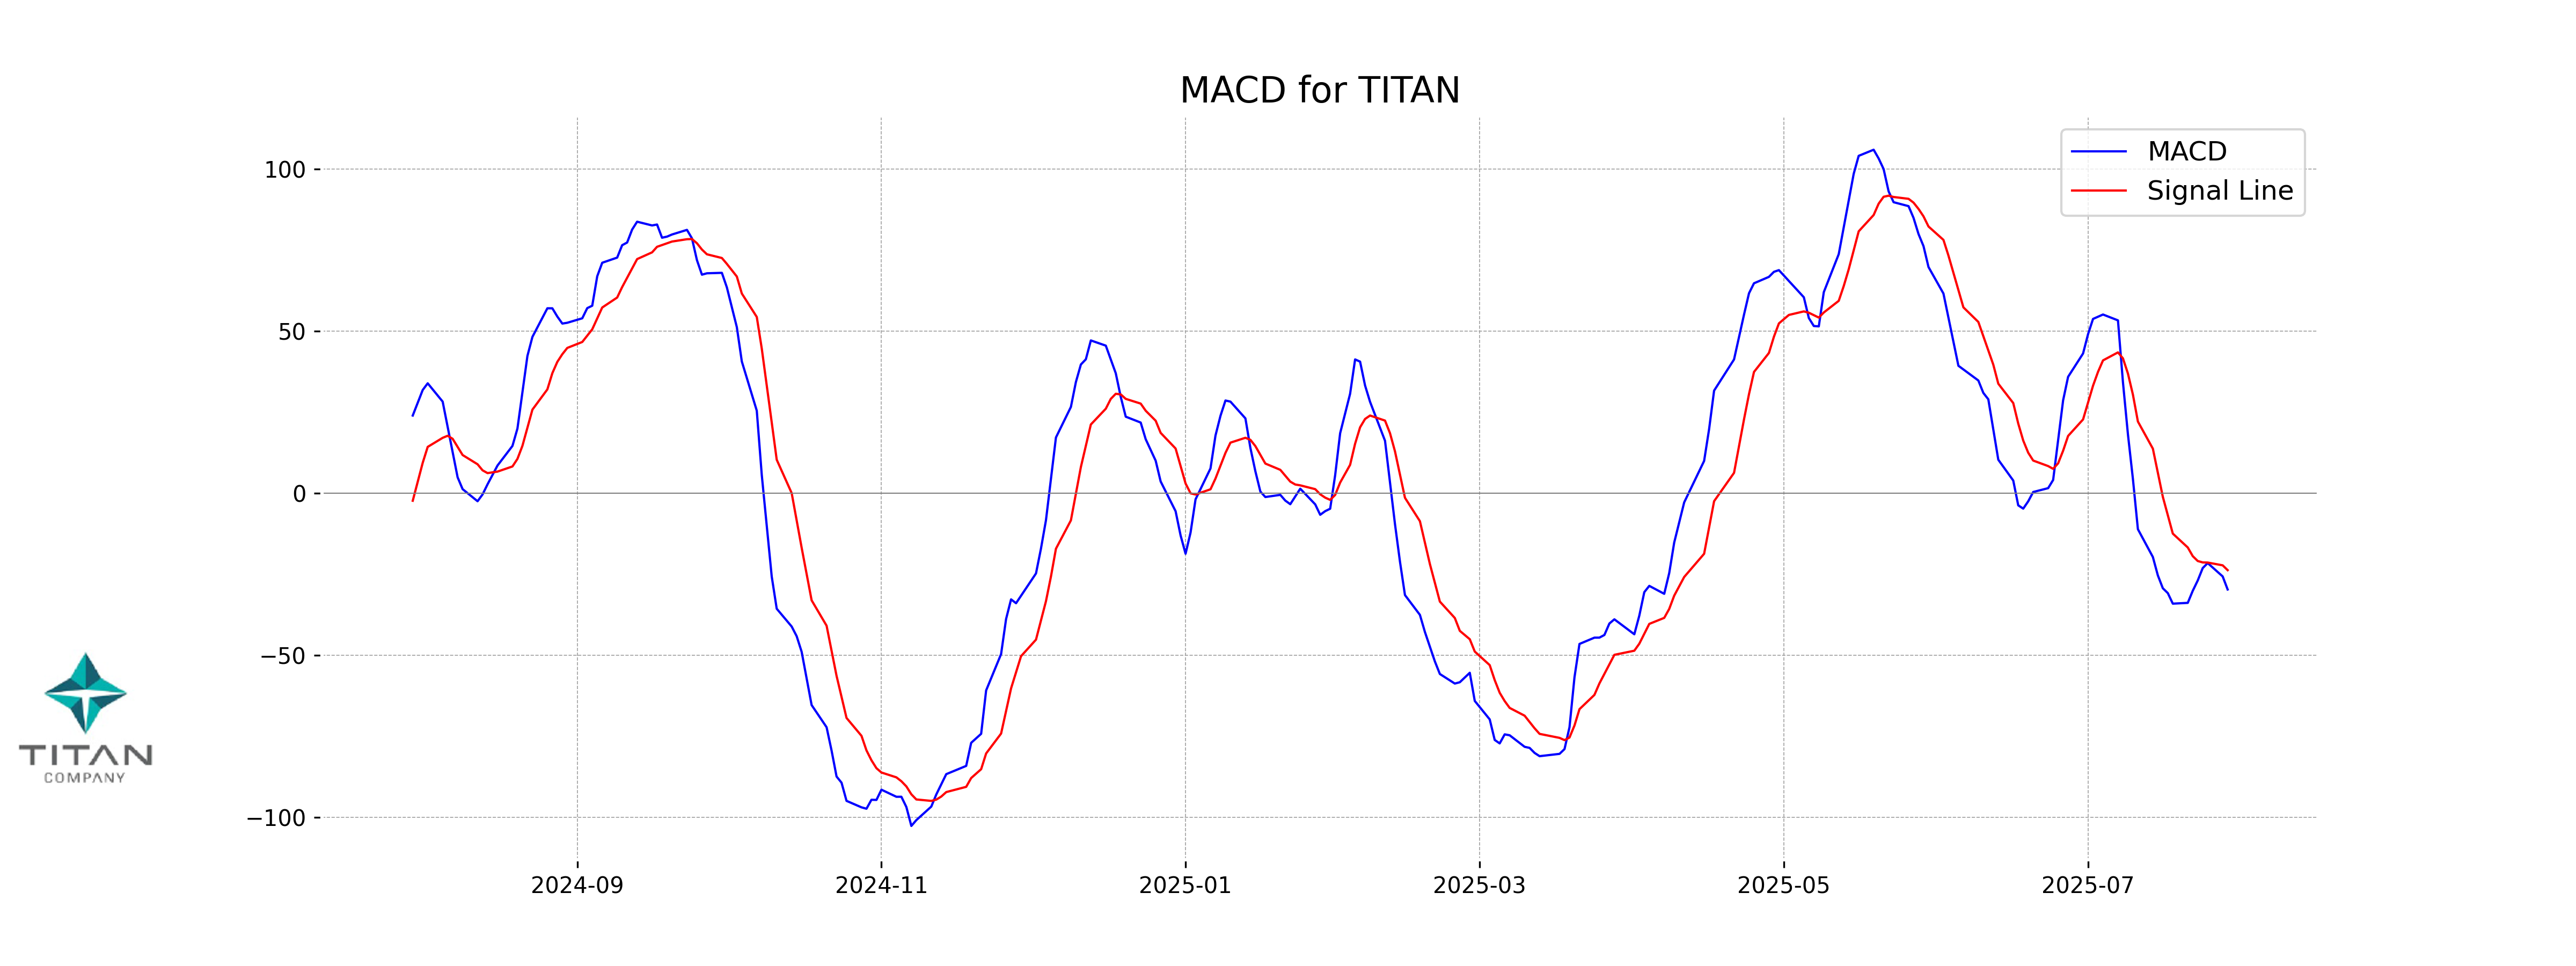
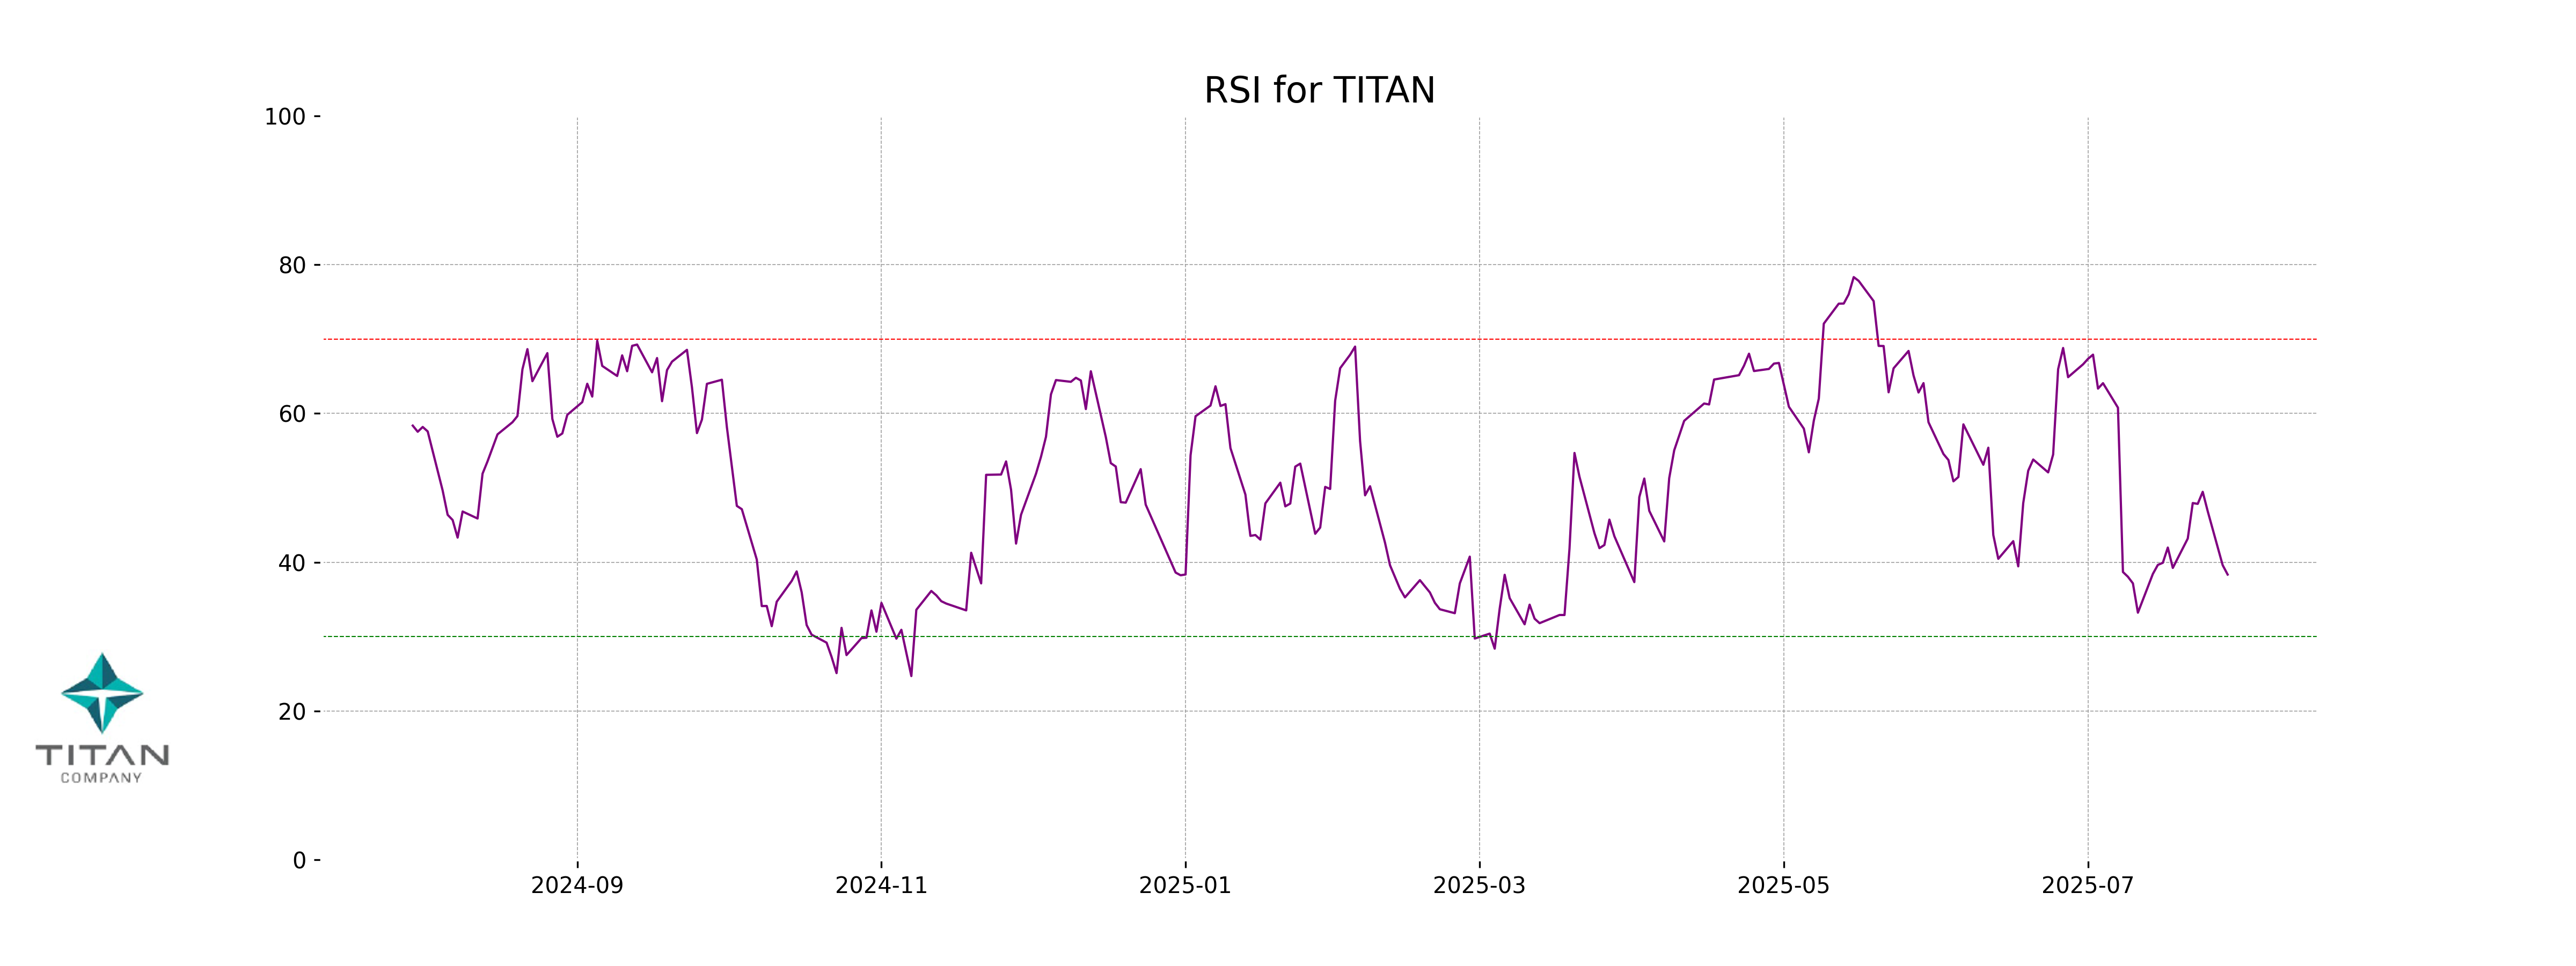
Analysis for Titan Company - July 29, 2025
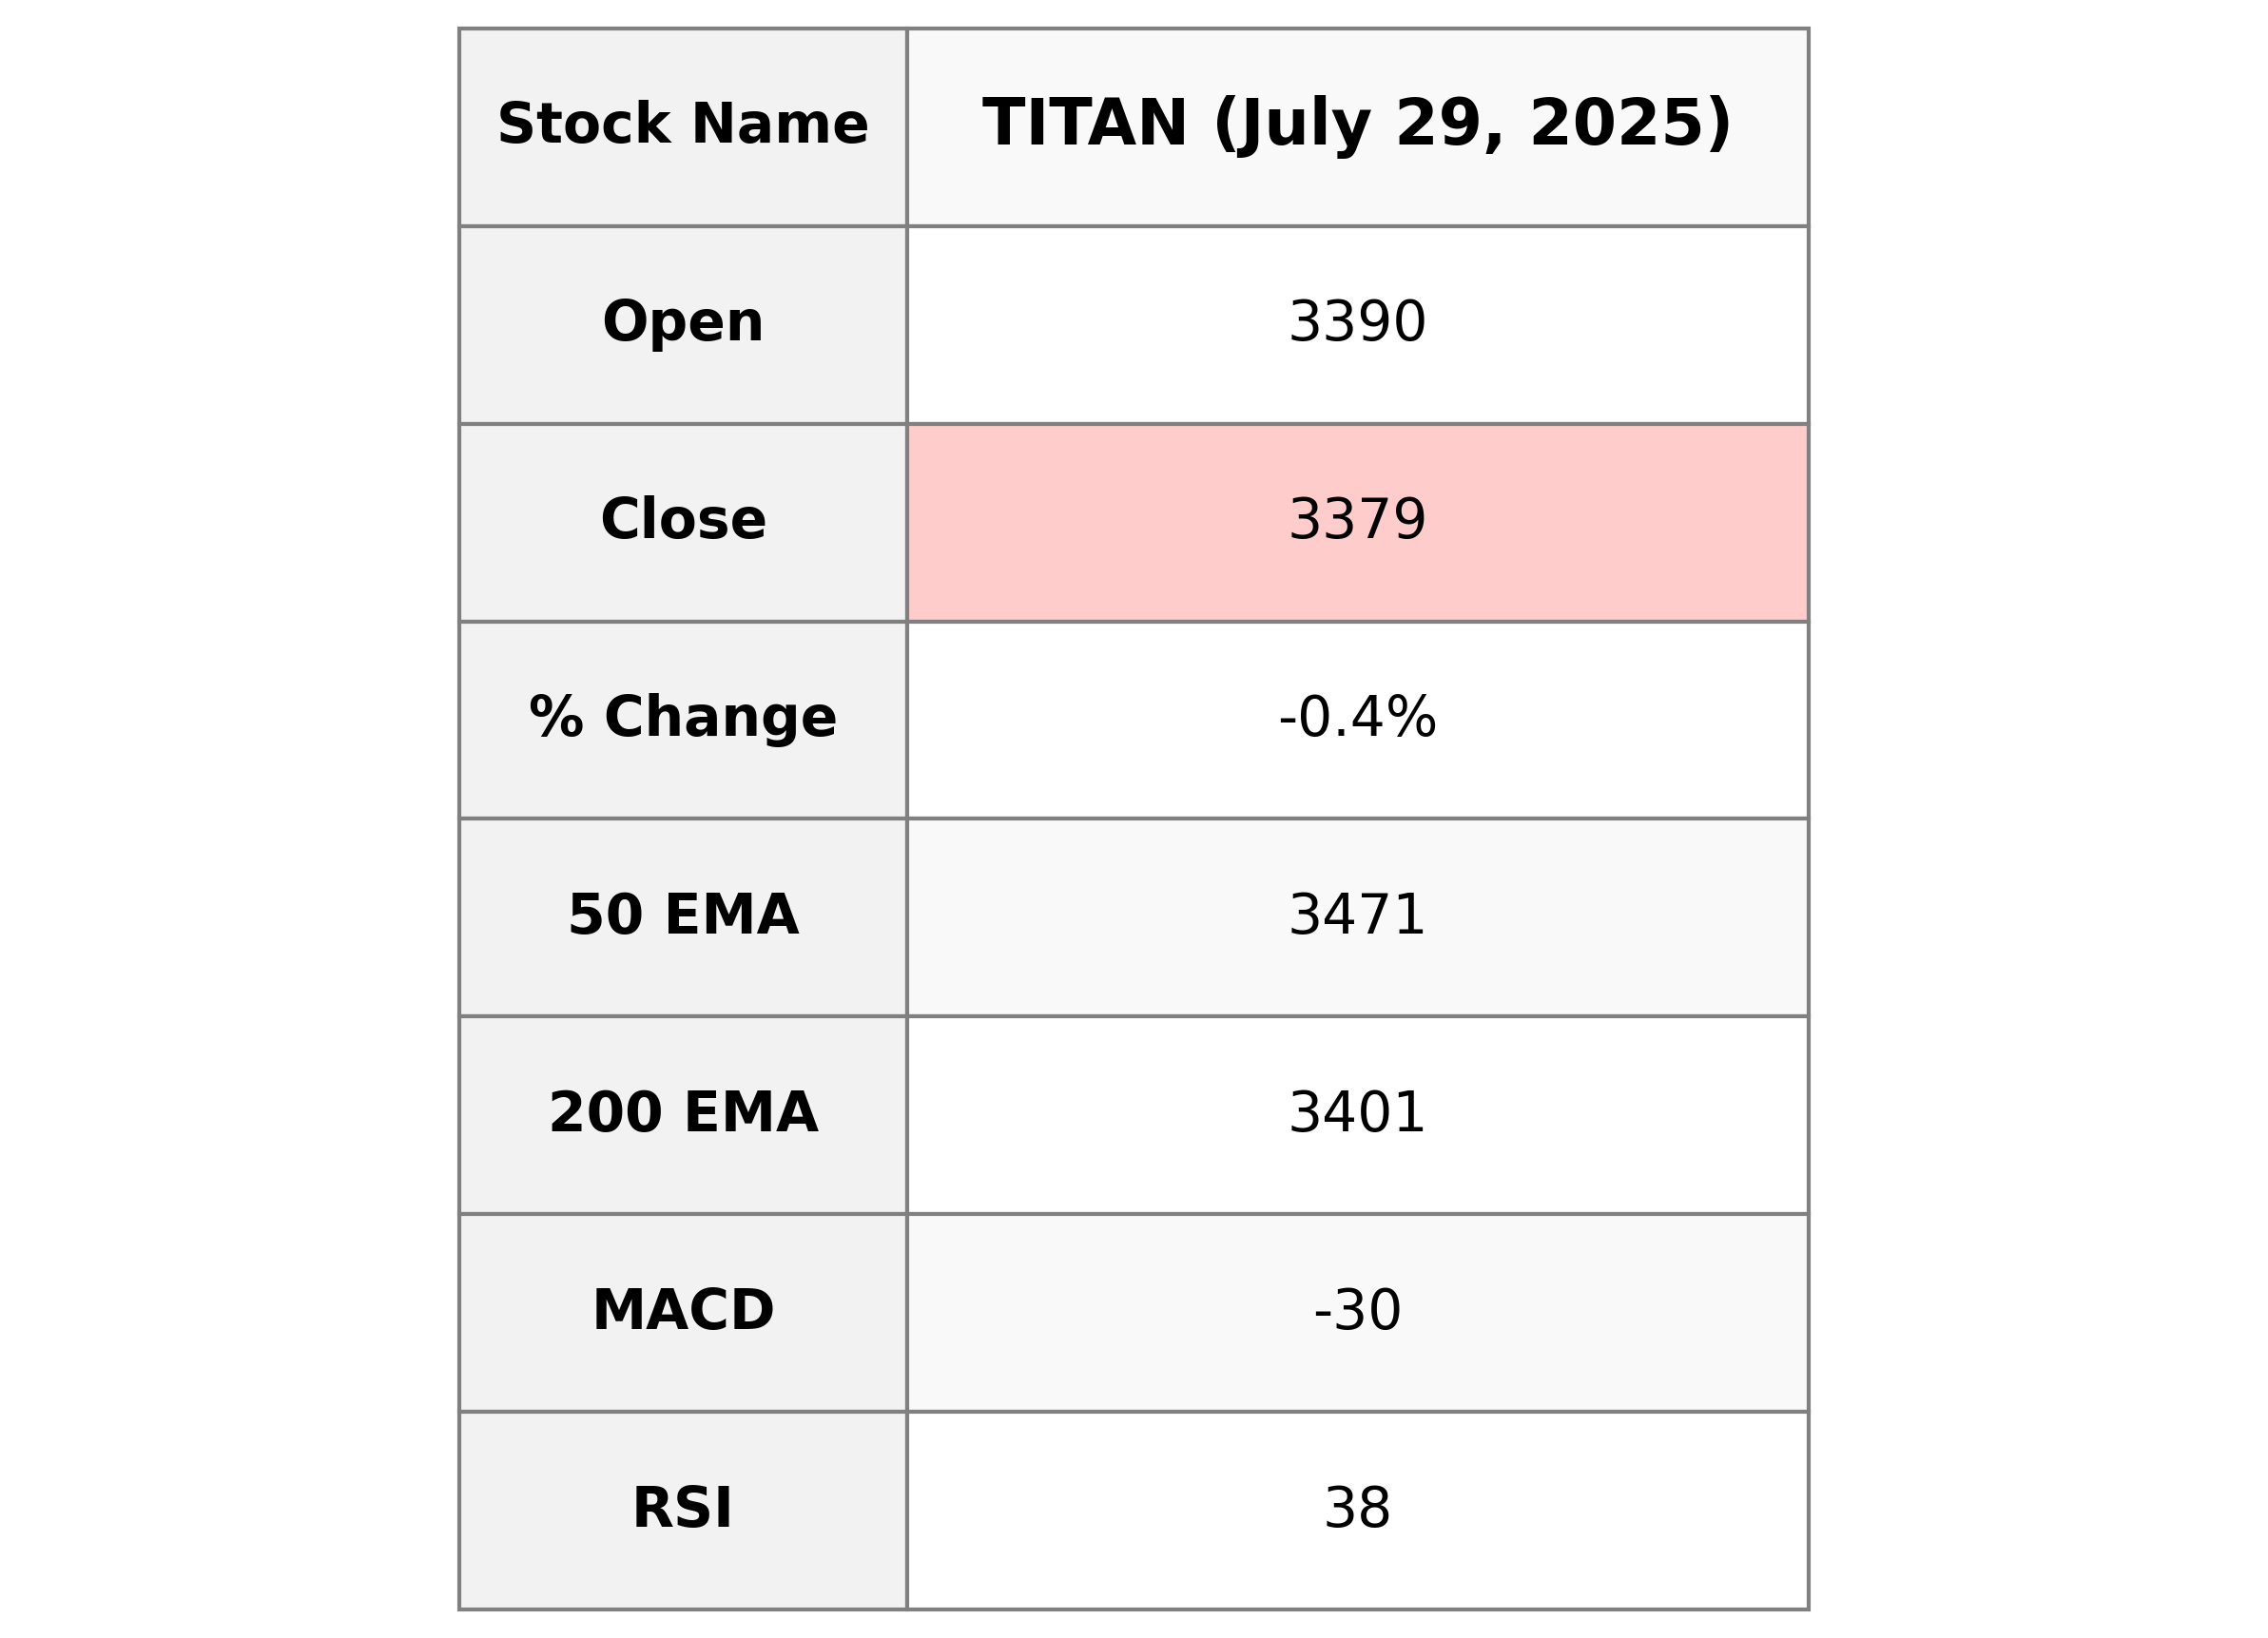
Titan Company, operating in the luxury goods sector within the consumer cyclical industry, showed a mild decrease with a close of 3379.20, down by 0.41% from the previous close of 3393. The RSI indicates a relatively weak momentum at 38.34, while the MACD reflects a bearish trend. Despite the recent performance, Titan holds a significant market cap of ₹3,238,770.51 Crores and a PE Ratio of 89.73, showcasing its strong standing in the market.
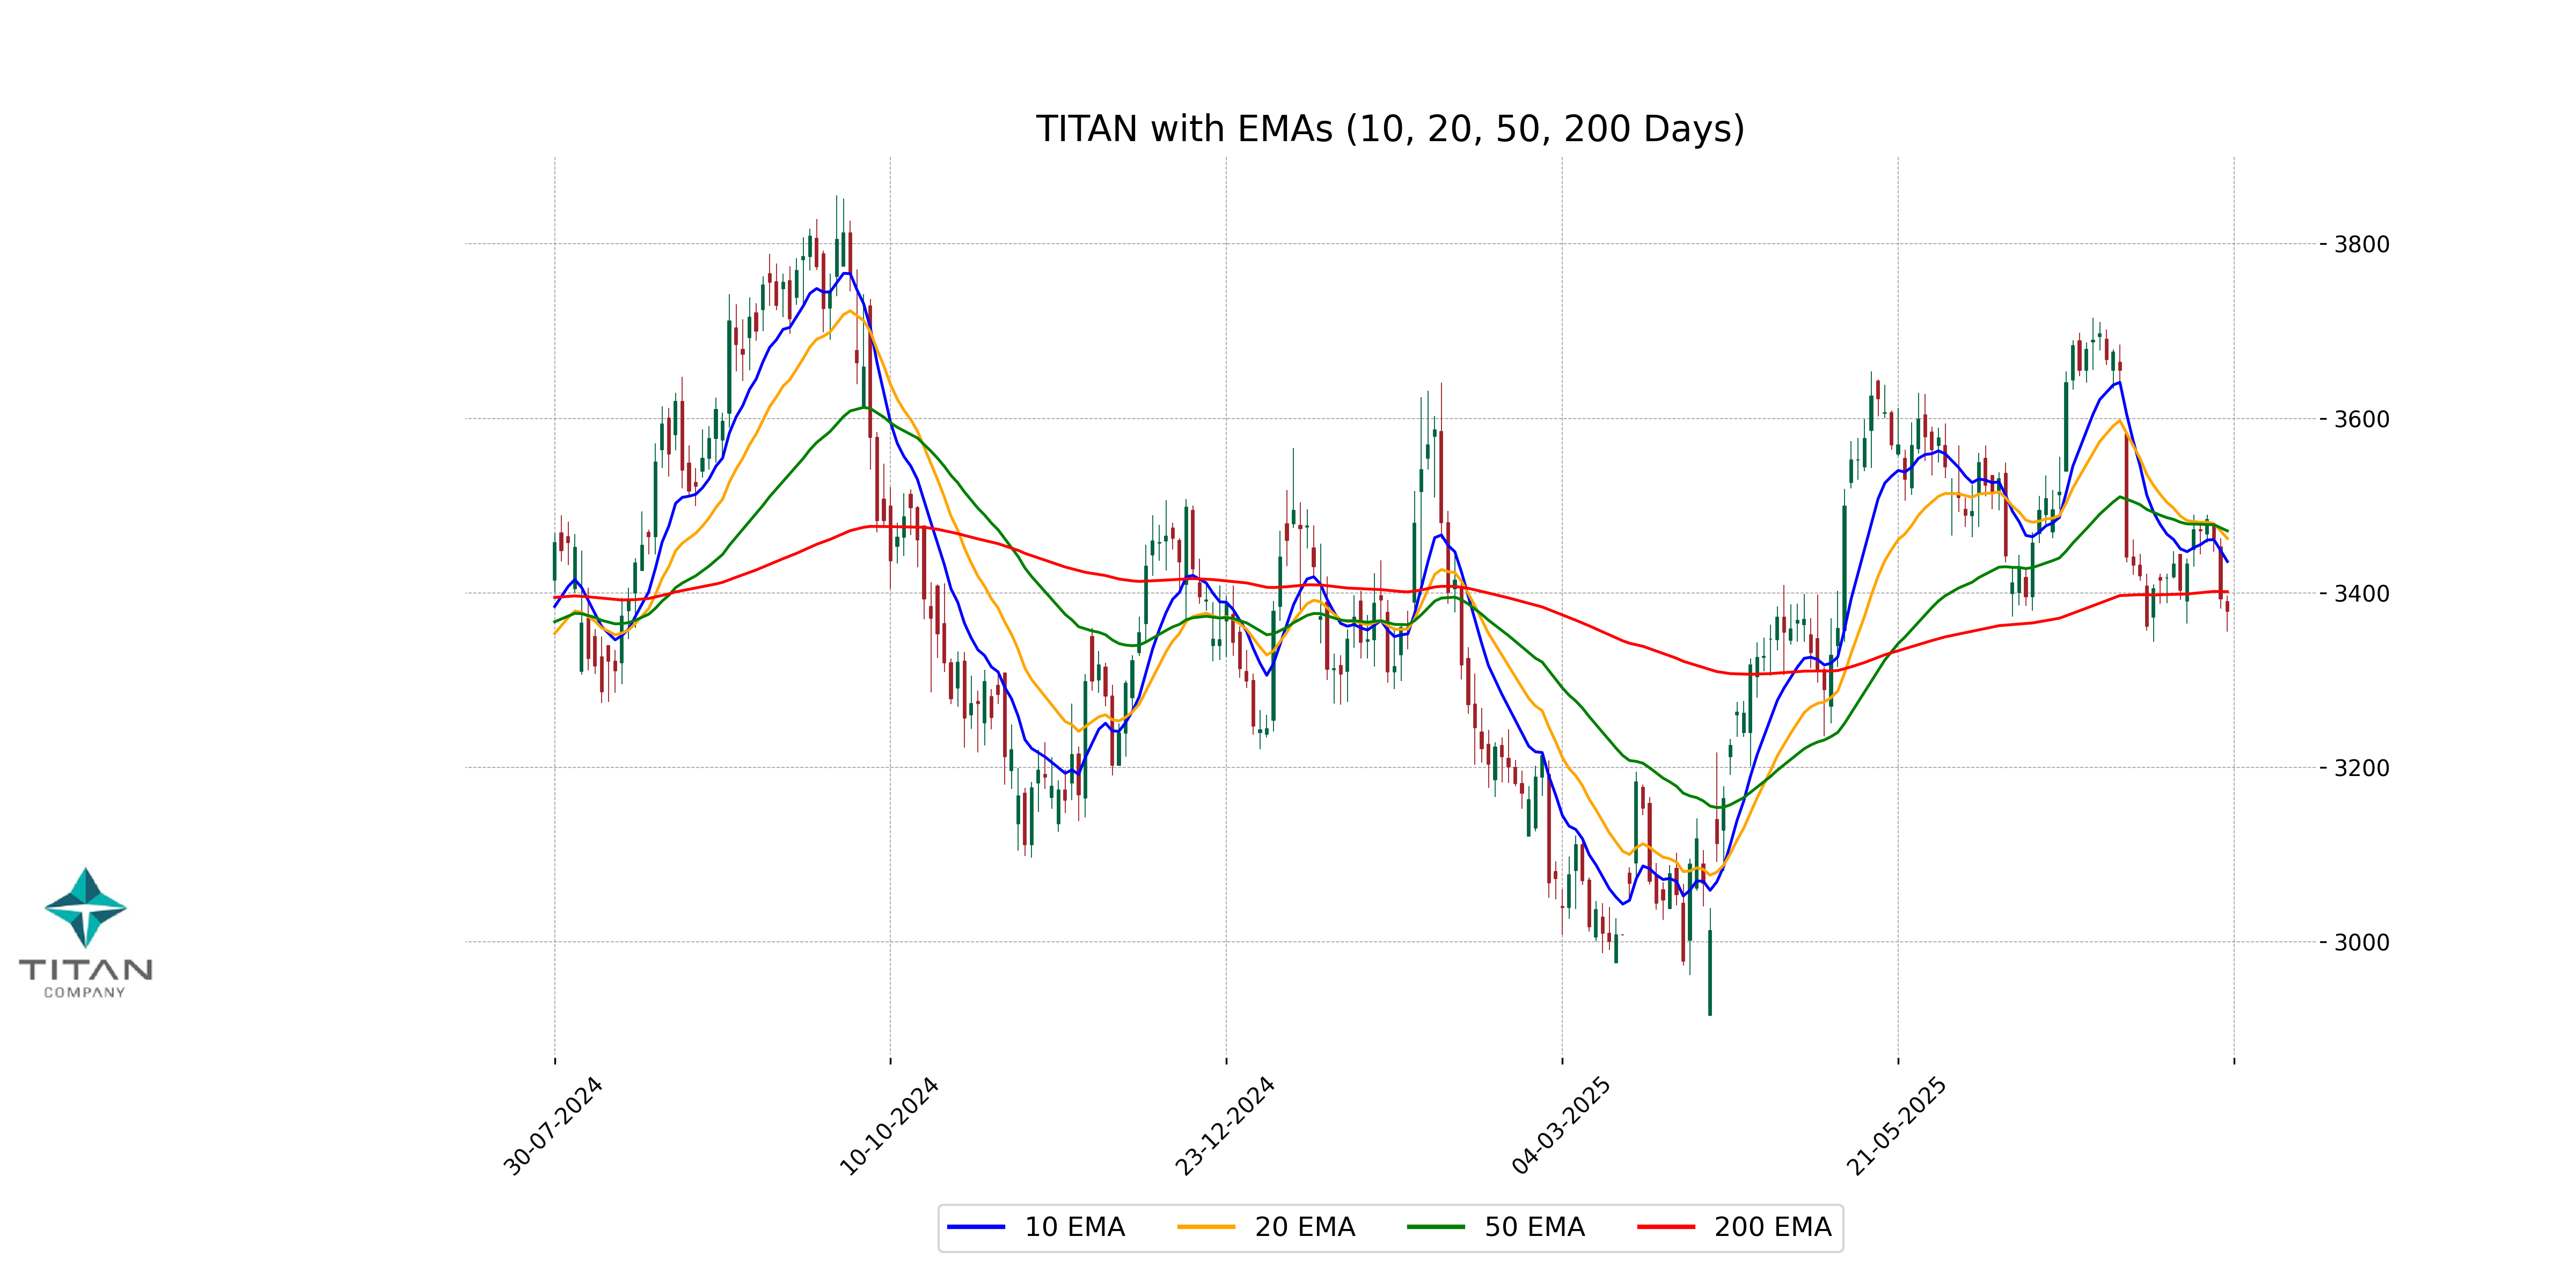
Relationship with Key Moving Averages
Based on the given data for Titan Company, the stock's closing price of 3379.20 is below the 50-day EMA of 3471.12, indicating a potential short-term downtrend. The 10-day and 20-day EMAs, at 3436.08 and 3462.50 respectively, are also above the closing price, which further supports the bearish sentiment. Additionally, the stock price is below the 200-day EMA of 3401.45, suggesting overall long-term weakness relative to major moving averages.
Moving Averages Trend (MACD)
MACD Analysis for Titan Company: The MACD value of -29.67, which is below the MACD Signal line of -23.71, indicates a bearish trend. This suggests that the stock may experience further downward momentum unless there is a reversal in price action.
RSI Analysis
RSI Analysis for Titan Company: The Relative Strength Index (RSI) for Titan Company is 38.34, which suggests that the stock is approaching the oversold territory. This indicates potential for a price rebound, as RSI values below 30 typically suggest that a stock is undervalued.
Up Next
NSE Nifty 50: Top 5 stock losers of July 29, 2025

Microsoft commits USD 17.5 billion investment in India: CEO Satya Nadella

CBI books Anil Ambani's son, Reliance Home Finance Ltd. in Rs 228 crore bank fraud case

RBI raises FY26 GDP growth projection to 7.3 pc

RBI trims policy interest rate by 25bps to 5.25pc, loans to get cheaper

Rupee slumps to all-time low of 90.25 against US dollar in intra-day trade

More videos

Reliance completes merger of Star Television Productions with Jiostar

India to lead emerging market growth with 7pc GDP rise in 2025: Moody’s

Nifty hits record high after 14 months; Sensex nears all-time peak

Reliance stops Russian oil use at its only-for-export refinery to comply with EU sanctions

ED attaches fresh assets worth over Rs 1,400 cr in case against Anil Ambani's Reliance Group

India signs one-year deal to import 2.2 million tonnes of LPG from US

India International Trade Fair begins at Pragati Maidan amid tight security

Stock markets decline in initial trade on foreign fund outflows, weak Asian peers

Amazon to lay off 30,000 office workers amid AI-driven cost cuts

US sanctions on Russian firms to hit Reliance; PSUs likely to keep buying Russian oil via traders