


Highlights
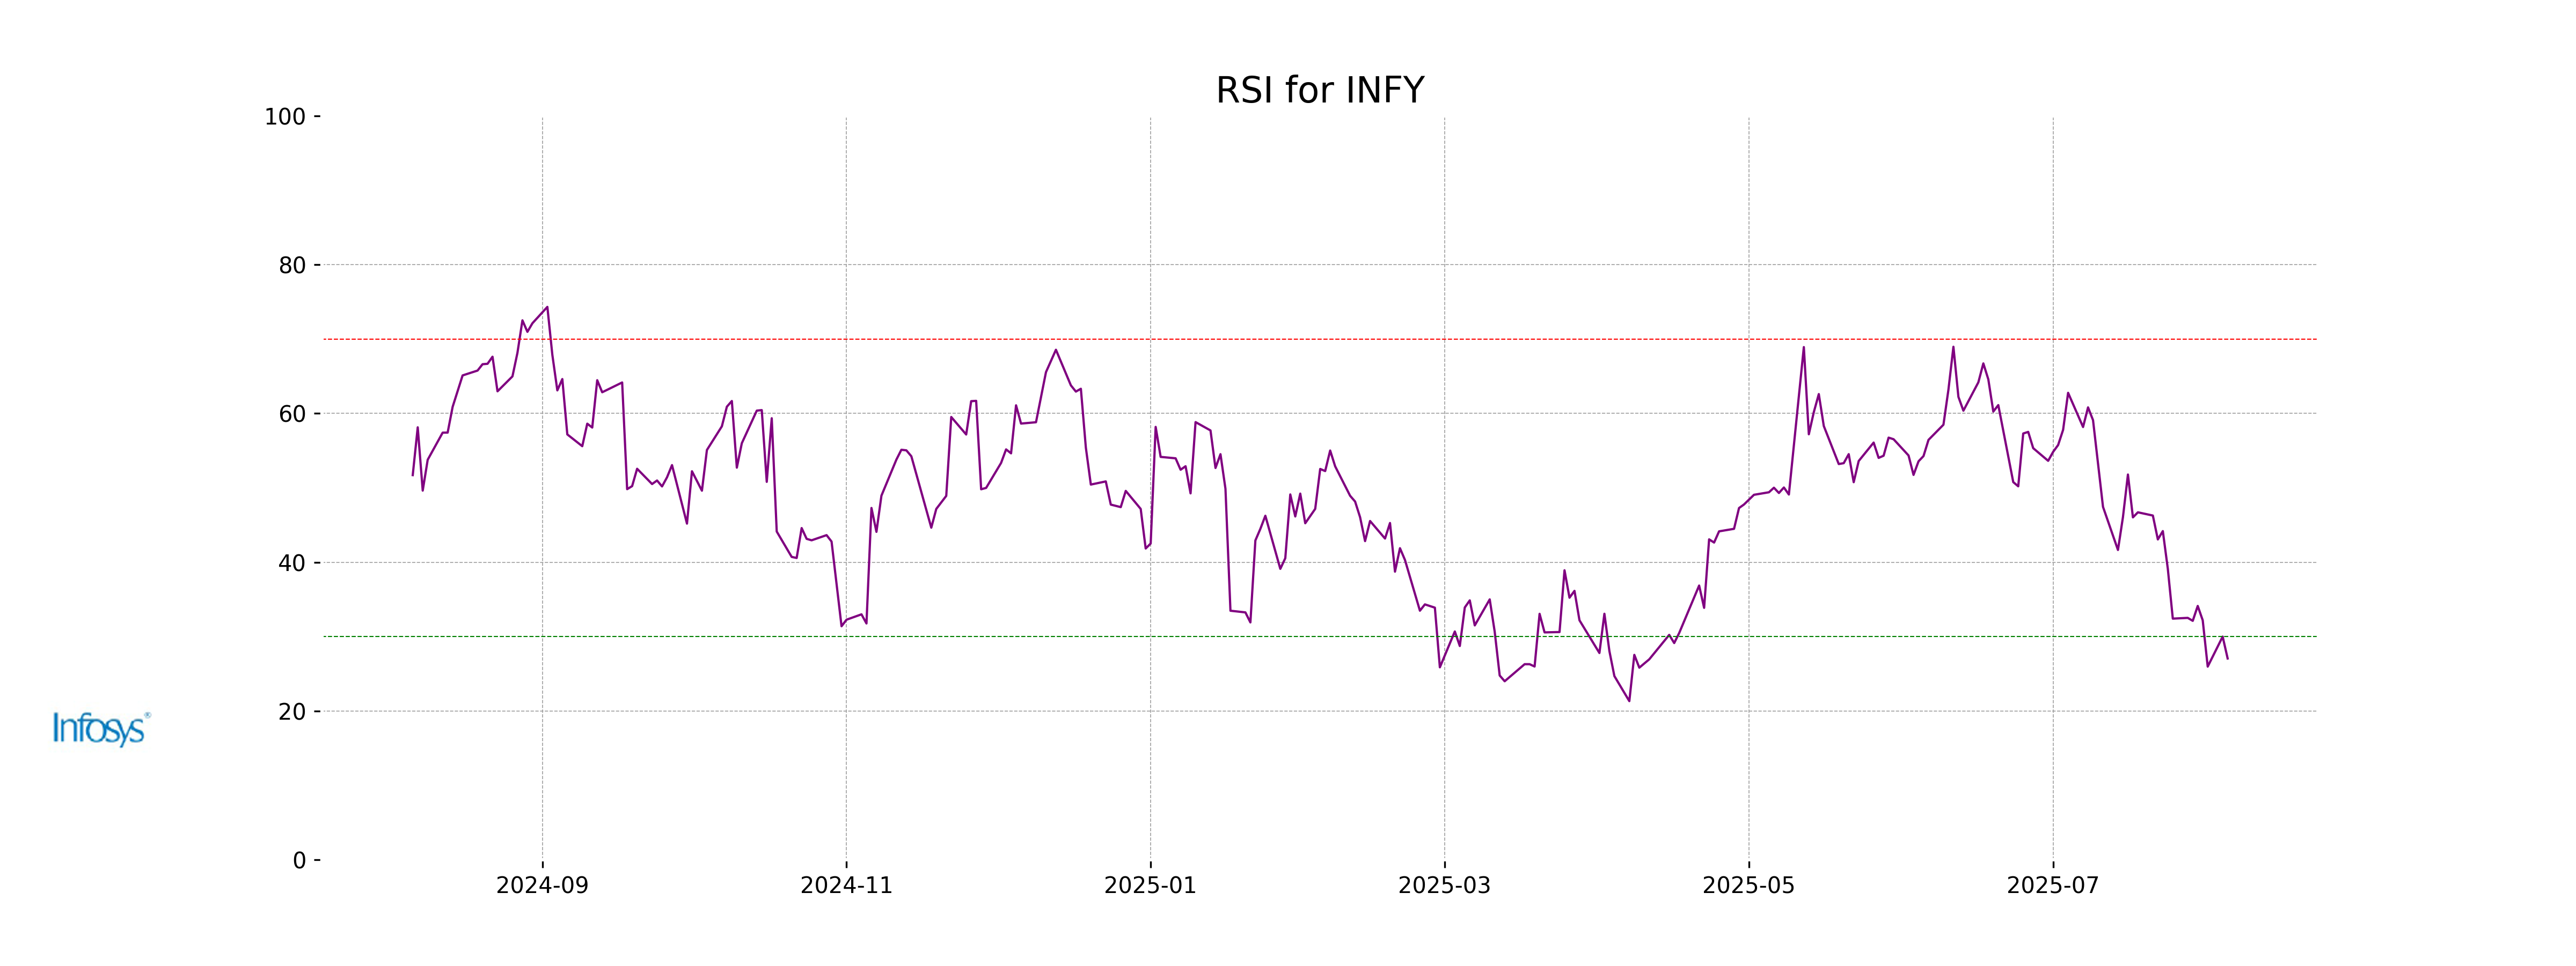
- Adani Ent, Infosys RSI below 30, oversold
- All stocks trade below 10, 20, 50 EMAs
- MACD bearish for all, signals weak momentum
Latest news

India's semiconductor push gains momentum as Odisha signs chip technology MoU with Intel, 3DGS

ScamMukt Launches India's Dedicated AI Scam Protection App -- Because Spotting a Scam Is Now a Basic Survival Skill for Every Indian

Lakshya Powertech Limited Announces H2 FY26 and FY26 Results

Delhi HC issues summons, signals interim protection for actor Naga Chaitanya's personality rights

Why My Interior Designers Is Becoming Relevant to Both Interior Seekers and Interior Professionals in India

Subhash Ghai shares glimpse from Salman Khan's 'Maatrubhumi' screening, wishes him "grand success"

boAt launches India's first Type-C charging Smartwatch lineup

Tim Hortons® India Introduces All-New Refreshing Matcha Coolers
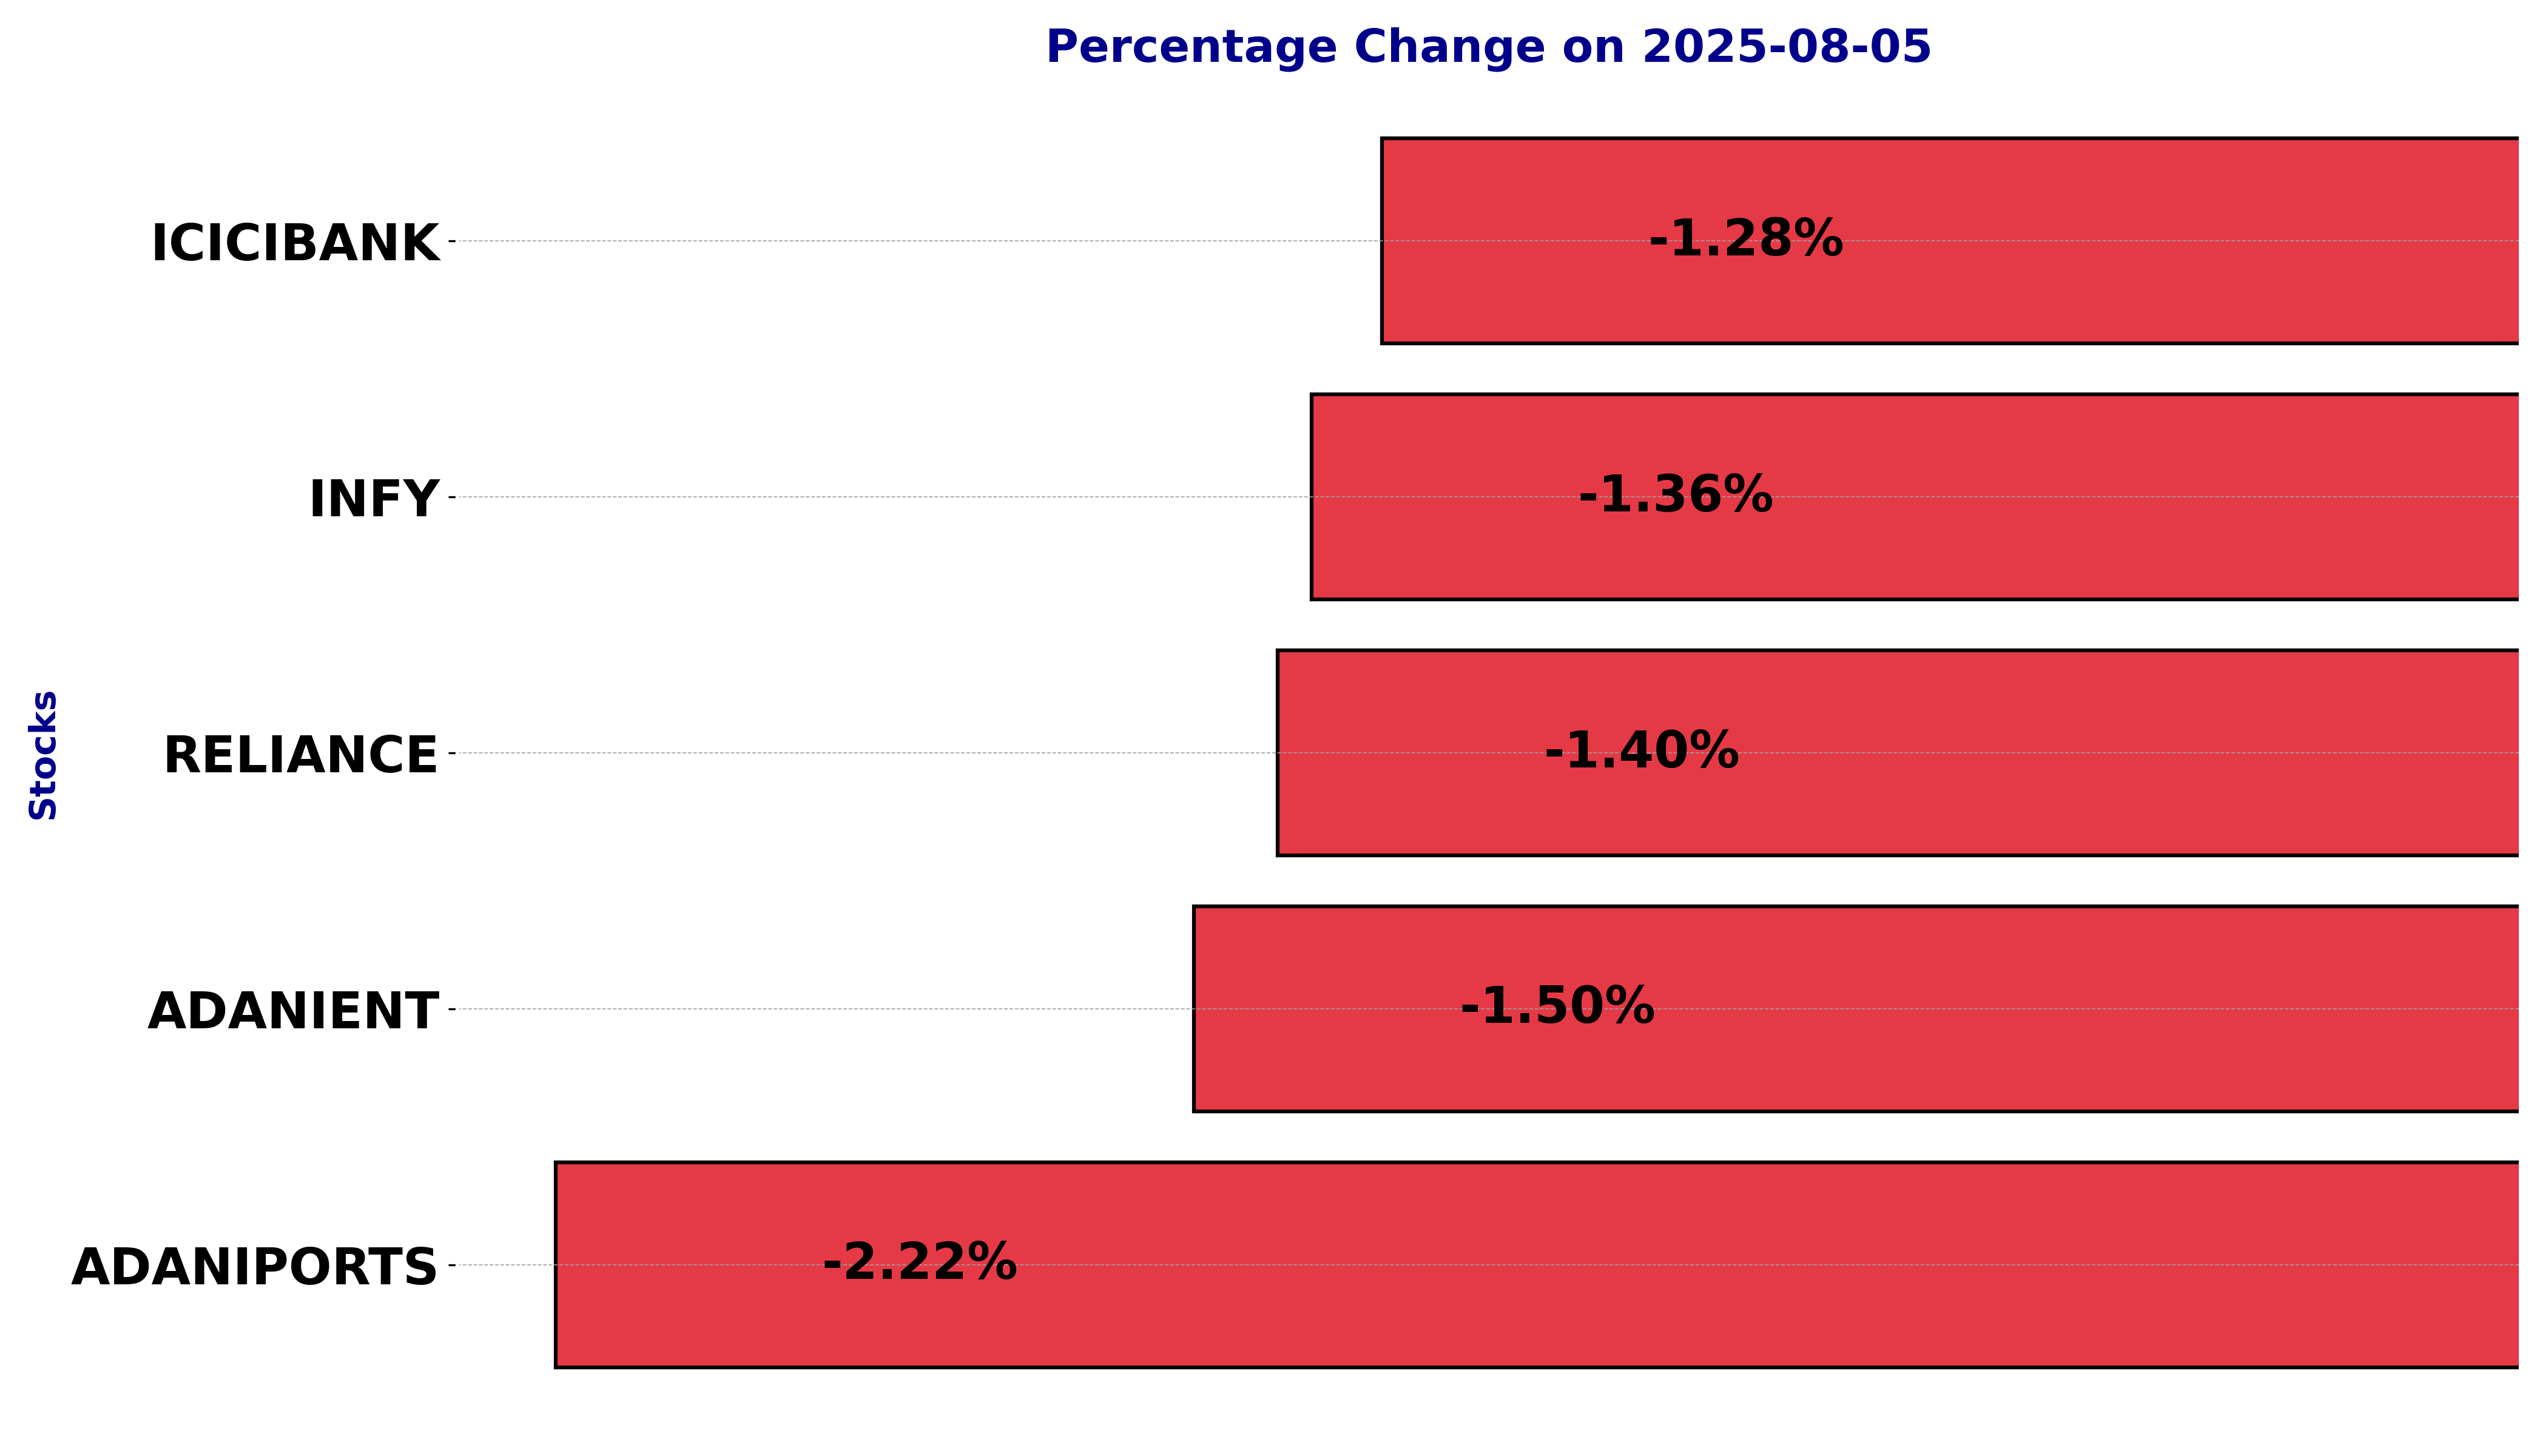
NSE Nifty 50: Top 5 stock losers of August 5, 2025


In this article, we will explore the technical indicators of some of the low-performing stocks on the Indian stock market, including ADANIENT, ADANIPORTS, ICICIBANK, INFY, and RELIANCE.
By looking at these stocks through the lens of key technical factors, we aim to better understand their price movements, trends, and potential future performance.
Analysis for Adani Enterprises - August 05, 2025
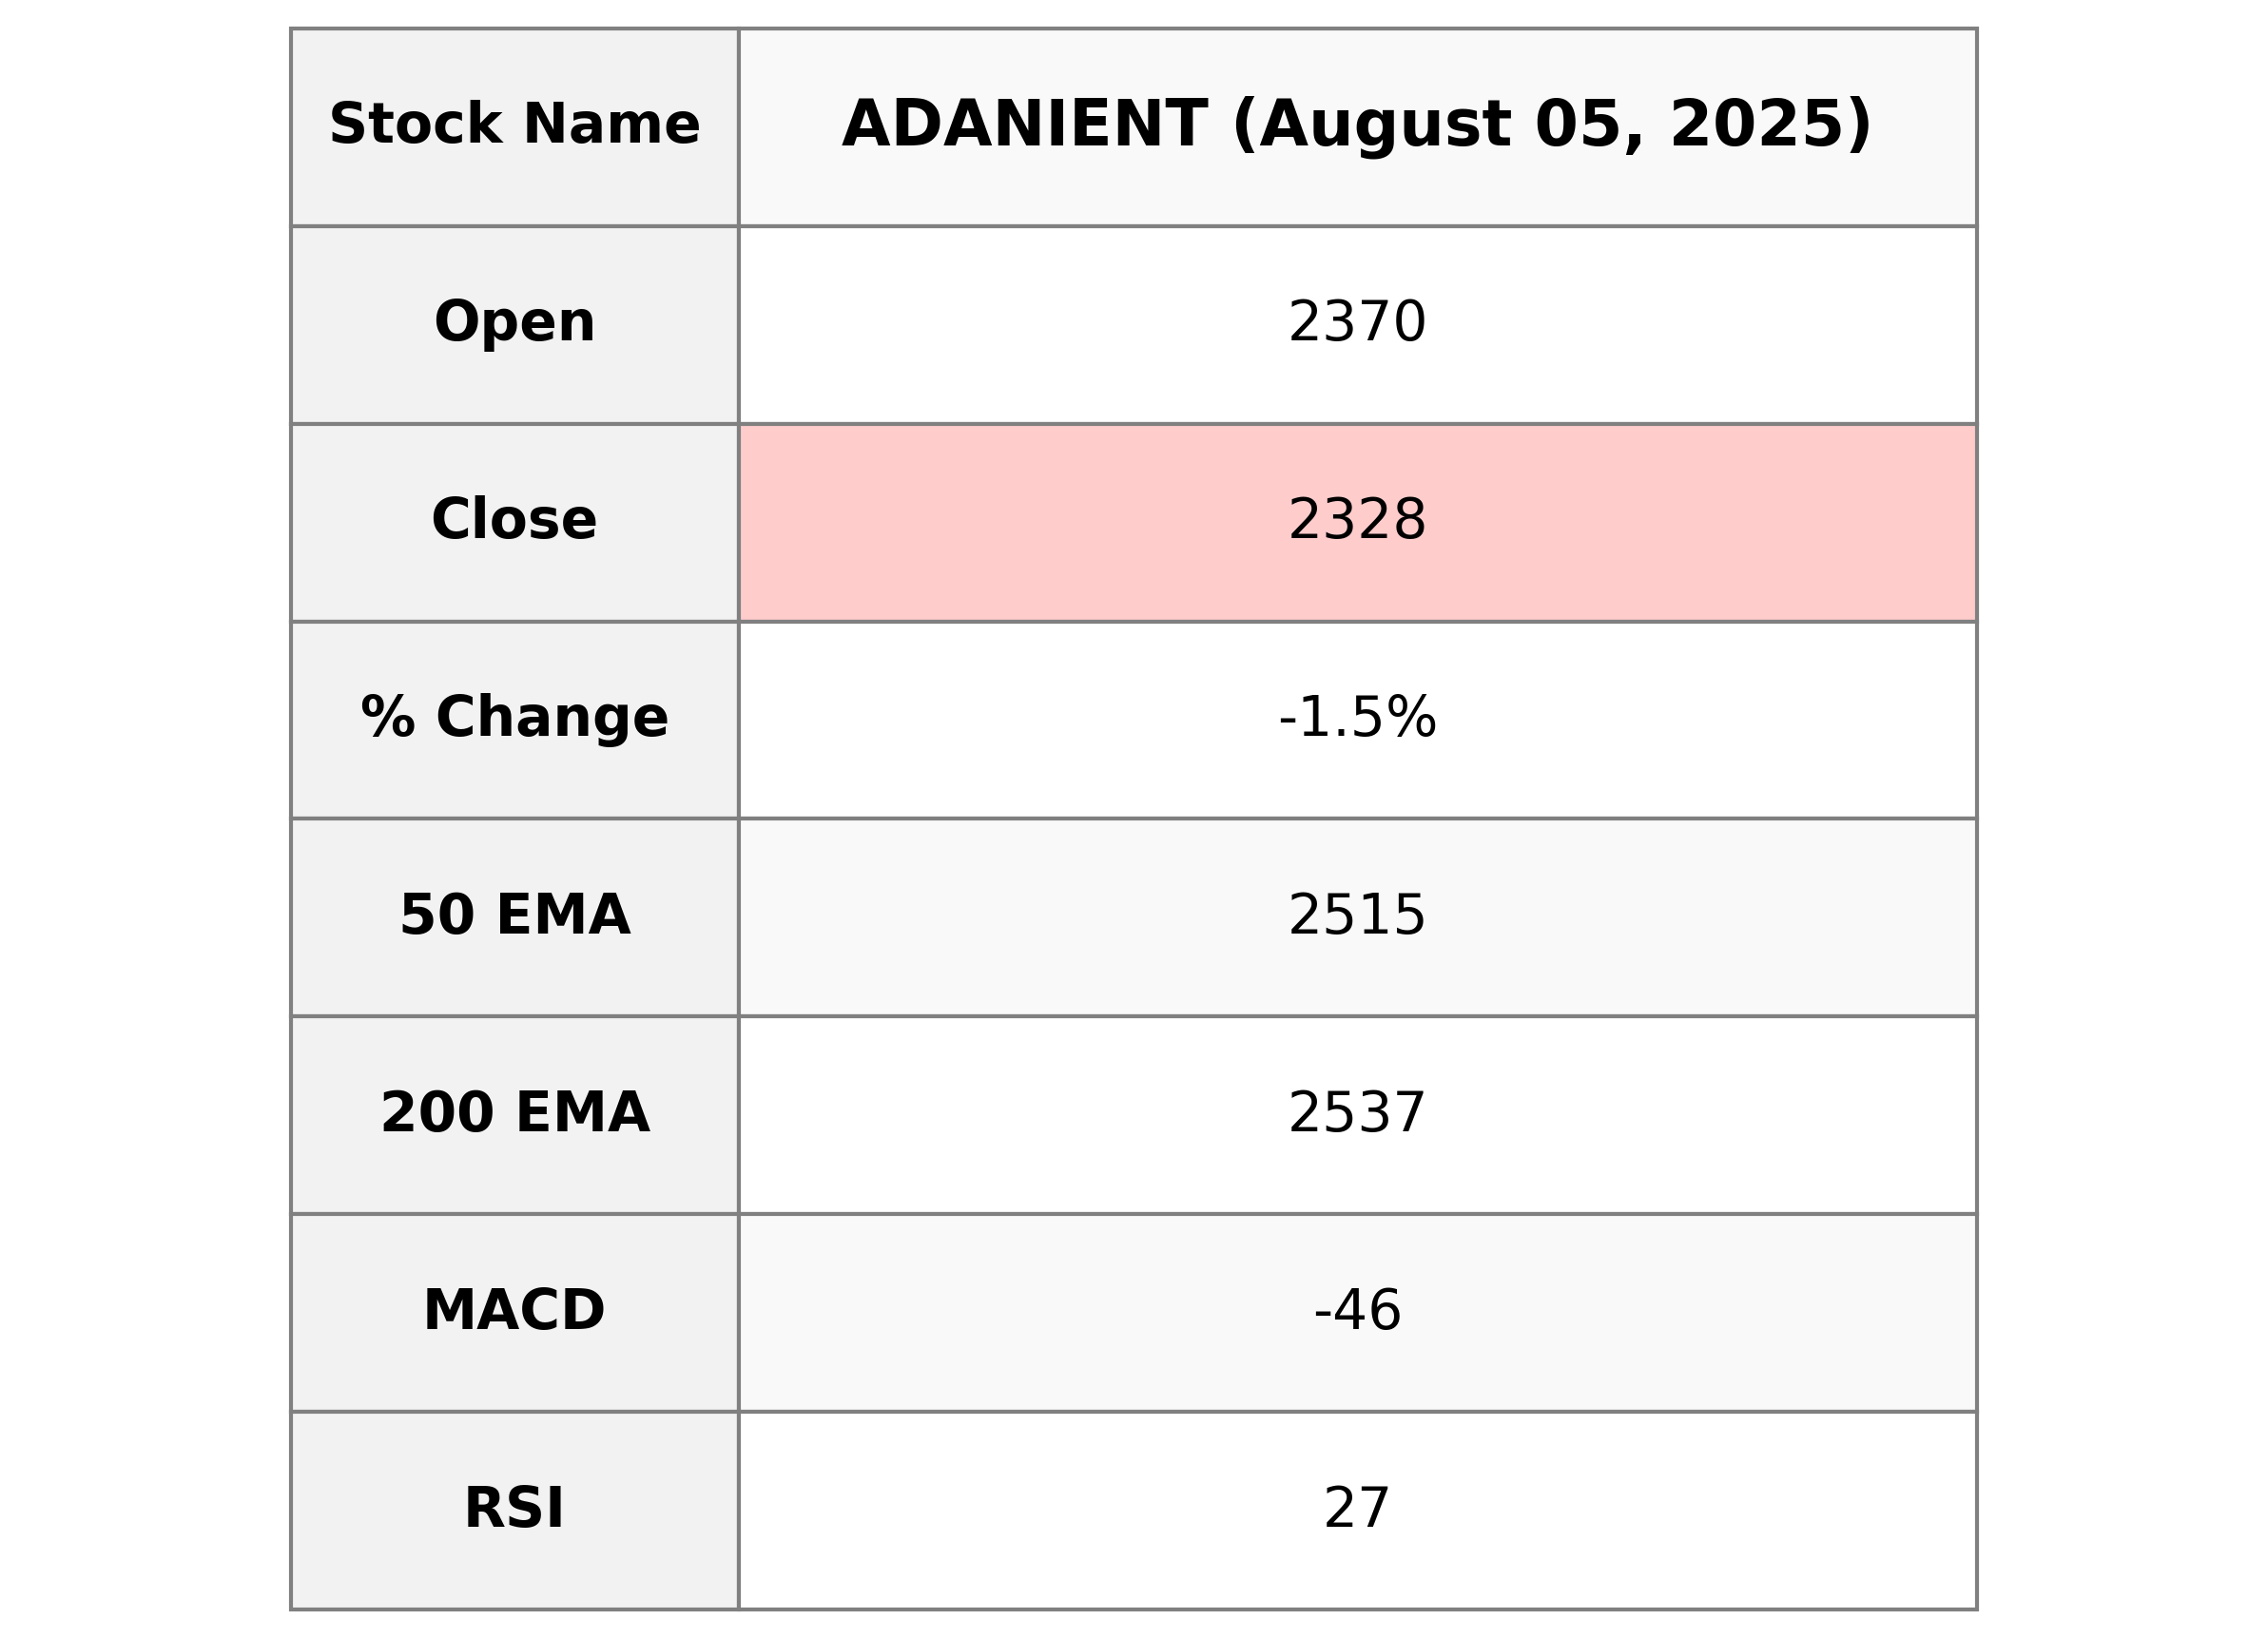
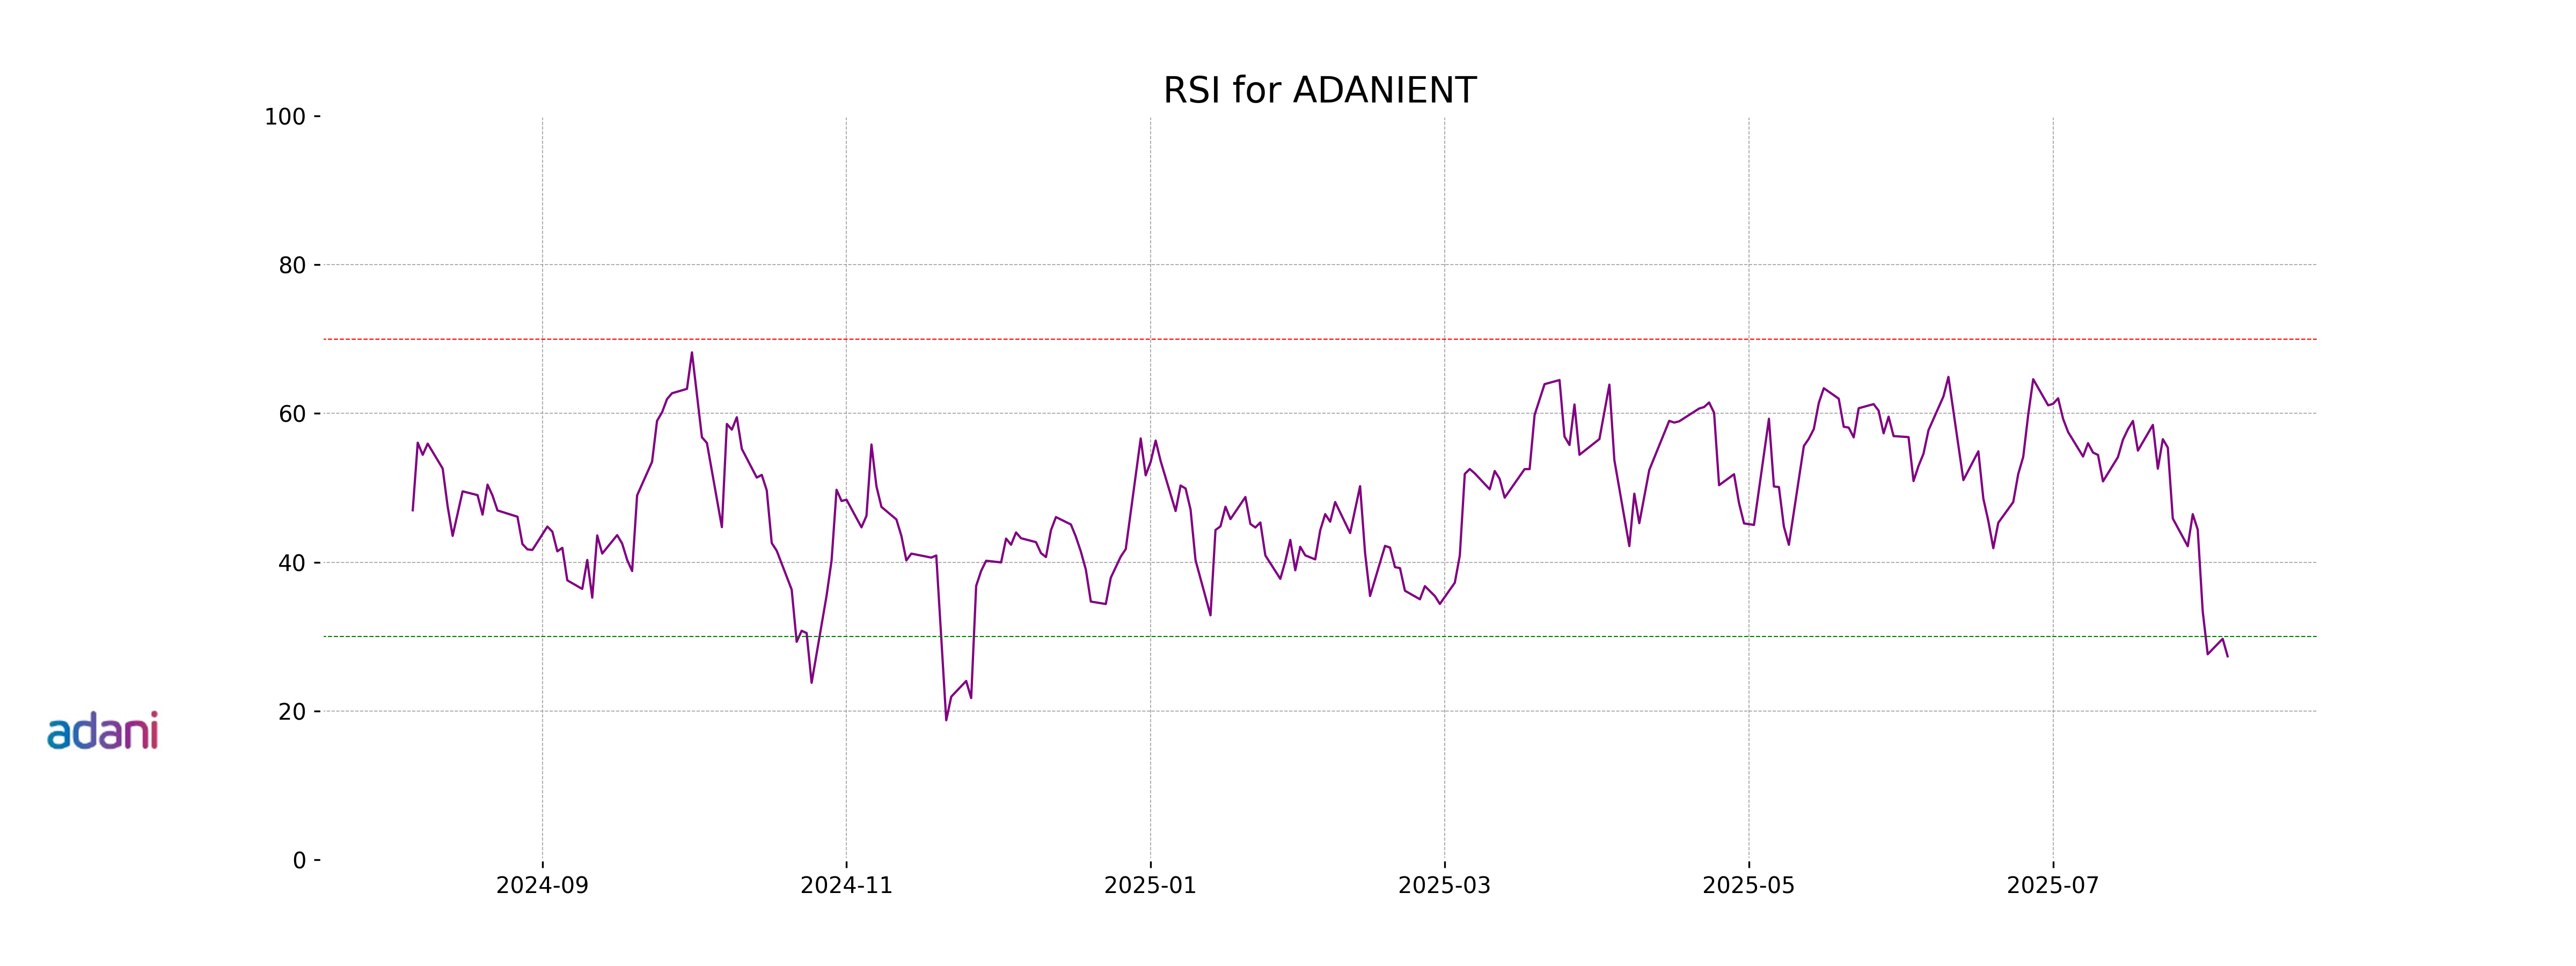
Adani Enterprises, listed in the Energy sector with a focus on Thermal Coal in India, recently closed at 2328.20, experiencing a decline of approximately 1.50% from the previous close. With a low RSI of 27.35, the stock indicates an oversold condition, signaling potential bearish momentum. The stock's current market cap stands at approximately ₹2.69 trillion.
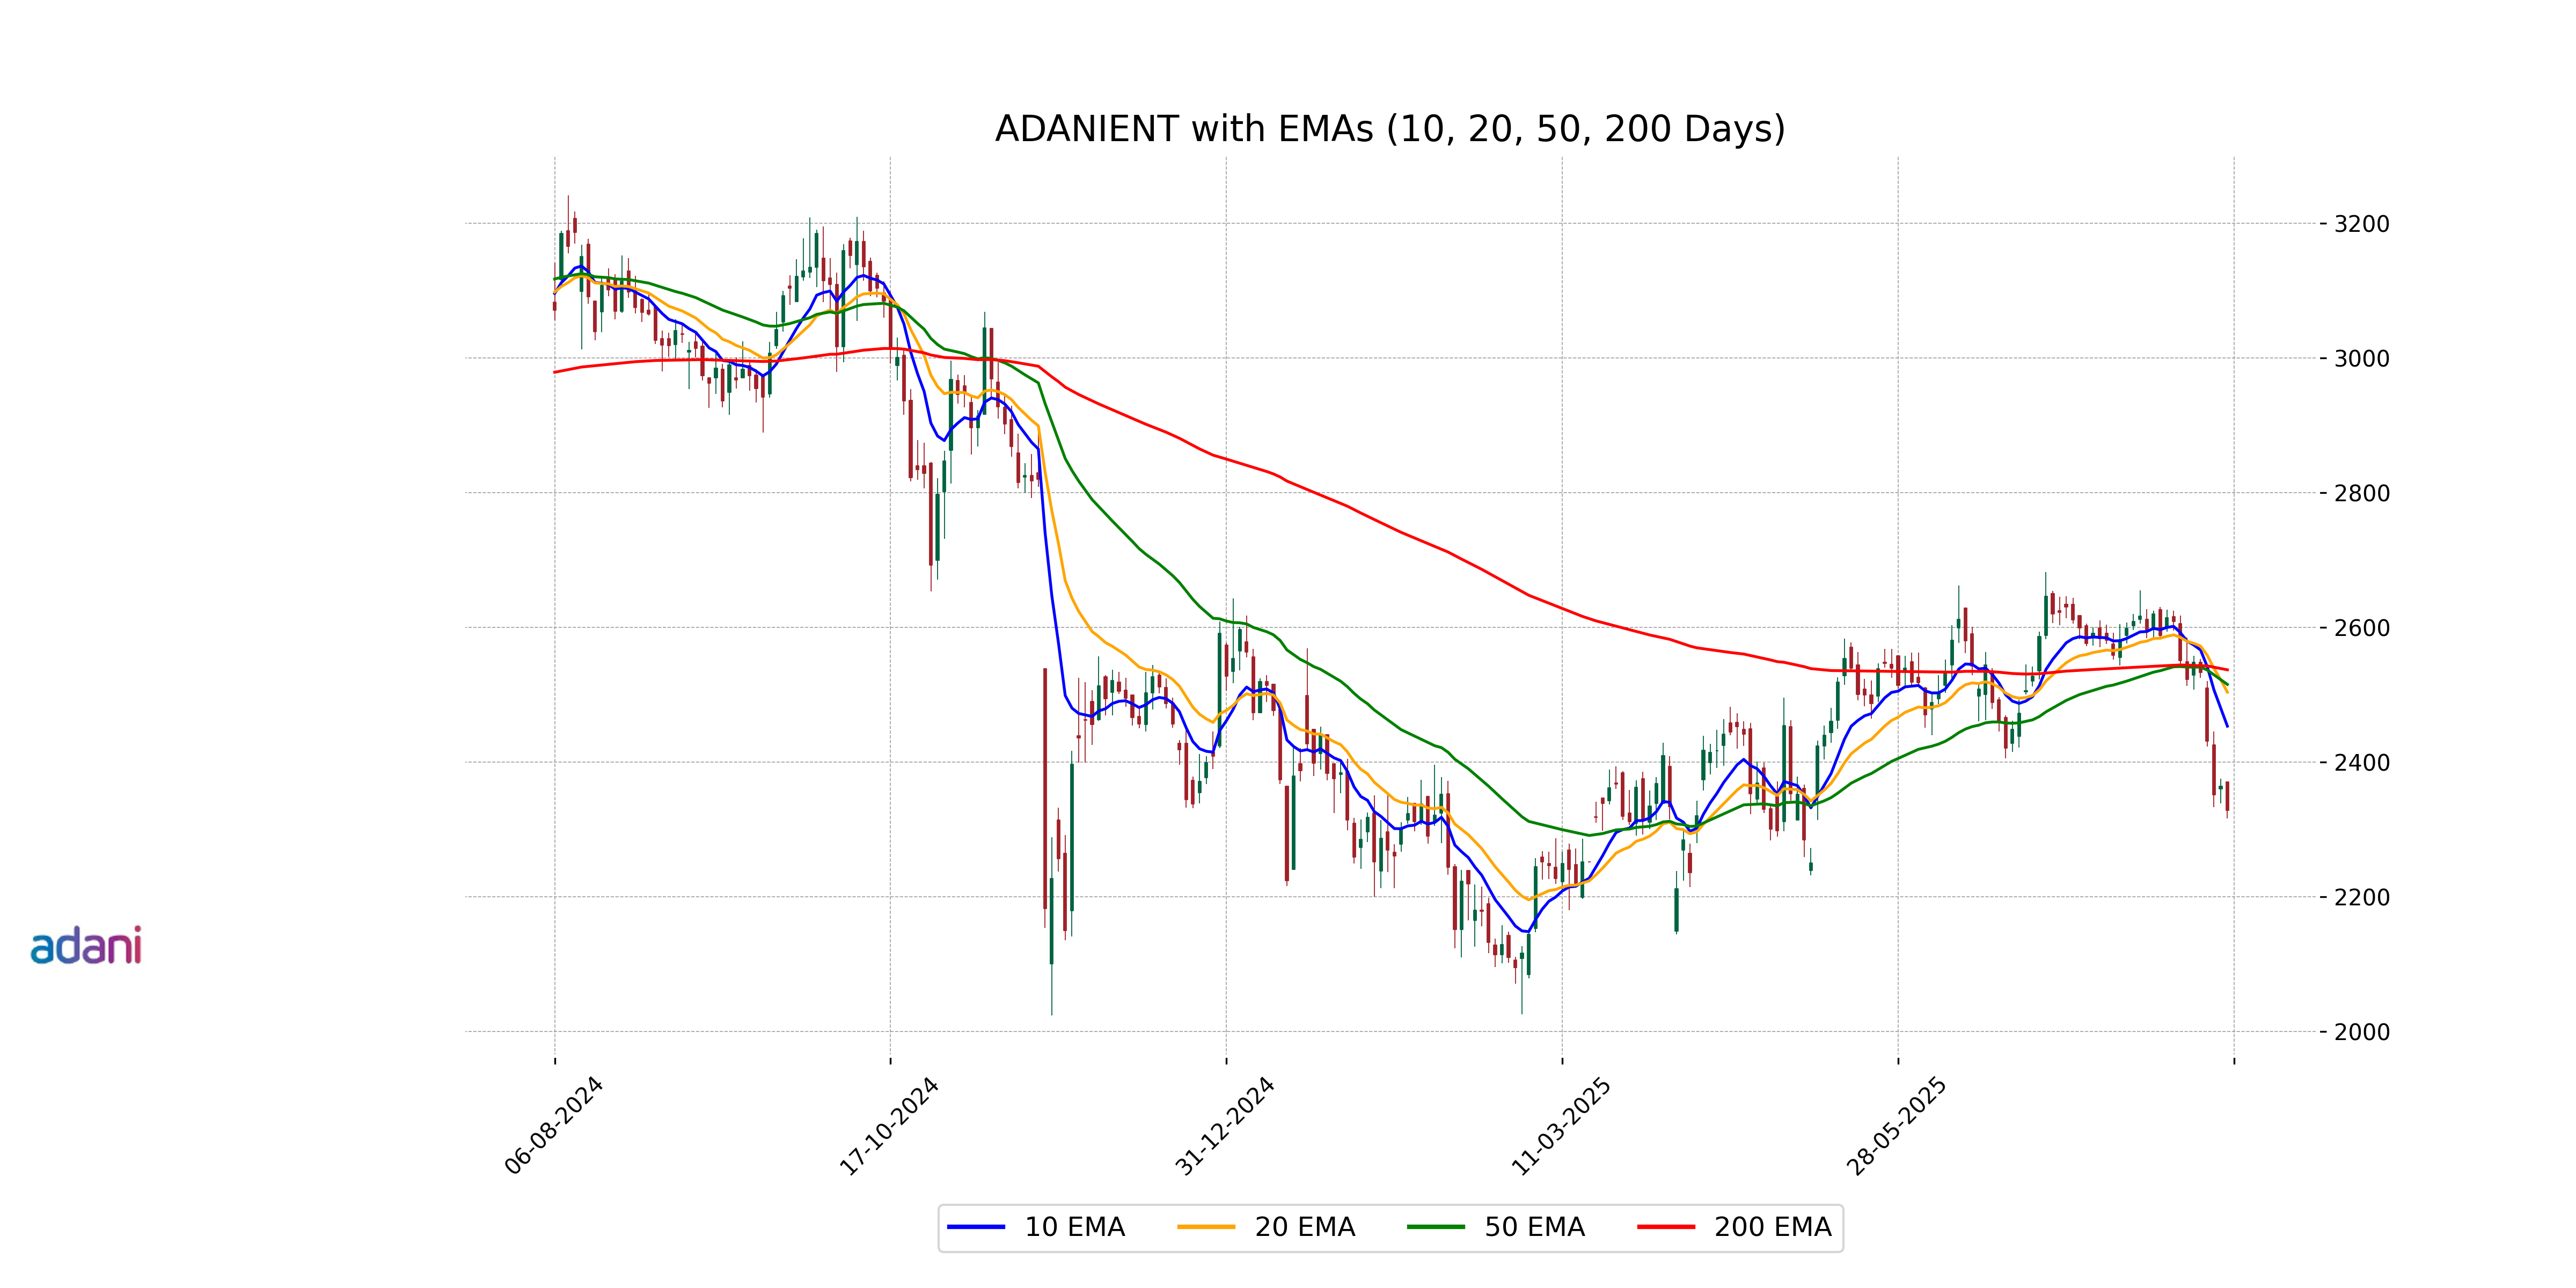
Relationship with Key Moving Averages
Adani Enterprises is currently trading below its key moving averages, with the stock price at 2328.20 compared to the 50 EMA of 2515.09, the 200 EMA of 2536.78, the 10 EMA of 2453.09, and the 20 EMA of 2503.58. This indicates bearish momentum in the short-term and long-term trends.
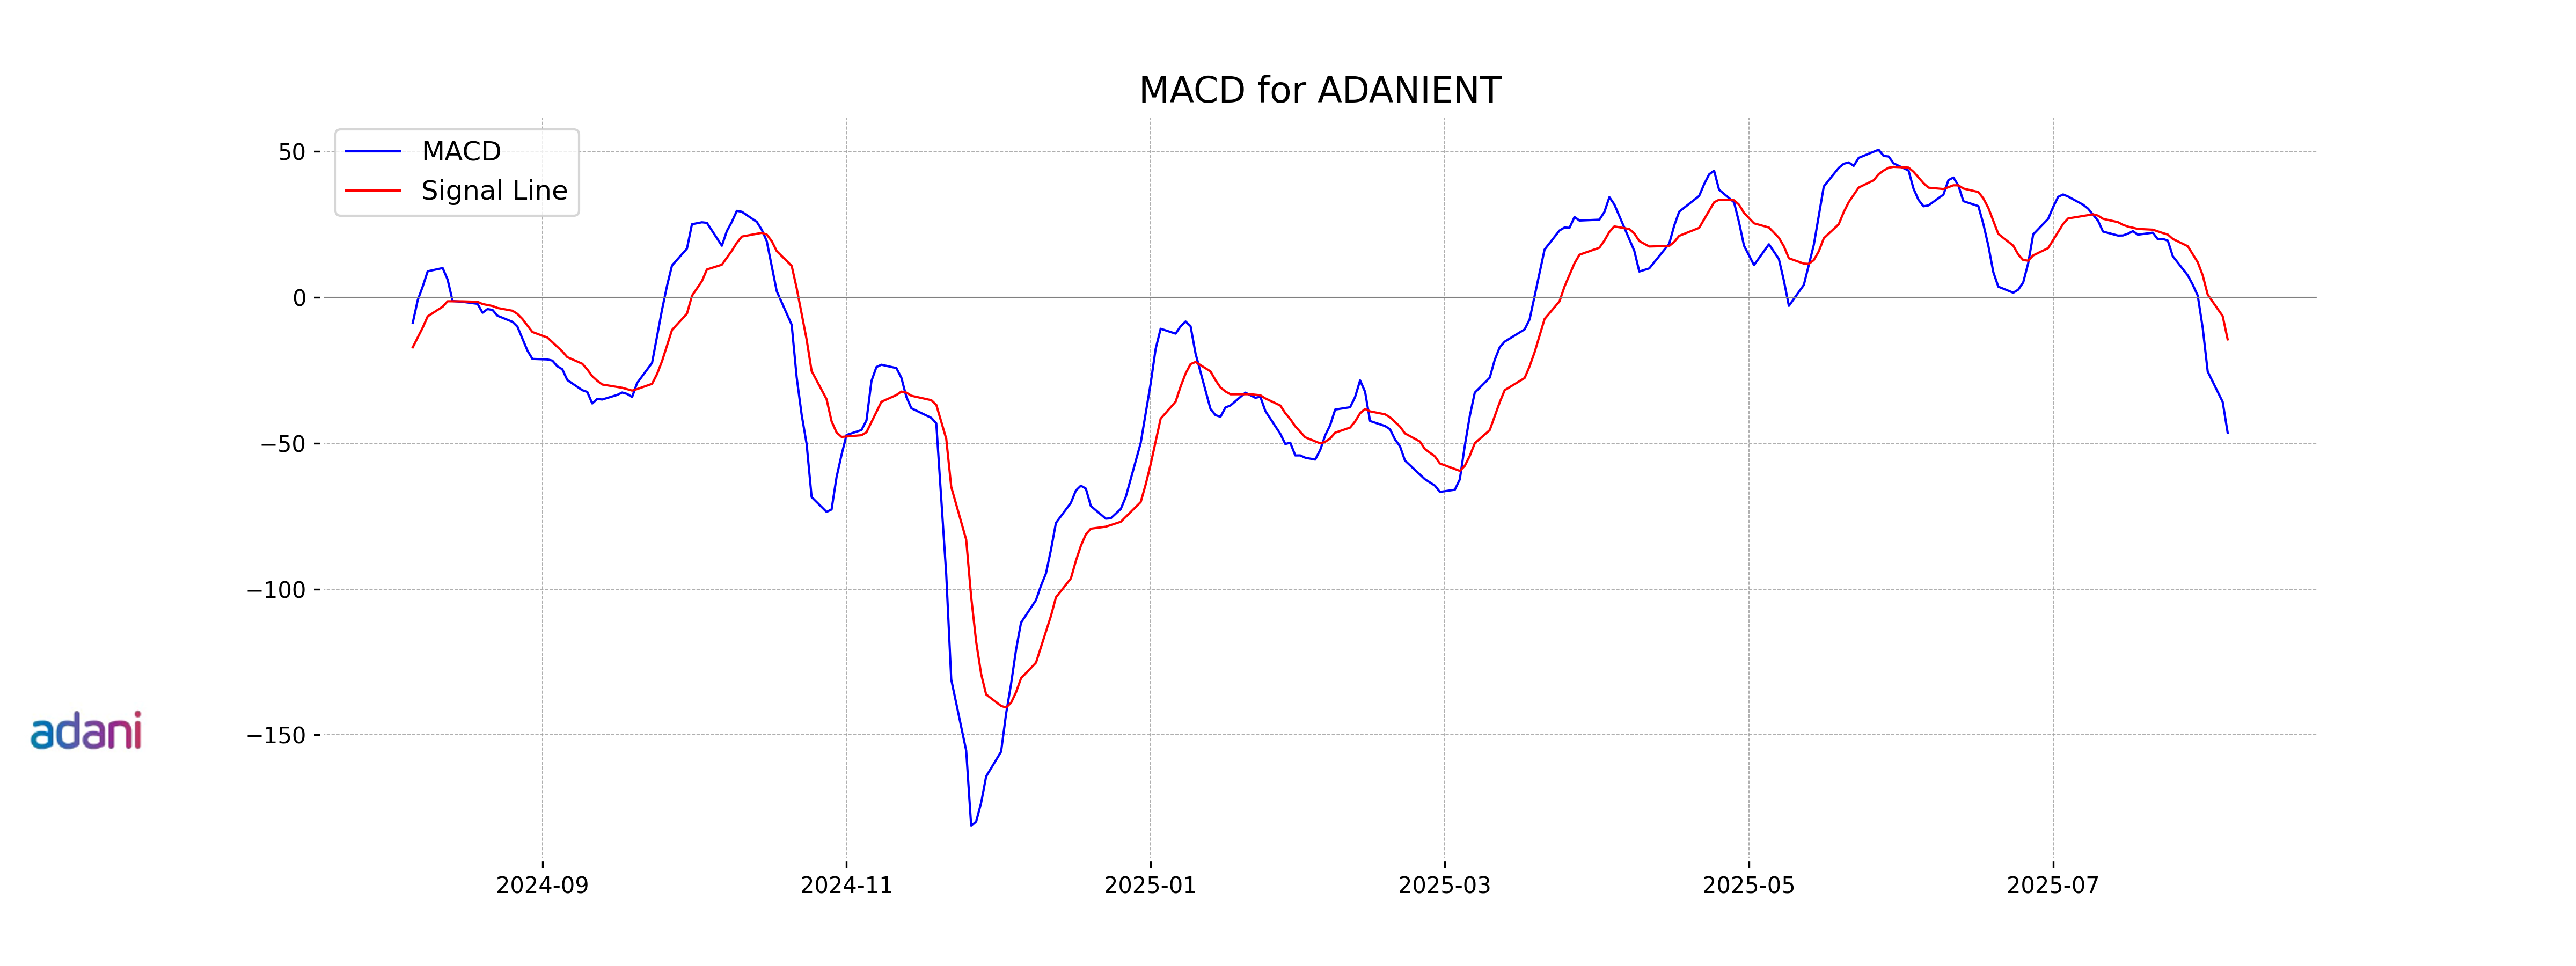
Moving Averages Trend (MACD)
Adani Enterprises is showing a bearish trend as indicated by the MACD value of -46.40, which is below the MACD Signal of -14.42. This suggests that the stock might continue to experience downward momentum in the short term.
RSI Analysis
Adani Enterprises' RSI (Relative Strength Index) is 27.35, indicating that the stock is currently in the oversold zone. Typically, an RSI below 30 suggests that the stock may be undervalued and could experience a potential price reversal or upward movement in the near future.
Analysis for Adani Ports - August 05, 2025
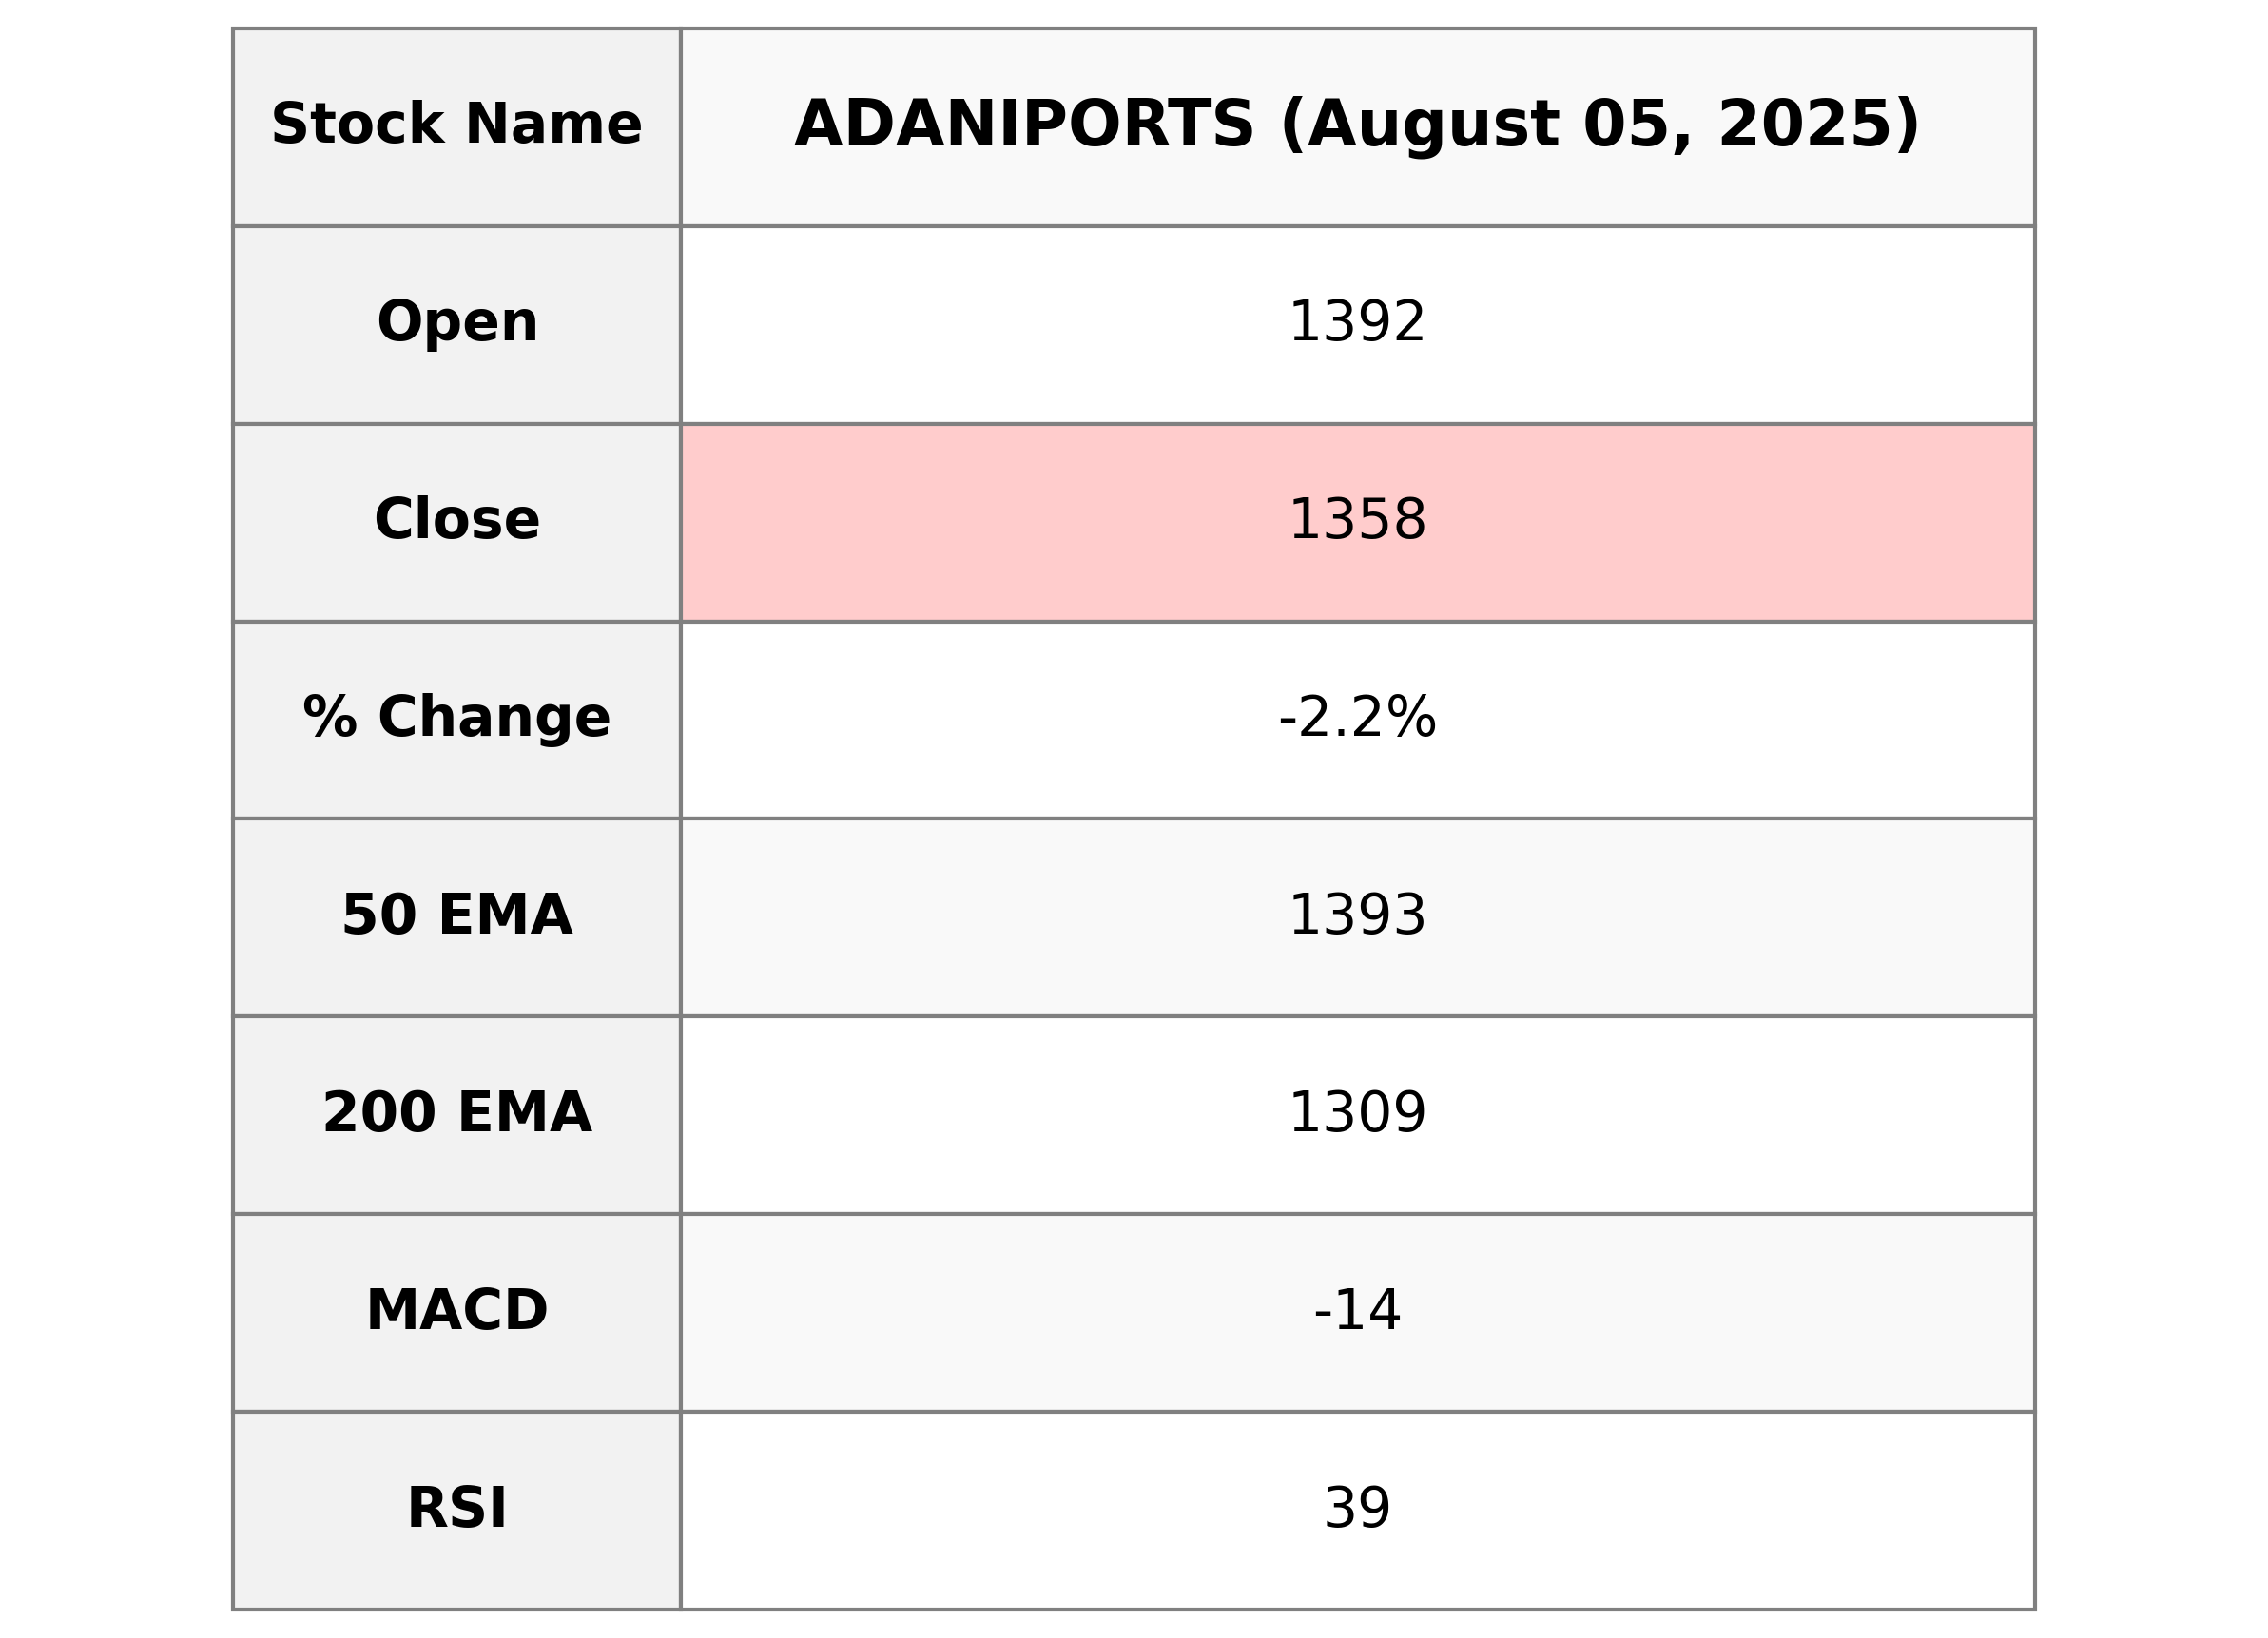
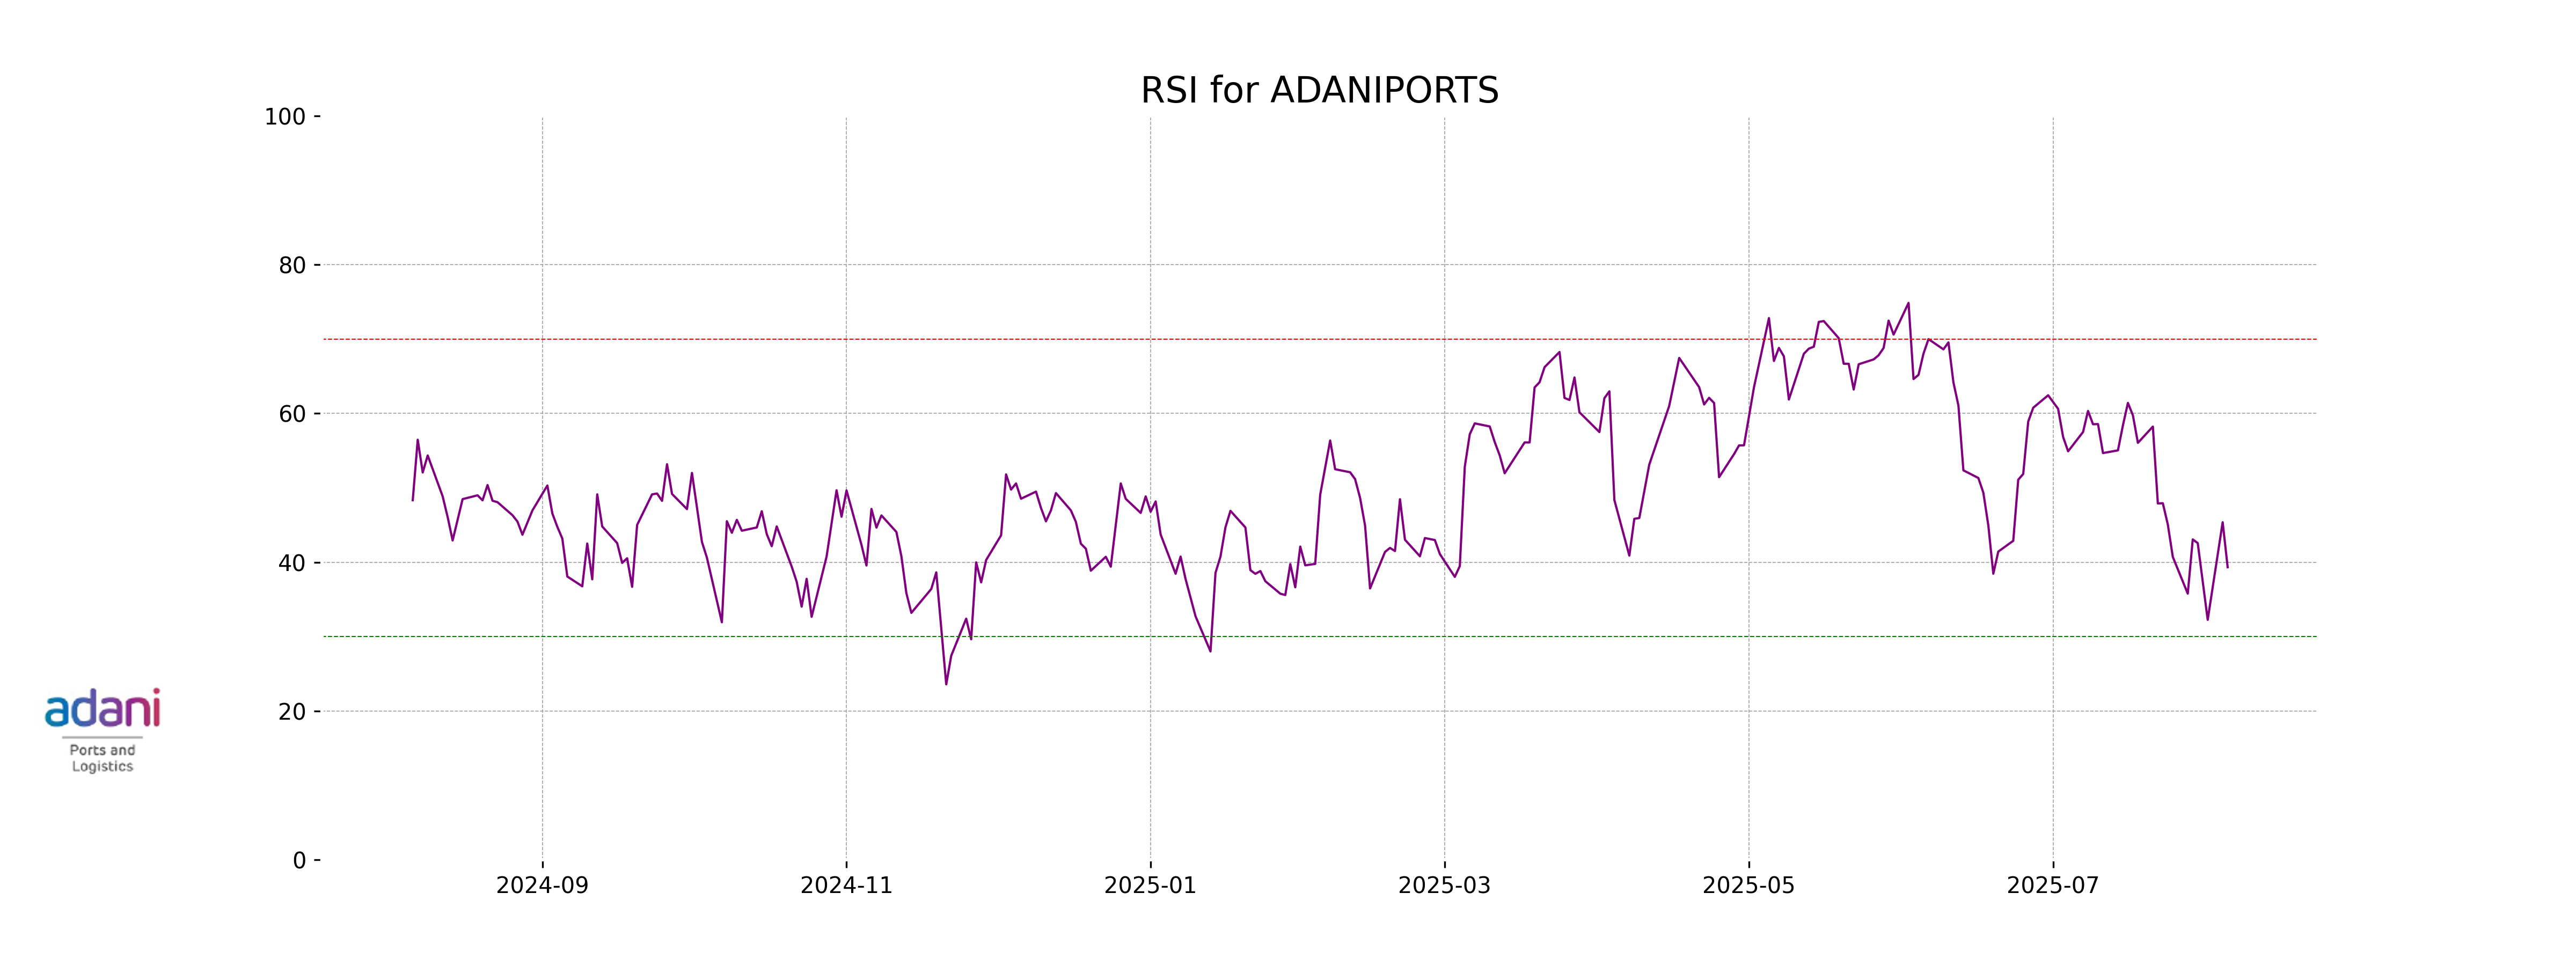
Adani Ports has experienced a decline, with a closing price of 1358.10, marking a 2.22% decrease from the previous close of 1388.90. Although its RSI indicates it might be slightly oversold at 39.33, its volume of 2,999,795 and a stable market cap suggest a strong market presence in the marine shipping industry. The MACD is negative, indicating a bearish trend.
Relationship with Key Moving Averages
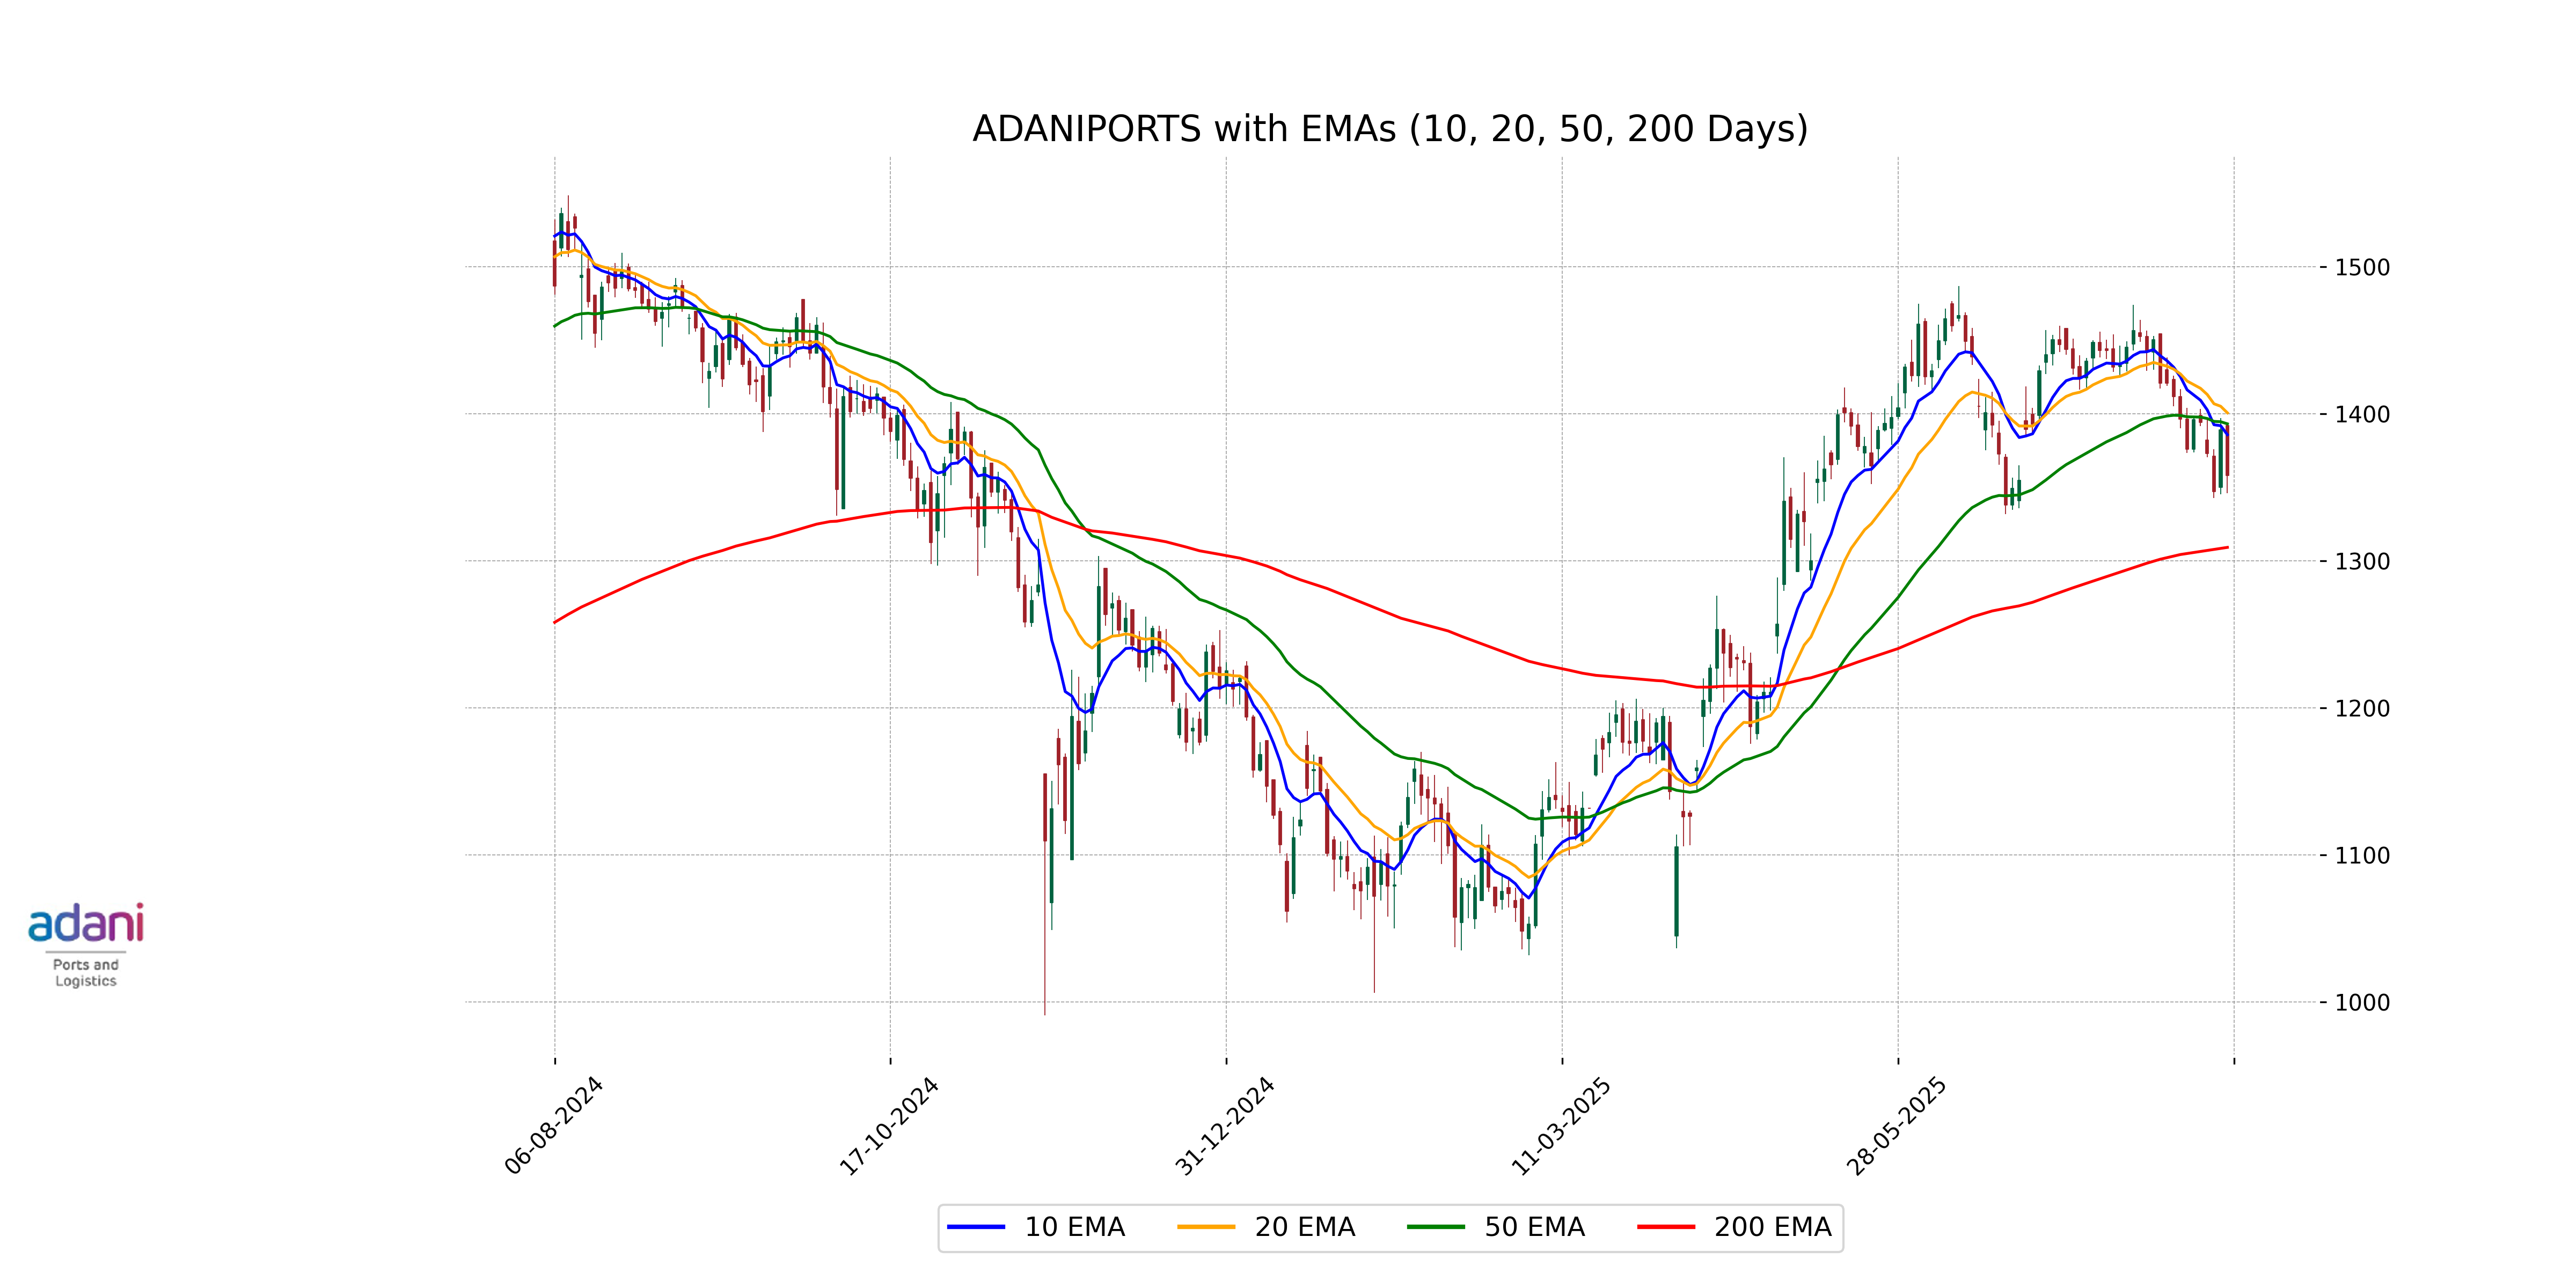
Adani Ports has a current close of 1358.10, which is below its 50-day EMA of 1393.15 and 20-day EMA of 1400.62, indicating a potential downtrend. However, it remains above the 200-day EMA of 1309.10, suggesting a longer-term positive trend despite recent declines.
Moving Averages Trend (MACD)
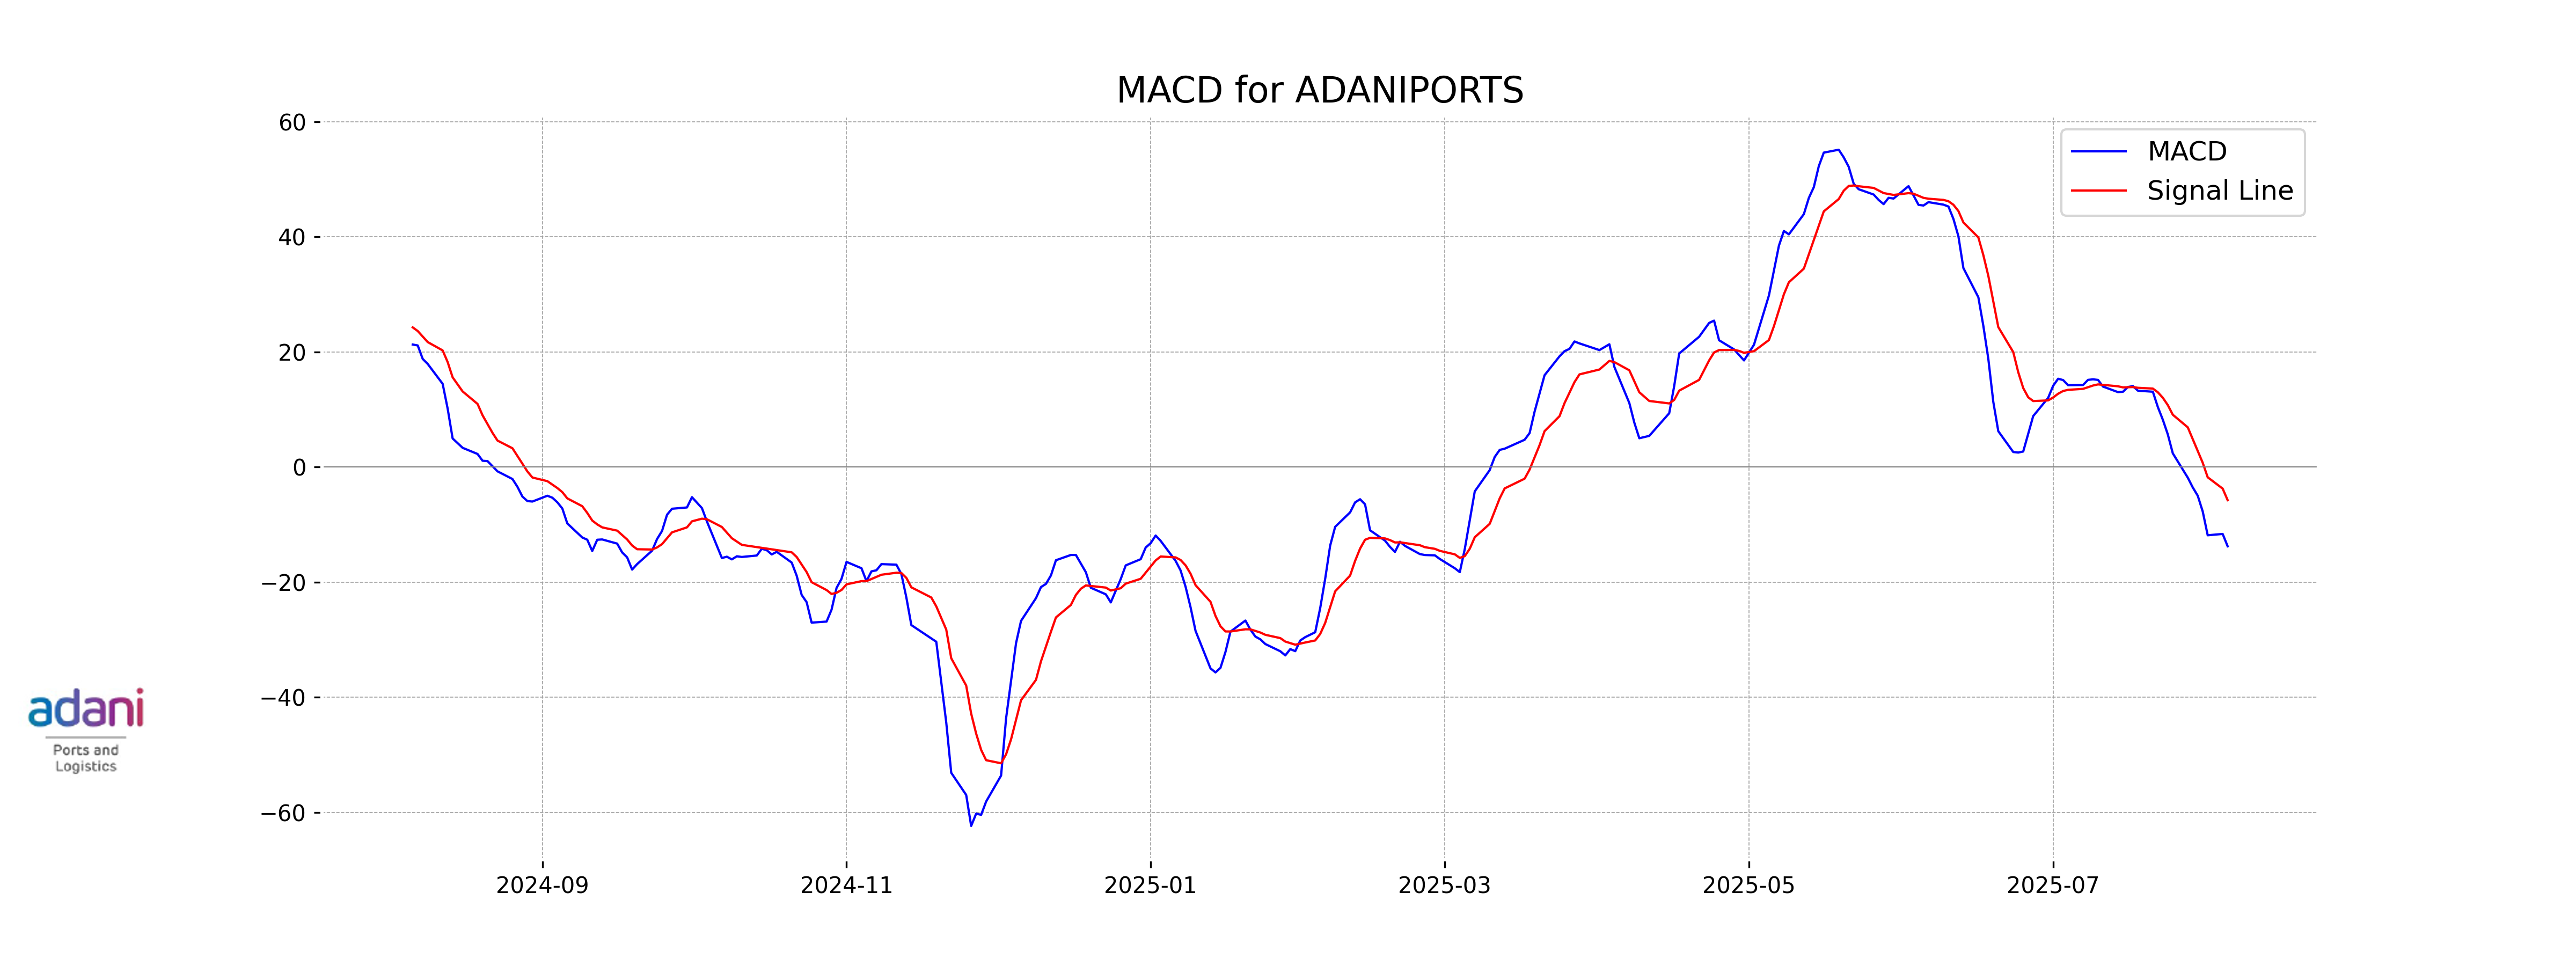
Adani Ports exhibits a bearish trend with its MACD at -13.75 below the MACD Signal of -5.73, indicating increased selling pressure. This negative momentum suggests potential further downside, especially given the RSI of 39.33 reflecting weak relative strength.
RSI Analysis
Adani Ports has an RSI of 39.33, indicating that the stock is approaching oversold territory. This suggests potential selling pressure, but it may also present a buying opportunity should conditions remain favorable.
Analysis for ICICI Bank - August 05, 2025
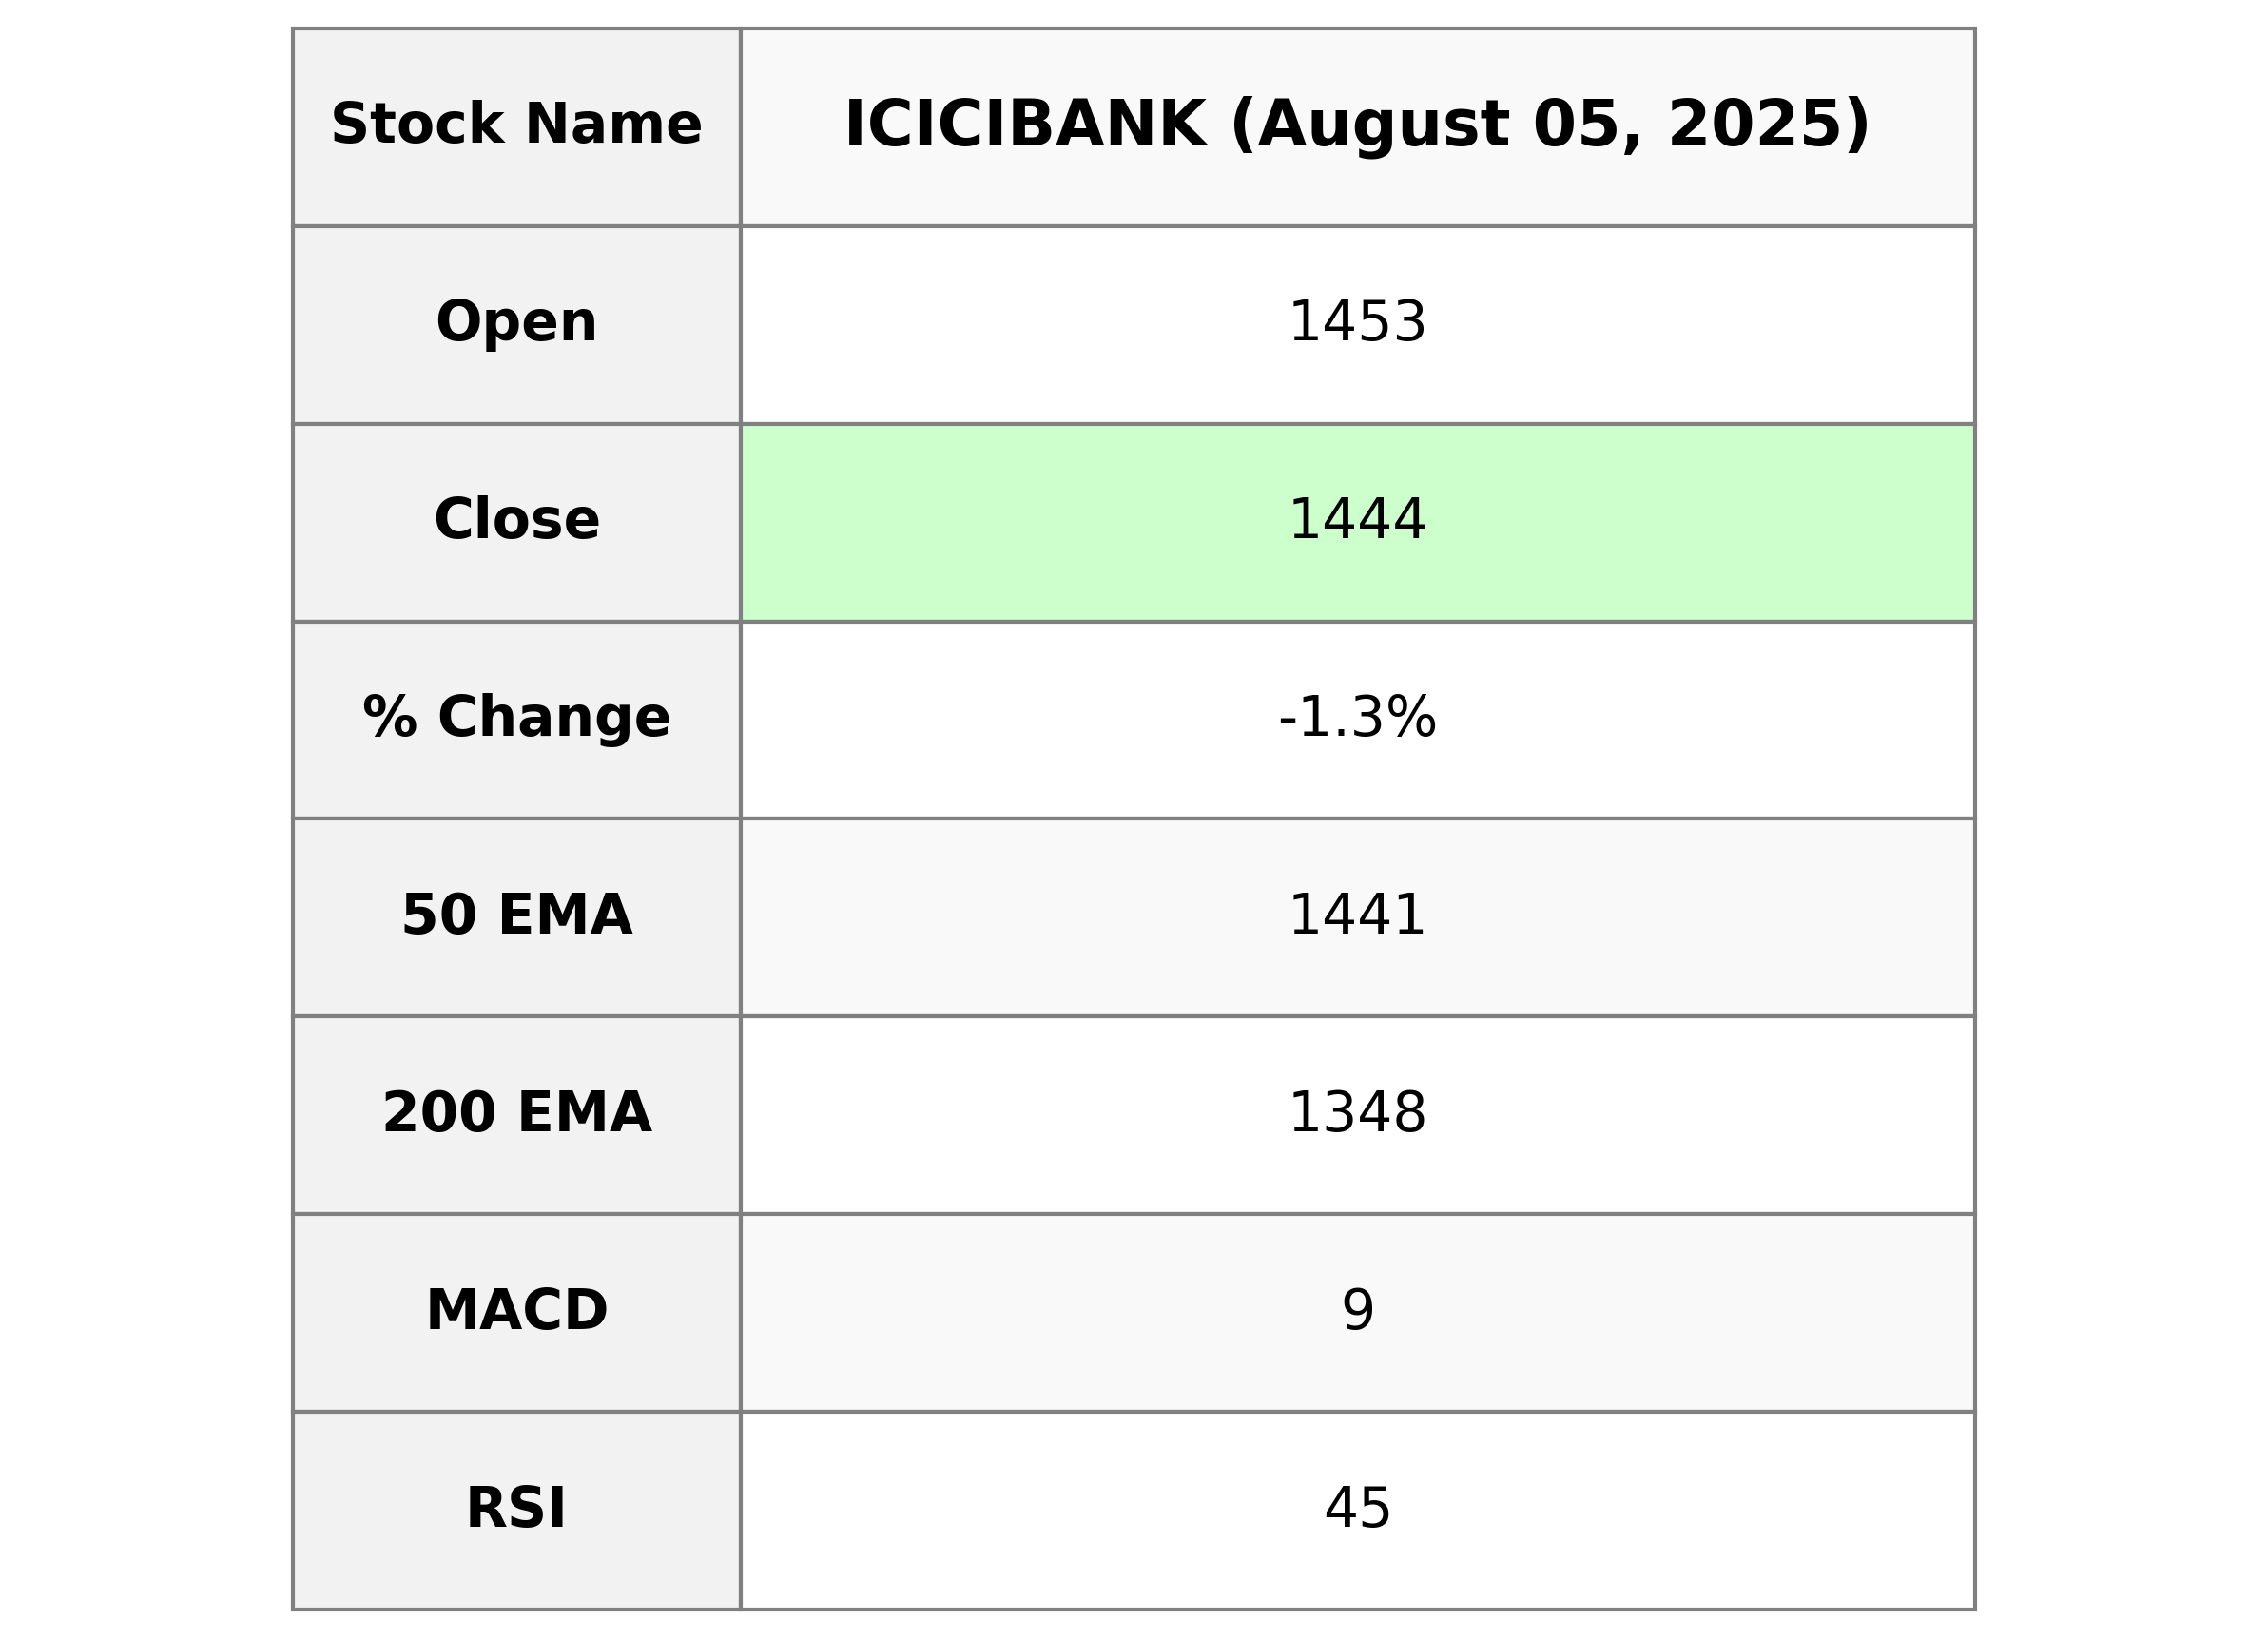
ICICI Bank experienced a decrease in stock price, closing at 1444.40, a drop of roughly 1.28% from its previous close. The bank's trading volume was quite active, with nearly 14.8 million shares exchanged. Despite the short-term dip, technical indicators like the 50 EMA show support near current levels, and the bank maintains a robust financial position with a P/E ratio of 19.74 and an EPS of 73.16 within the financial services sector in India.
Relationship with Key Moving Averages
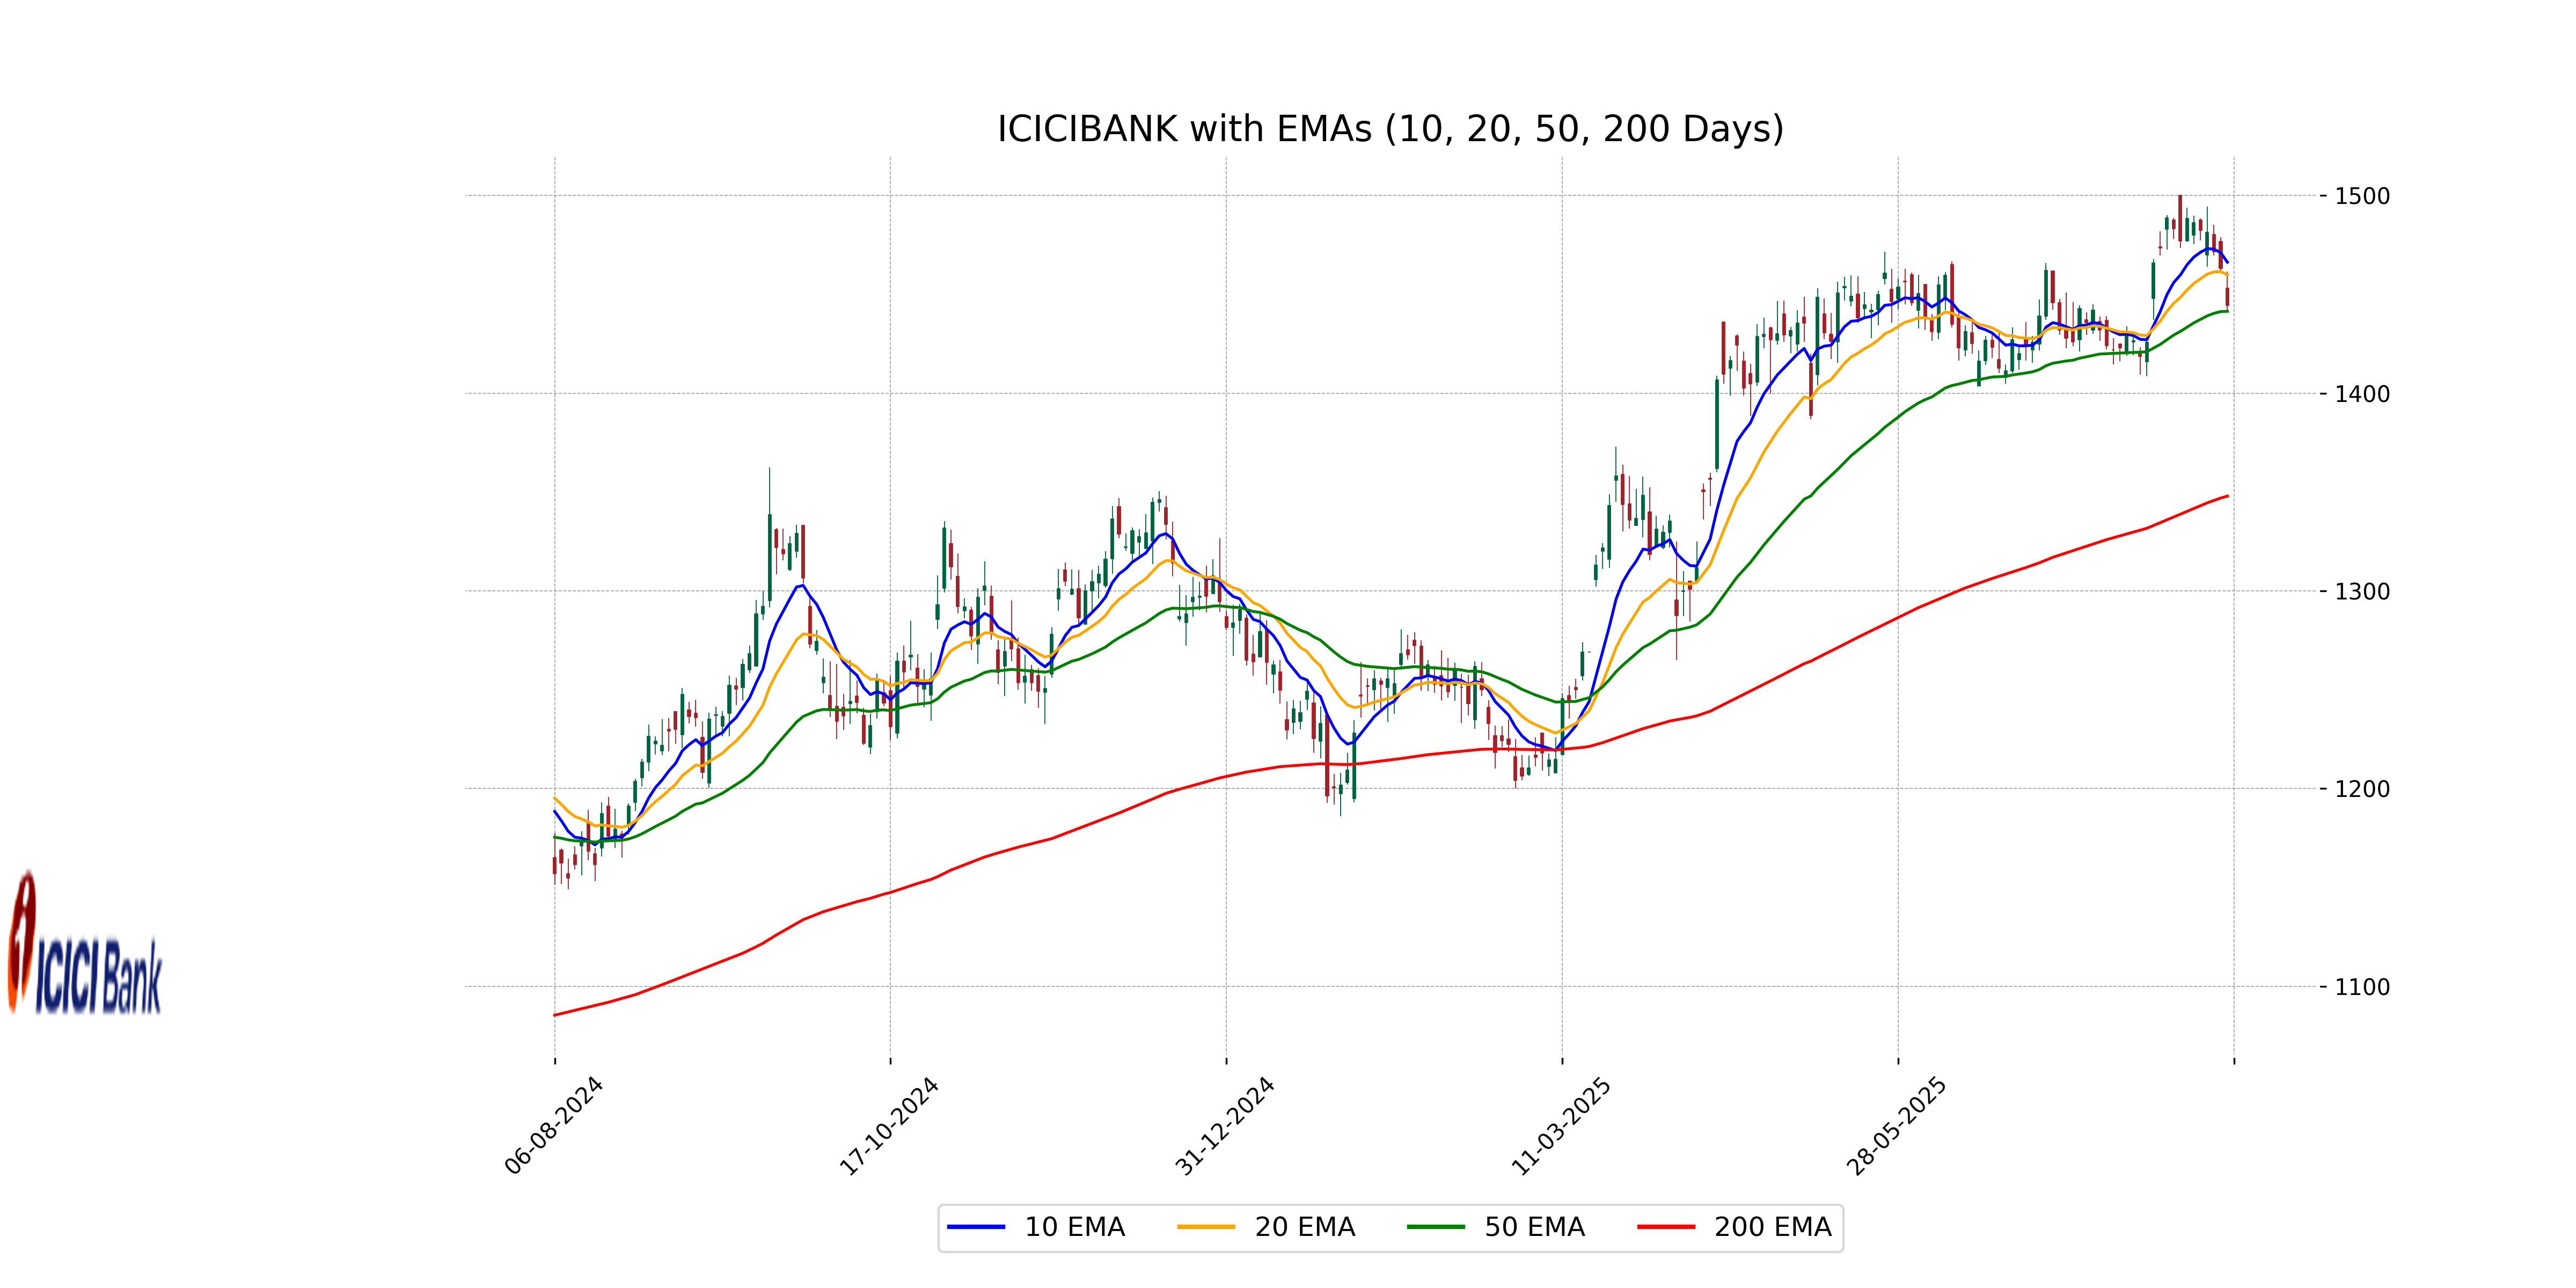
ICICI Bank's closing price of 1444.40 is slightly below its 50-day EMA of 1441.43, indicating potential short-term bearishness, while it remains notably above the 200-day EMA of 1347.93, suggesting a long-term bullish trend. The 10-day and 20-day EMAs at 1466.26 and 1459.91, respectively, further imply short-term bearish momentum.
Moving Averages Trend (MACD)
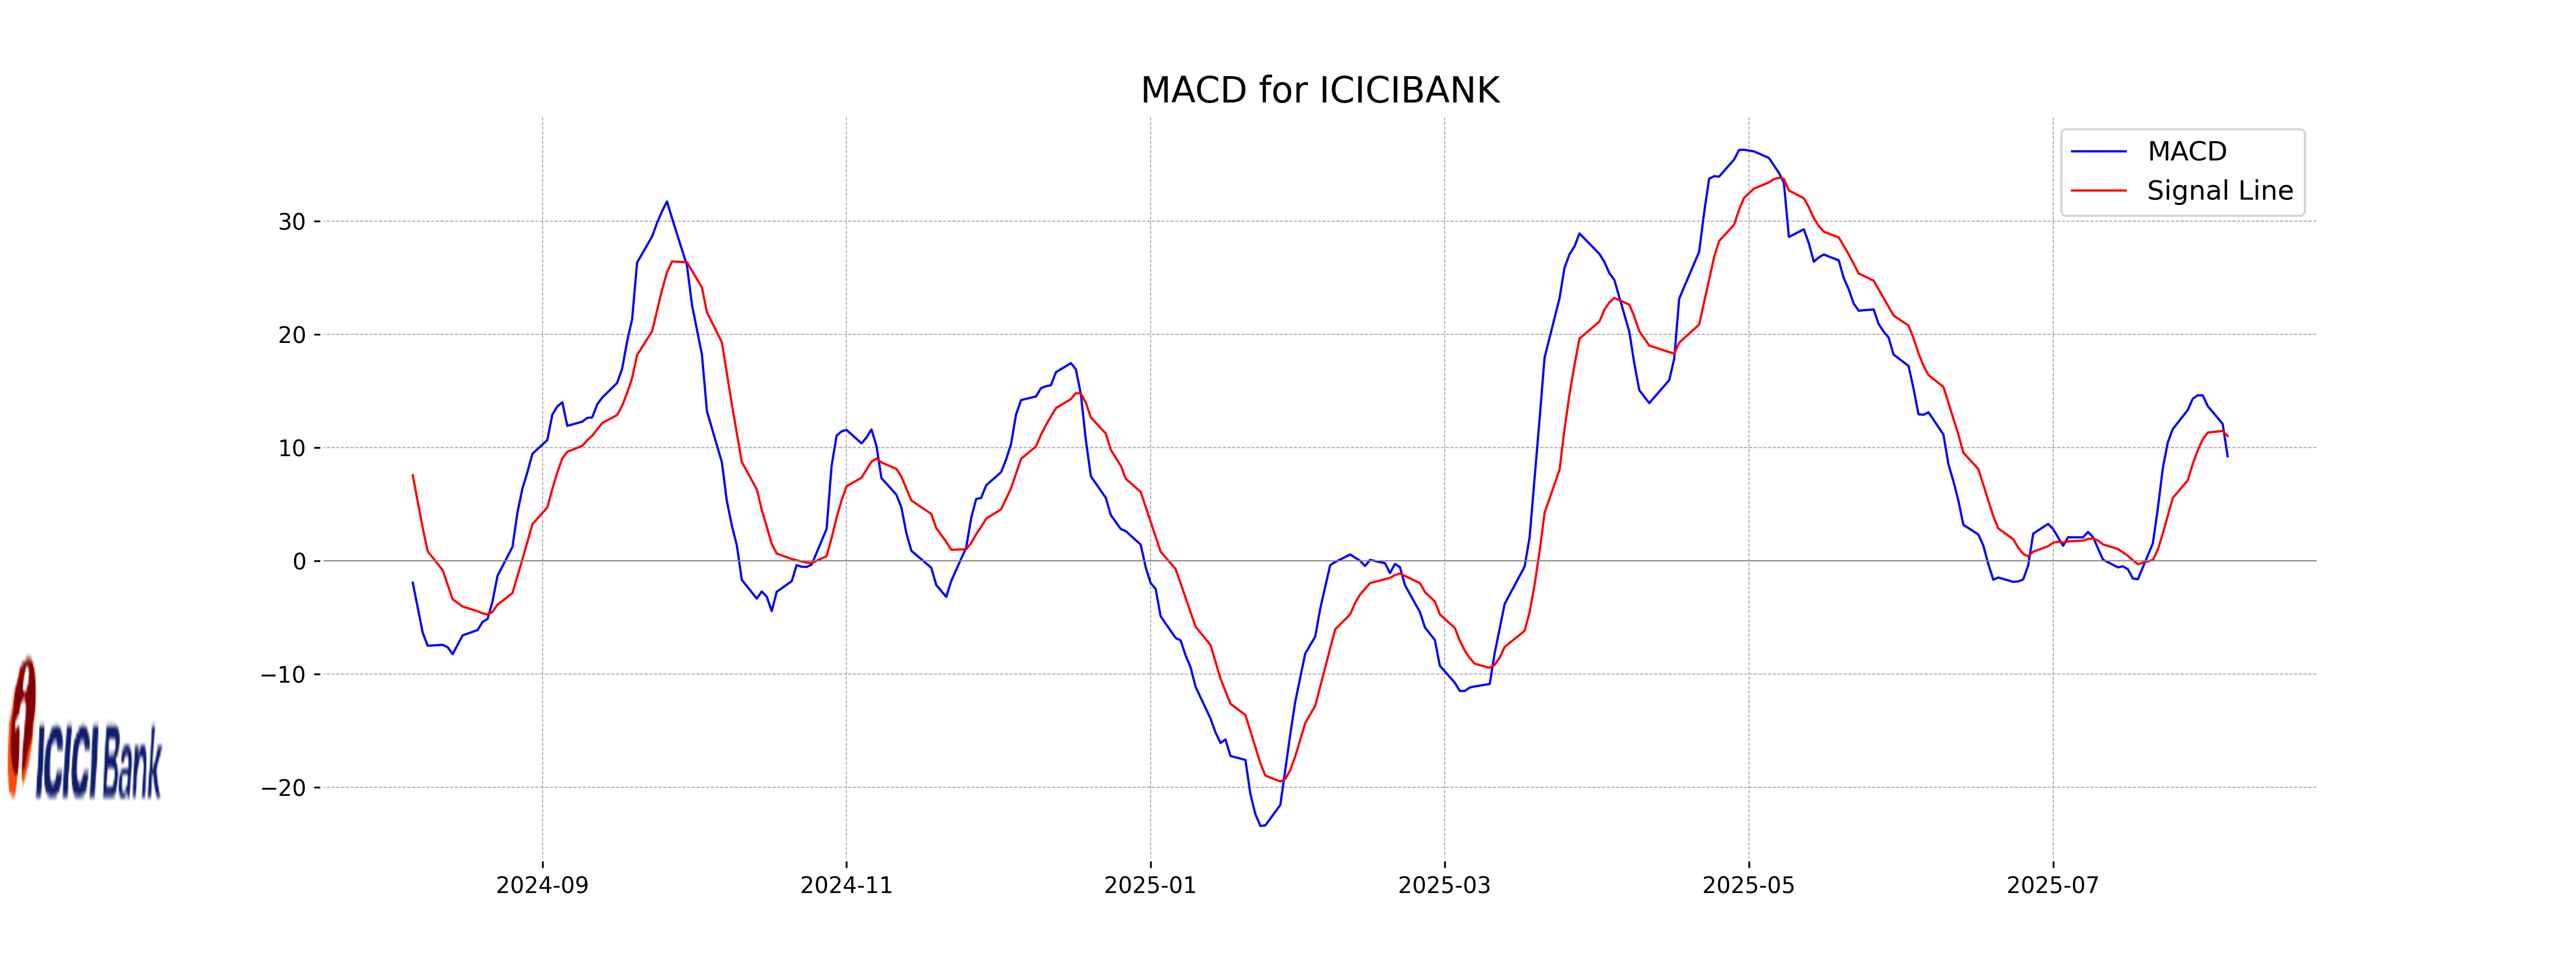
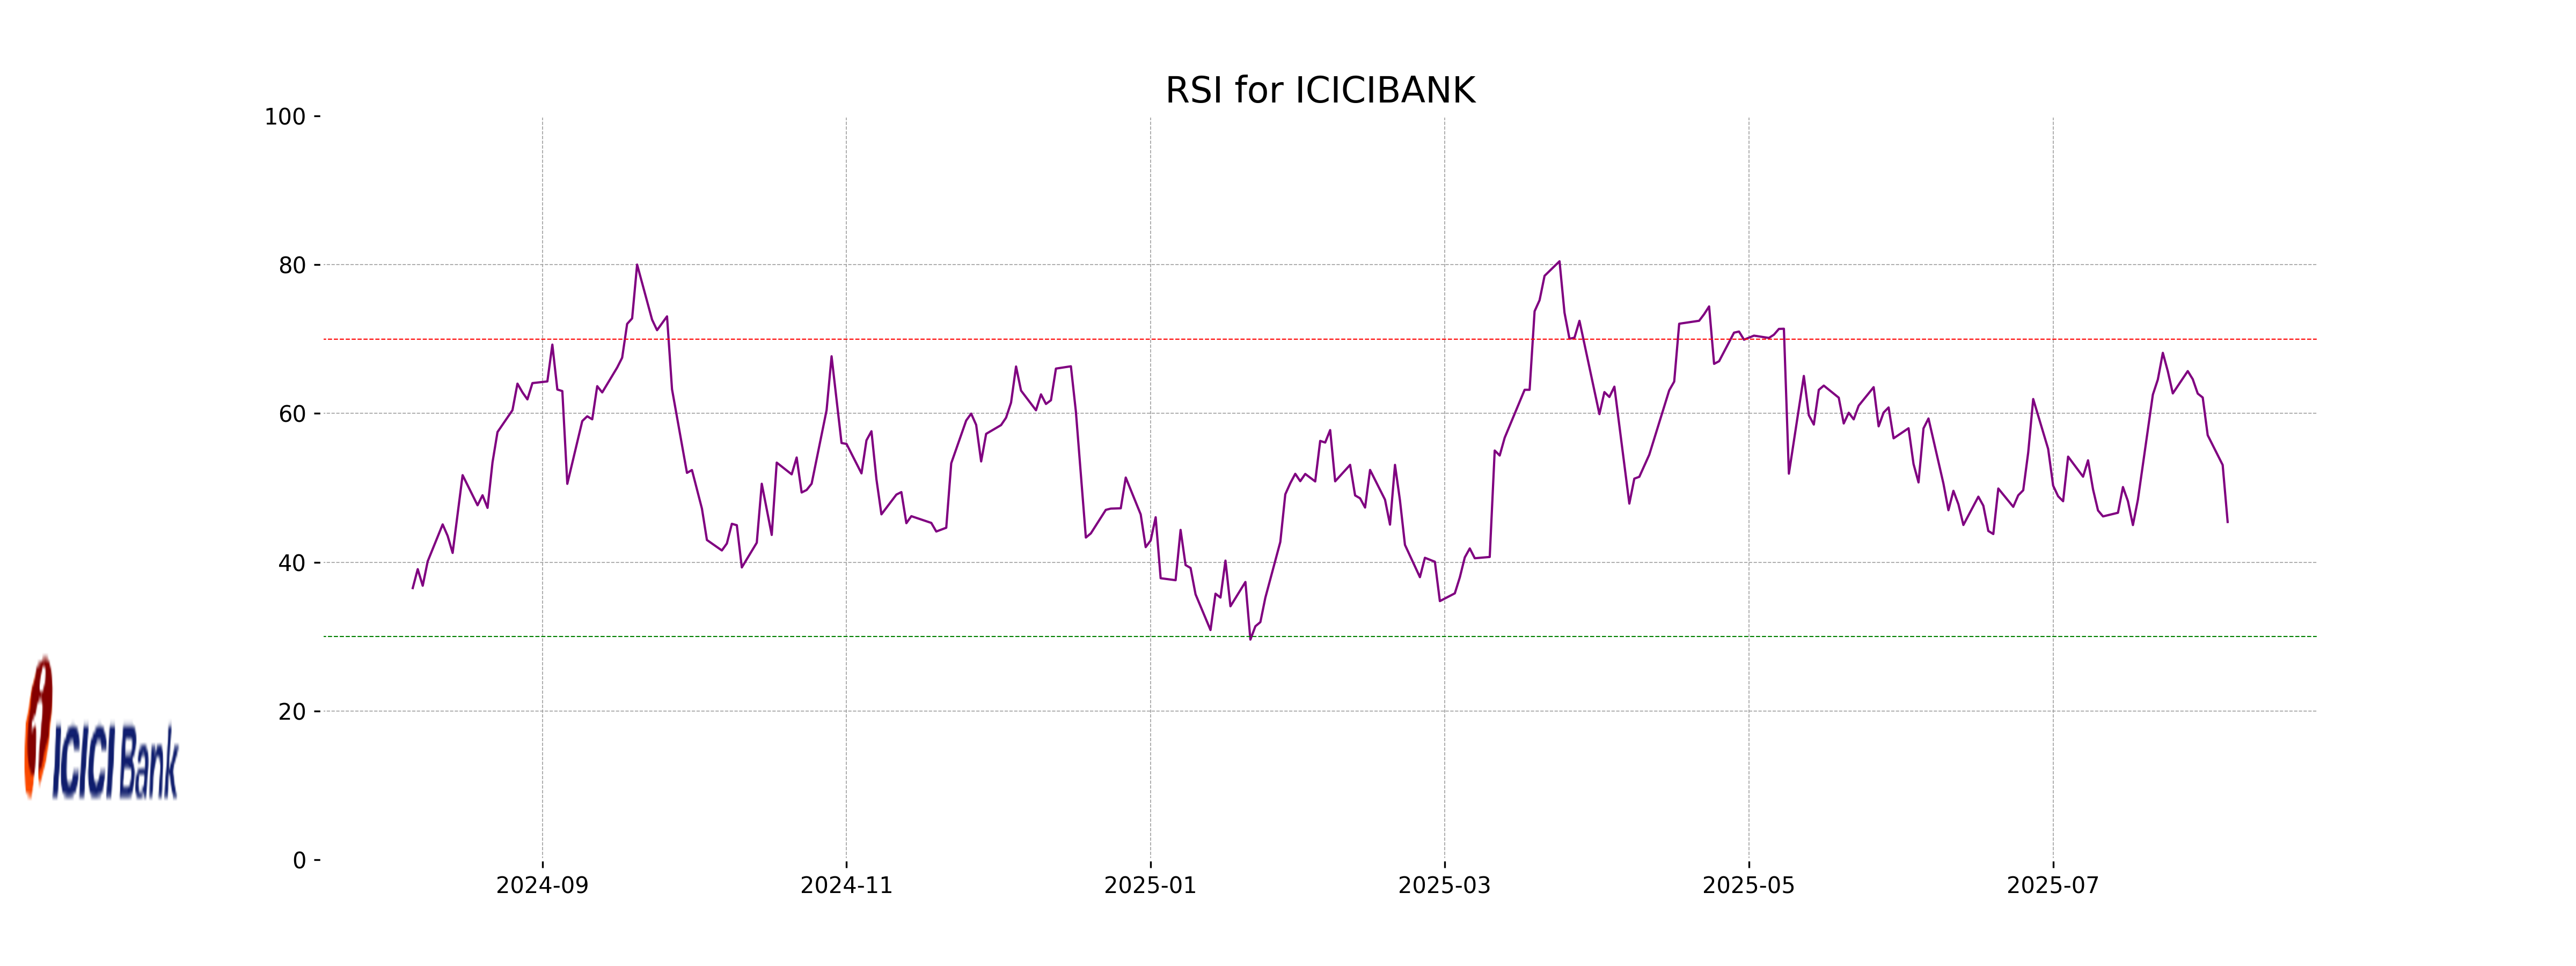
ICICI Bank's MACD value is 9.22, while the MACD Signal is higher at 11.02. This indicates a bearish trend as the MACD line is below the signal line. Also, the RSI at 45.41 suggests the stock is in the neutral zone but leaning towards being oversold.
RSI Analysis
Based on the RSI value of 45.41 for ICICI Bank, the stock is neither in an overbought nor oversold condition, indicating a relatively neutral position in the market. This suggests that there is no immediate indication of a strong buying or selling pressure, but it should be monitored closely for any significant movements.
Analysis for Infosys - August 05, 2025
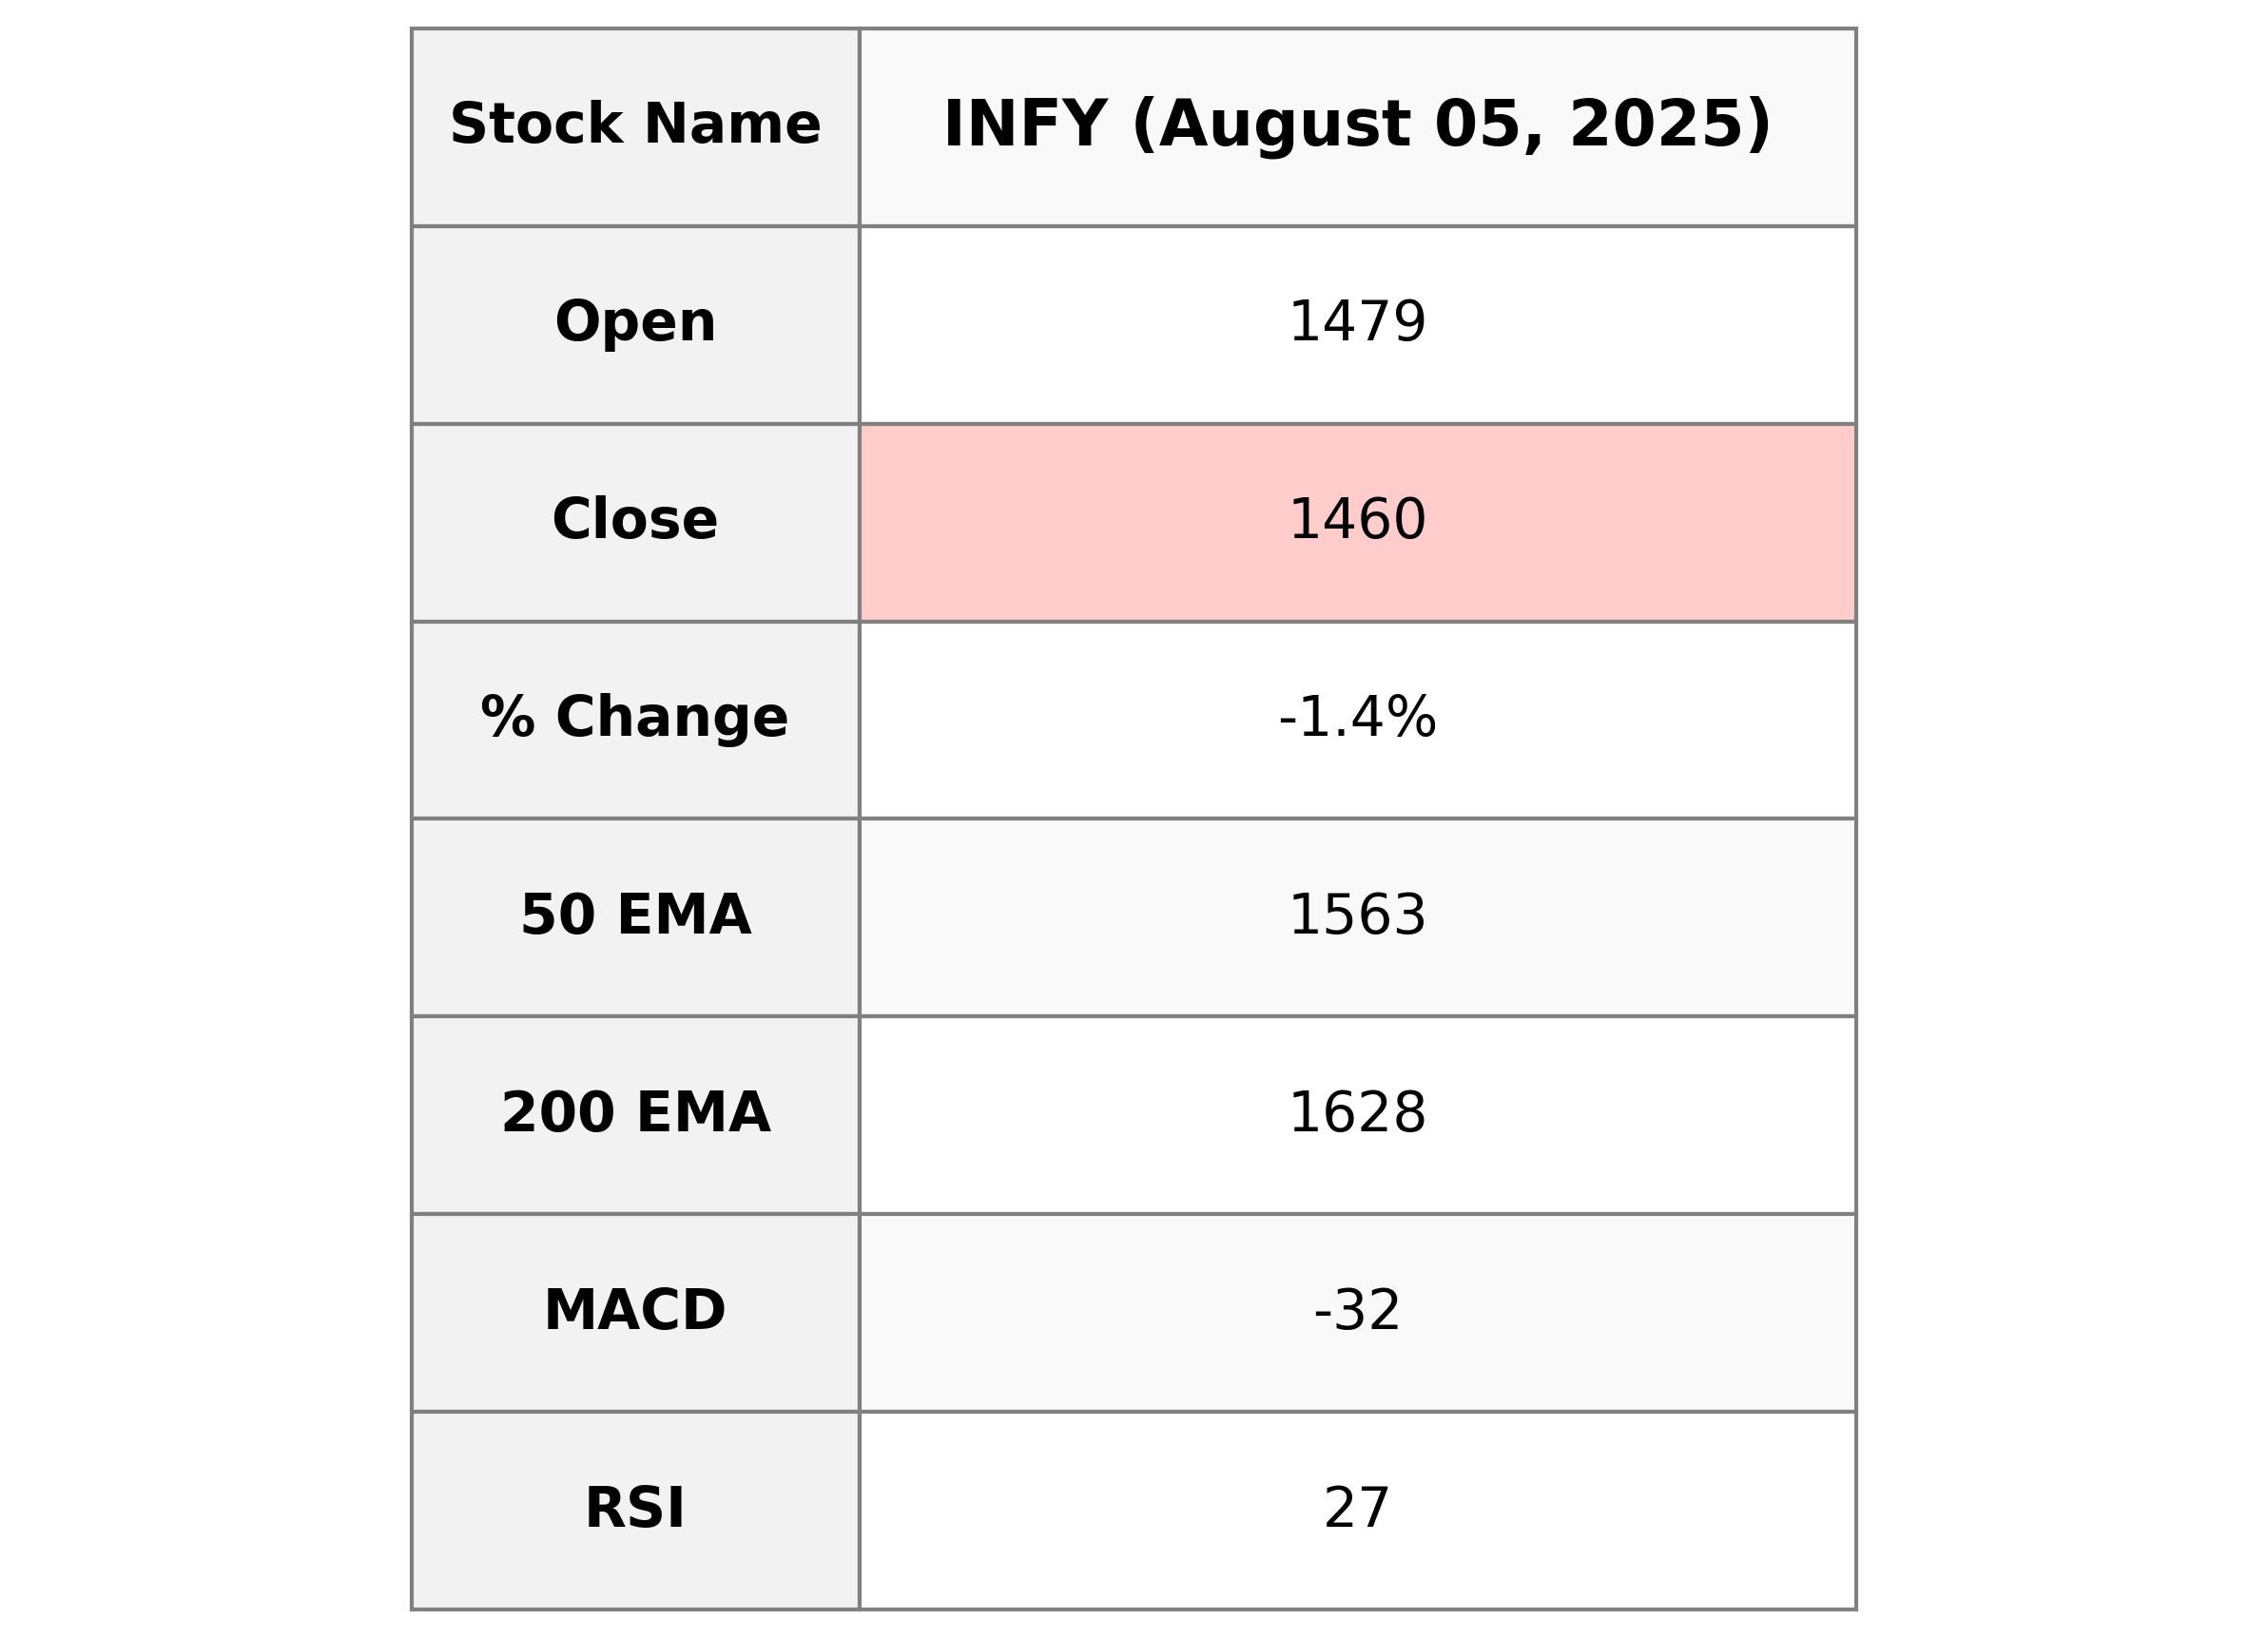
Infosys has shown a decrease in its stock performance with a closing price at 1460.30, down by 1.36% from the previous close. The stock's Relative Strength Index (RSI) is at 27.06, indicating that it is in the oversold territory. With market dynamics reflected by a MACD of -31.67 against a signal of -20.61, and EMAs showing a downward trend compared to its previous averages, it signifies recent bearish momentum in the Technology sector.
Relationship with Key Moving Averages
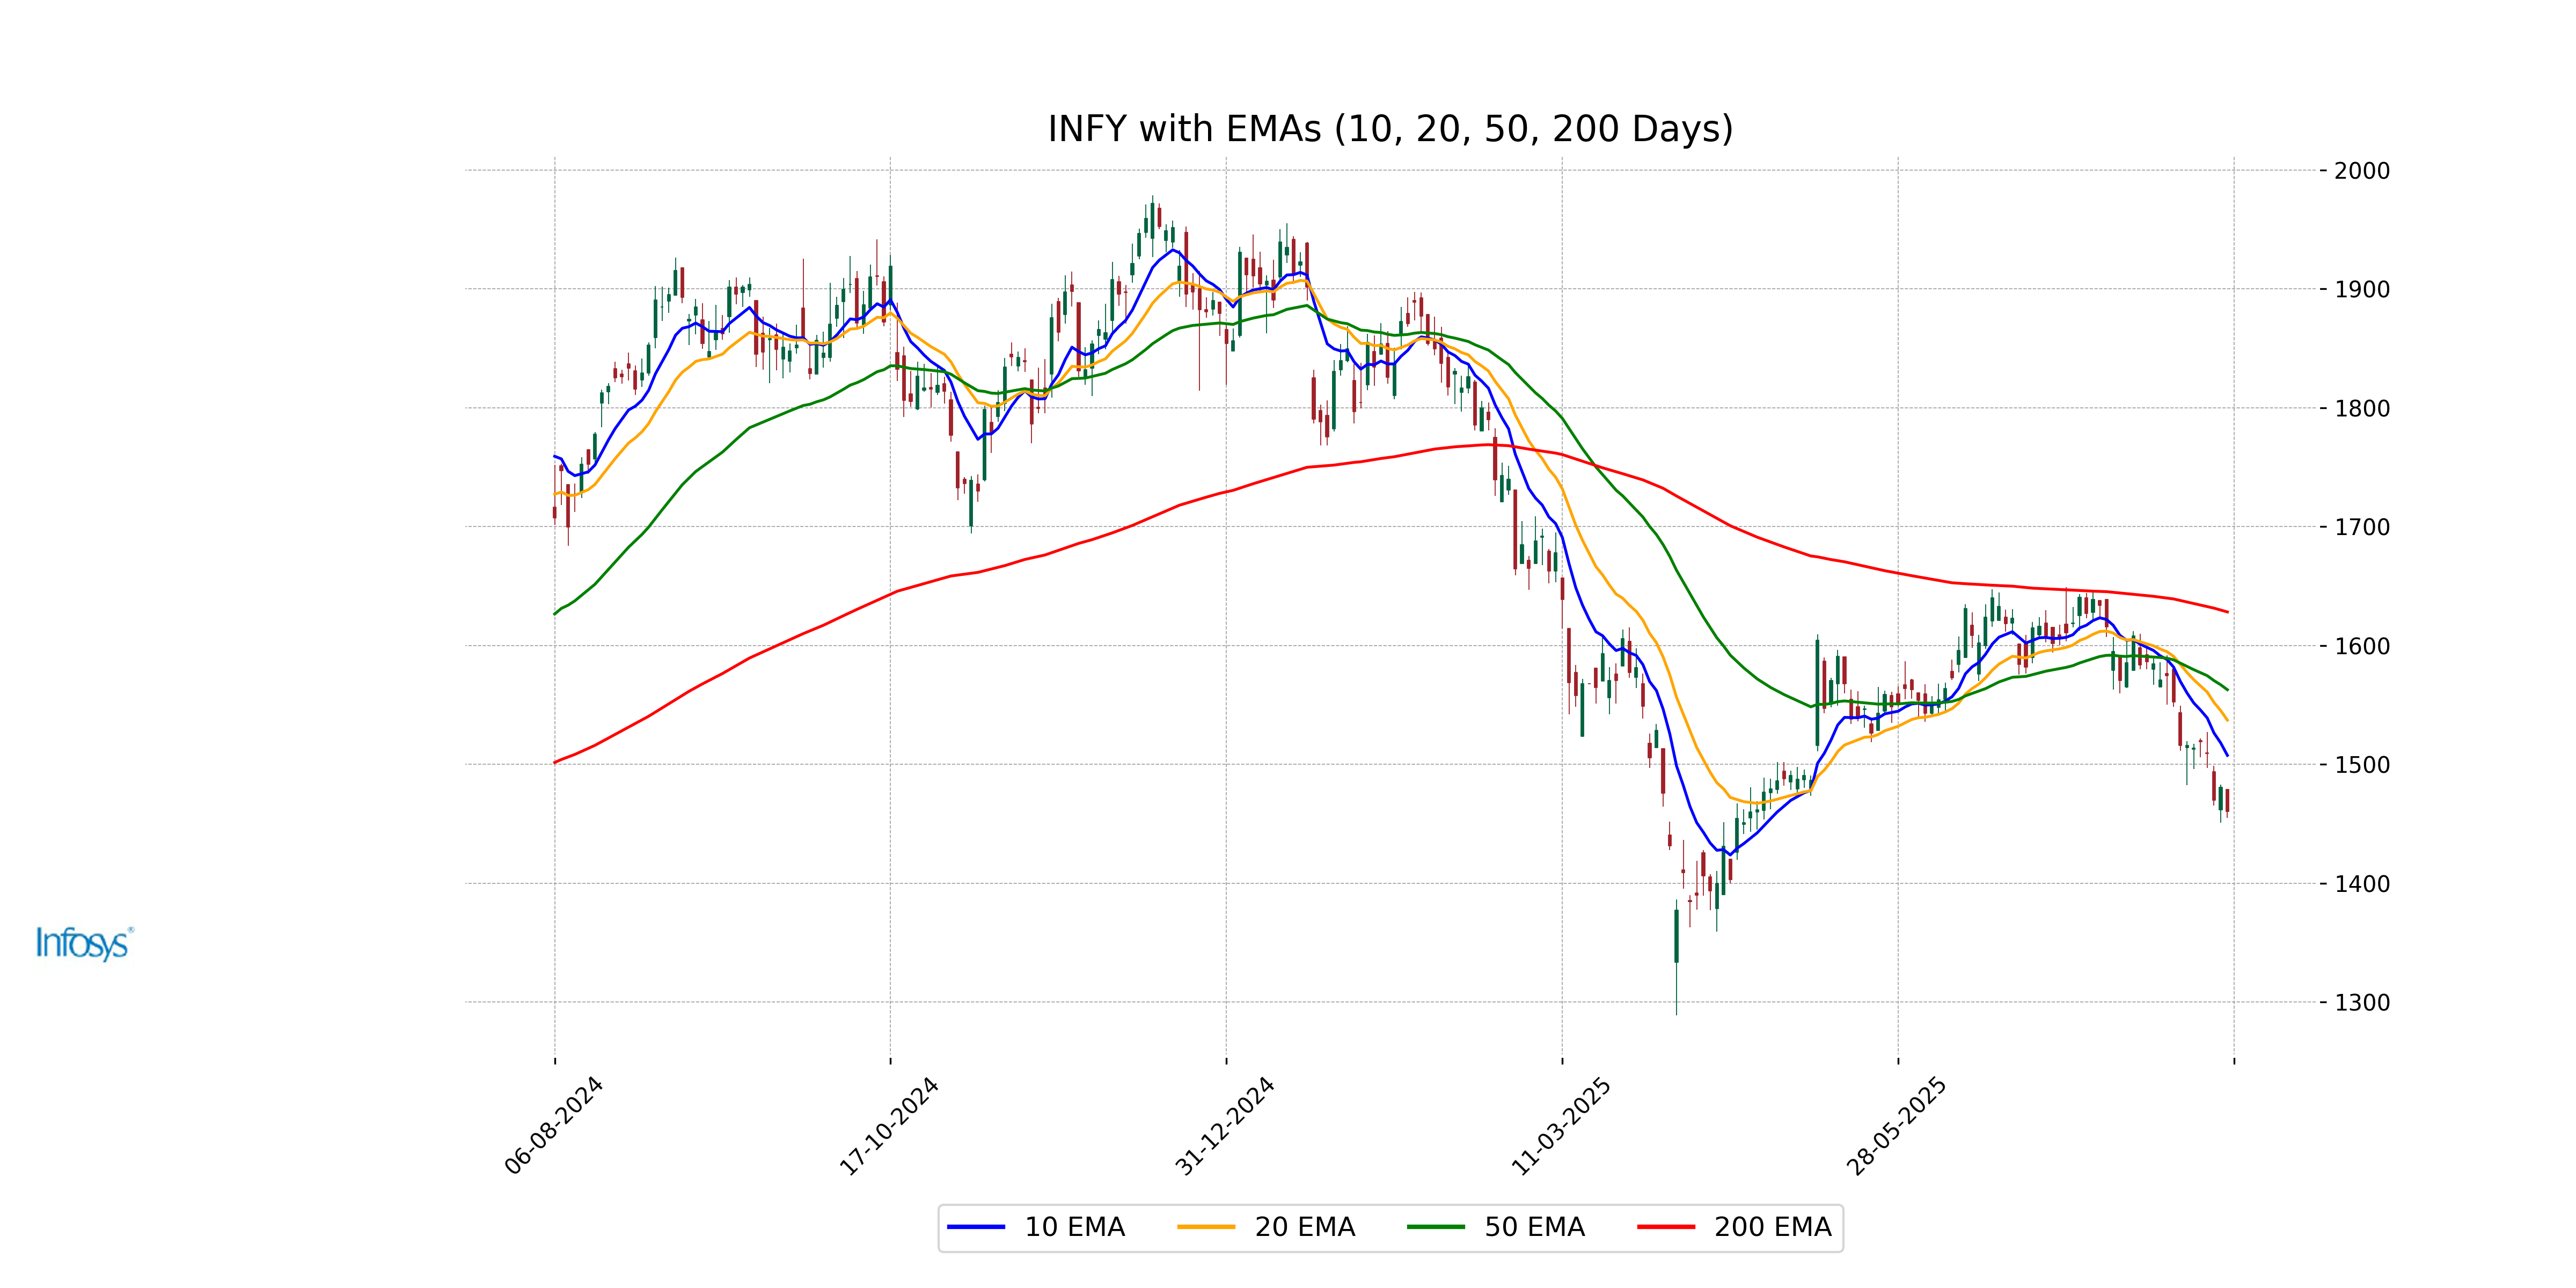
Infosys's current close price of 1460.3 is below the key moving averages, with the 10 EMA at 1507.52, the 50 EMA at 1562.73, and the 200 EMA at 1628.21. This indicates potential bearish momentum as the stock is trading below its recent trends.
Moving Averages Trend (MACD)
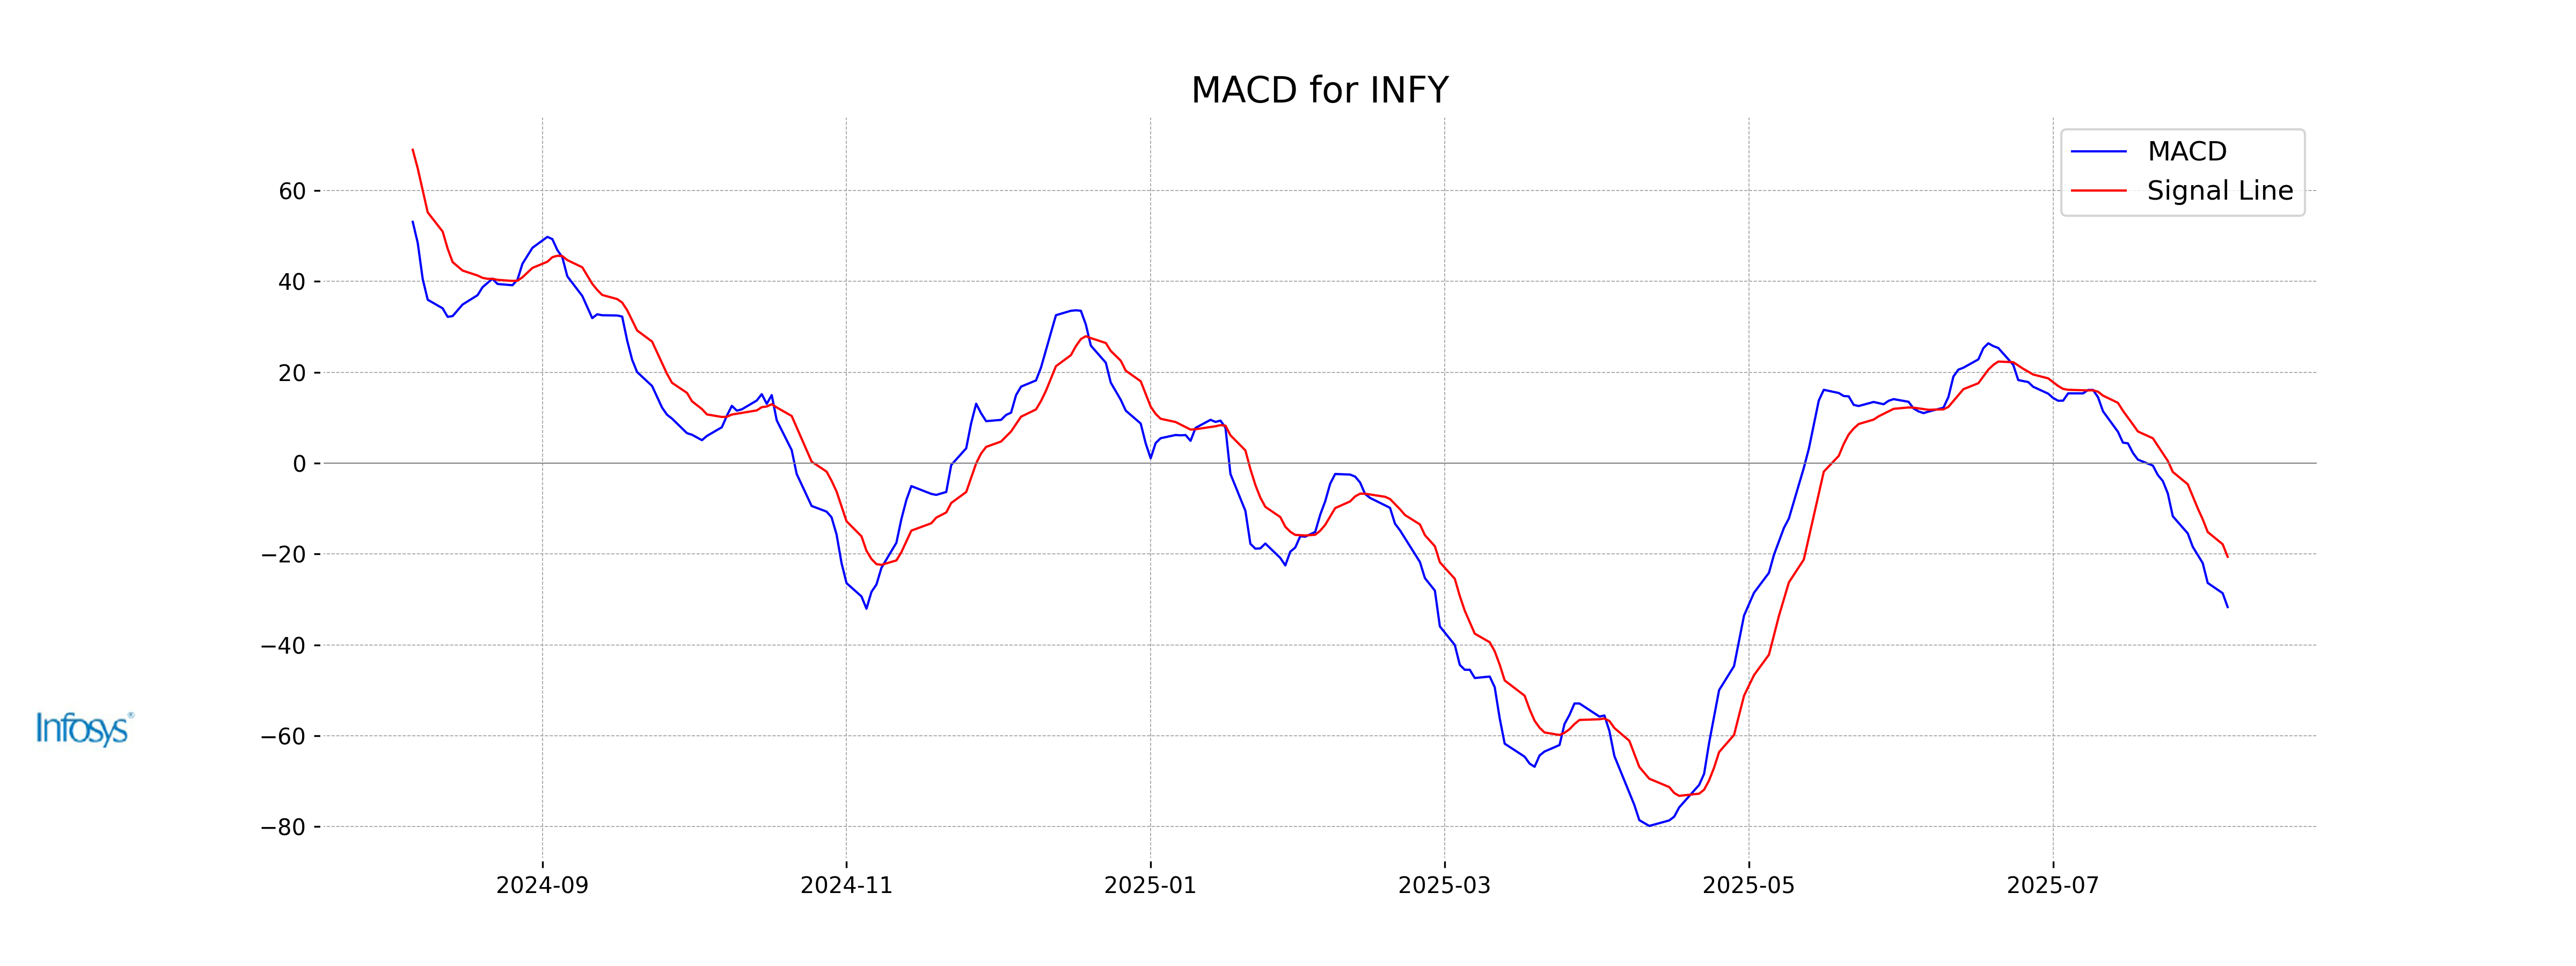
The MACD for Infosys shows a bearish signal, as the MACD line is below the MACD Signal line with a value of -31.67 compared to -20.61 for the signal line. This indicates a negative momentum, potentially signaling a continuation of a downward trend in the stock price.
RSI Analysis
Infosys has an RSI value of 27.06, indicating that the stock is currently in the oversold territory. This suggests that the stock may be undervalued and could potentially see a price correction or upward movement in the short term. However, investors should consider other technical indicators and market conditions before making trading decisions.
Analysis for Reliance - August 05, 2025
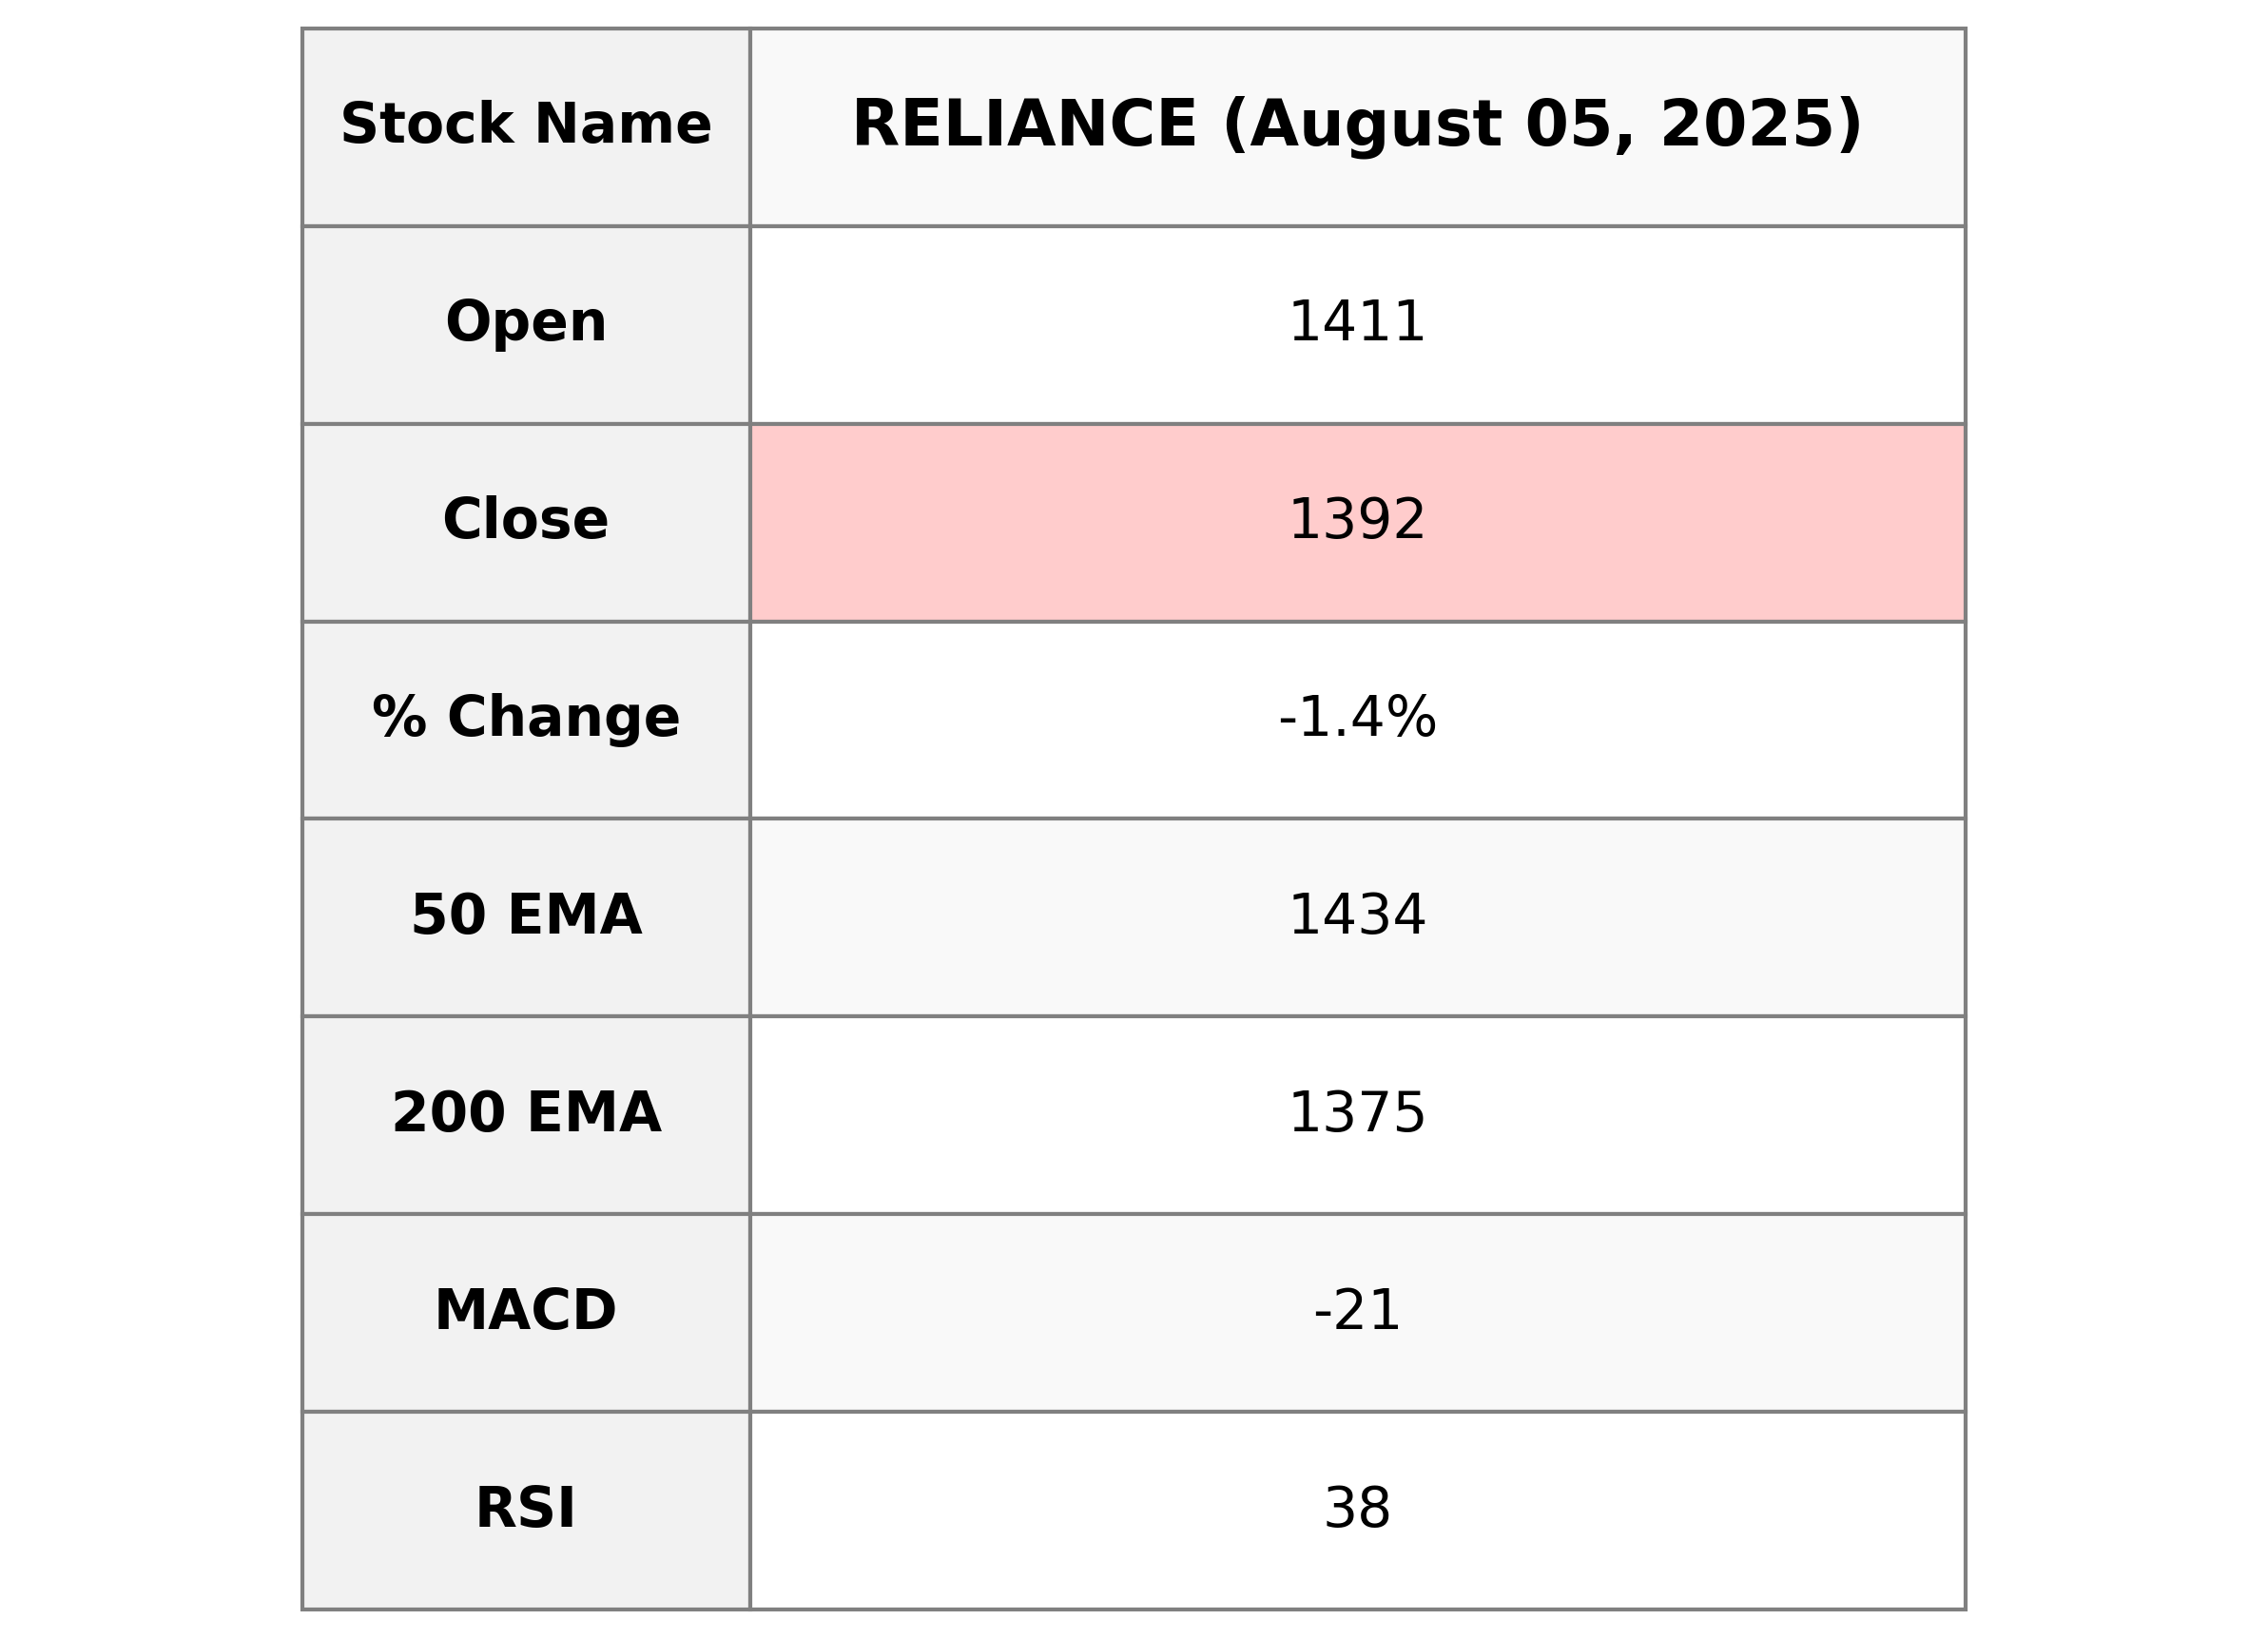
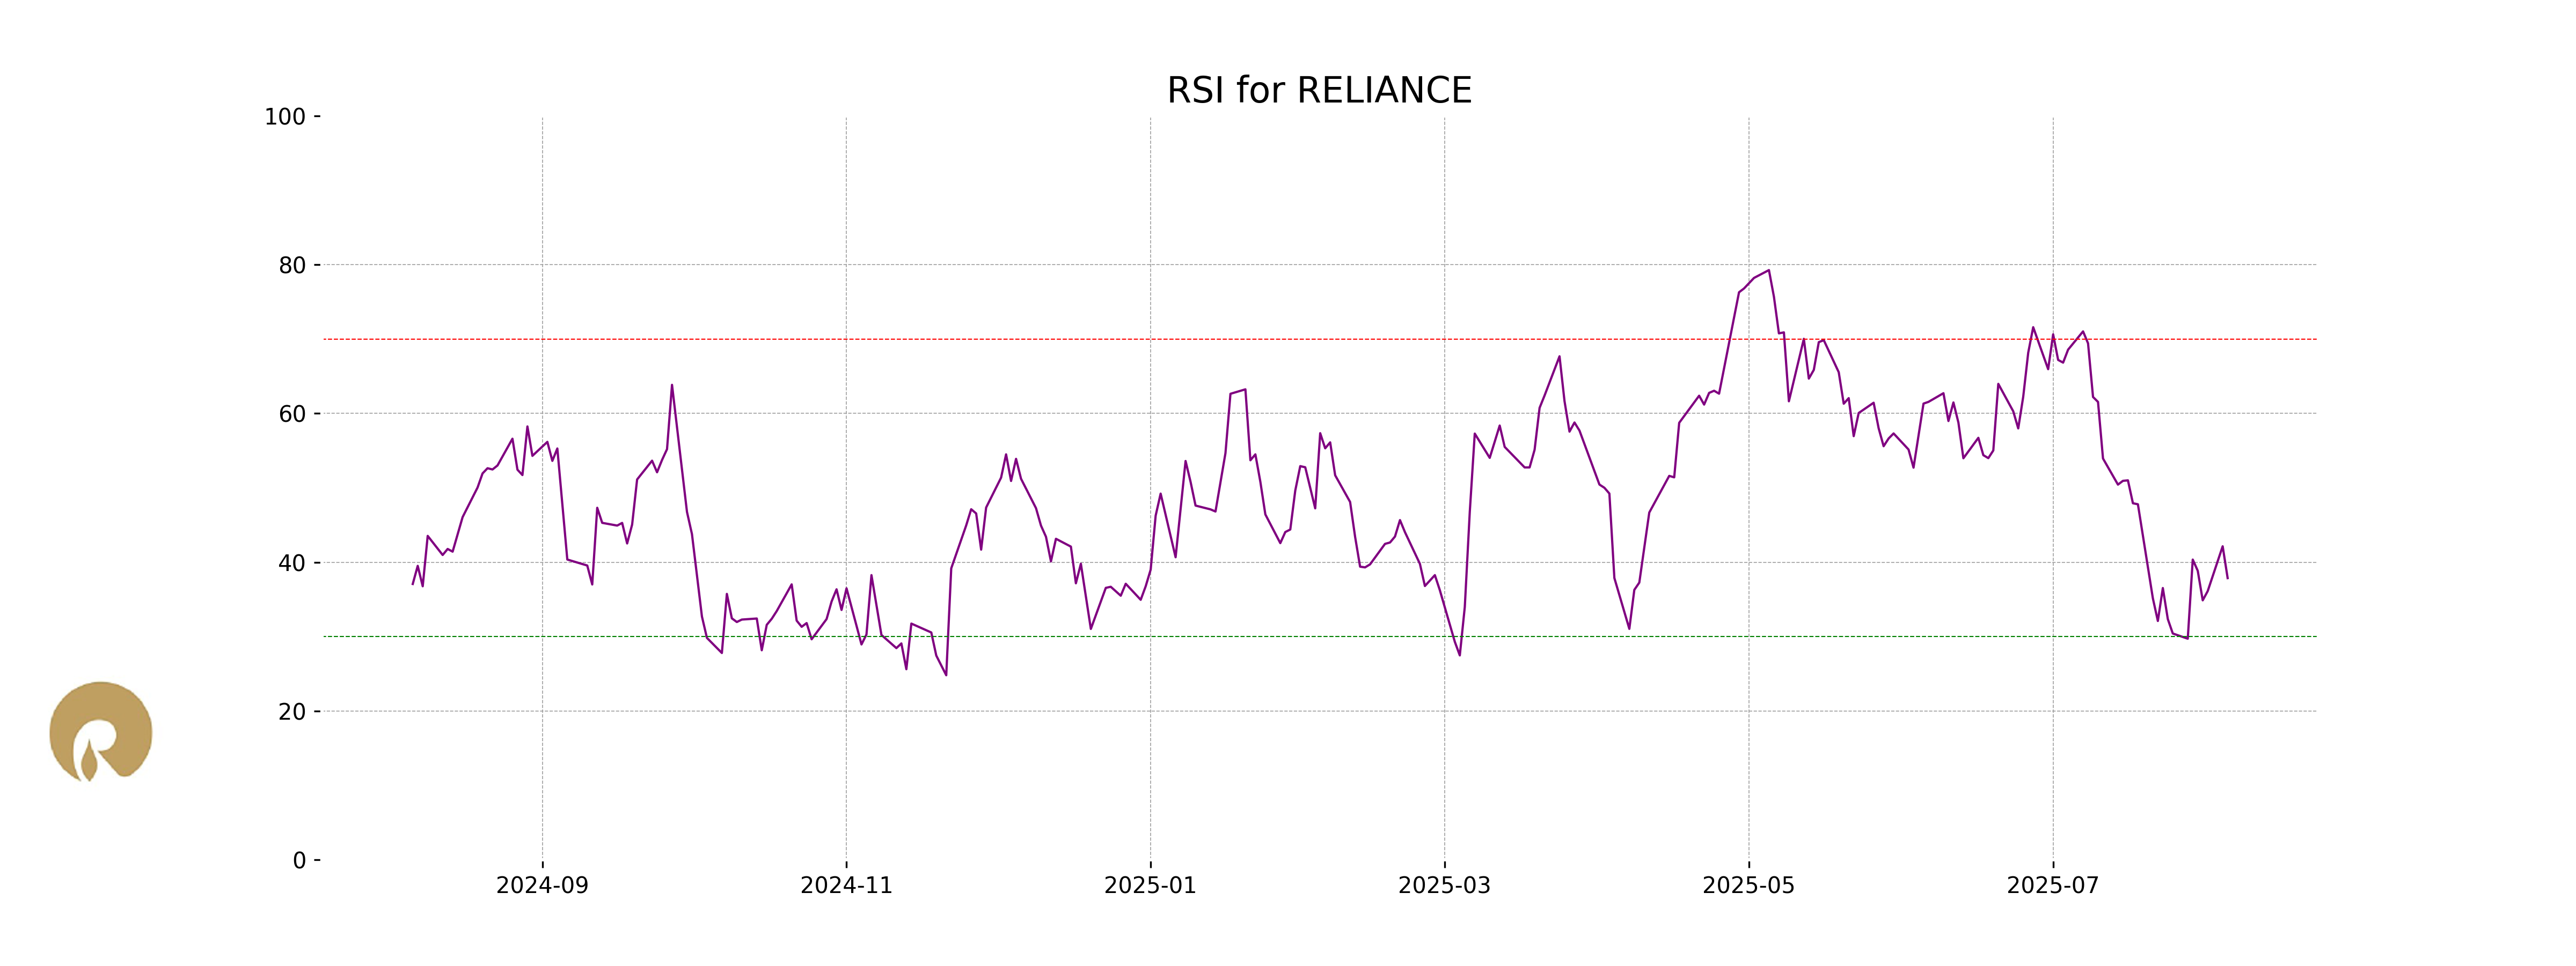
Reliance experienced a slight decline in its stock performance. The stock closed at 1391.70, down 1.40% from the previous close, with a decrease of 19.80 points. The volume traded was 9,314,524 shares. With an RSI of 37.86, the stock is approaching the oversold territory, indicating possible bearish momentum in the short term.
Relationship with Key Moving Averages
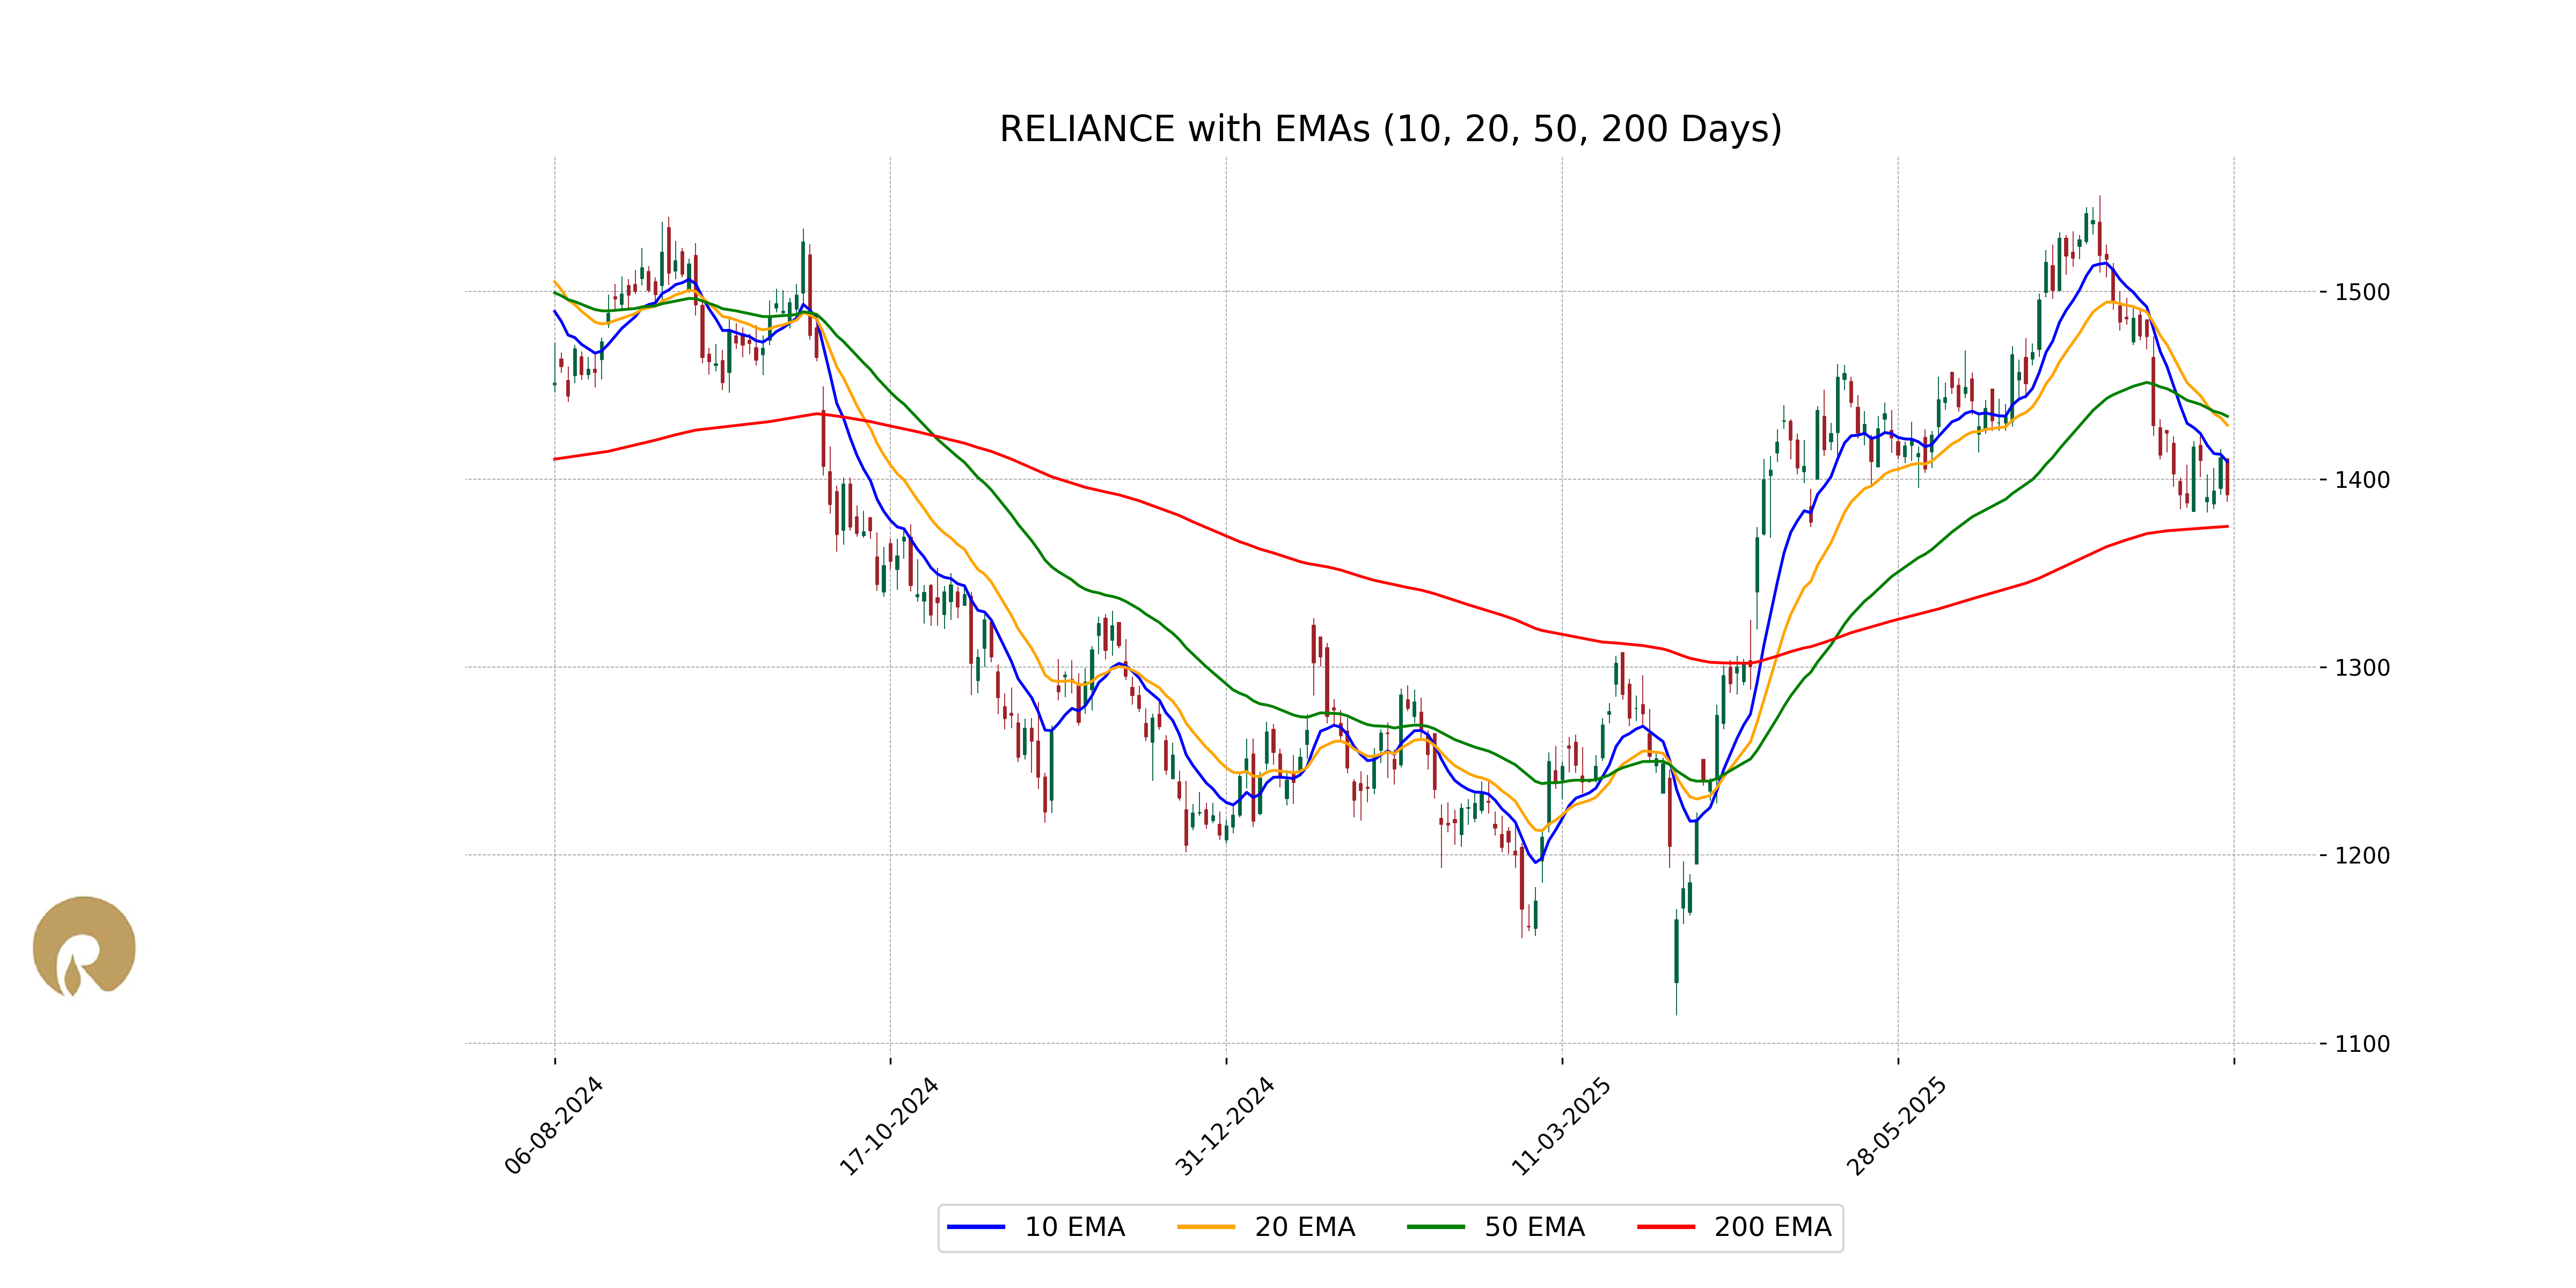
Reliance is currently trading below its 10-day EMA (1409.36), 20-day EMA (1428.84), and 50-day EMA (1433.52), indicating a possible bearish trend in the short to medium term. However, it is trading above its 200-day EMA (1374.94), suggesting that a longer-term bullish trend might still be intact.
Moving Averages Trend (MACD)
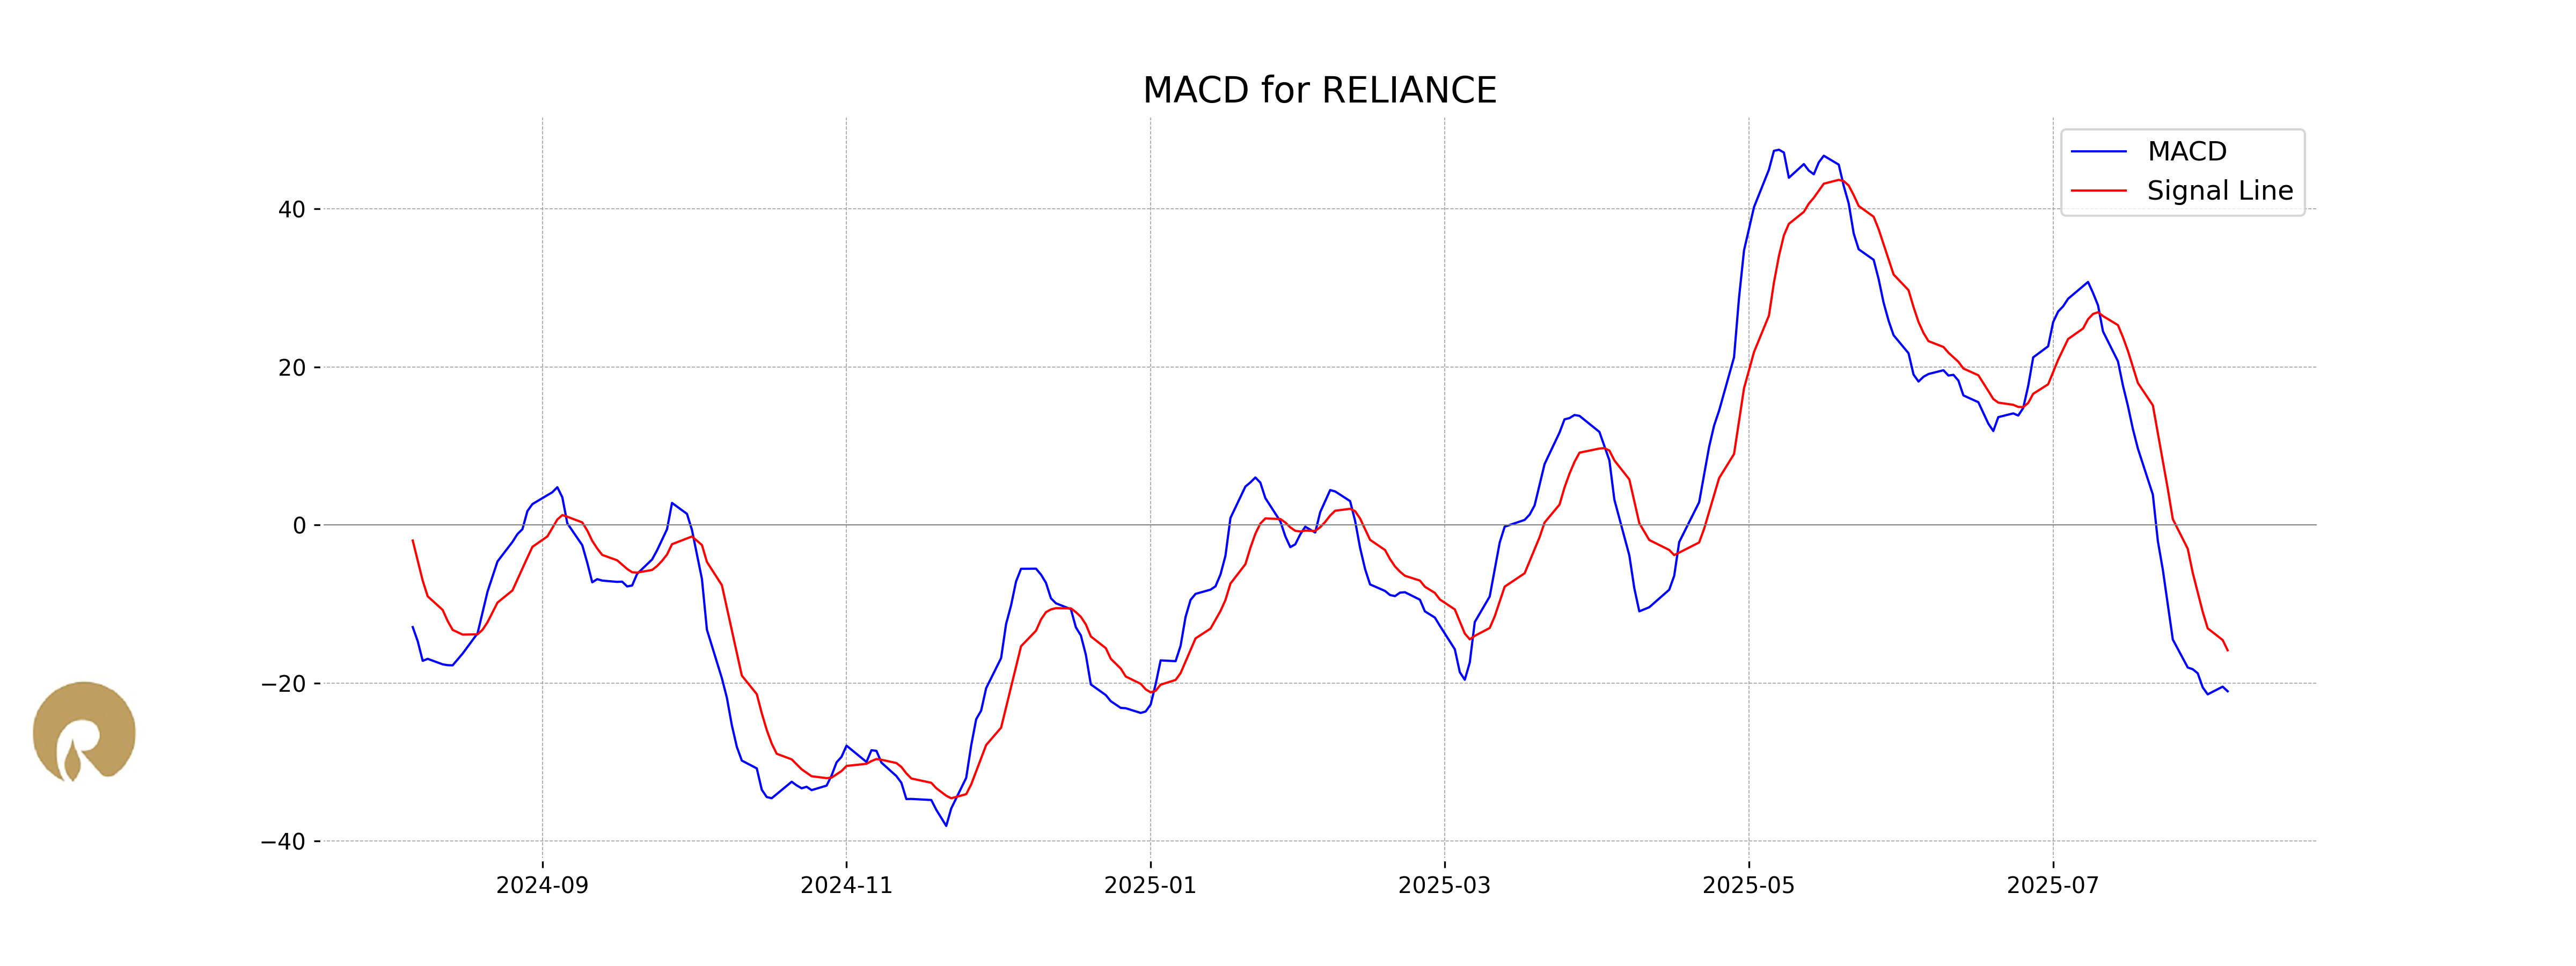
Reliance's current MACD is at -21.04, which is below the MACD Signal line at -15.85, indicating a bearish trend. This suggests a possible continuation of the downward momentum in the stock's price.
RSI Analysis
The RSI (Relative Strength Index) for Reliance is currently 37.86, indicating that the stock is approaching oversold conditions. An RSI below 30 typically signals that a stock may be undervalued, while an RSI of 37.86 suggests that while it is not yet in oversold territory, it is leaning towards it, possibly indicating a buying opportunity if fundamentals align.
Up Next
NSE Nifty 50: Top 5 stock losers of August 5, 2025

How much does a ULIP plan really cost? A break-down of all charges

Centre plans to borrow Rs 8.20 lakh cr from market in first half of FY27

Reliance denies buying Iranian oil amid US sanctions waiver

Premium petrol price up Rs 2, industrial diesel up Rs 22; no change in normal petrol, diesel rates

India's GDP expected to register over 8 pc growth in Sep-Dec: Report

More videos

Govt announces seven measures to help boost exports
RBI keeps interest rates on hold after US trade deal boosts outlook

RBI proposes to compensate customers up to Rs 25,000 loss due to fraud

RBI raises GDP growth projection of Q1, Q2 of FY27

RBI pauses rate cuts, retains interest rate at 5.25 pc

Rupee jumps 122 paise to close at 90.27 against US dollar on India-US trade deal

Stock markets cheer India-US trade deal: Sensex, Nifty surge 2.5 pc

UPI transactions hit record high of Rs 230 lakh crore in 2025-26 till Dec: Govt

Explained: India-US trade deal, tariffs and trade benefits

Trade deal with US adds momentum to India's growth ambition: Industry leaders