


Highlights
Latest news

Nitin Gadkari reveals how he met Hamas chief Ismail Haniyeh hours before assassination in Tehran

BNP acting chairman Tarique Rahman returns to Dhaka after 17 years in exile

India revamps tax regime in 2025, new I-T Act to take effect from April 1

BNP's acting chief Tarique Rahman set to return to Bangladesh after 17-year exile

Navi Mumbai International Airport starts commercial flight operations

PM Modi attends Christmas service at Delhi church, greets citizens

Gujarat AAP MLA Chaitar Vasava refutes Rs 75 lakh extortion claims by BJP MP

AAP MLA Gopal Italia alleges bullying, extortion at Visavadar groundnut centre
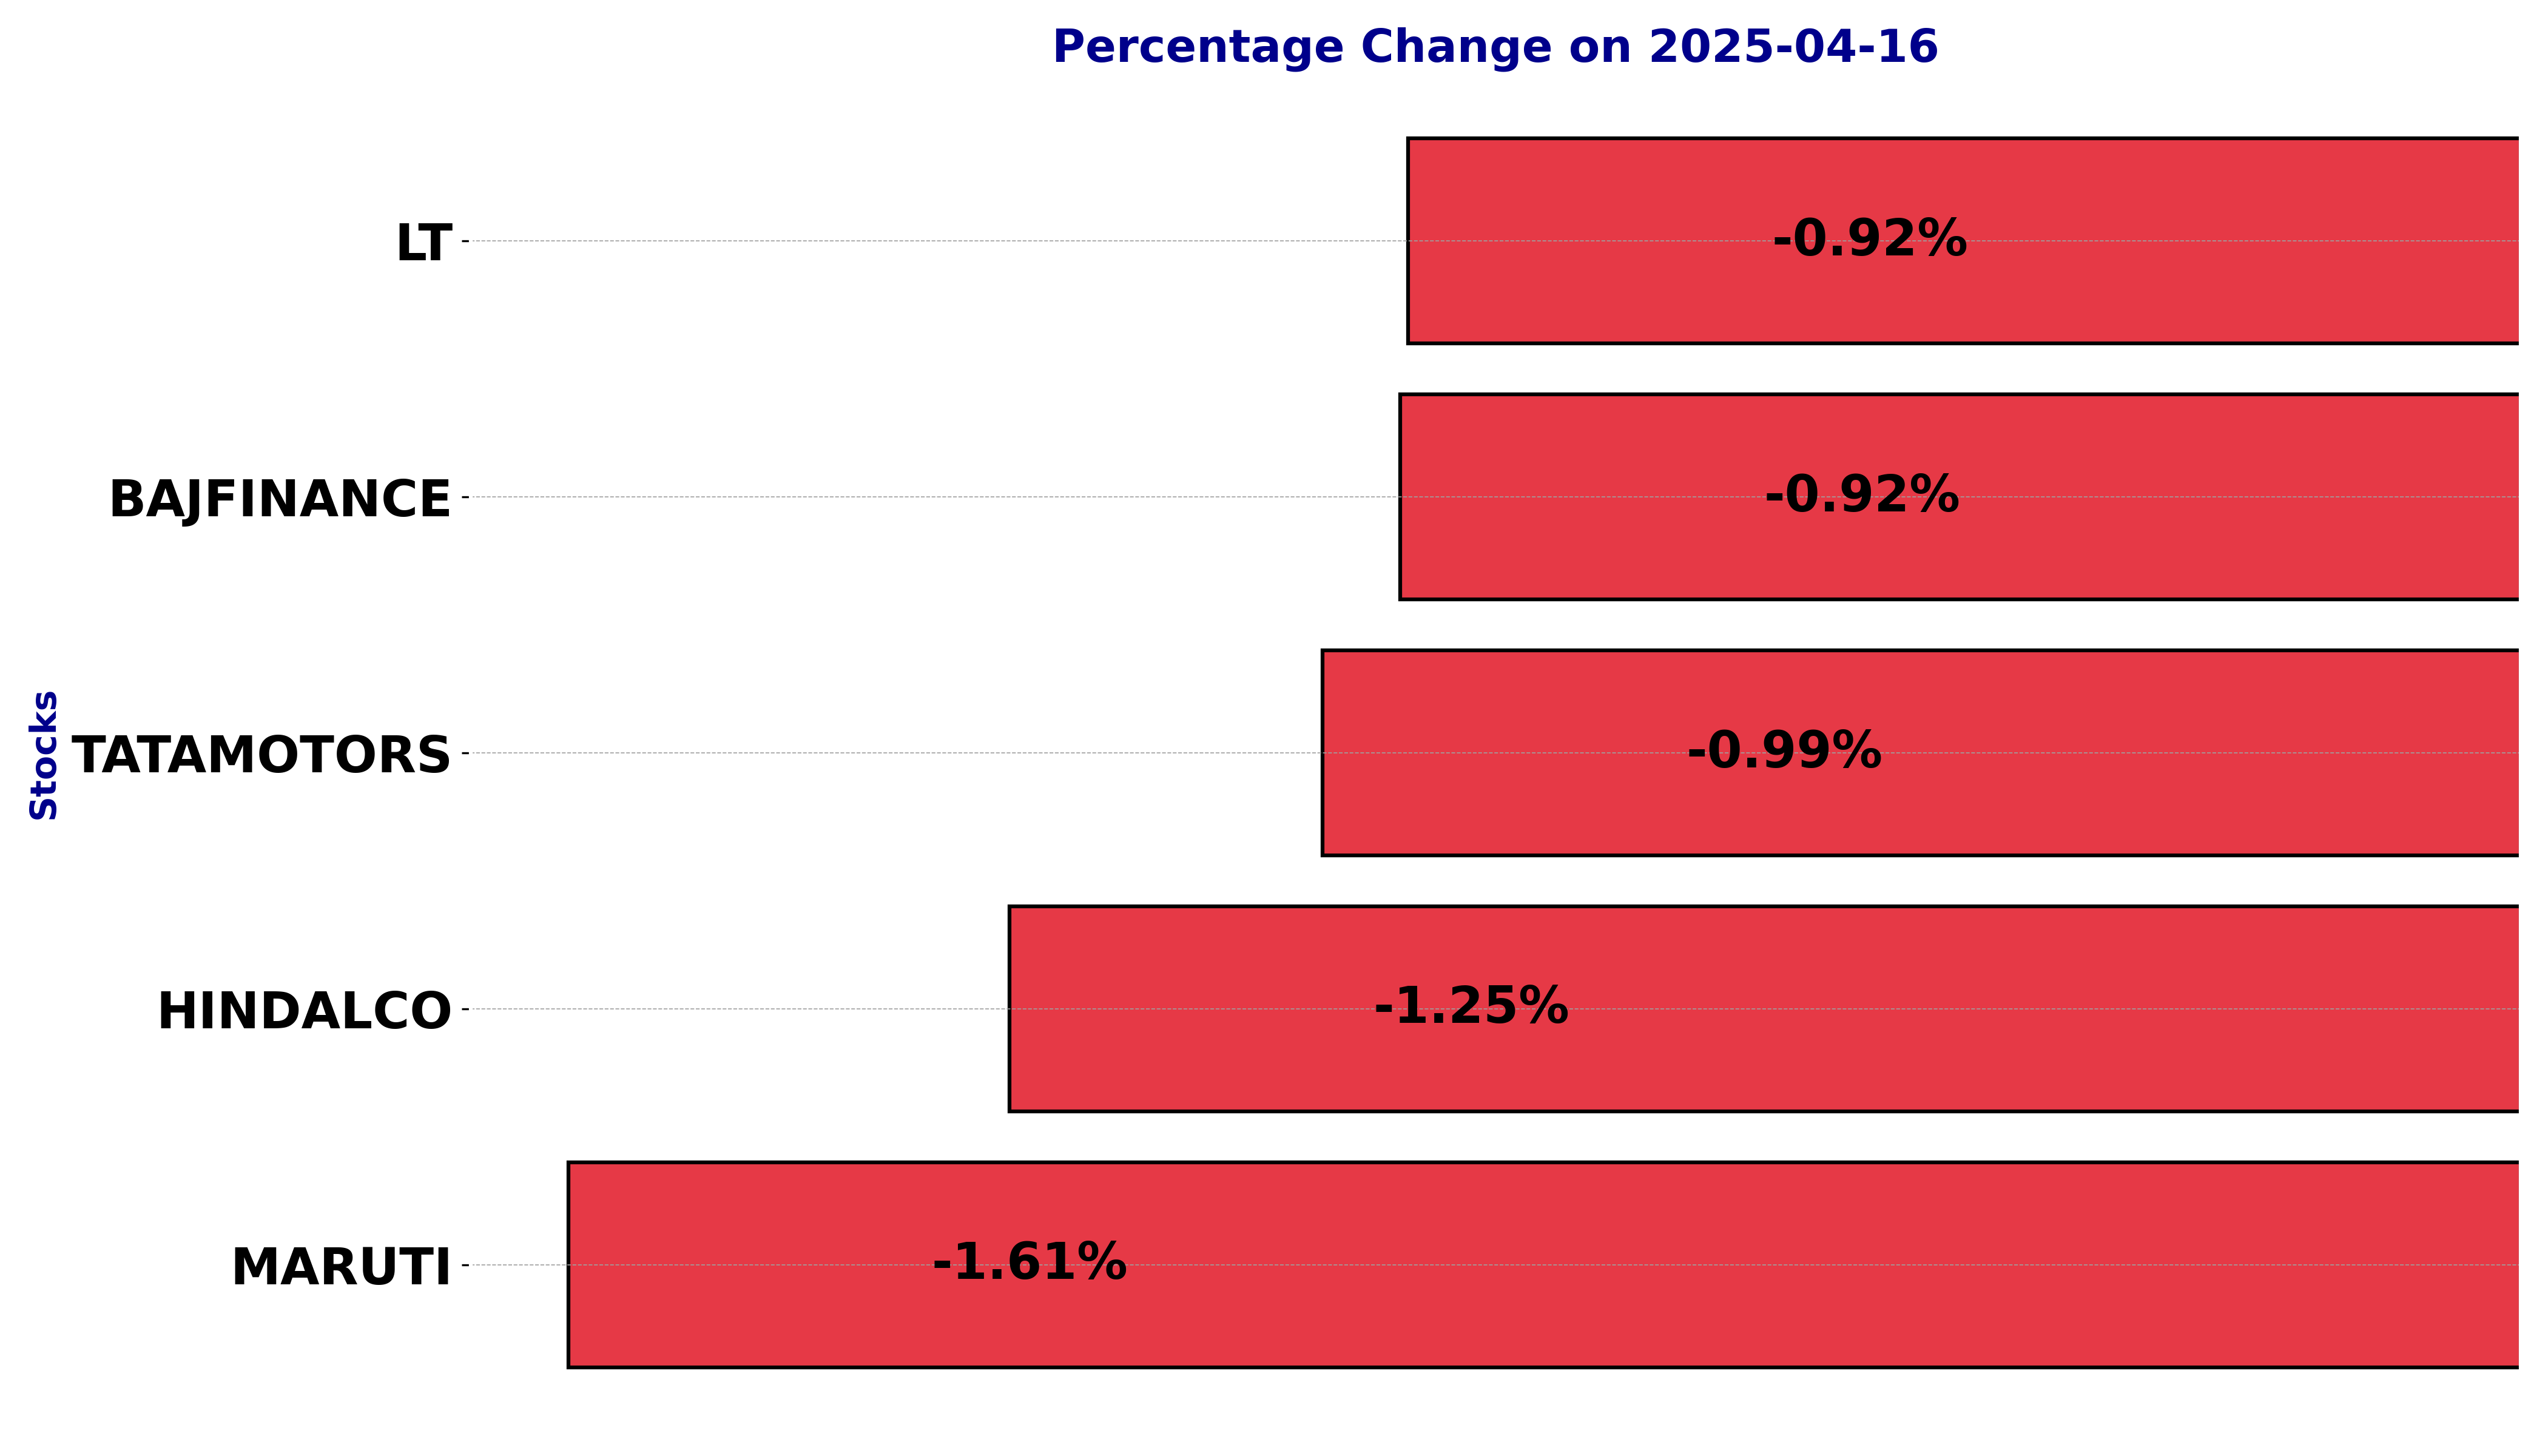
NSE Nifty 50 Top losers: What are the 5 Biggest Stock losers Today April 16, 2025


In this article, we will explore the technical indicators of some of the low-performing stocks on the Indian stock market, including BAJFINANCE, HINDALCO, LT, MARUTI, and TATAMOTORS.
By looking at these stocks through the lens of key technical factors, we aim to better understand their price movements, trends, and potential future performance.
Analysis for Bajaj Finance - April 16, 2025
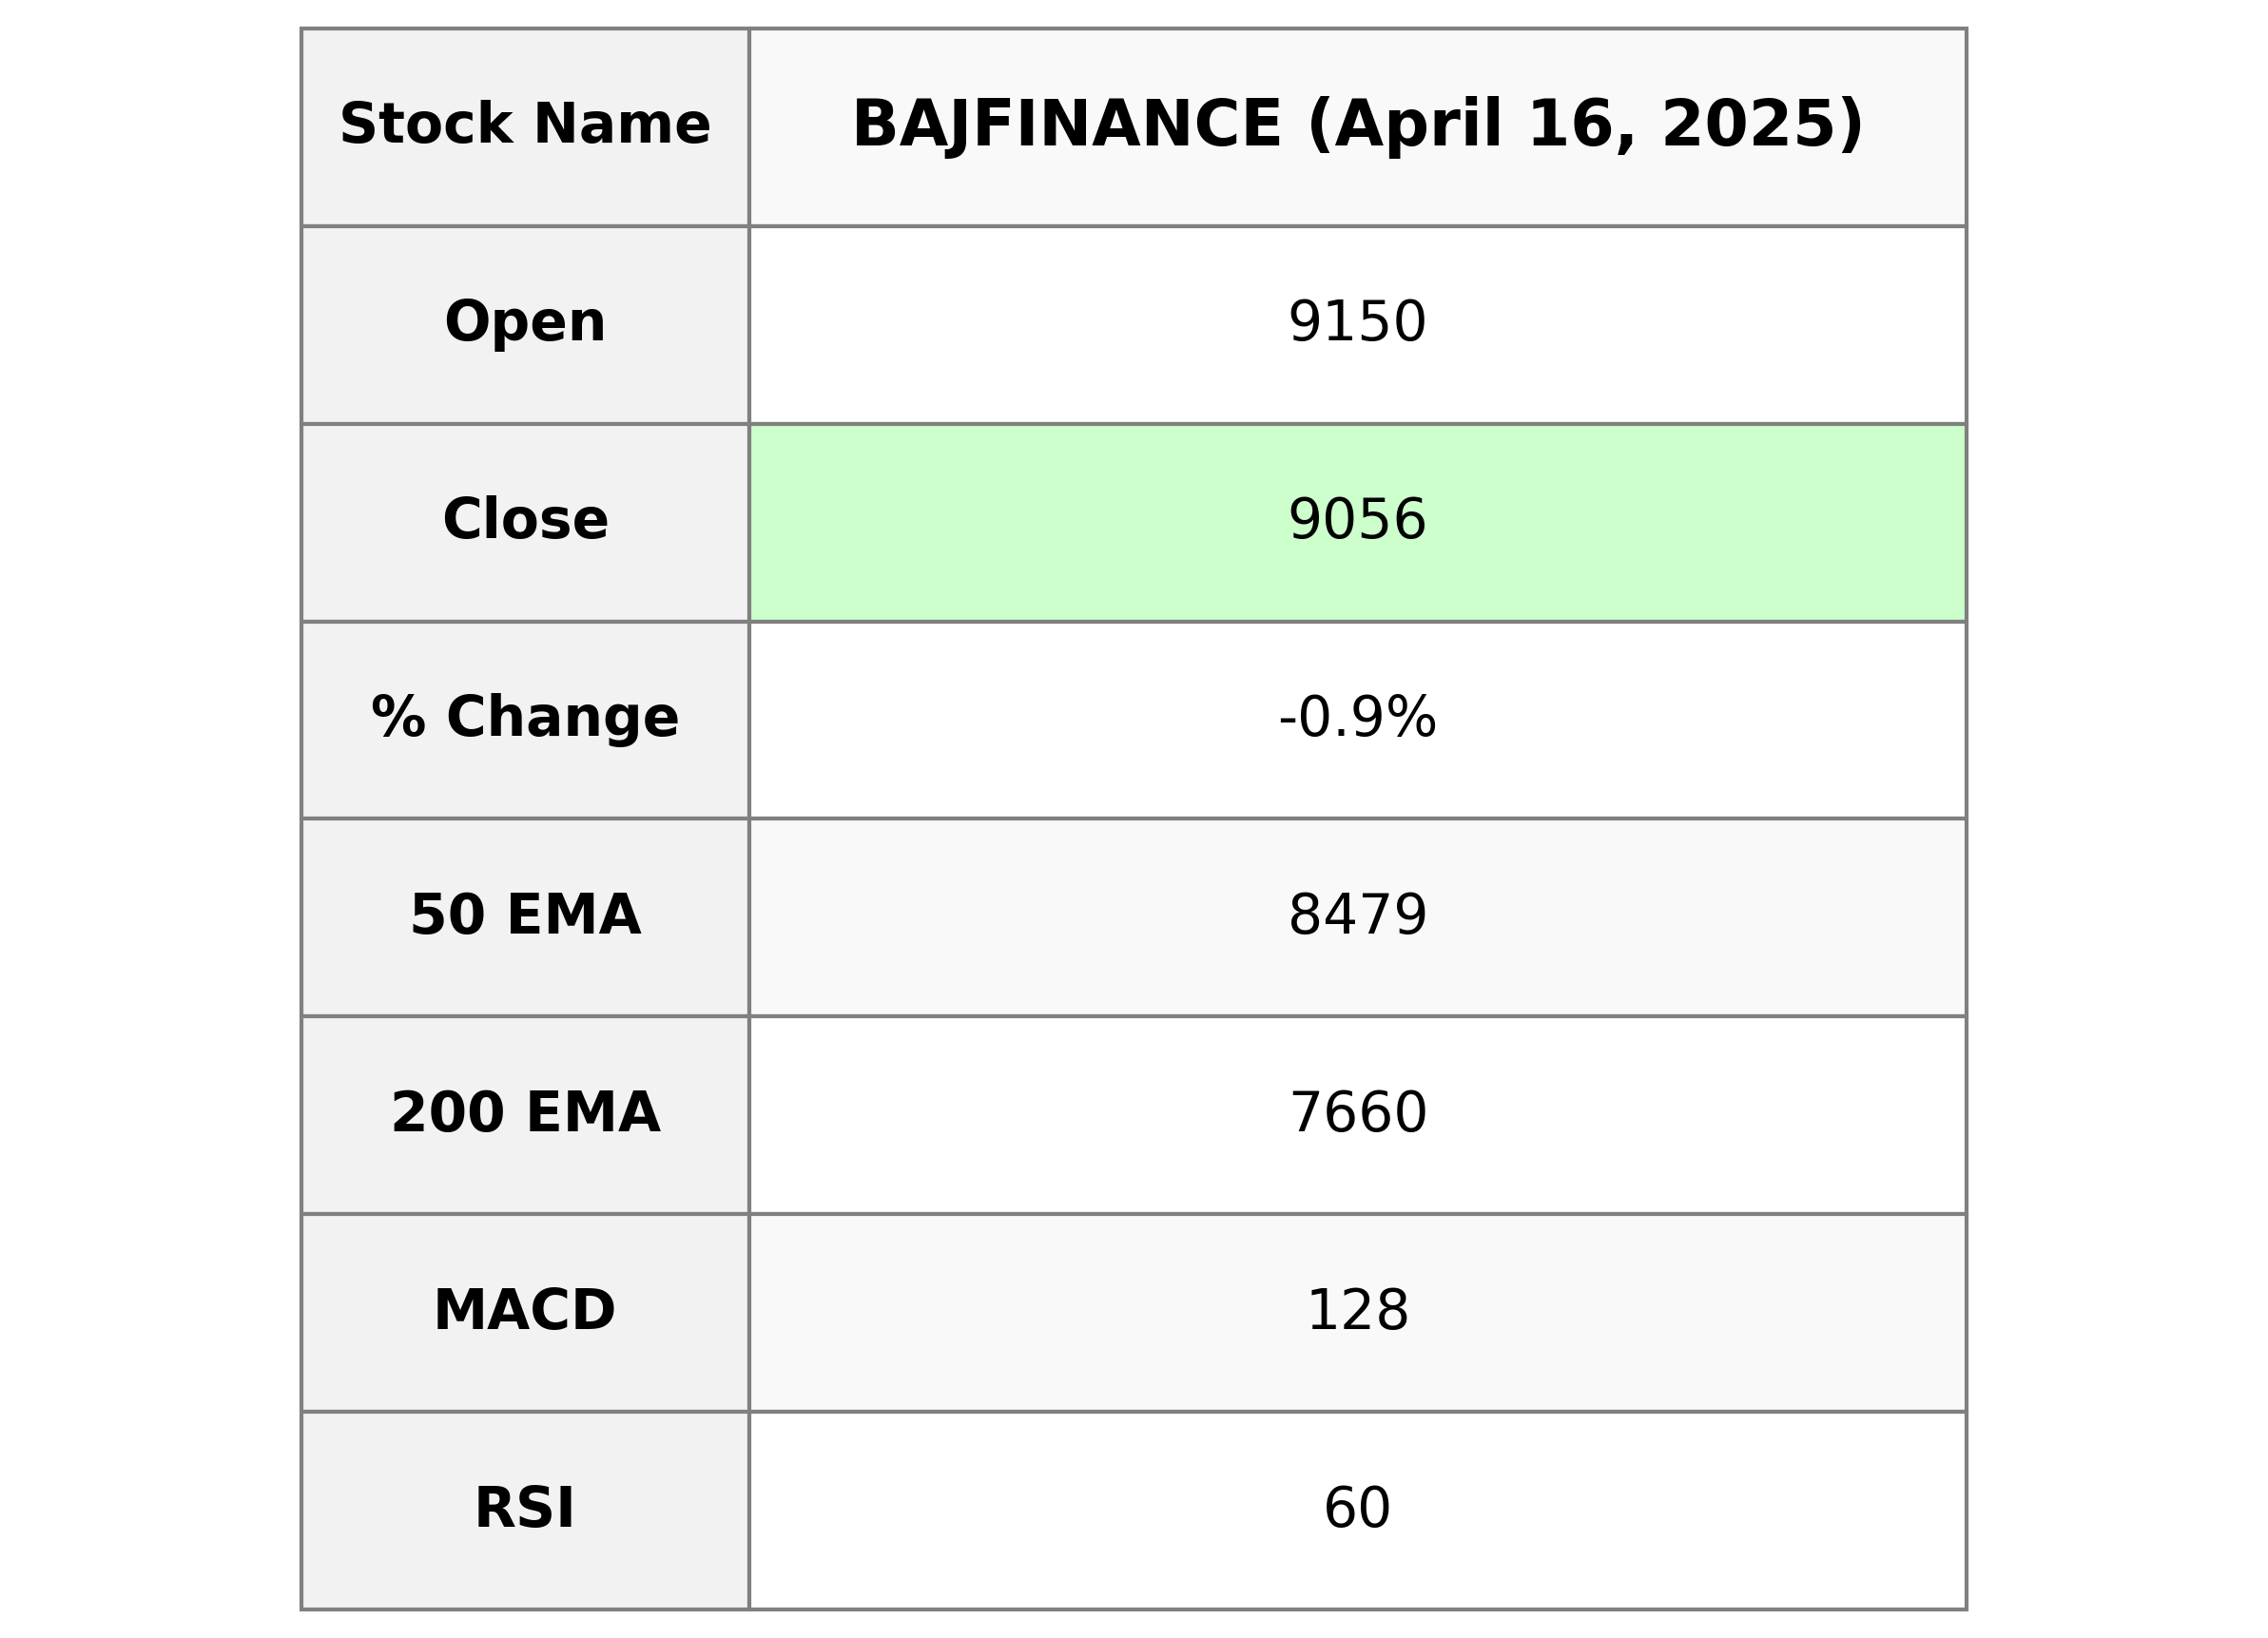
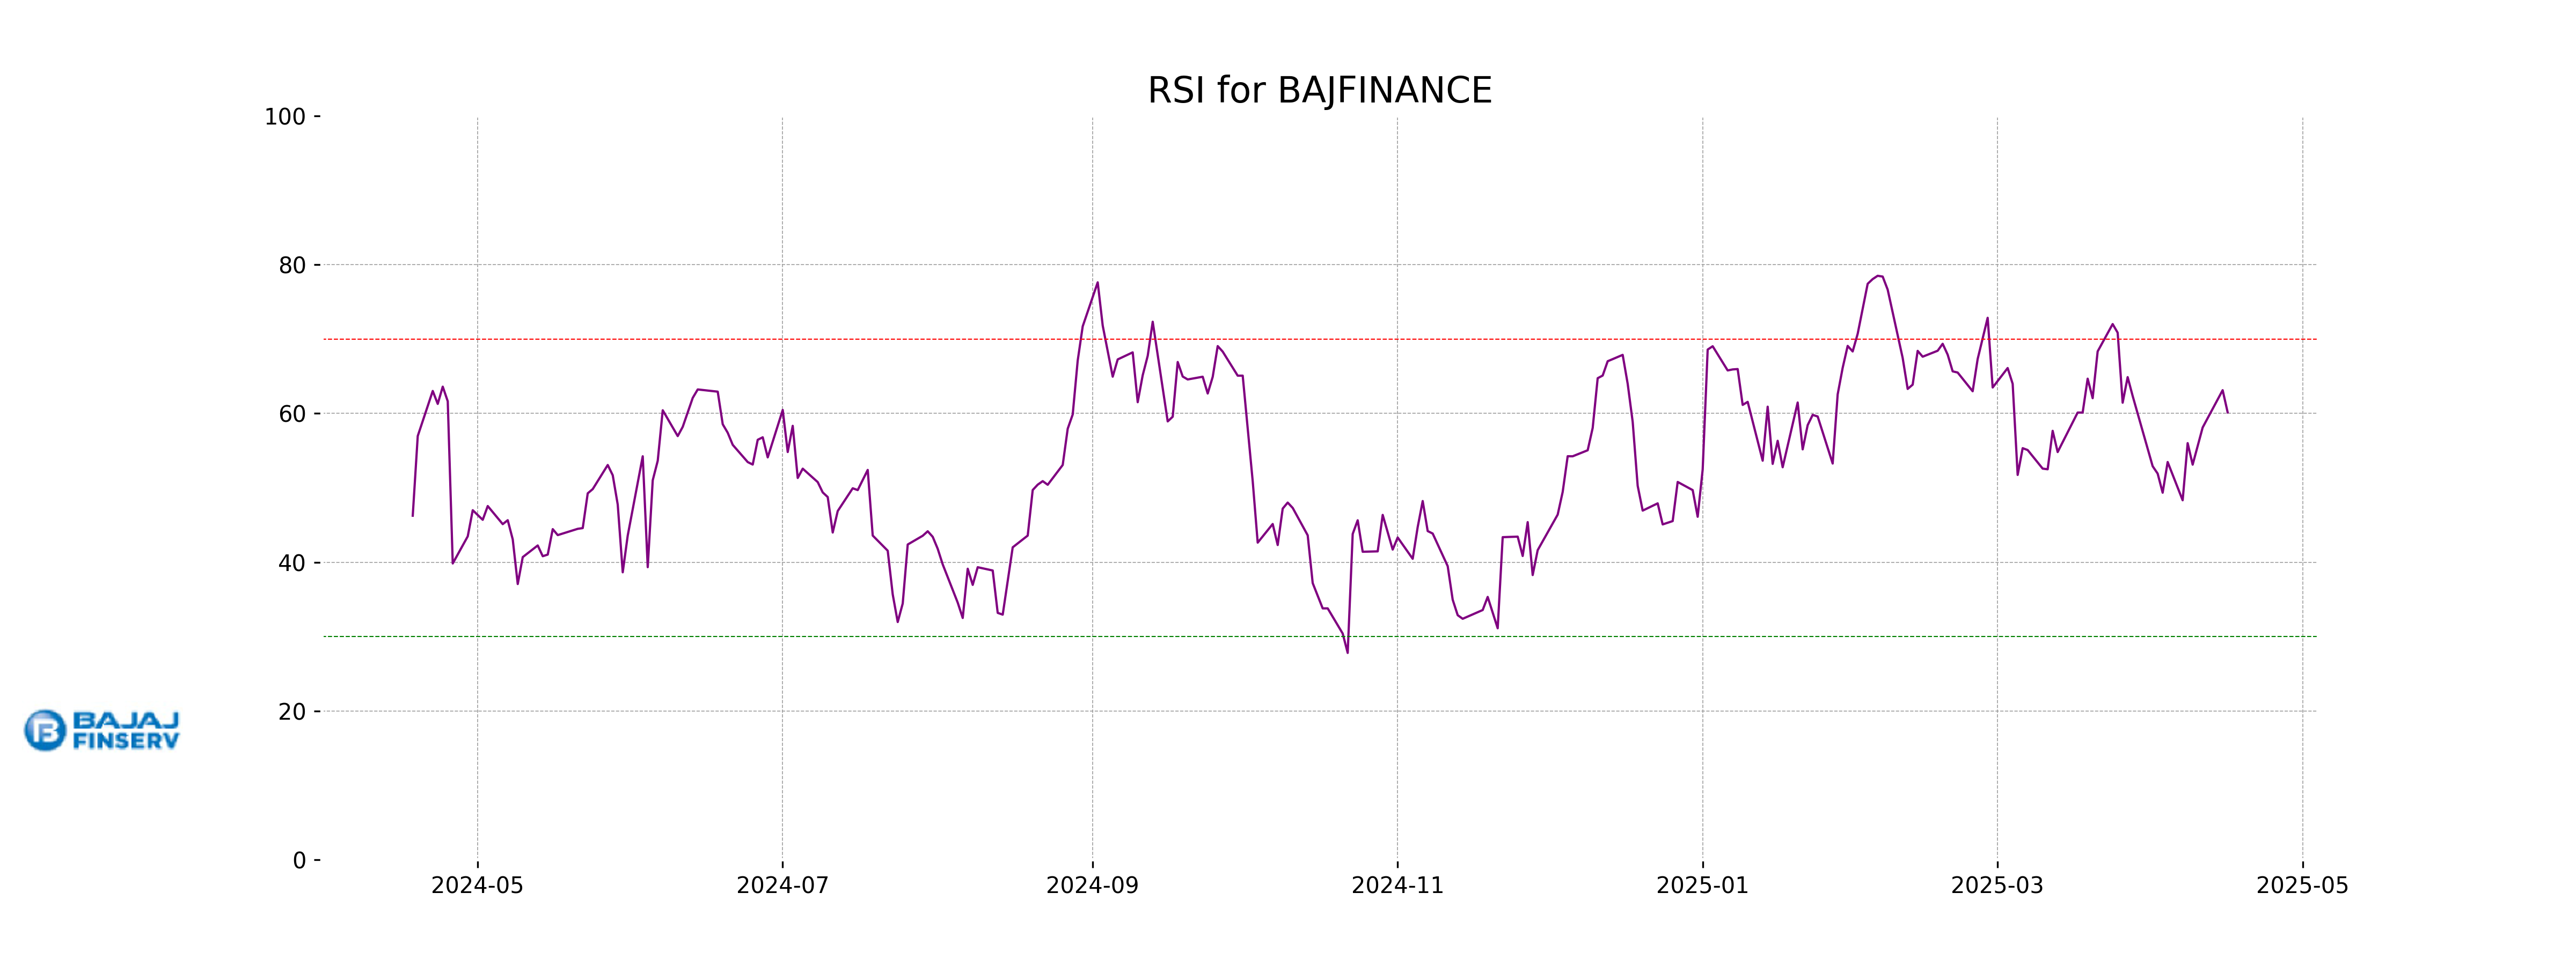
Bajaj Finance experienced a minor decline with a close of 9056.5, representing a -0.92% change from its previous close of 9141.0. The stock traded between a high of 9171.5 and a low of 8964.0, with a trading volume of 719,648 shares. Despite the slight dip, the stock remains above its key moving averages, indicating ongoing bullish momentum, as supported by an RSI of 60.15 and a positive MACD crossover.
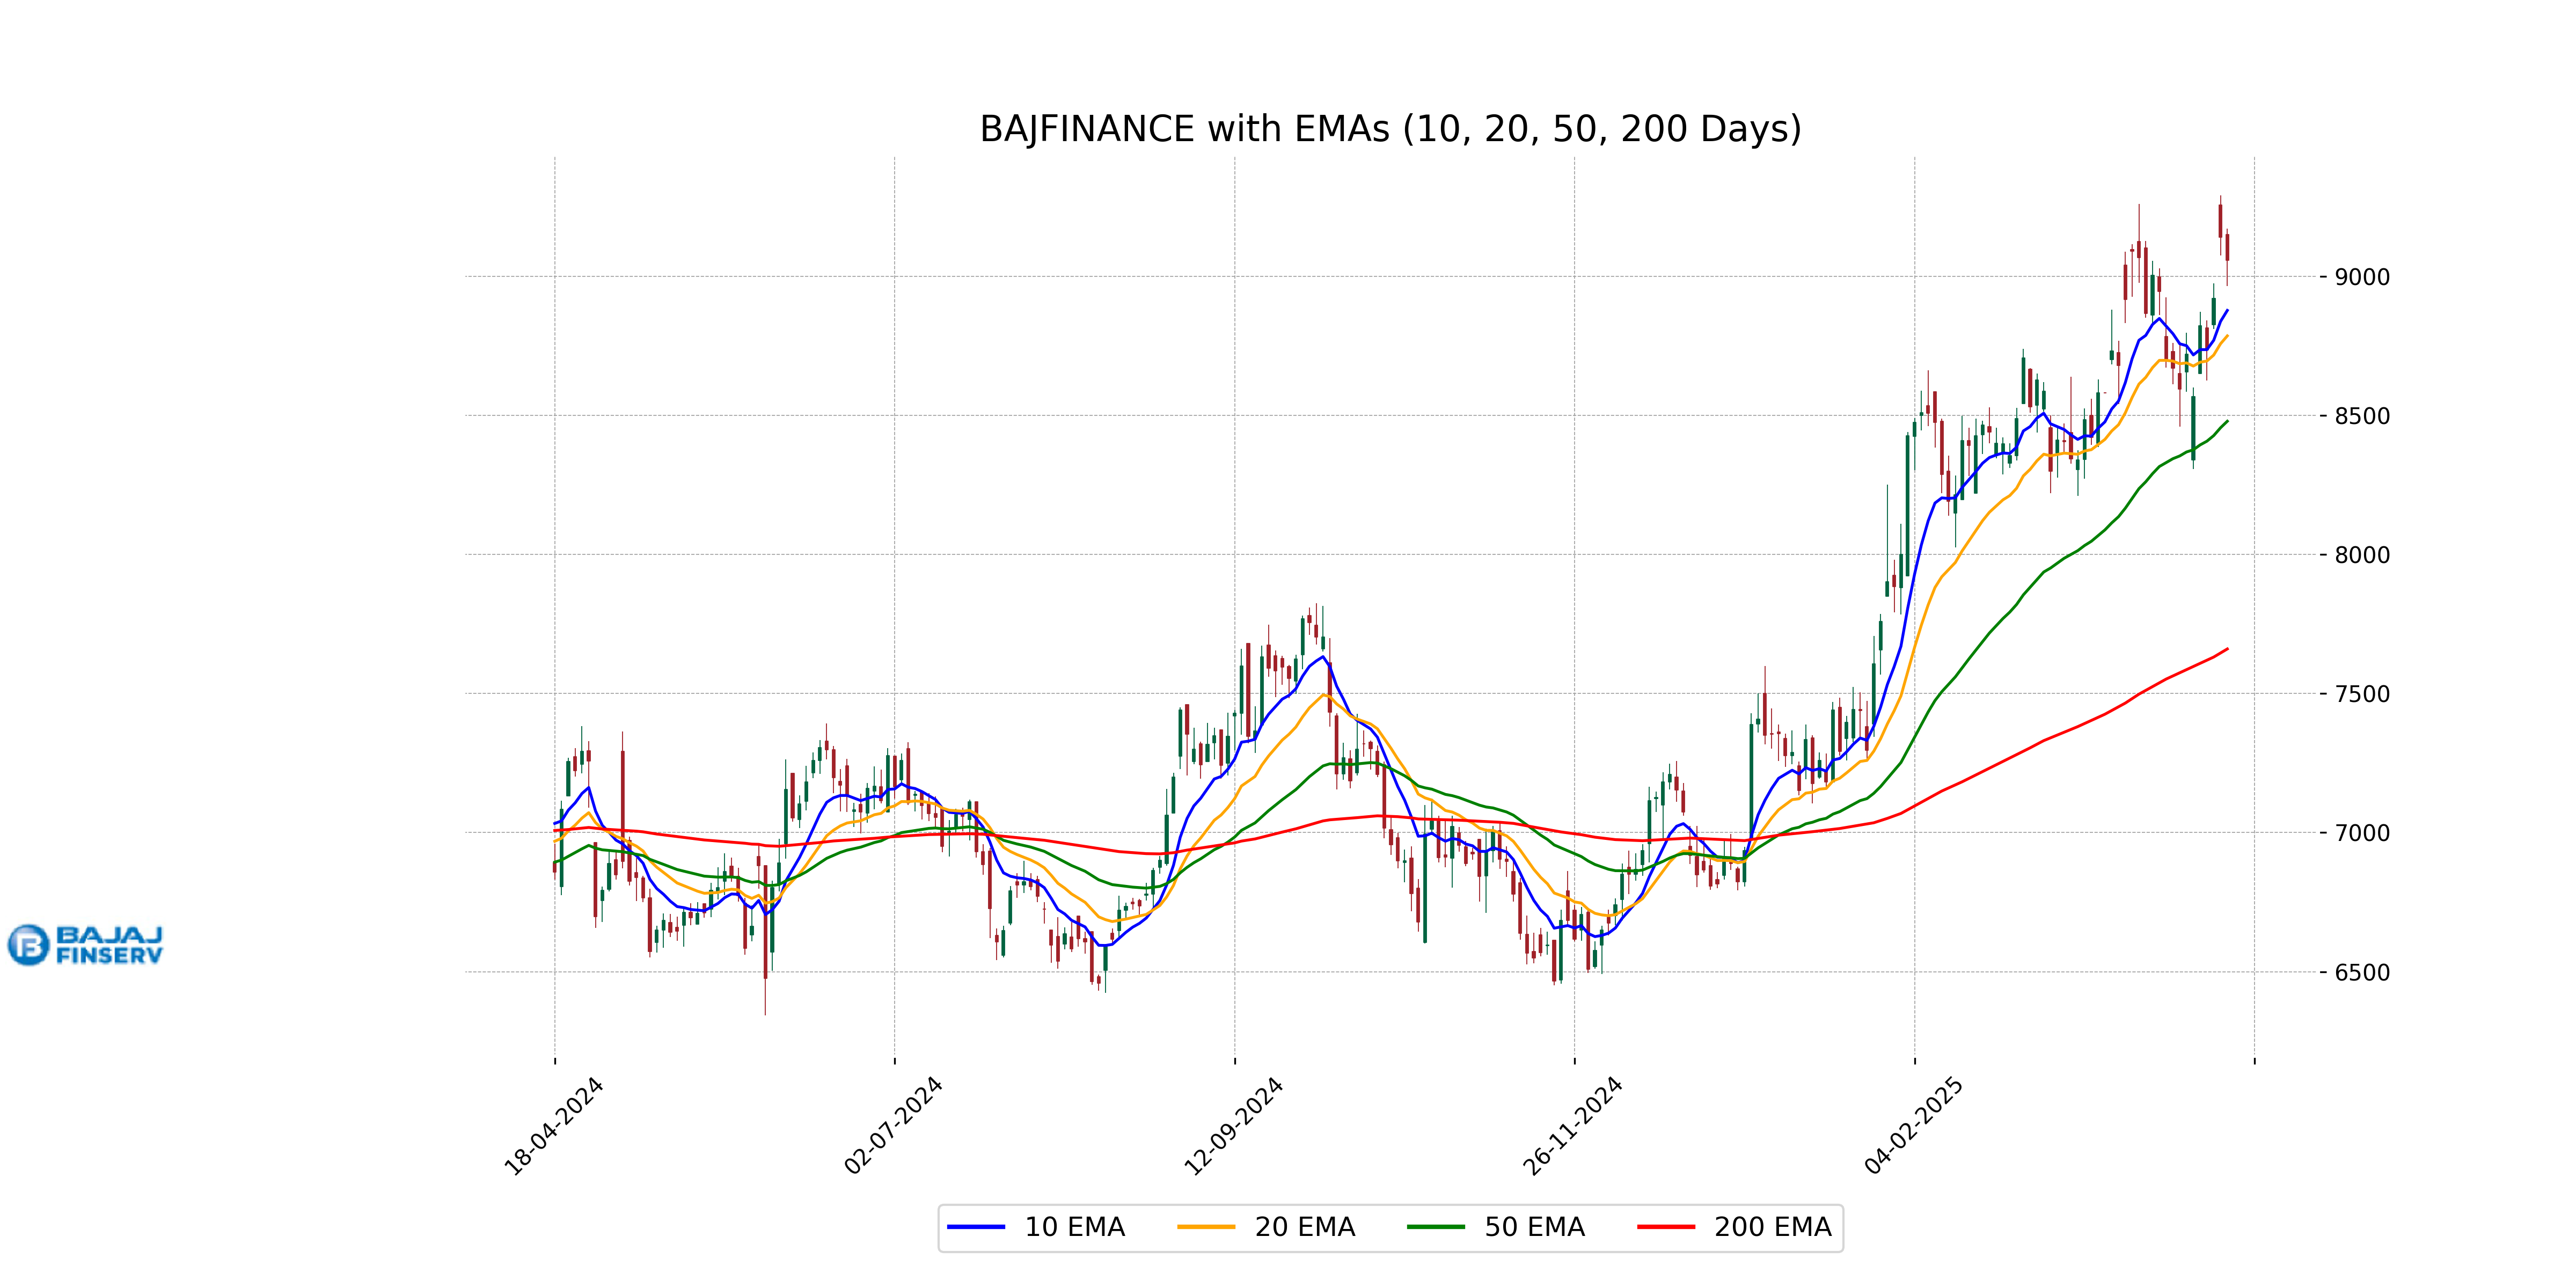
Relationship with Key Moving Averages
Bajaj Finance is currently trading below its 50-day EMA of 8478.77 but above its 200-day EMA of 7660.26, suggesting that the stock's short-term trend may be weaker than its longer-term trend. Additionally, its close price of 9056.5 is above the 10-day EMA of 8877.14 and the 20-day EMA of 8785.61, indicating recent short-term strength.
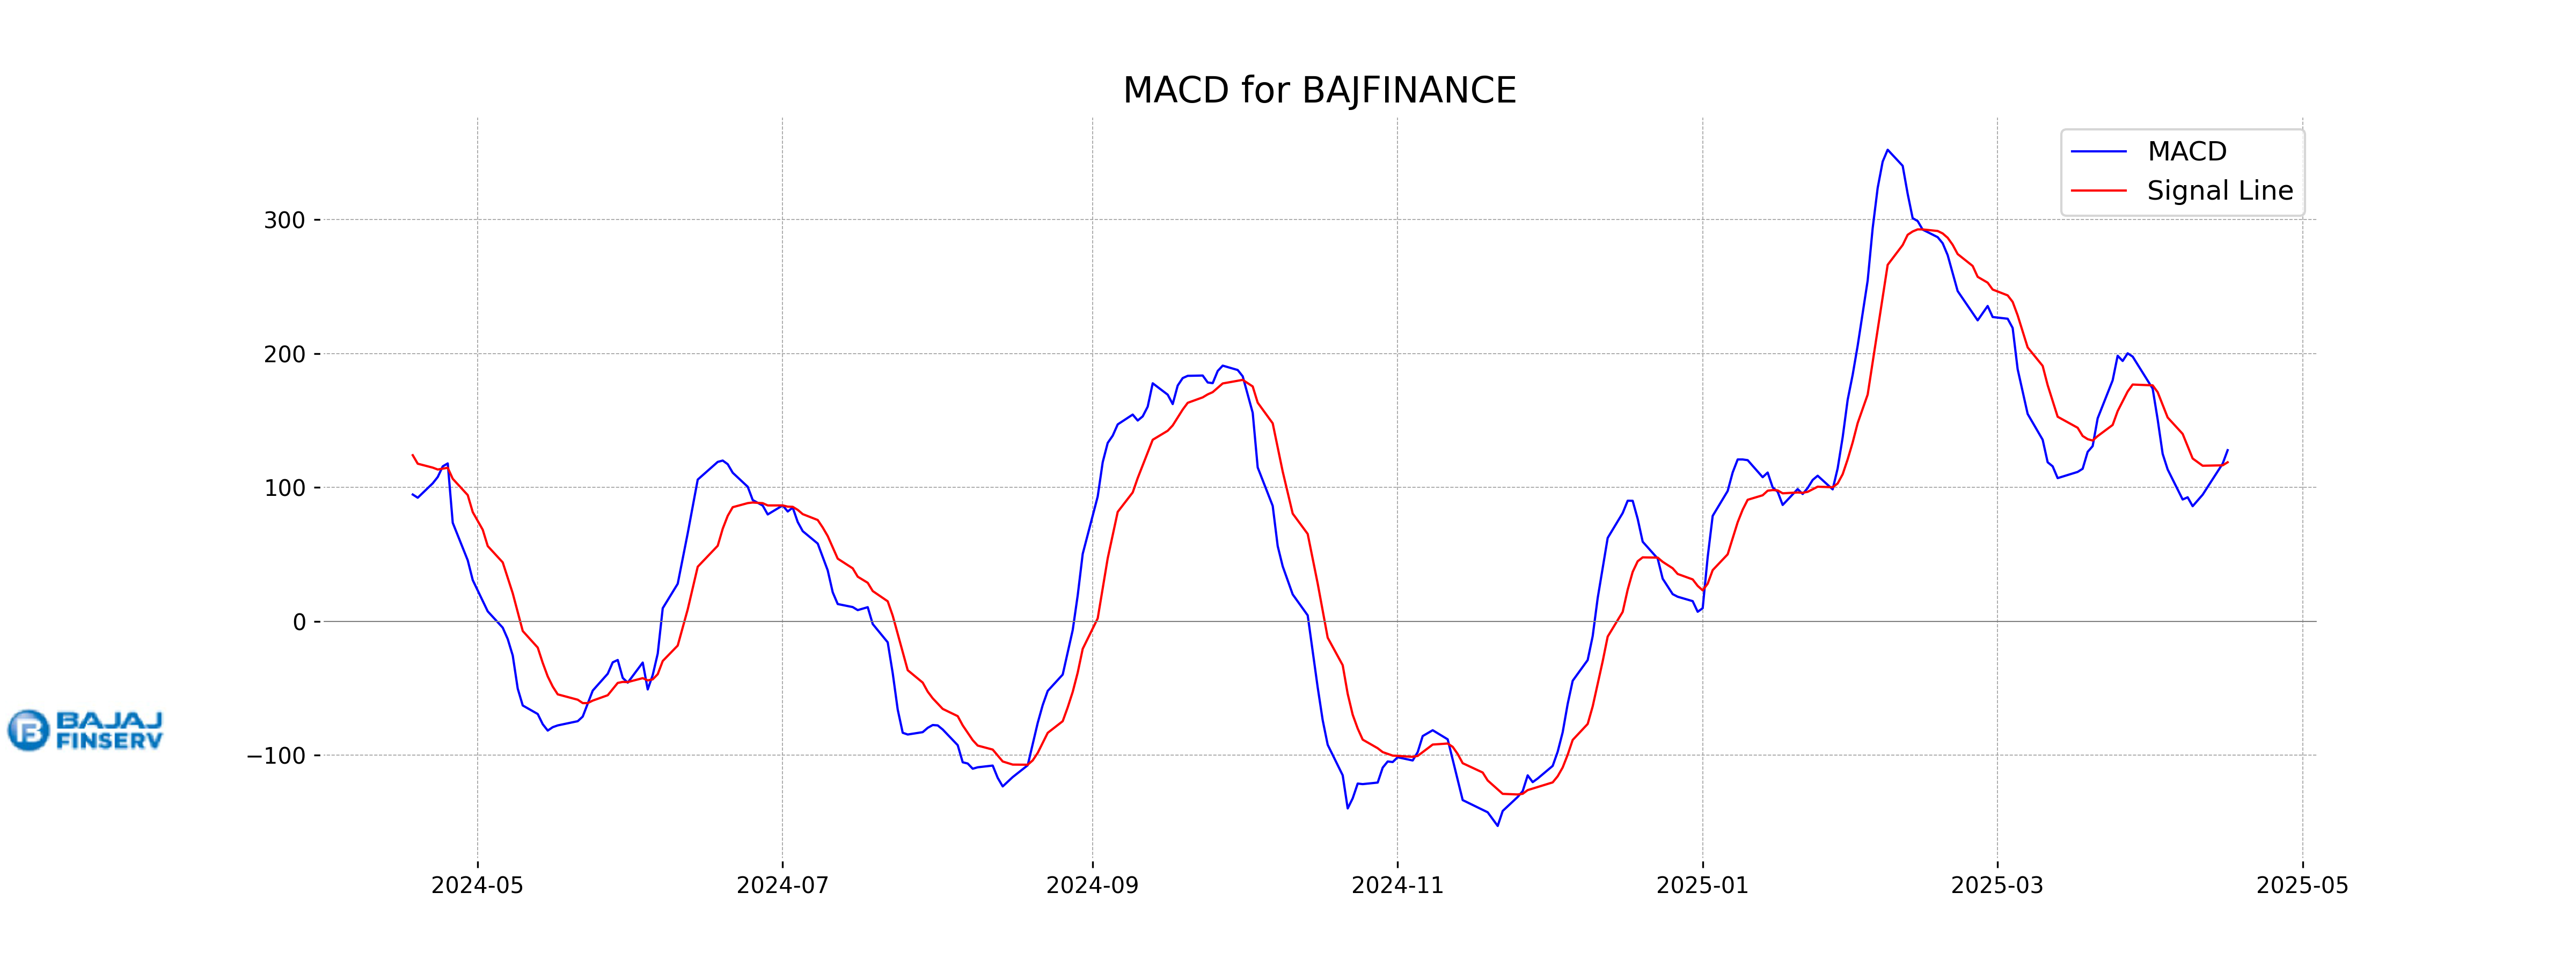
Moving Averages Trend (MACD)
Bajaj Finance: The MACD line (127.79) is above the MACD Signal line (118.73), which suggests a bullish trend. The relatively high RSI of 60.15 supports this bullish sentiment, indicating upward momentum.
RSI Analysis
The RSI value for Bajaj Finance is 60.15, indicating a relatively neutral market condition, though leaning slightly towards bullishness. An RSI above 70 typically suggests overbought conditions, while below 30 indicates oversold, so the current RSI suggests the stock is neither overvalued nor undervalued.
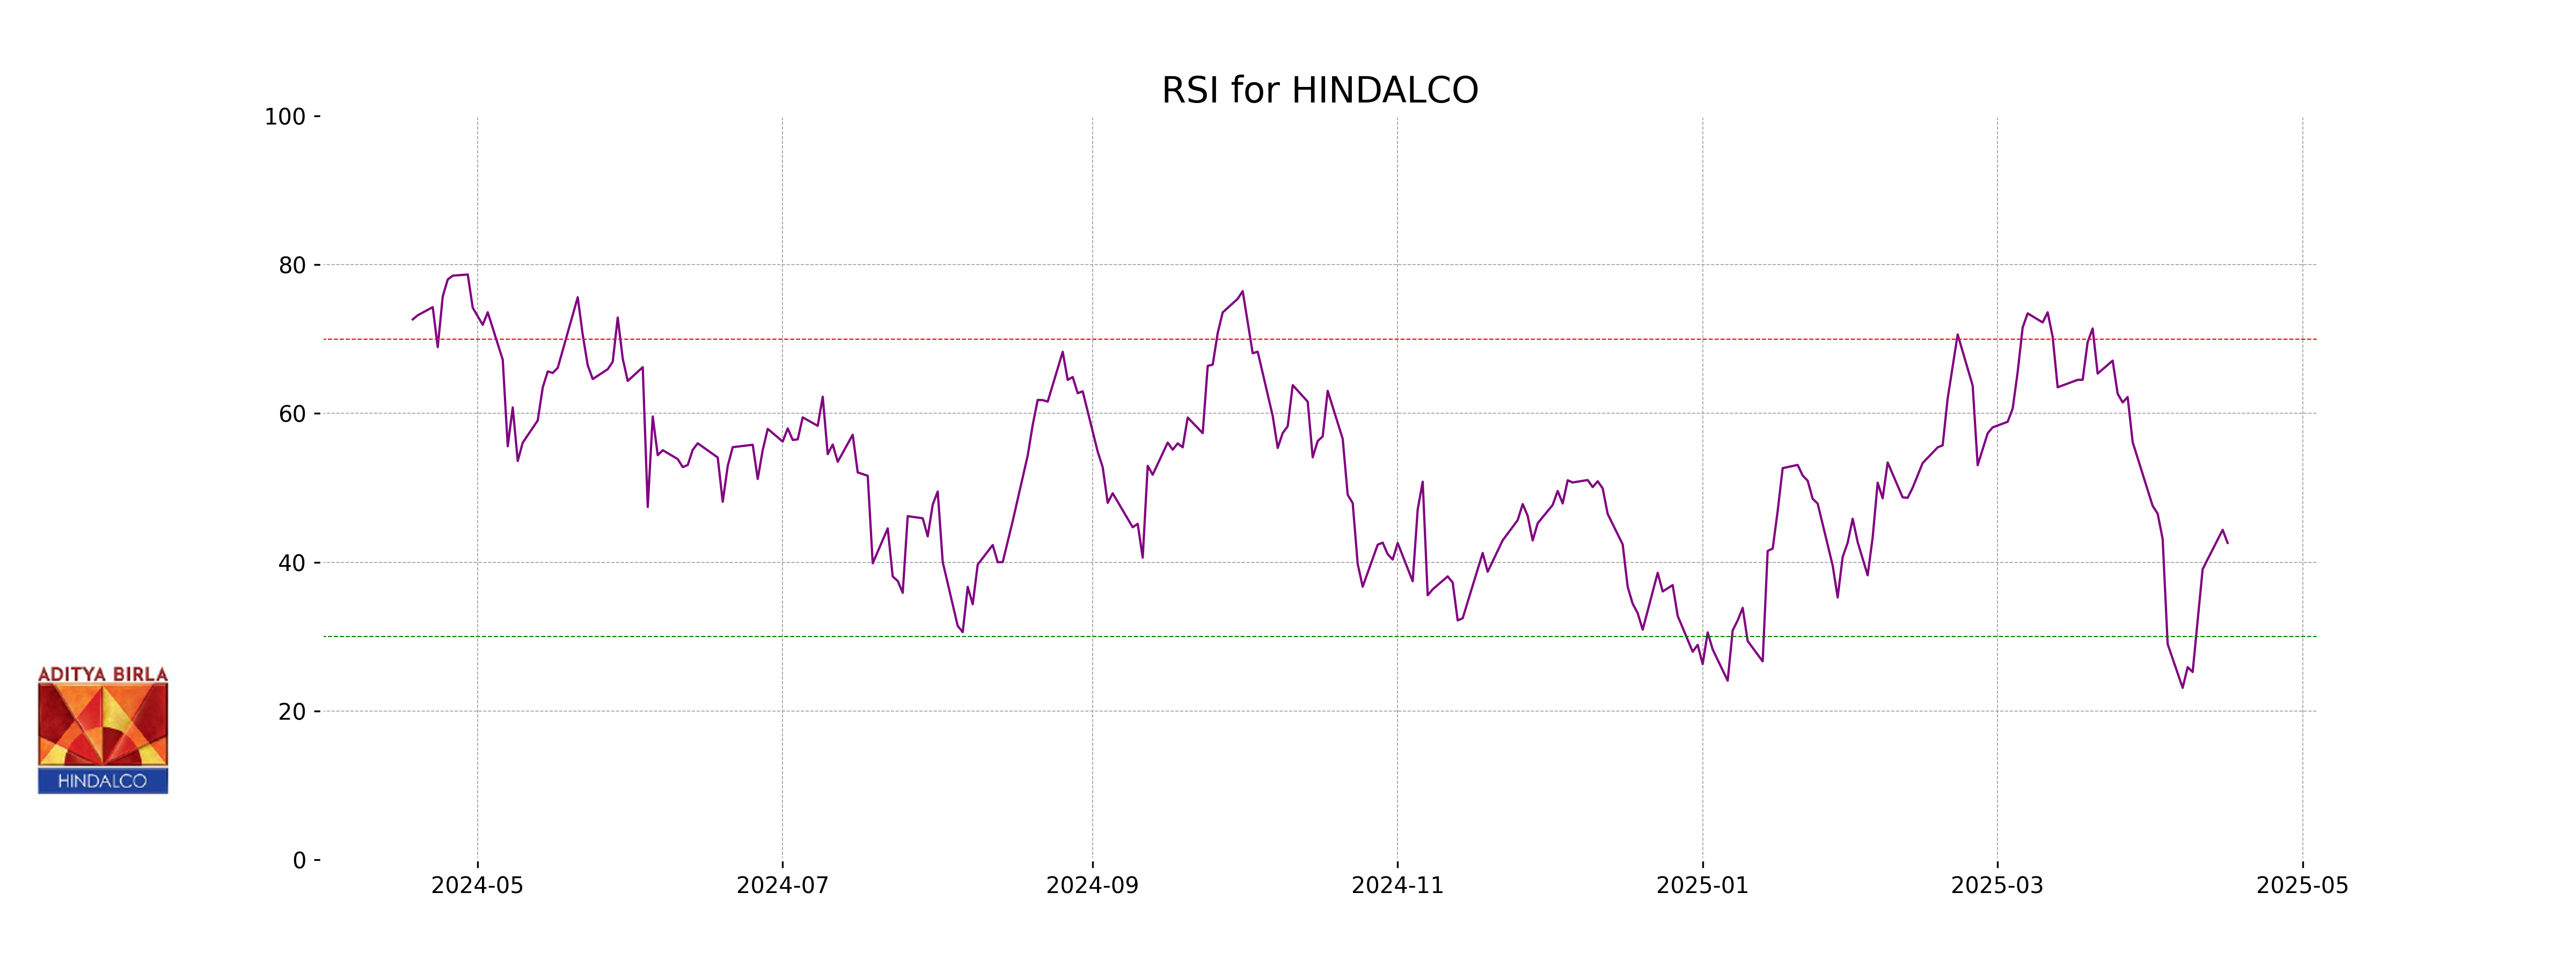
Analysis for HINDALCO - April 16, 2025
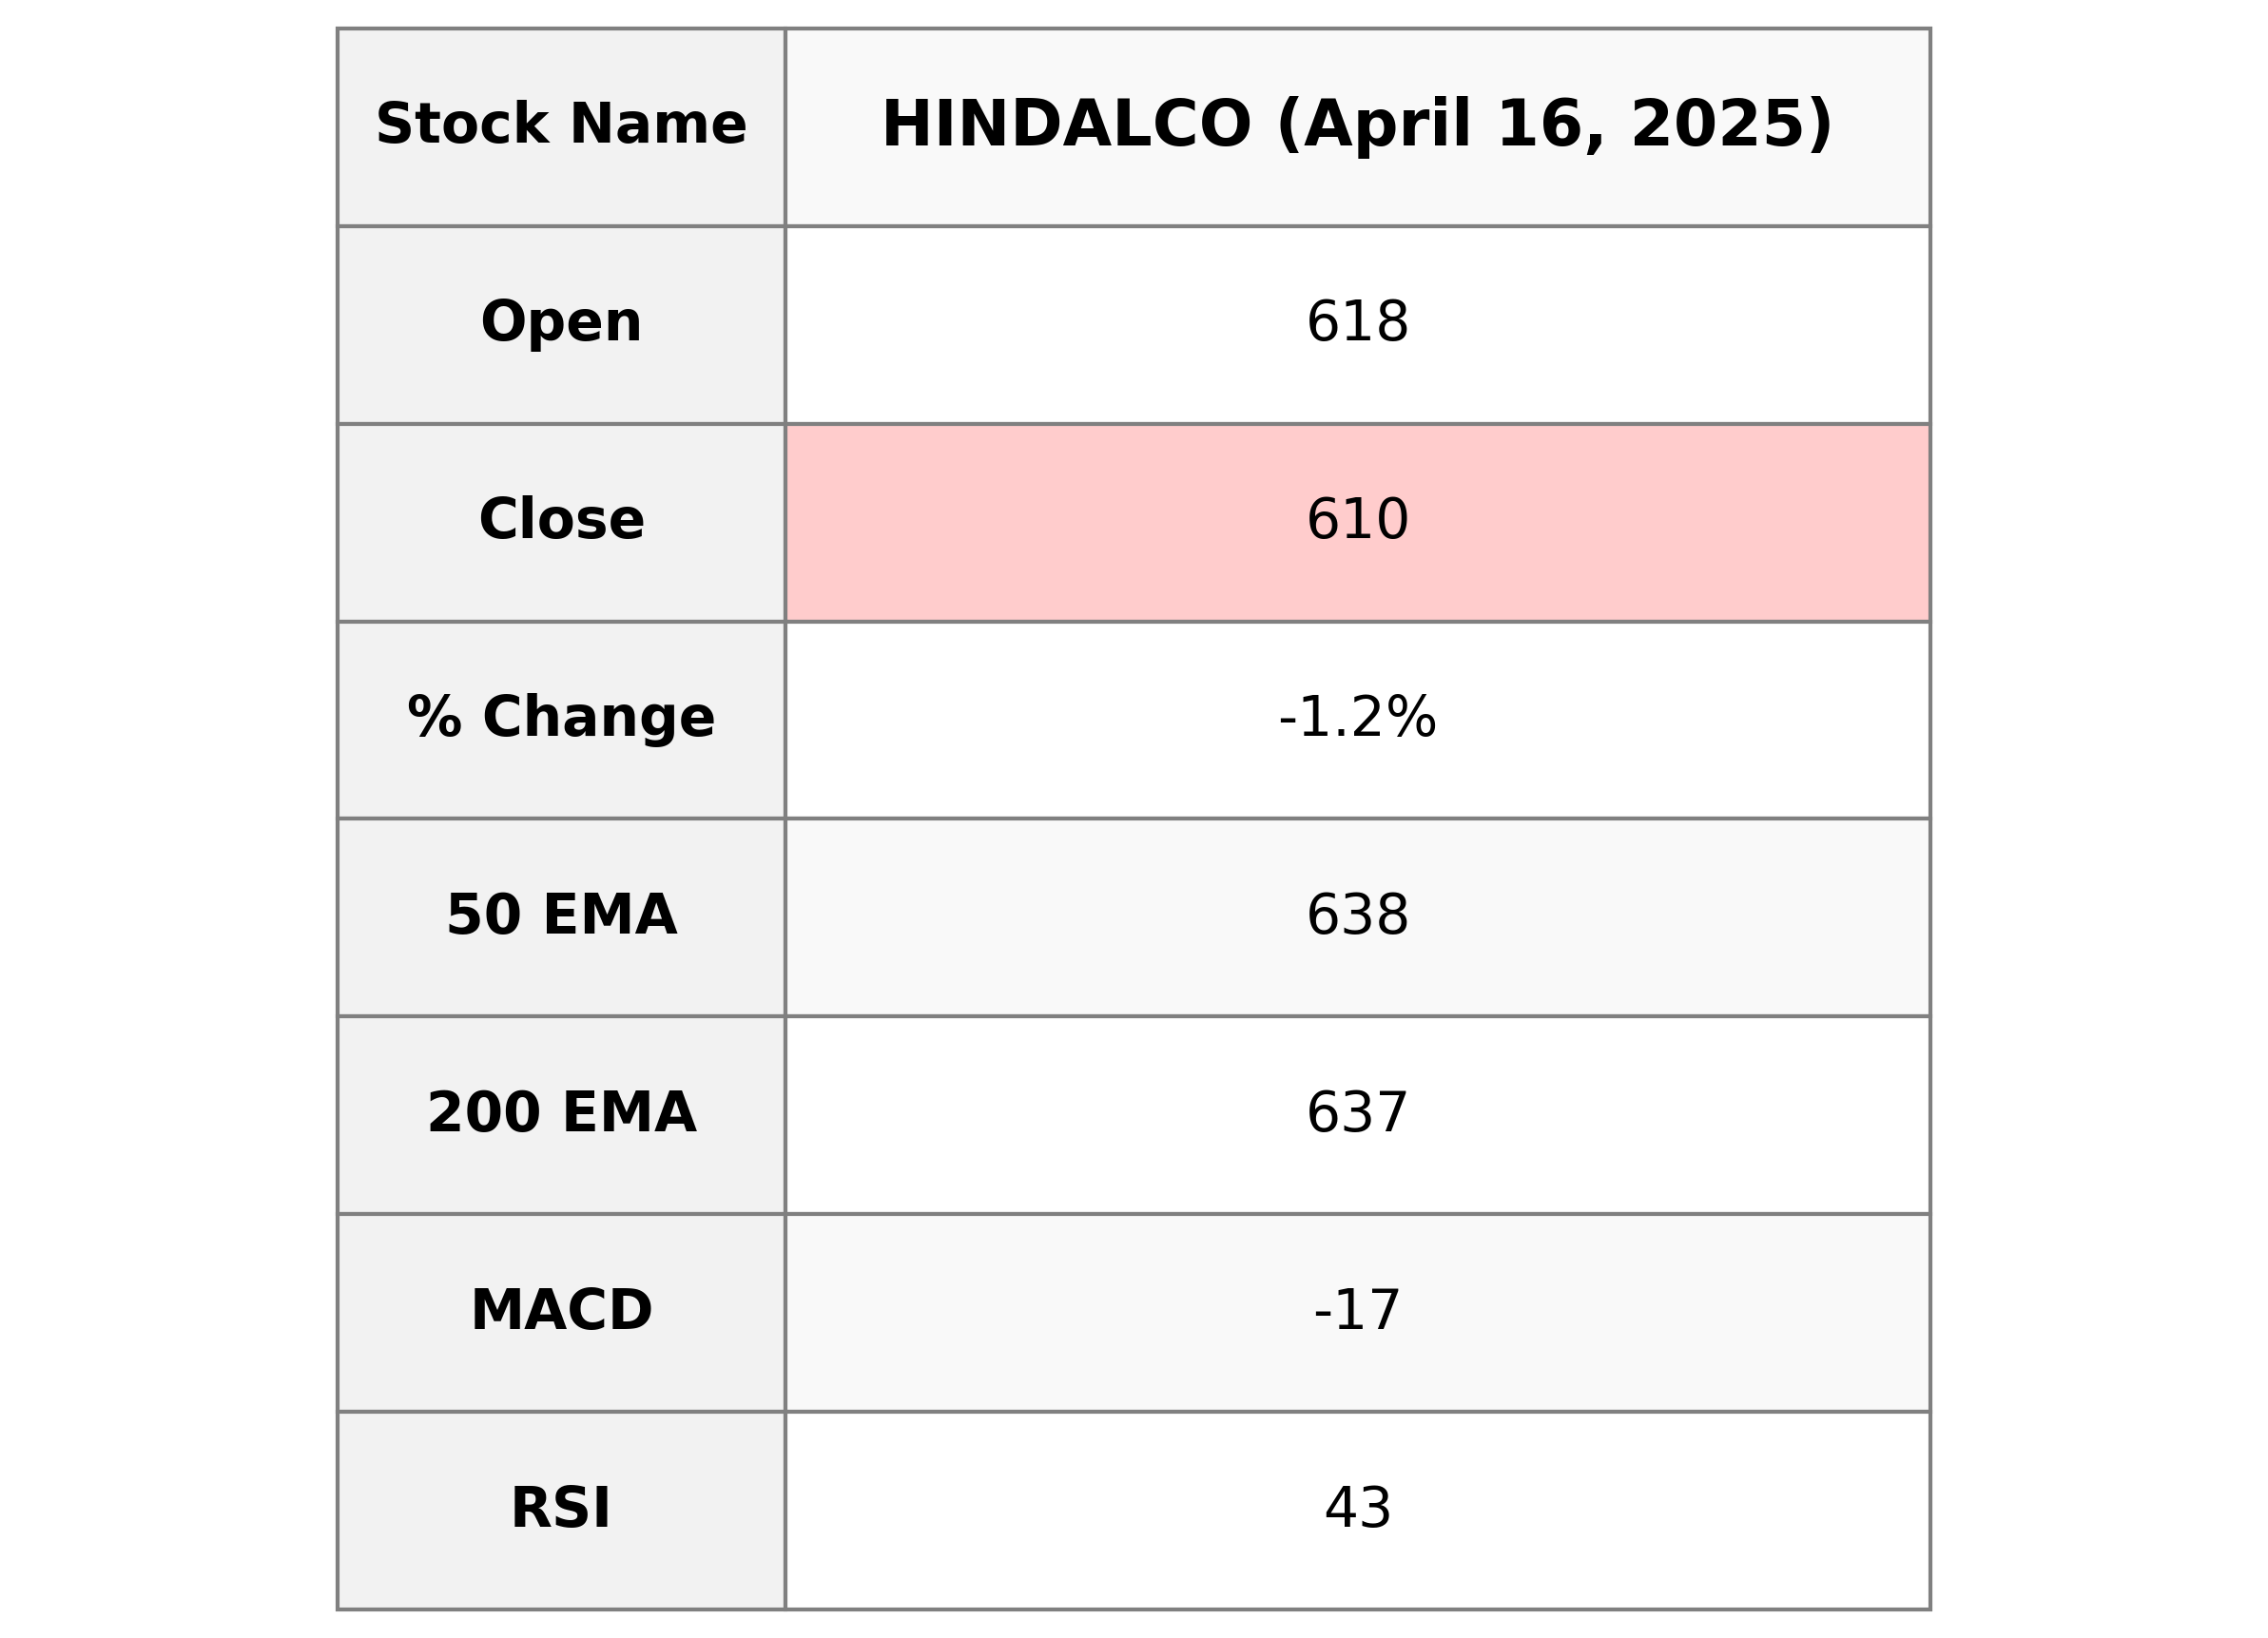
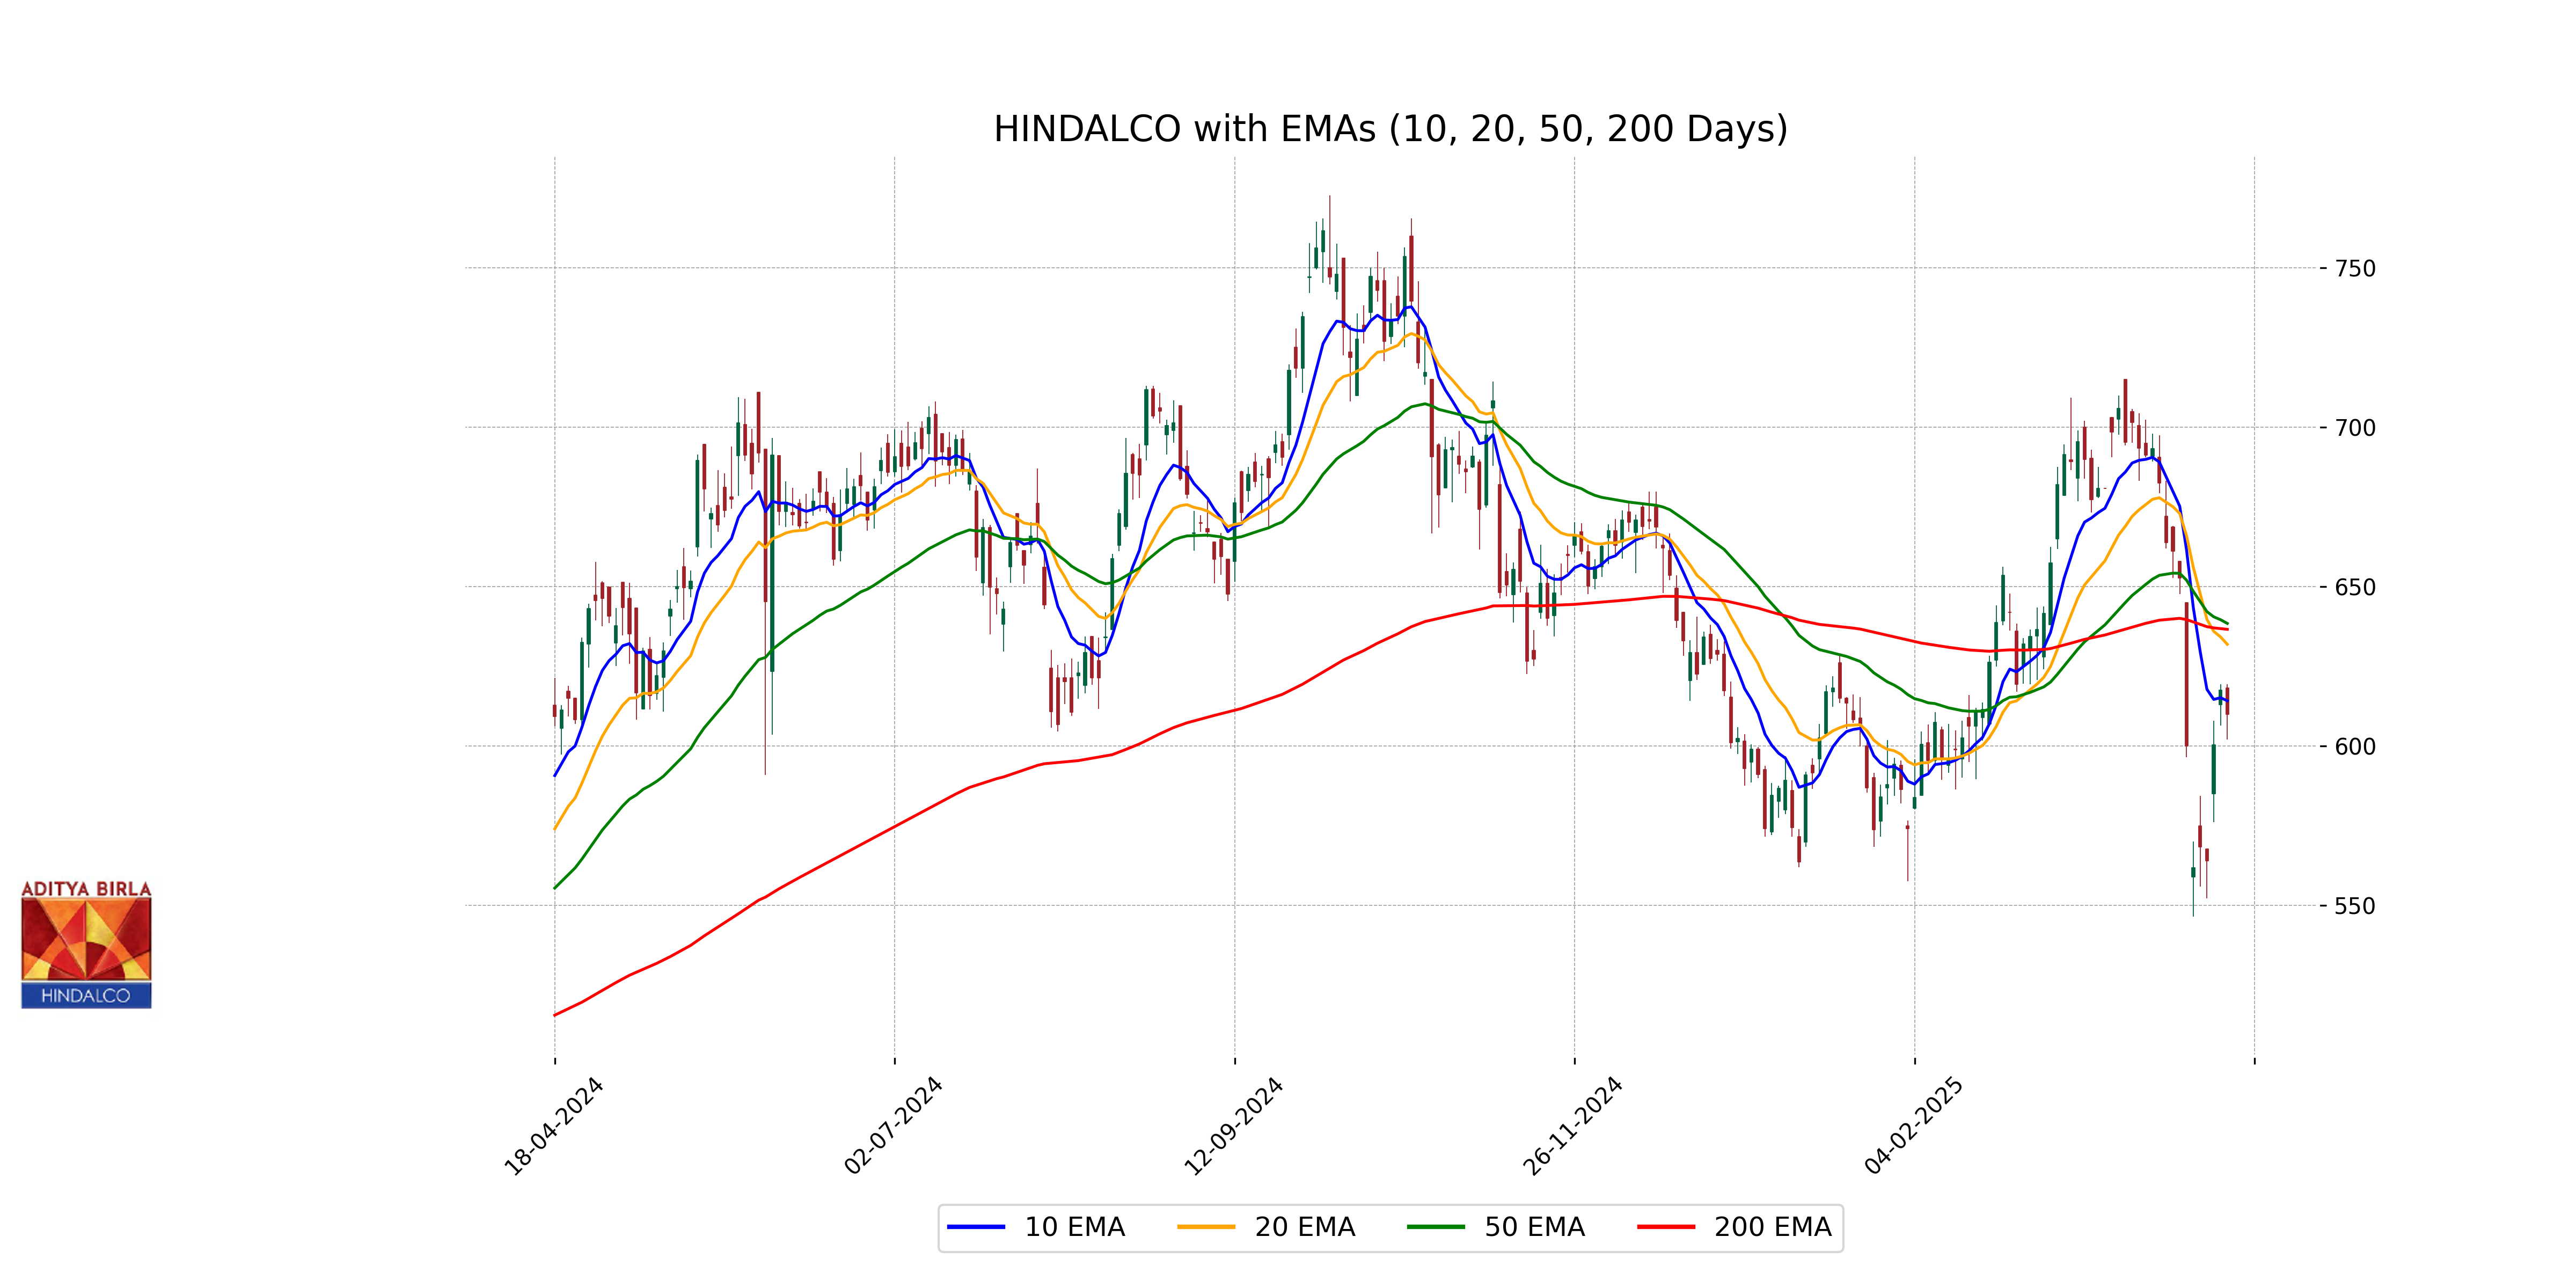
HINDALCO has experienced a decline, with the stock closing at 609.90, a decrease of 1.25% from its previous close. The stock remains below its 10, 50, and 200-day EMAs, indicating bearish momentum. The RSI of 42.58 suggests it's nearing an oversold condition, while the MACD further supports a bearish trend.
Relationship with Key Moving Averages
The stock price of Hindalco is trading below its key moving averages, with a current close of 609.90 compared to the 50-EMA at 638.46, the 200-EMA at 636.60, and the 20-EMA at 631.91. This bearish position suggests potential downward momentum or weakness relative to these moving averages.
Moving Averages Trend (MACD)
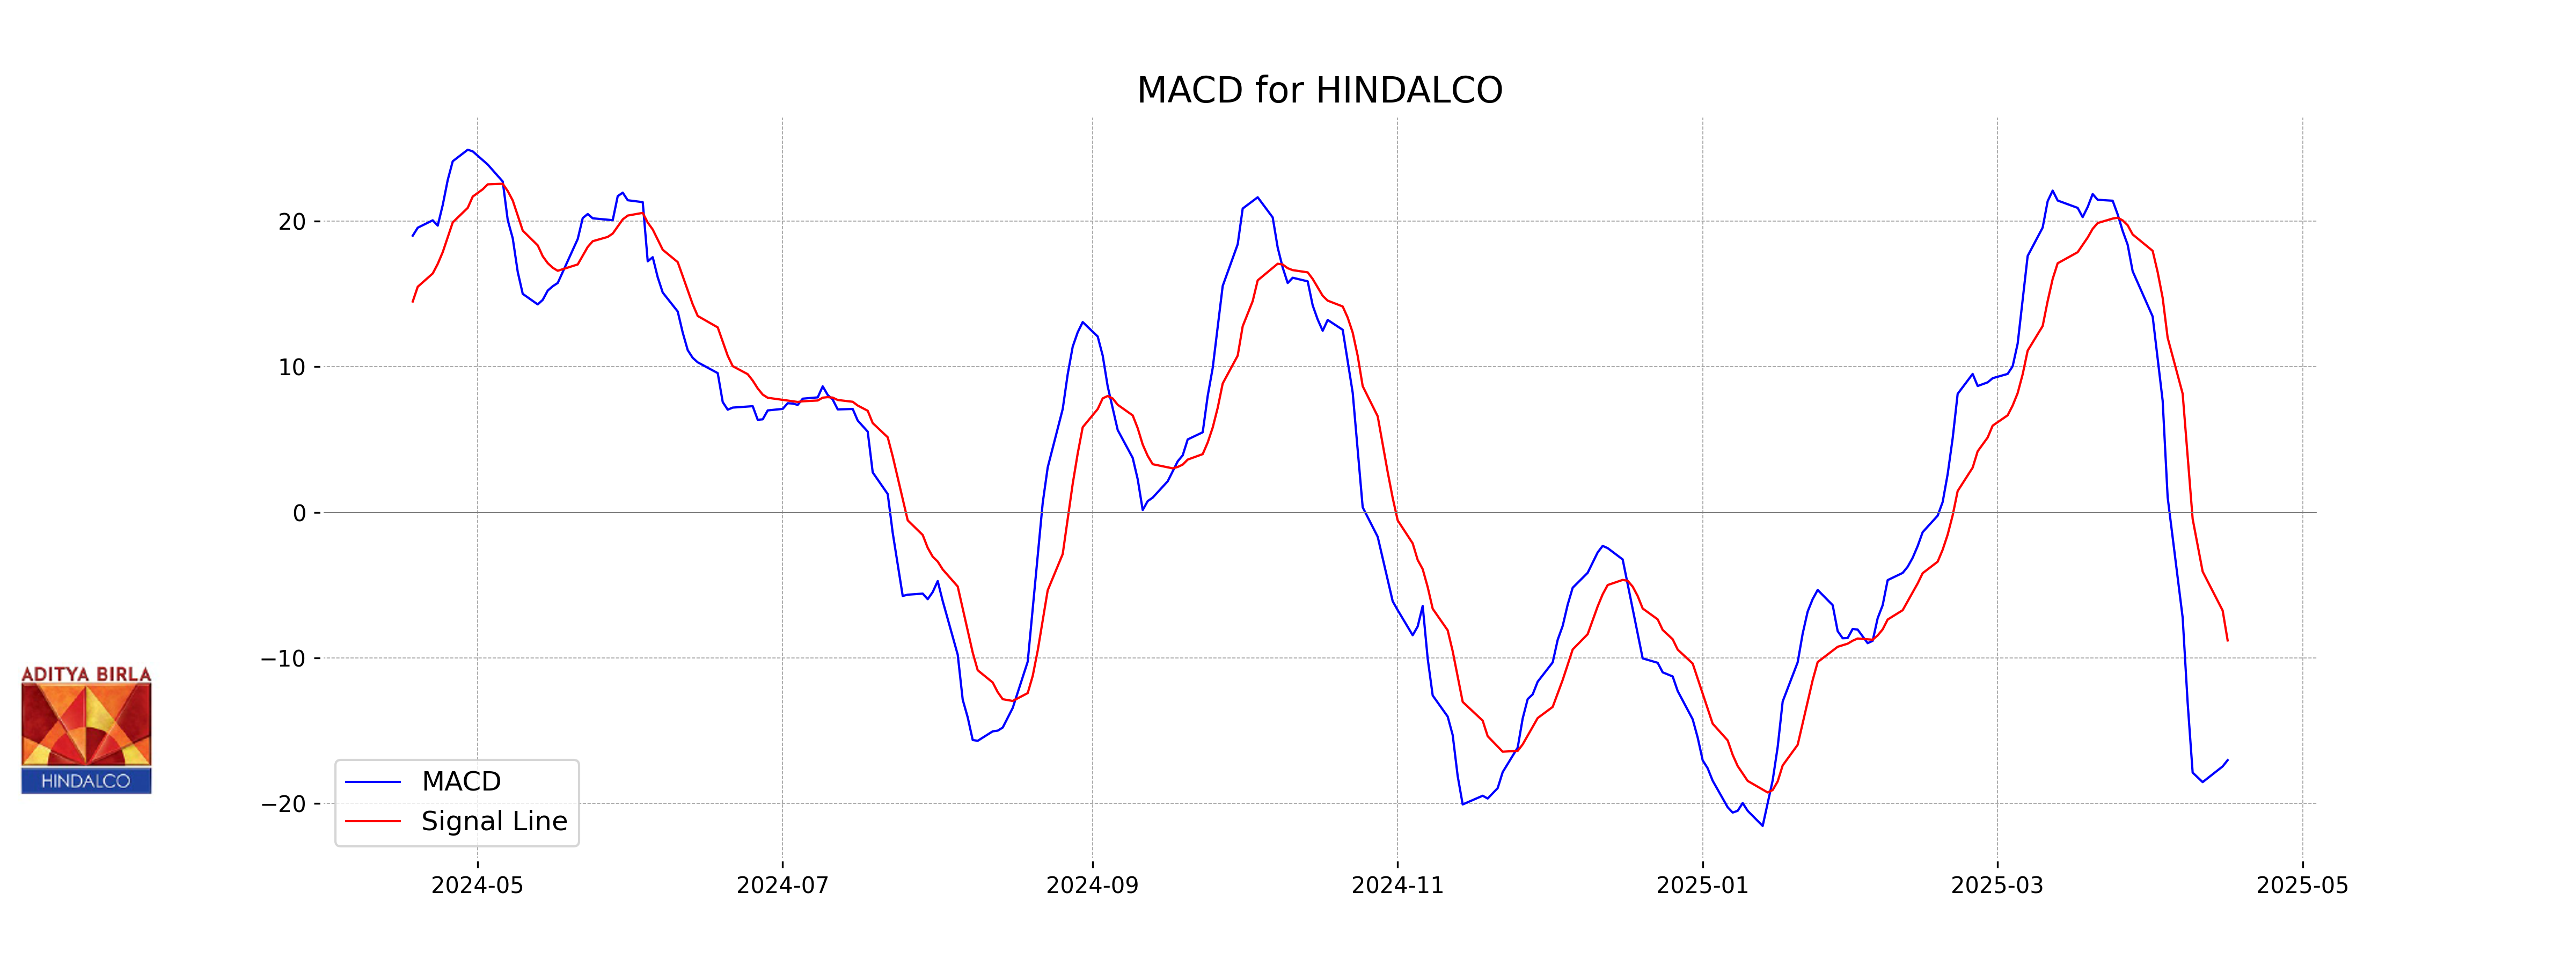
The MACD for Hindalco is -17.017, which is below the MACD Signal of -8.798. This indicates a bearish trend as the MACD line is currently below the signal line, suggesting downward momentum. Additionally, the RSI of 42.583 indicates that the stock is not in the overbought or oversold territory but is closer to the lower range, reflecting weakening bullish strength.
RSI Analysis
The RSI value for Hindalco is 42.58, which indicates a neutral to slightly oversold condition. Generally, an RSI below 30 is considered oversold, and above 70 is overbought. Therefore, the current RSI suggests that Hindalco is approaching oversold territory but is not there yet.
Analysis for HCL Technologies - April 16, 2025
HCL Technologies Performance Overview HCL Technologies, a leading firm in the technology sector, showcases its resilience and innovative strengths. Its market activities and financial metrics highlight steady growth and adaptability in the evolving tech landscape. The company continues to leverage its expertise to maintain a competitive edge.
Relationship with Key Moving Averages
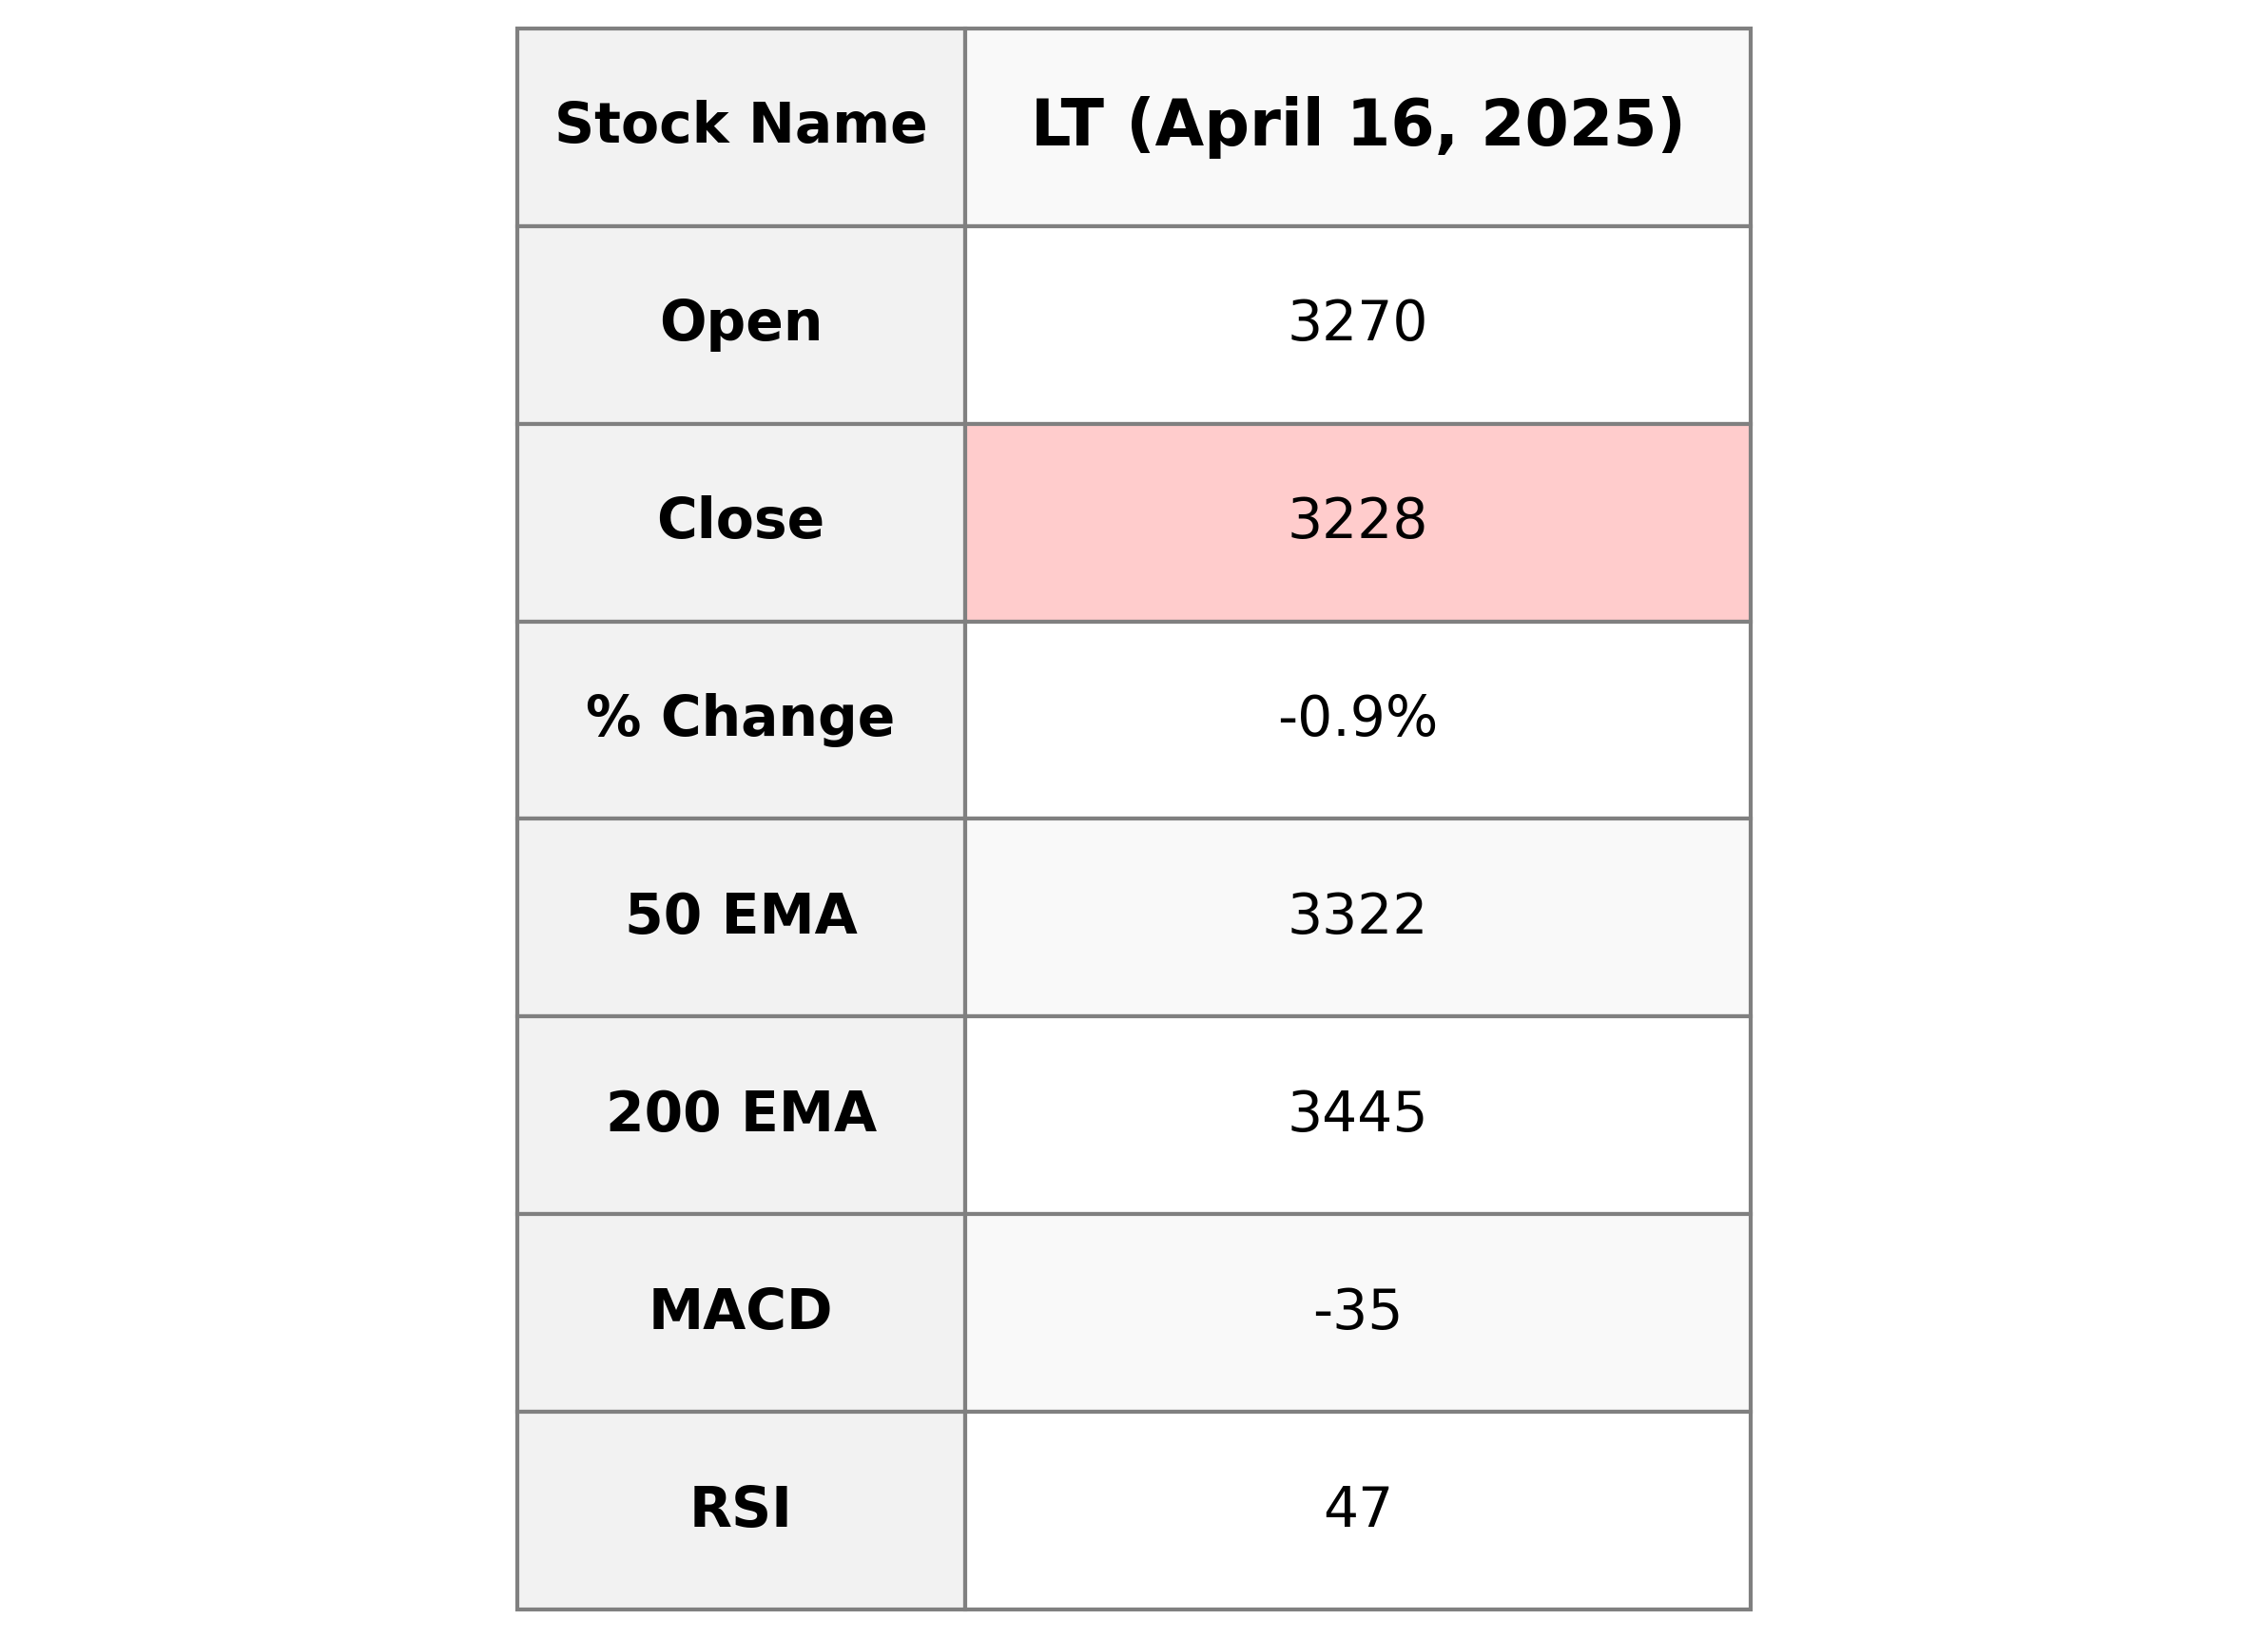
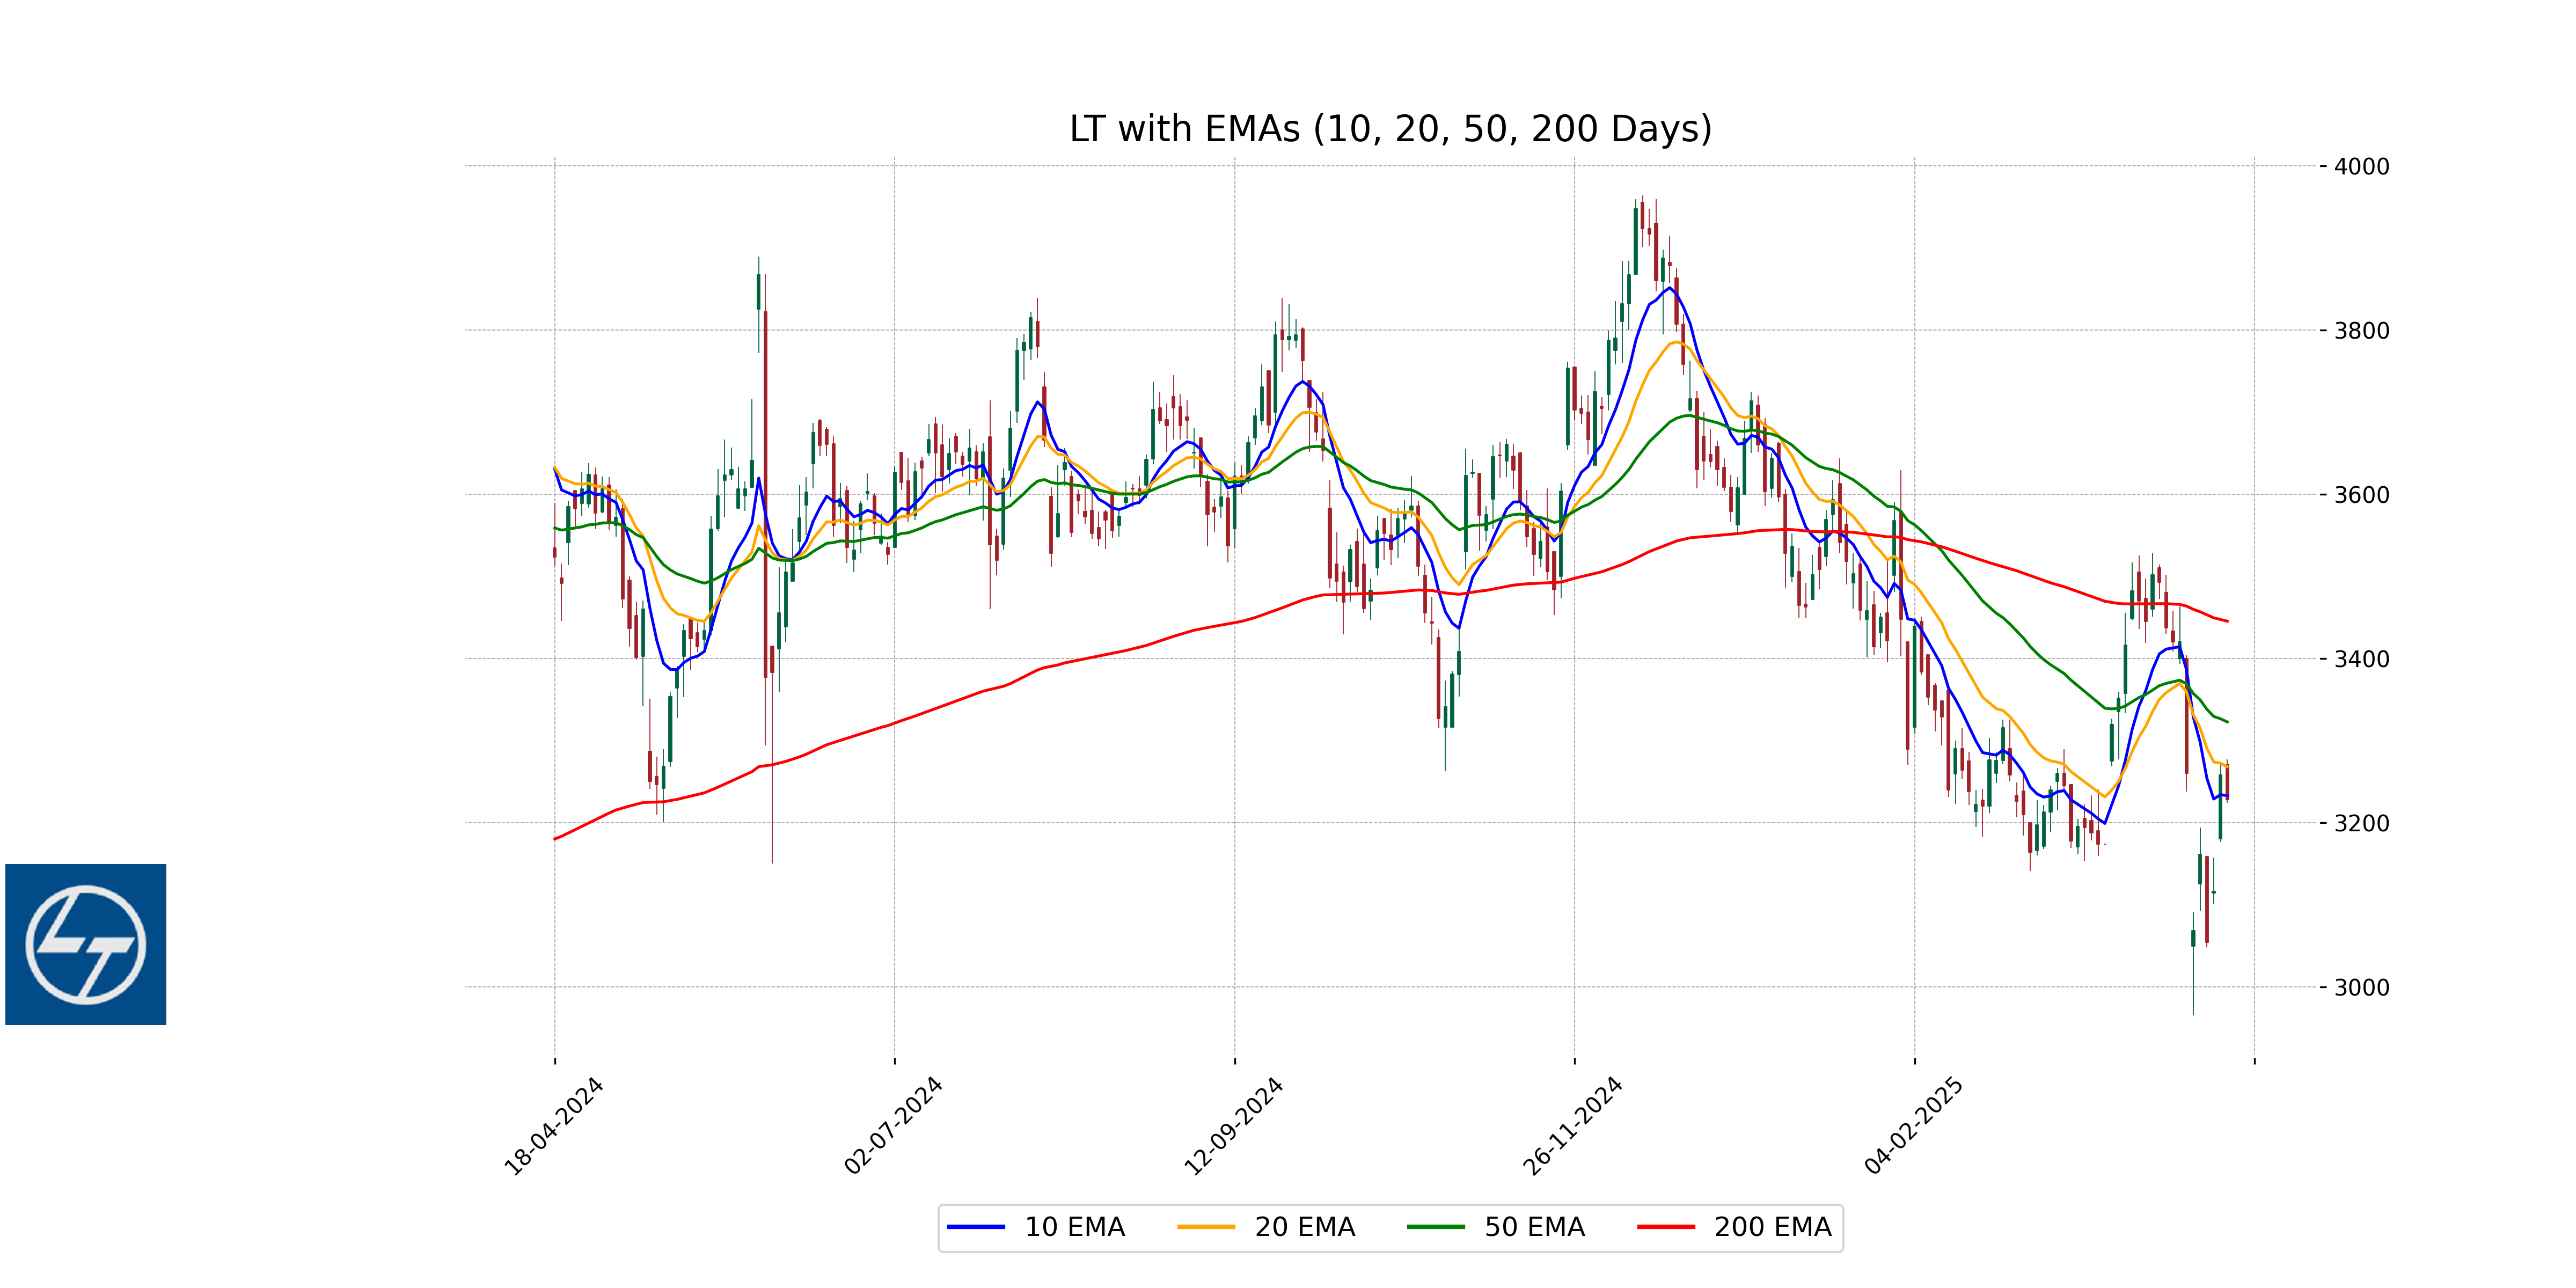
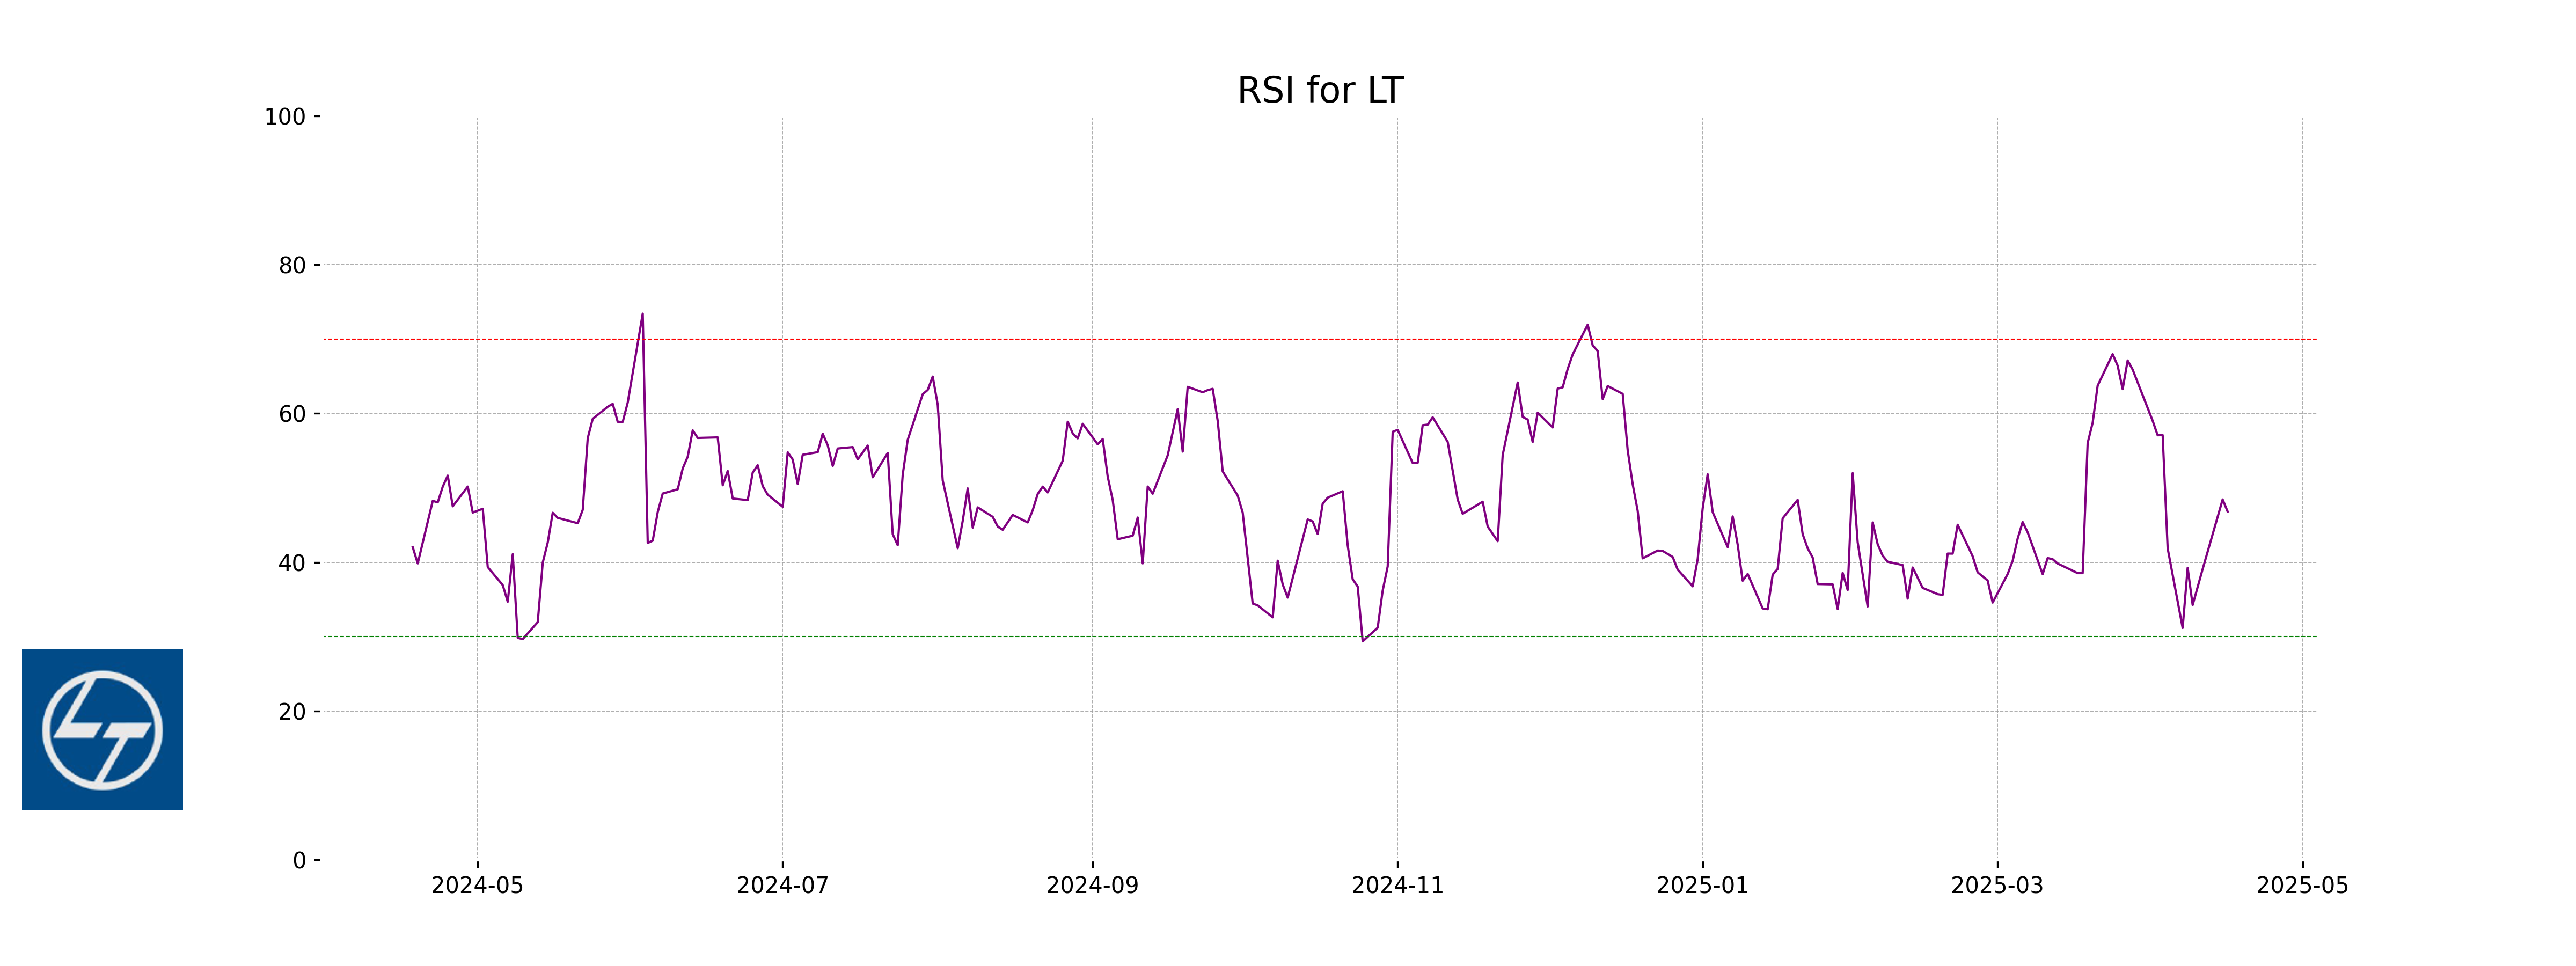
For Larsen & Toubro Limited, the current stock price is below the 50-day EMA of 3322.41 and the 200-day EMA of 3445.11, indicating a weak short- and long-term momentum. Additionally, it's slightly below the 10-day EMA of 3232.73 and the 20-day EMA of 3267.88, suggesting a recent downtrend.
Moving Averages Trend (MACD)
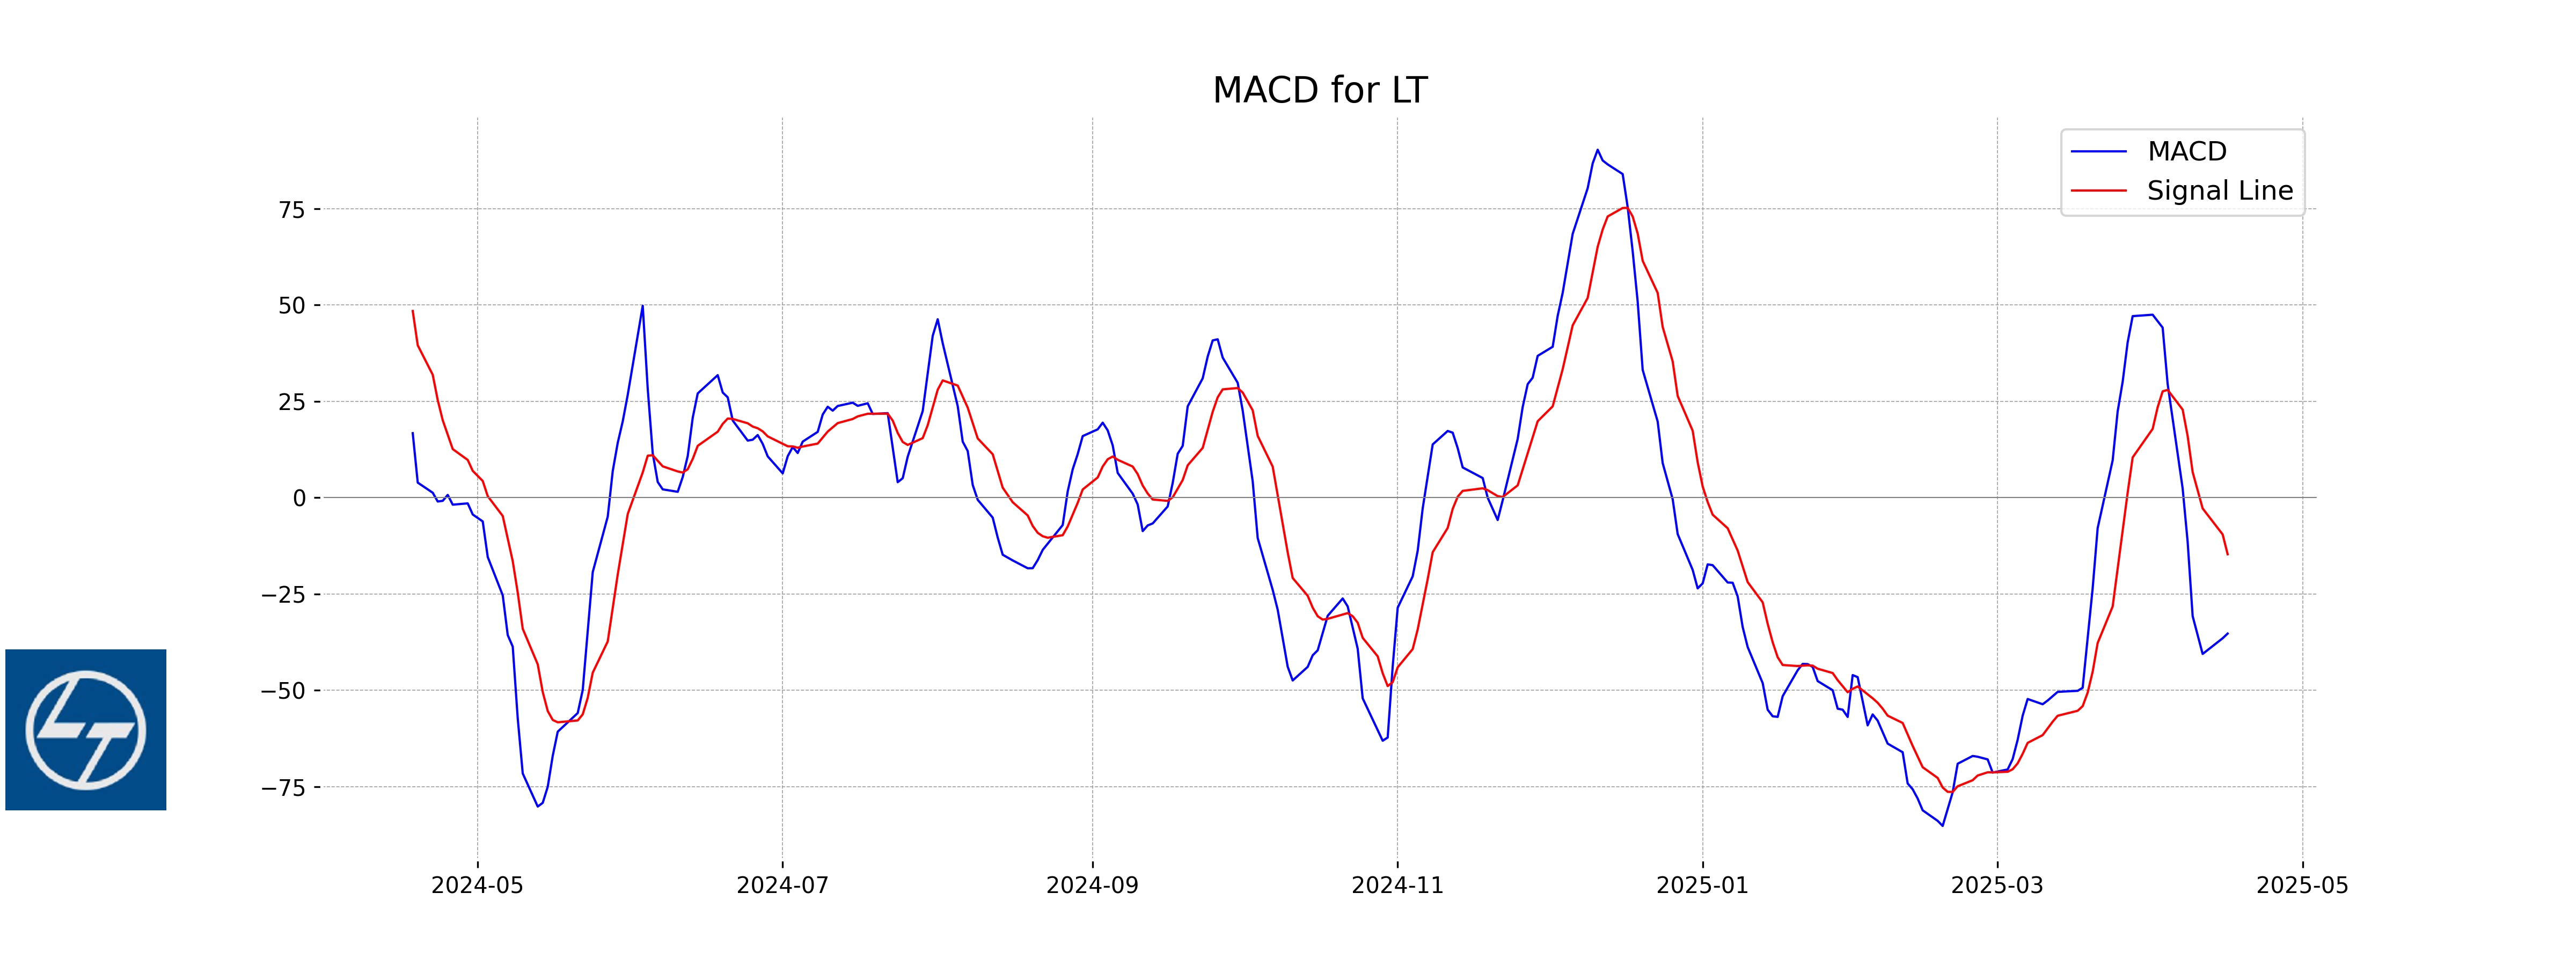
The MACD value for Larsen & Toubro is -35.26, which is below the signal line at -14.67. This suggests a bearish trend for the stock as the MACD line is below the signal line, indicating downward momentum.
RSI Analysis
### RSI Analysis for Larsen & Toubro Limited (LT.NS) The Relative Strength Index (RSI) for Larsen & Toubro Limited is 46.80, which indicates the stock is in a neutral zone. This suggests that it is neither overbought nor oversold, providing no strong trend reversal signals at the moment.
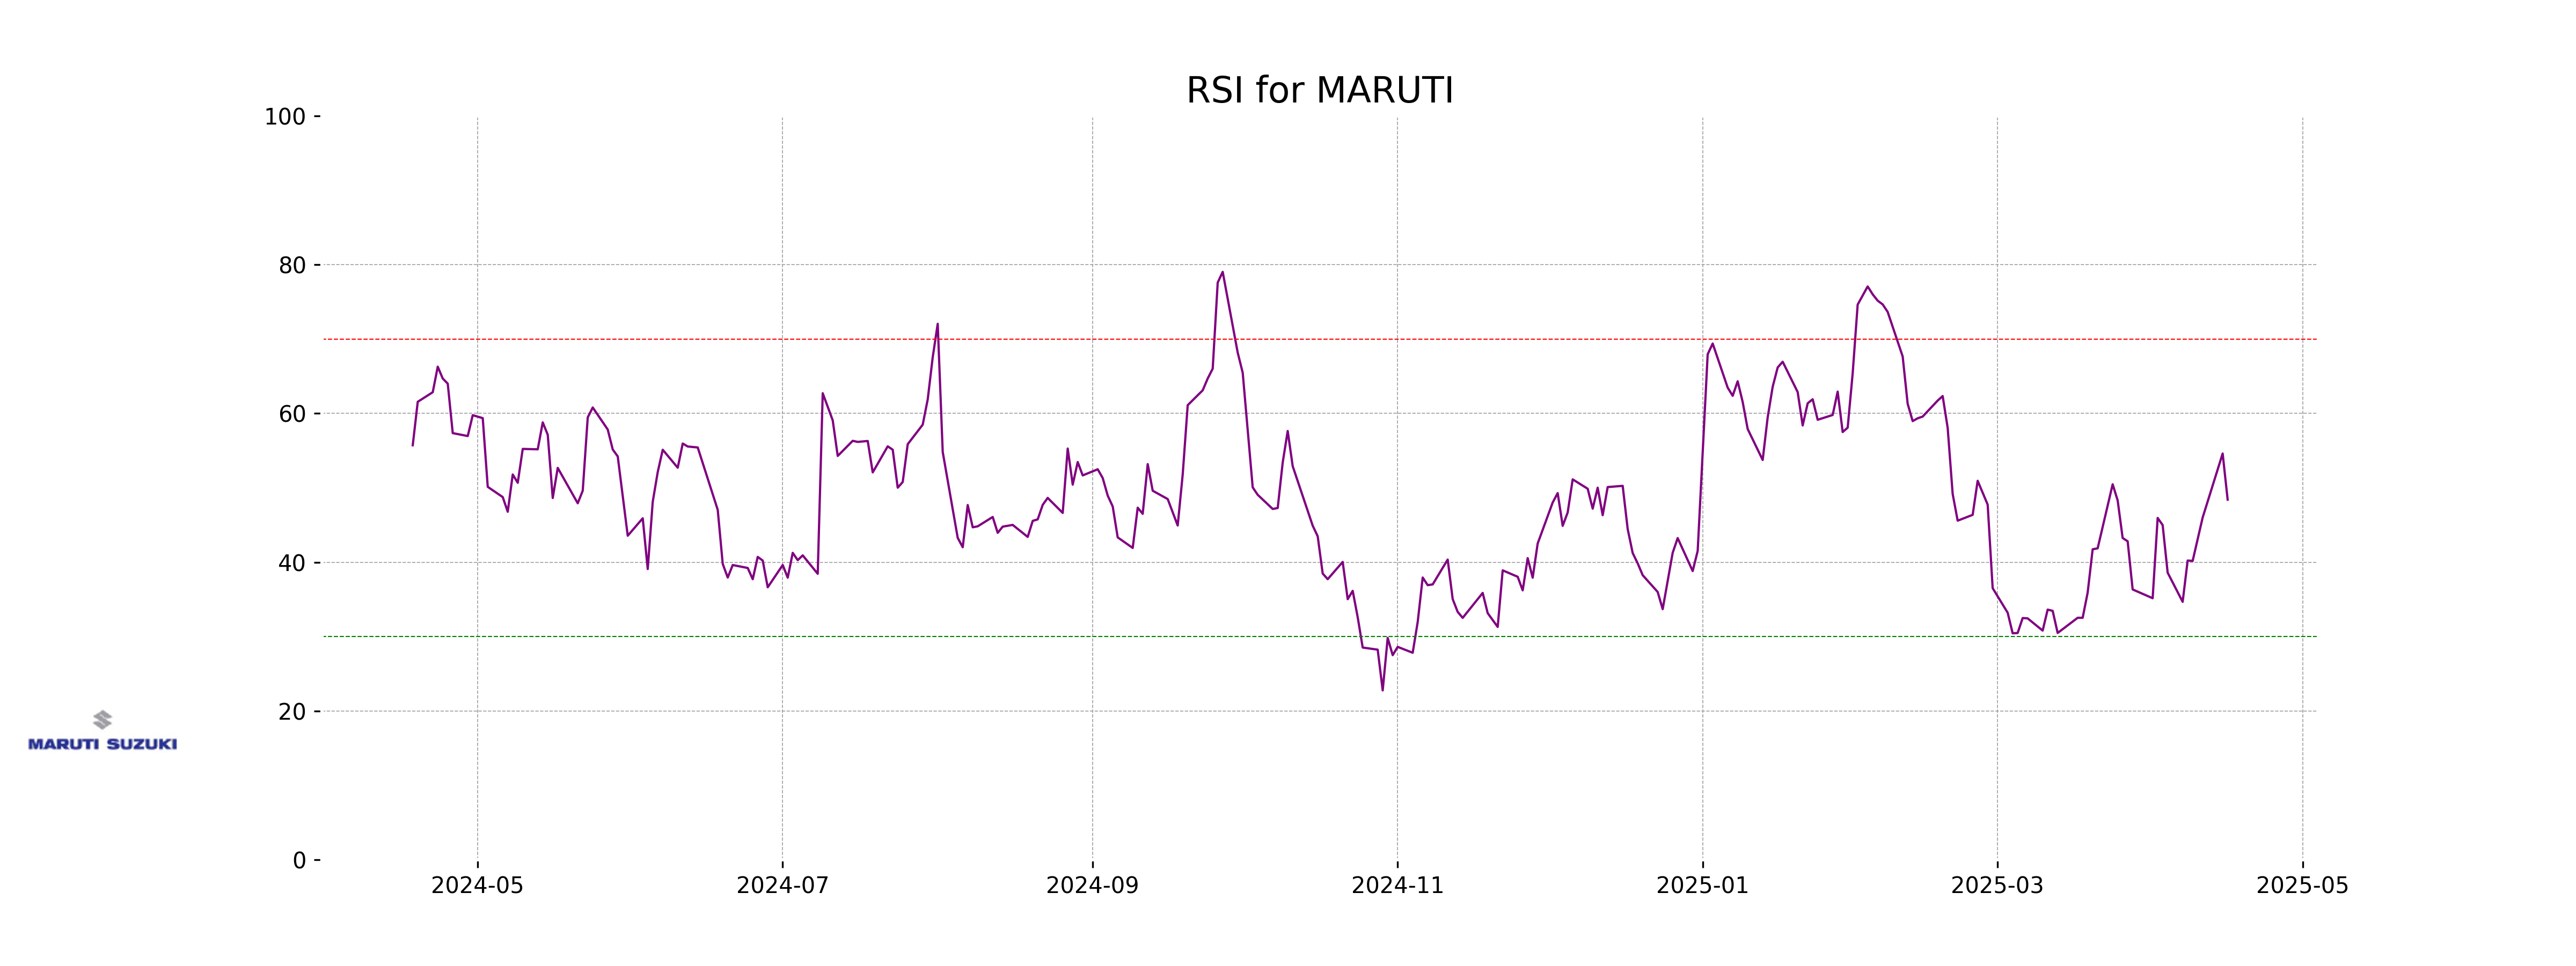
Analysis for Maruti Suzuki - April 16, 2025
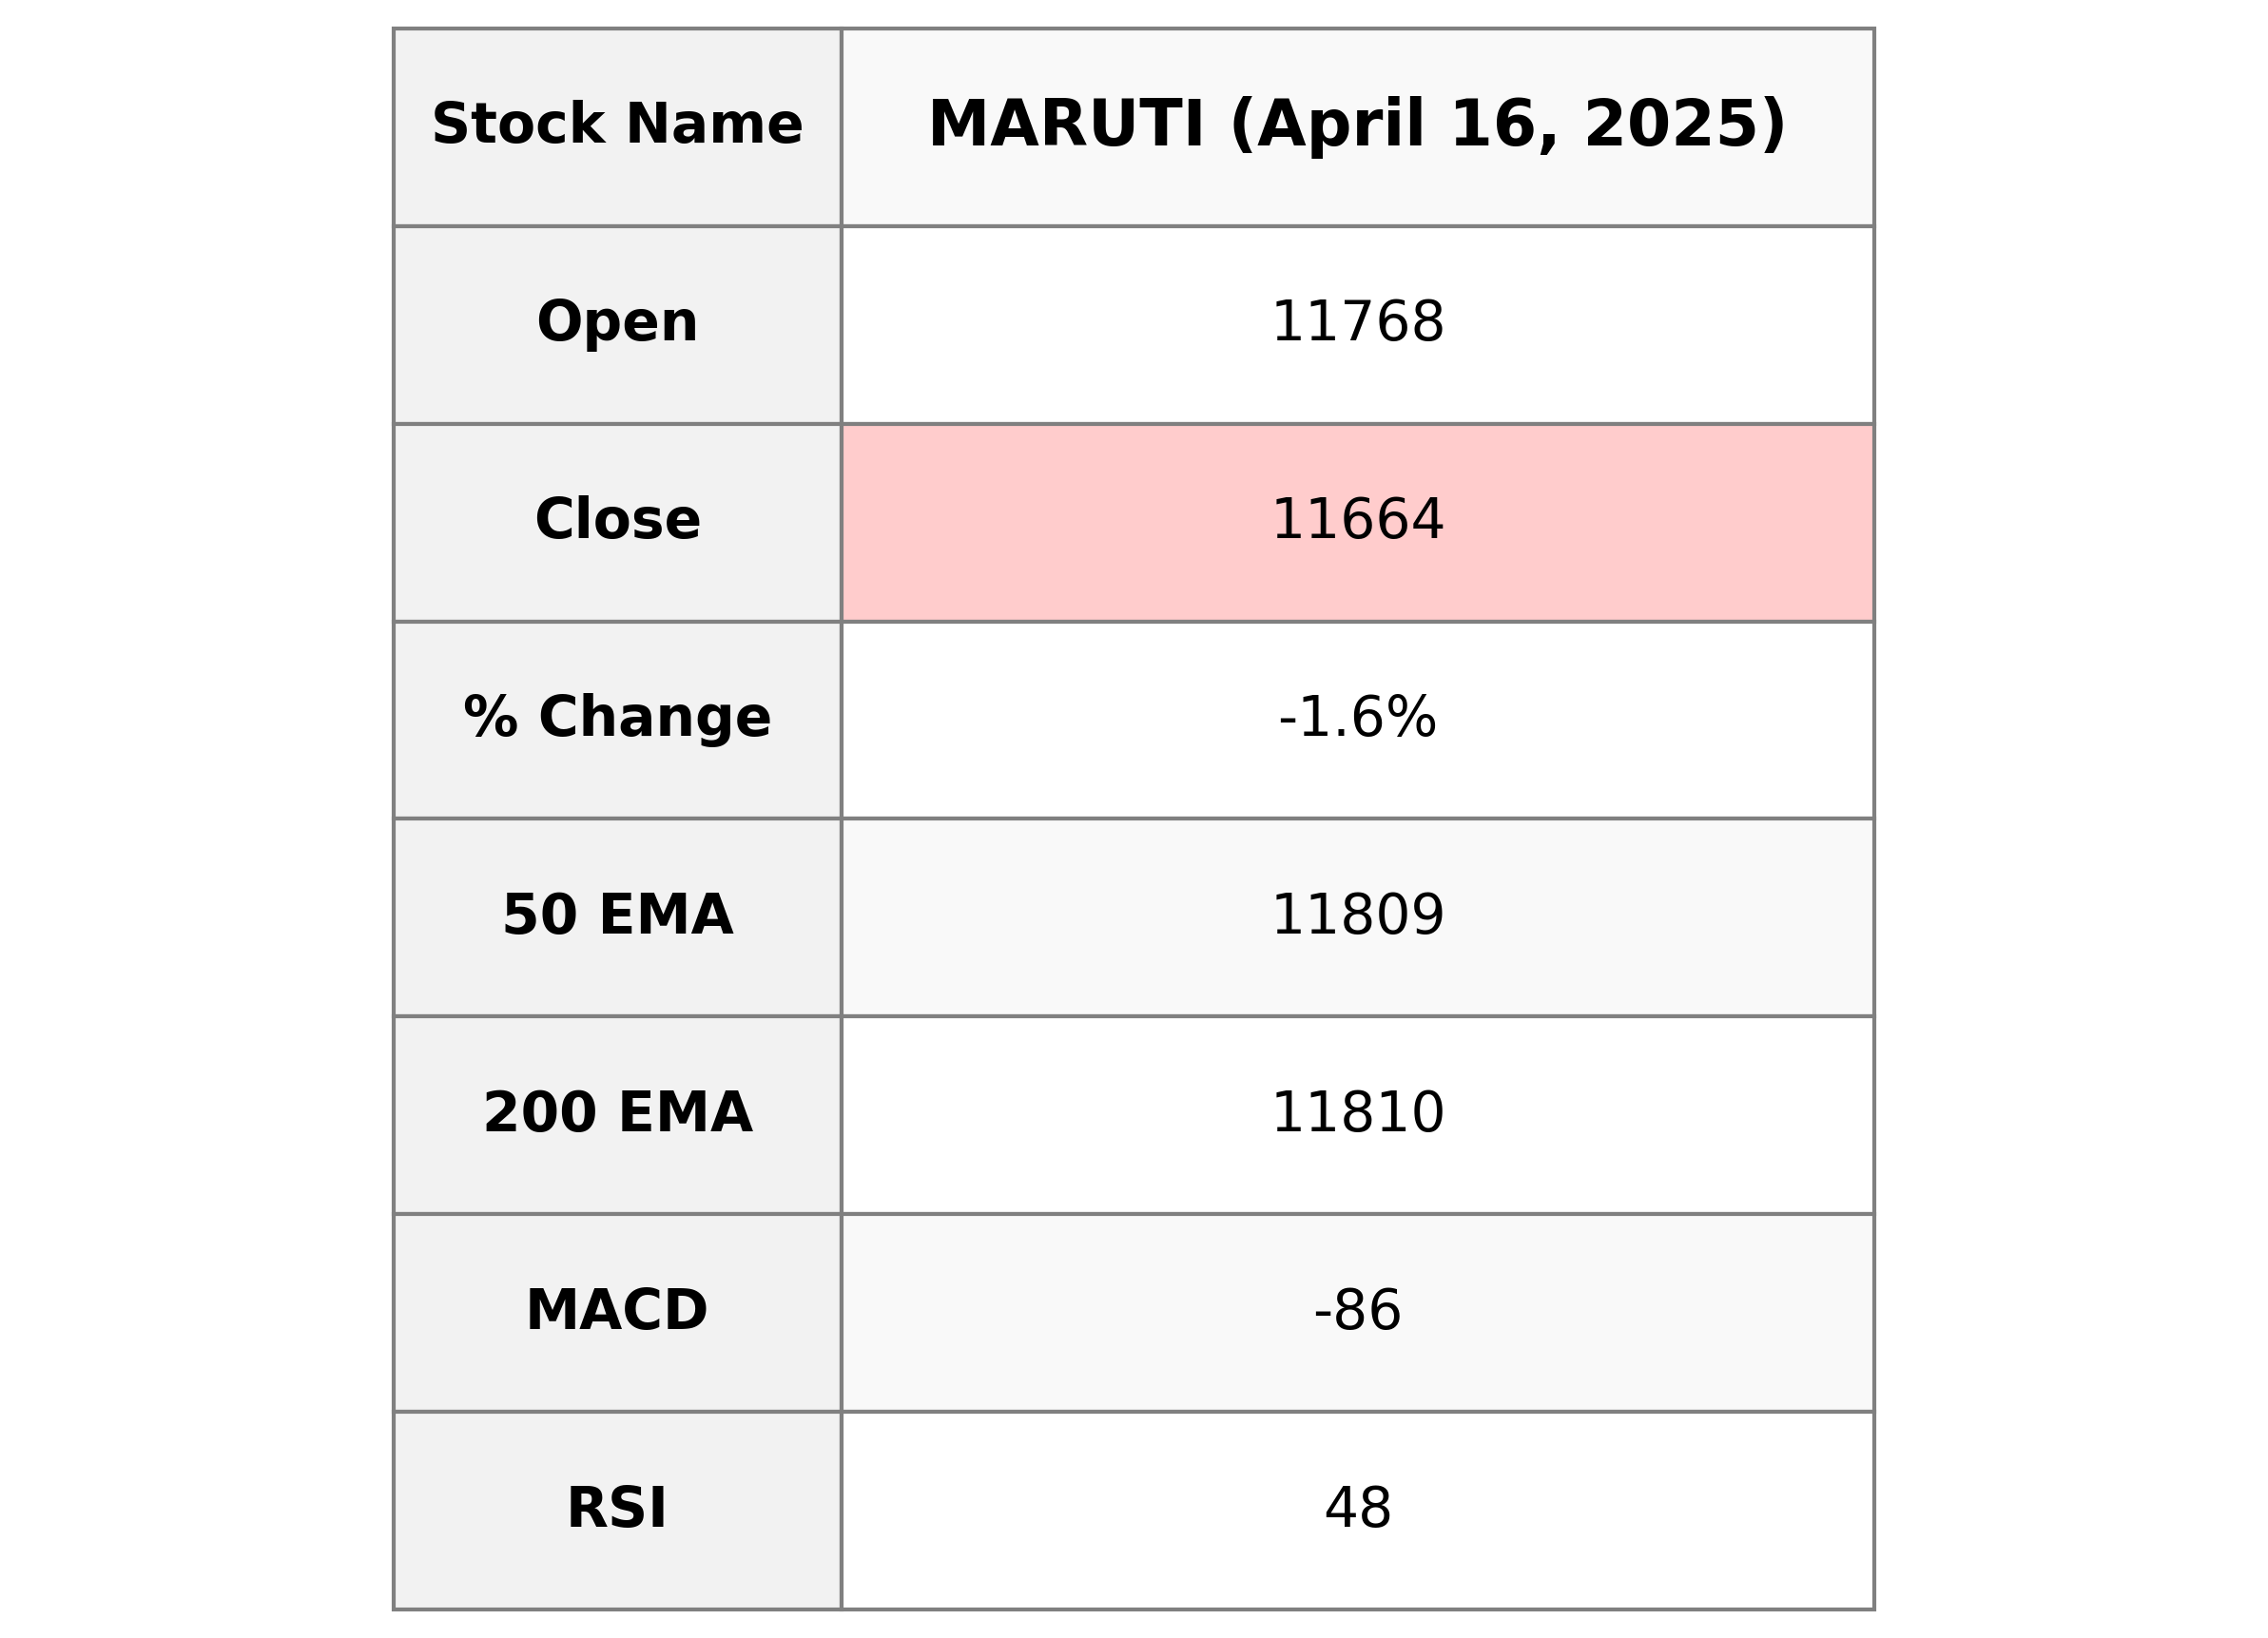
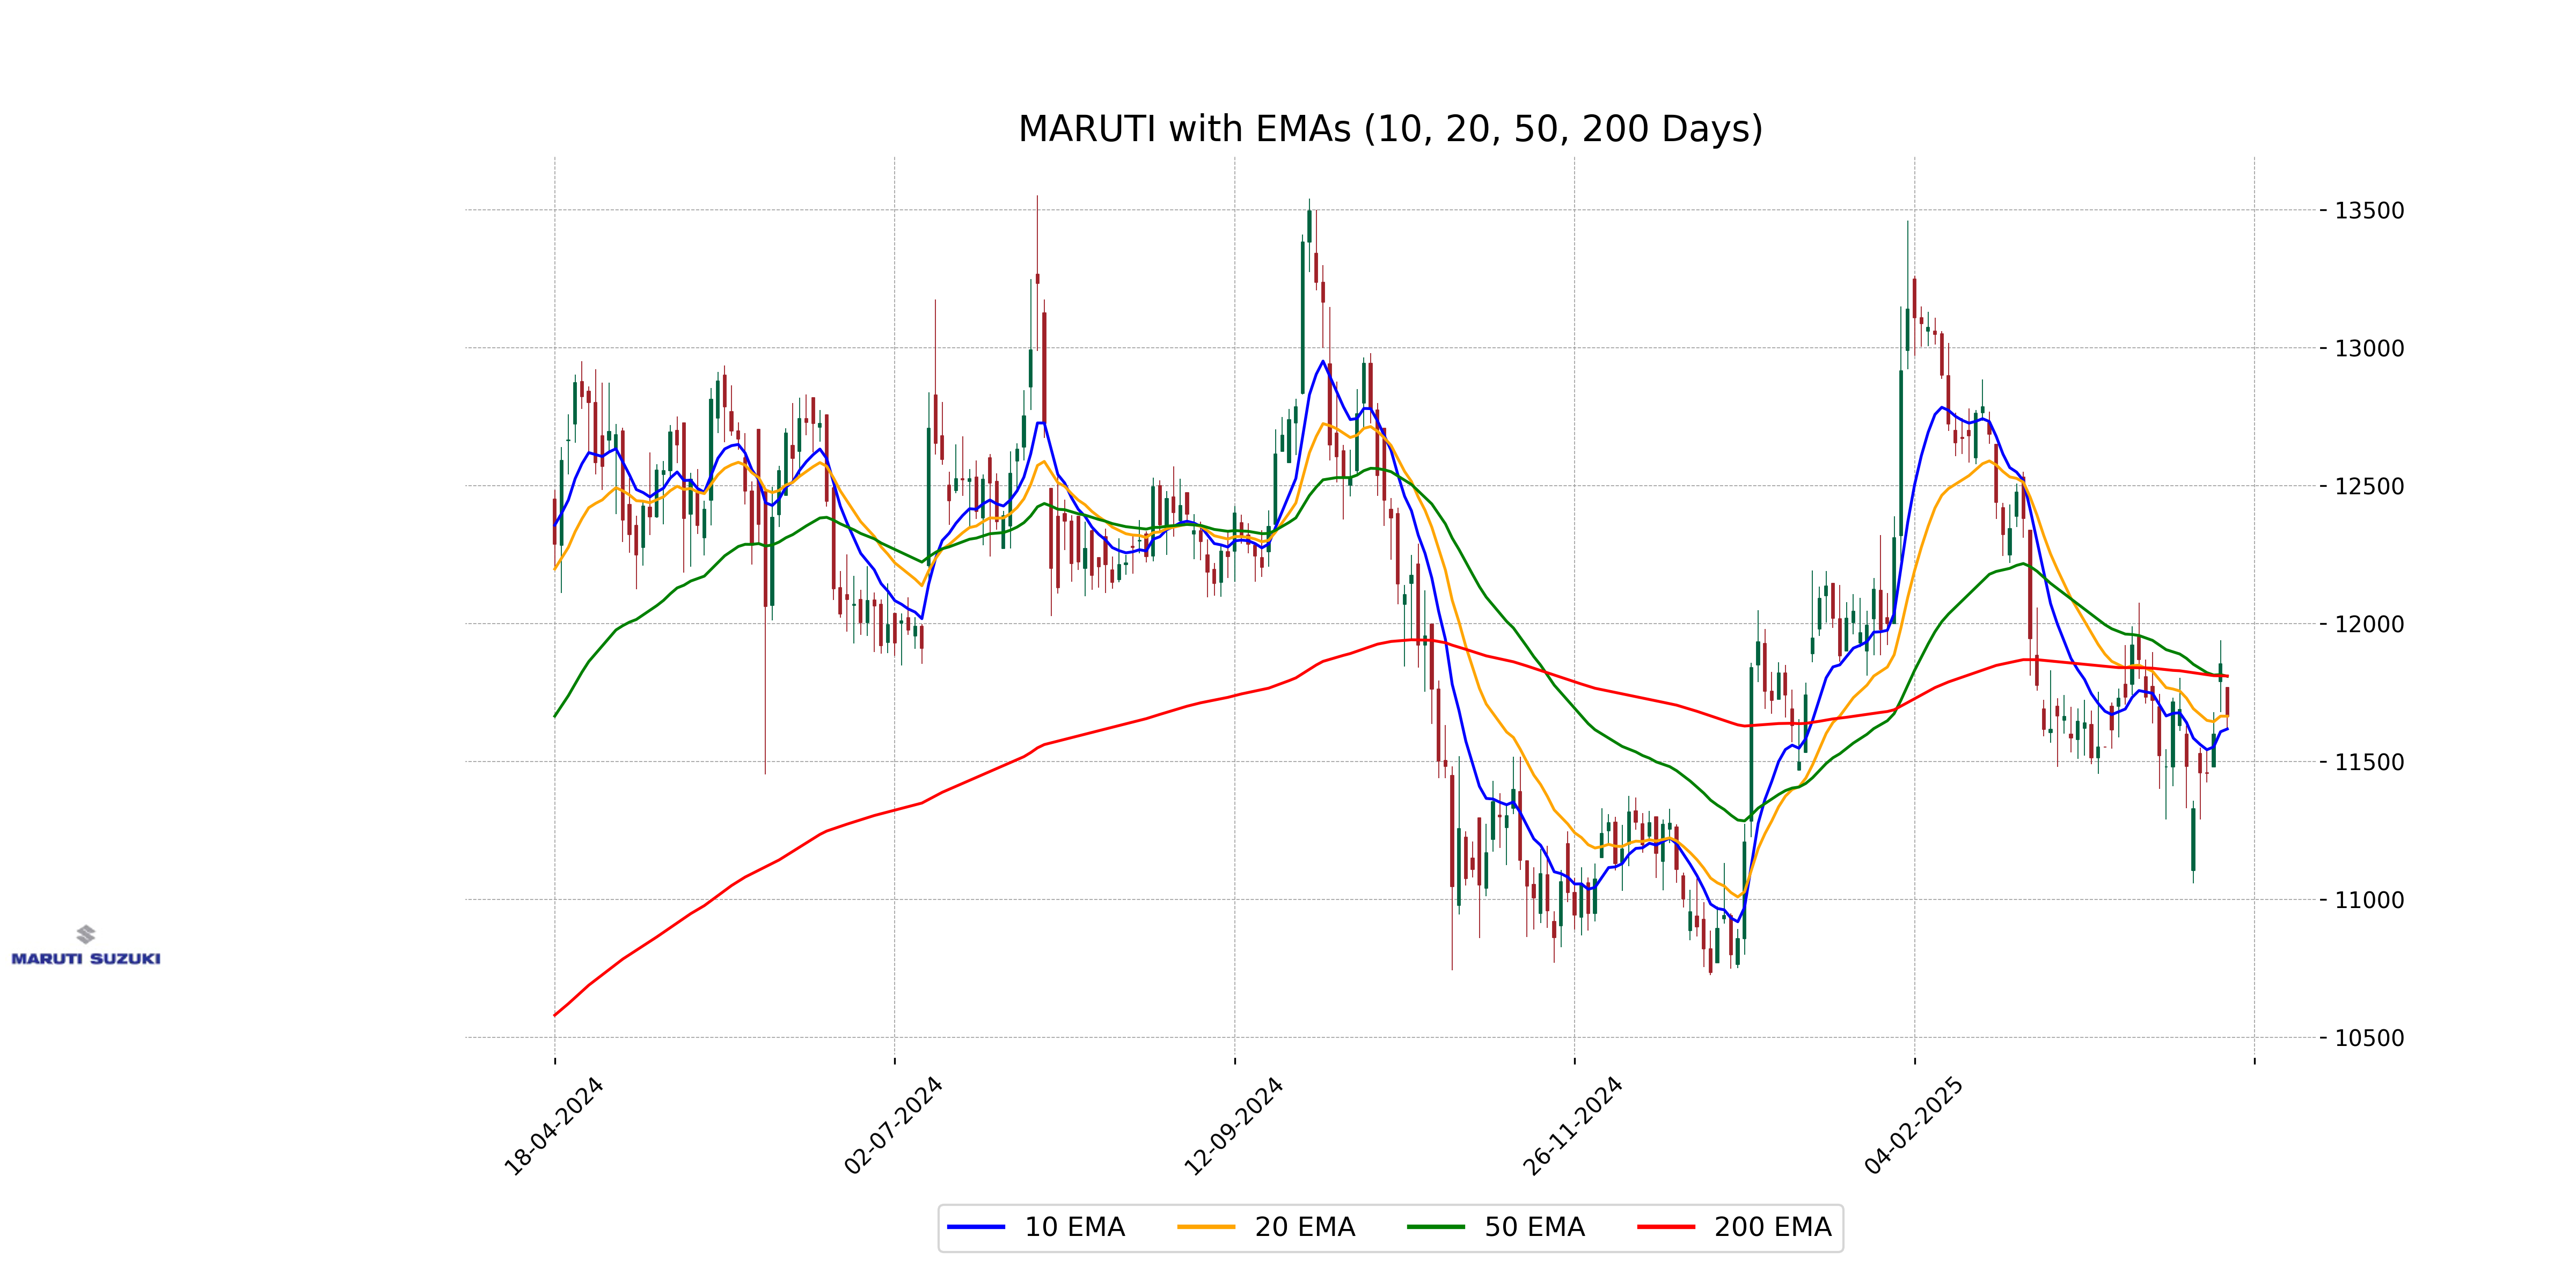
Performance Overview of Maruti Suzuki: Maruti Suzuki, trading on the Indian stock market, saw a decline in its stock price with it closing at 11,664, down by 1.61% compared to the previous close of 11,855. The stock's 50-day and 200-day EMAs show relatively stable trends around 11,809 and 11,810, respectively. The RSI is at 48.41, suggesting a neutral momentum, while the MACD indicates a bearish tone. With a market cap just over 3.66 trillion INR, the company's PE Ratio is 25.23, reflective of its earnings performance in the auto manufacturing sector within the Indian consumer cyclical industry.
Relationship with Key Moving Averages
Maruti Suzuki's closing price of 11664.0 is below its 50-day EMA of 11809.33 and 200-day EMA of 11810.48, indicating a bearish trend in relation to these key moving averages. However, it remains just above its 10-day EMA of 11618.25.
Moving Averages Trend (MACD)
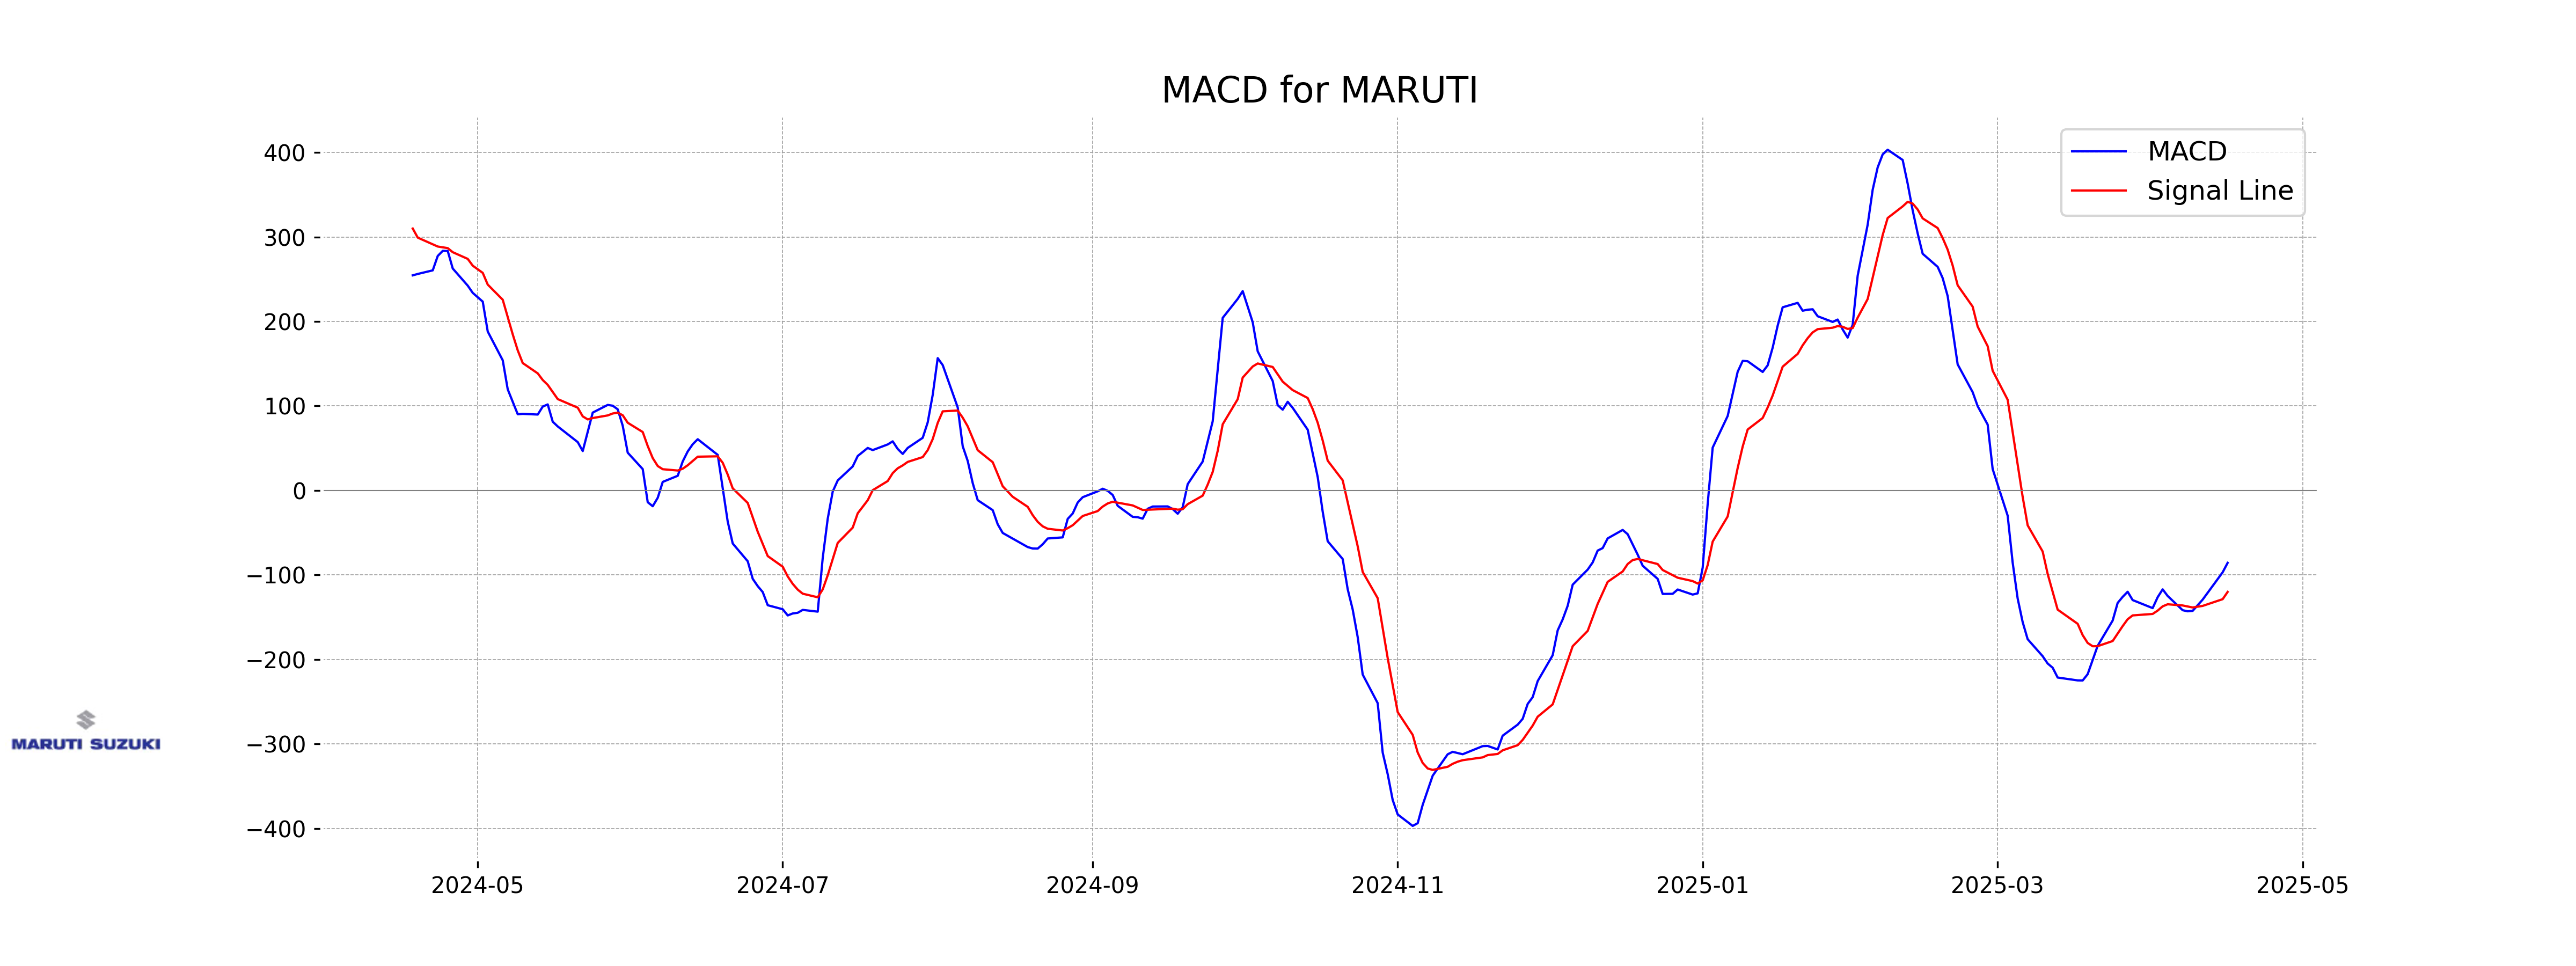
The MACD value for Maruti Suzuki is -85.58, which is above the signal line of -119.98, suggesting that the recent bearish momentum might be weakening. This could be a potential early indicator of a reversal or stabilization in the price trend. Keep an eye on accompanying indicators like RSI, which is relatively neutral at 48.41, to provide additional context.
RSI Analysis
The Relative Strength Index (RSI) for Maruti Suzuki stands at 48.41. RSI values between 30 and 70 generally indicate a neutral market condition, suggesting that the stock is neither overbought nor oversold. With an RSI close to 50, Maruti Suzuki is in a relatively balanced position regarding its recent price momentum.
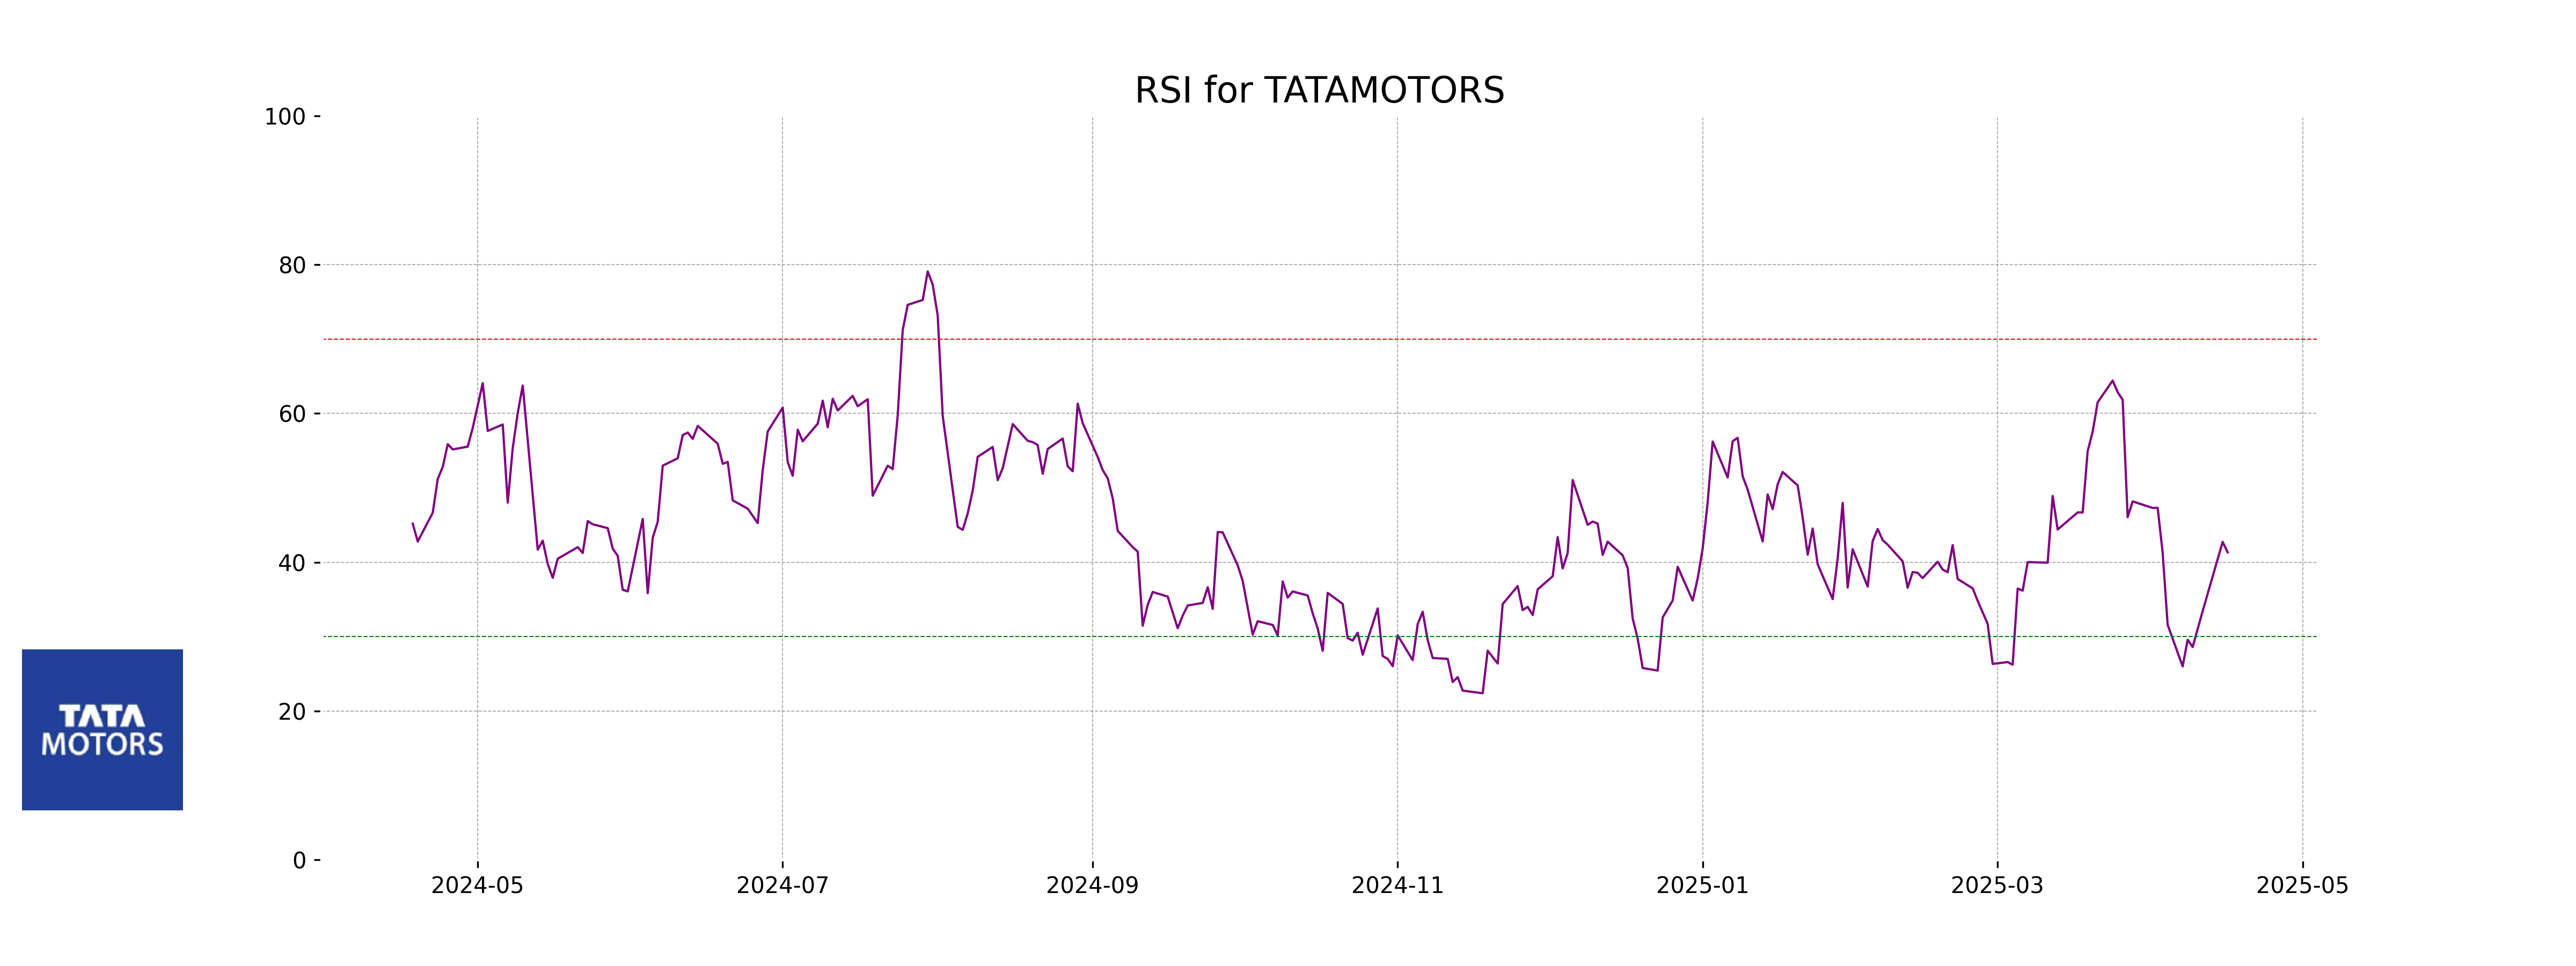
Analysis for Tata Motors - April 16, 2025
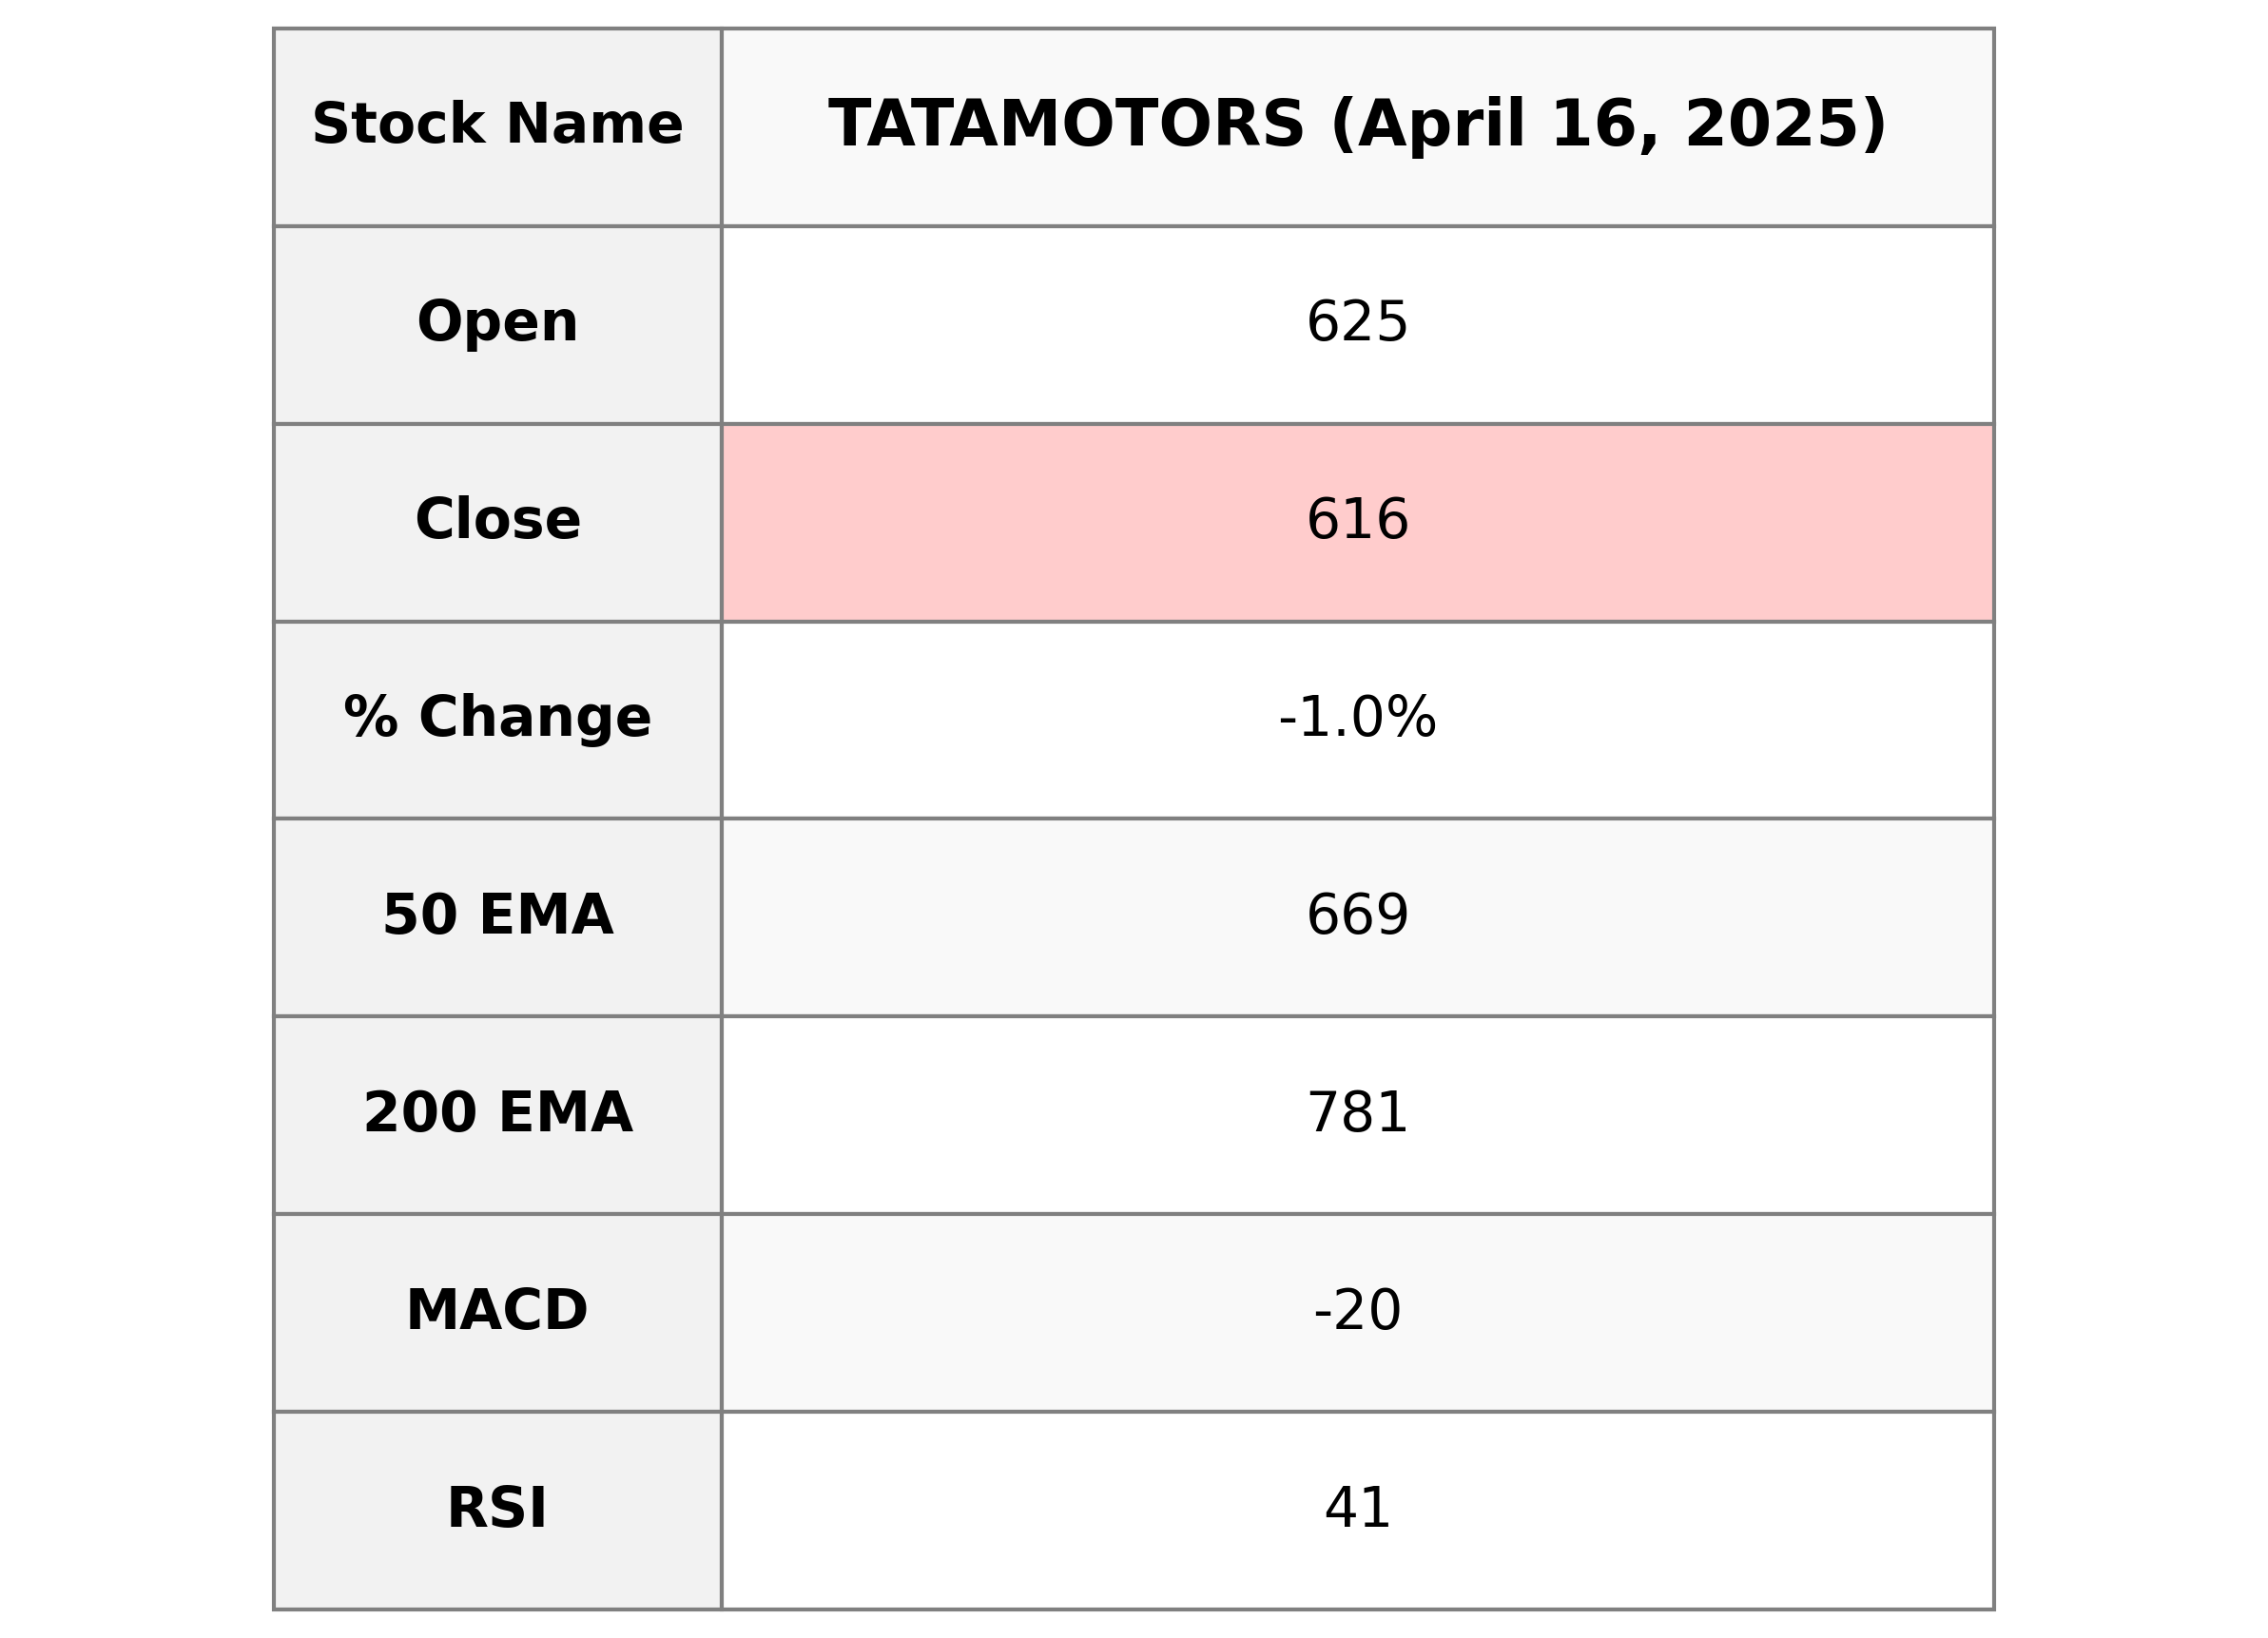
Tata Motors showed a decline in its stock price, closing at 616.05 INR, a decrease of 0.99% compared to the previous close. The stock is currently trading below its 50-day EMA (669.47) and 200-day EMA (780.61), indicating a bearish trend. With an RSI of 41.33, it is nearing oversold territory, and the MACD suggests bearish momentum with a MACD line below its signal line.
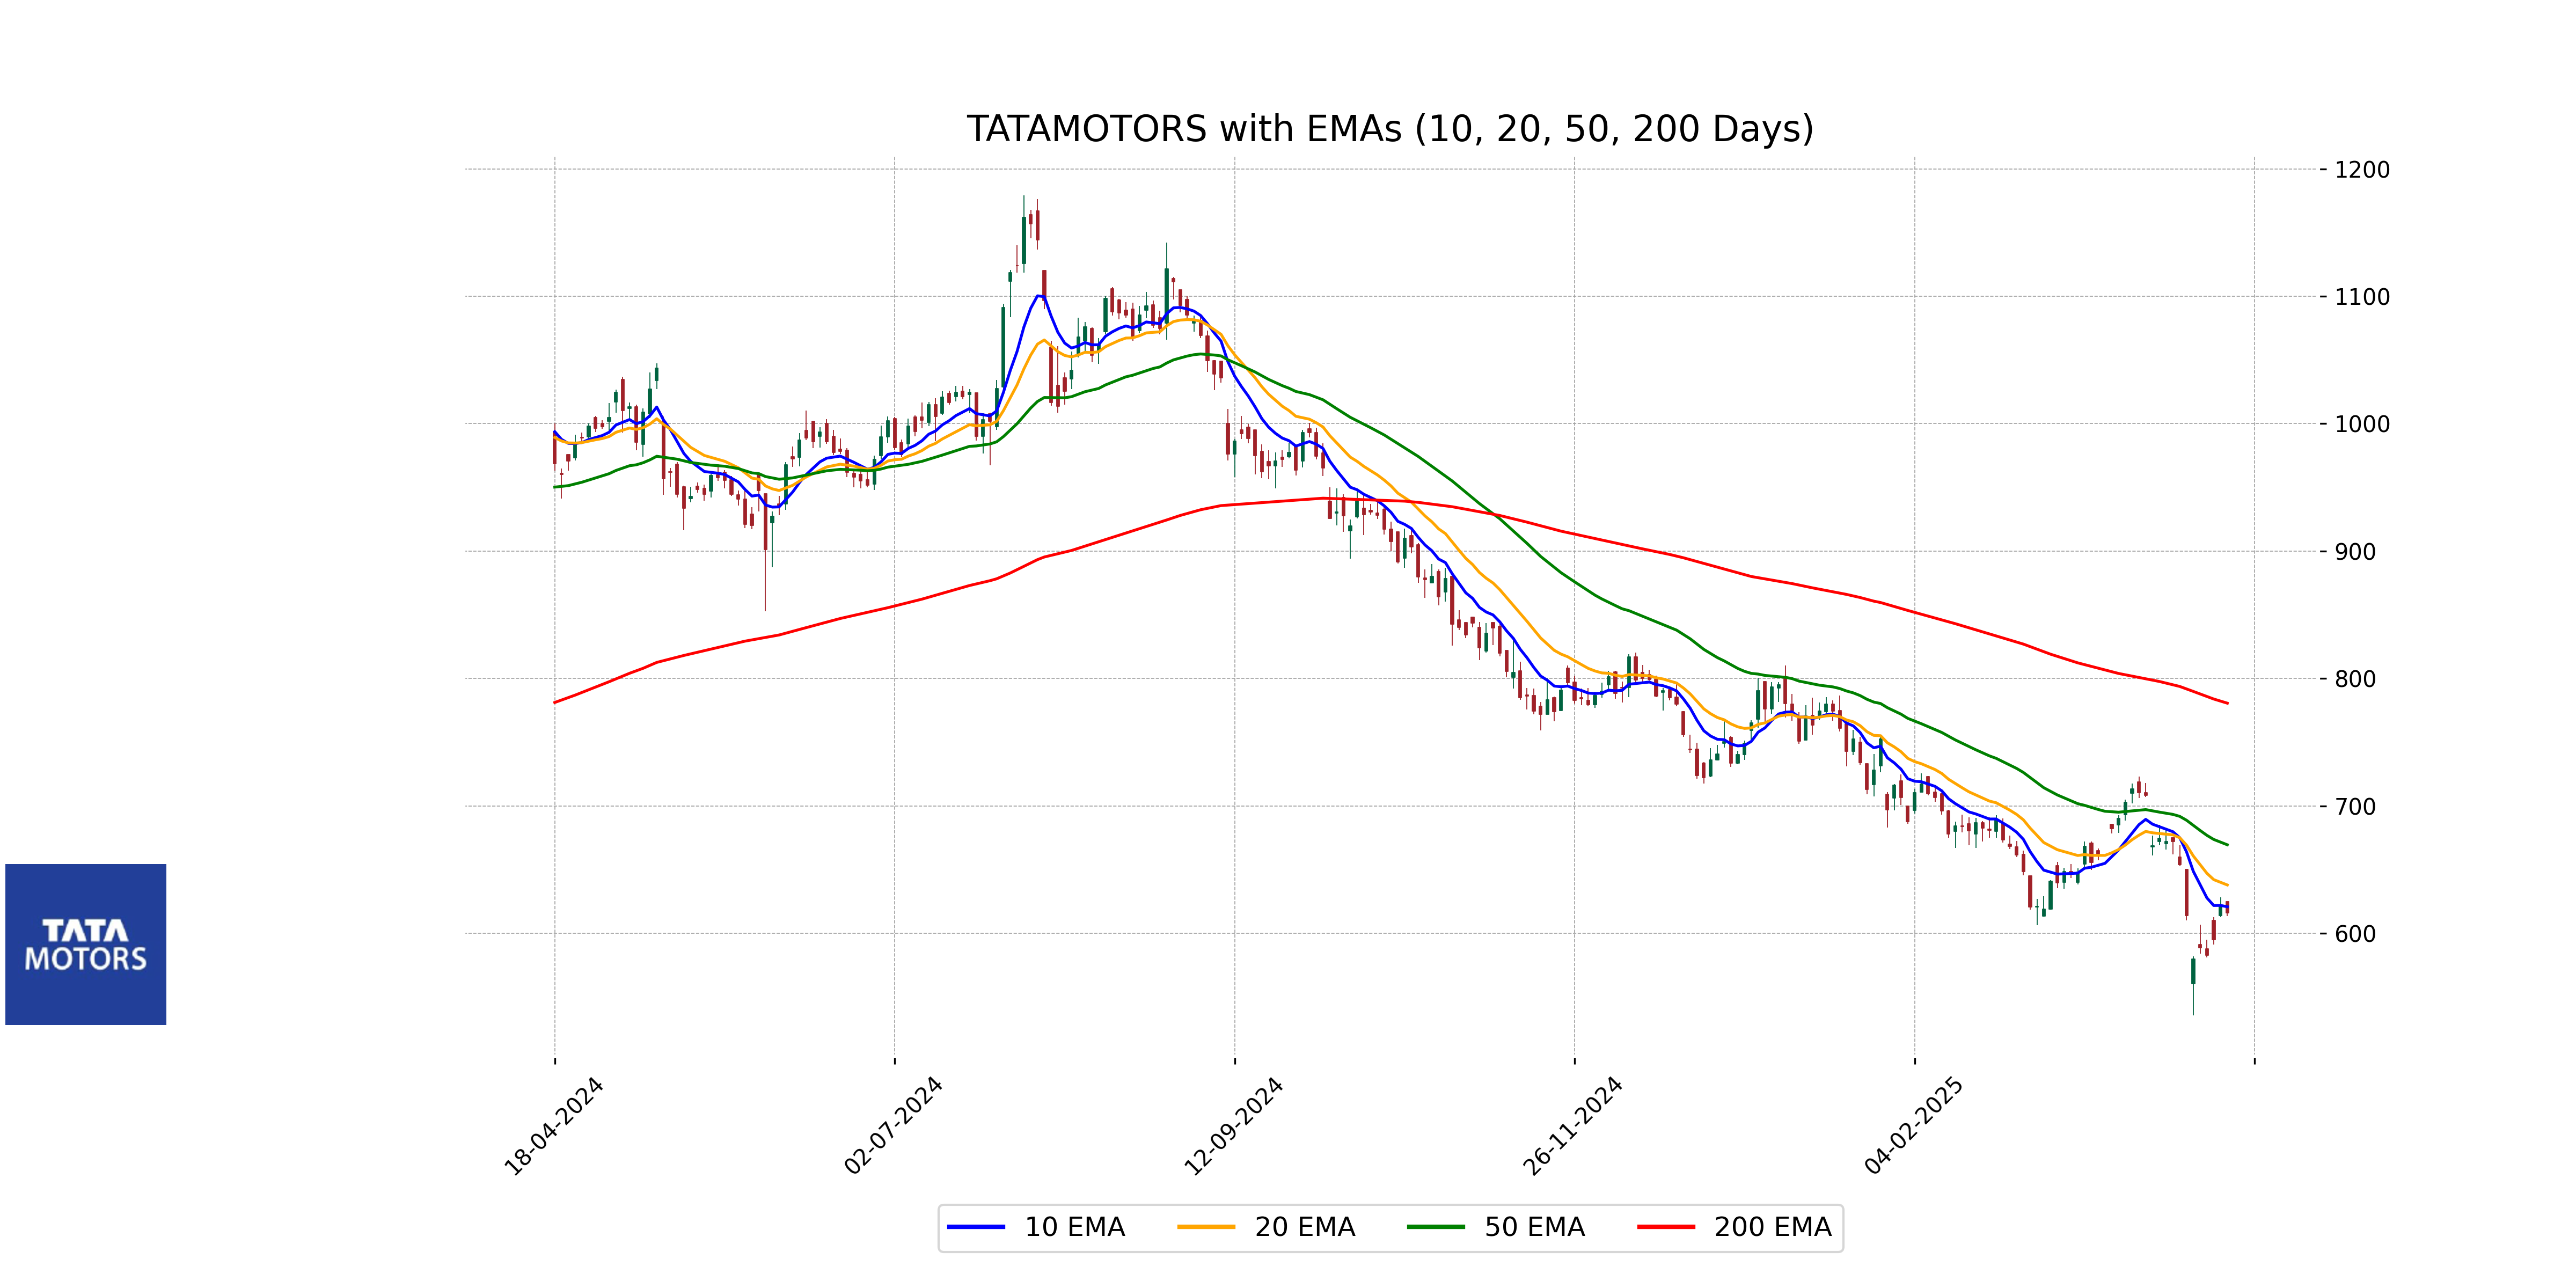
Relationship with Key Moving Averages
Based on the provided data for Tata Motors, the current close price of 616.05 is below its 50-day EMA of 669.47 and significantly below its 200-day EMA of 780.61, indicating a bearish trend. The stock is also slightly below its 10-day EMA of 620.83 and 20-day EMA of 637.93, suggesting a potential downside pressure in the short term.
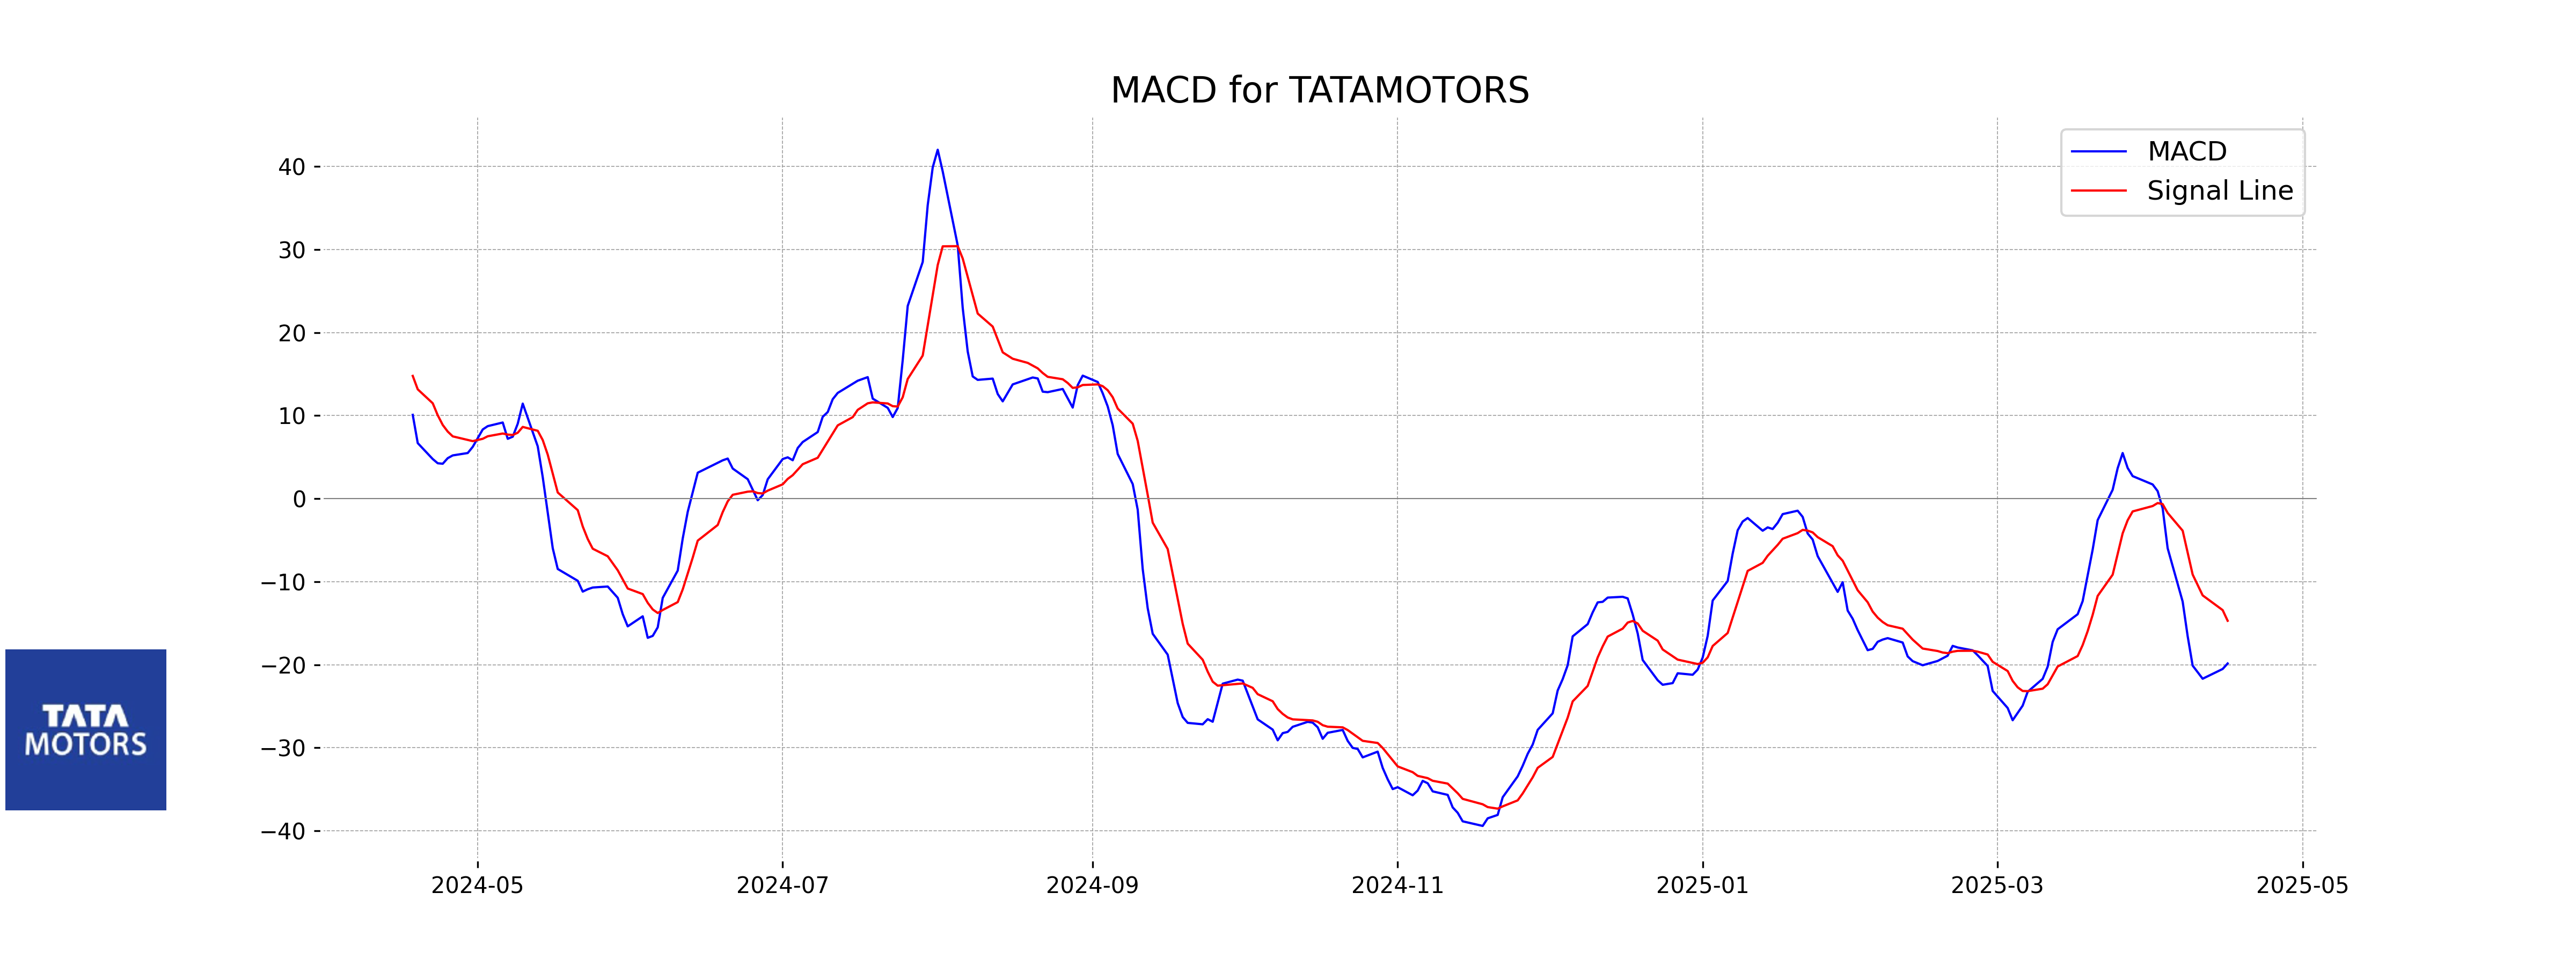
Moving Averages Trend (MACD)
The MACD analysis for Tata Motors indicates a bearish outlook as the MACD value (-19.85) is below the MACD Signal line (-14.70). This divergence suggests a downward momentum in the stock price, which is also supported by a declining RSI at 41.33, pointing towards a potential continuation of the bearish trend.
RSI Analysis
The RSI (Relative Strength Index) for Tata Motors is 41.33, which is below the typical neutral level of 50. This suggests that the stock is currently approaching an oversold condition, potentially indicating a period of weaker momentum.
Up Next
NSE Nifty 50 Top losers: What are the 5 Biggest Stock losers Today April 16, 2025

New Zealand commits USD 20 bn investment in India under FTA in 15 yrs; on lines of EFTA pact

India, New Zealand conclude FTA talks; pact to offer duty-free access, USD 20 bn FDI

FTA with New Zealand to significantly deepen bilateral economic engagement: Govt

Rupee breaches 91-mark against US dollar for first time in intra-day trade

Microsoft commits USD 17.5 billion investment in India: CEO Satya Nadella

More videos

CBI books Anil Ambani's son, Reliance Home Finance Ltd. in Rs 228 crore bank fraud case

RBI raises FY26 GDP growth projection to 7.3 pc

RBI trims policy interest rate by 25bps to 5.25pc, loans to get cheaper

Rupee slumps to all-time low of 90.25 against US dollar in intra-day trade

Reliance completes merger of Star Television Productions with Jiostar

India to lead emerging market growth with 7pc GDP rise in 2025: Moody’s

Nifty hits record high after 14 months; Sensex nears all-time peak

Reliance stops Russian oil use at its only-for-export refinery to comply with EU sanctions

ED attaches fresh assets worth over Rs 1,400 cr in case against Anil Ambani's Reliance Group

India signs one-year deal to import 2.2 million tonnes of LPG from US