


Highlights
- Hindustan Unilever shows short-term bullish potential, RSI stable
- Nestle India trades above key EMAs, bullish momentum
- Power Grid and SBI Life indicate neutral RSI trends
Latest news

Nitin Gadkari reveals how he met Hamas chief Ismail Haniyeh hours before assassination in Tehran

BNP acting chairman Tarique Rahman returns to Dhaka after 17 years in exile

India revamps tax regime in 2025, new I-T Act to take effect from April 1

BNP's acting chief Tarique Rahman set to return to Bangladesh after 17-year exile

Navi Mumbai International Airport starts commercial flight operations

PM Modi attends Christmas service at Delhi church, greets citizens

Gujarat AAP MLA Chaitar Vasava refutes Rs 75 lakh extortion claims by BJP MP

AAP MLA Gopal Italia alleges bullying, extortion at Visavadar groundnut centre
Top 5 Nifty 50 gainers today – March 10, 2025: Biggest stock moves


In this article, we will explore the technical indicators of some of the high-performing stocks on the Indian stock market, including HINDUNILVR, INFY, NESTLEIND, POWERGRID, and SBILIFE.
By looking at these stocks through the lens of key technical factors, we aim to better understand their price movements, trends, and potential future performance.

Analysis for Hindustan Unilever - March 10, 2025
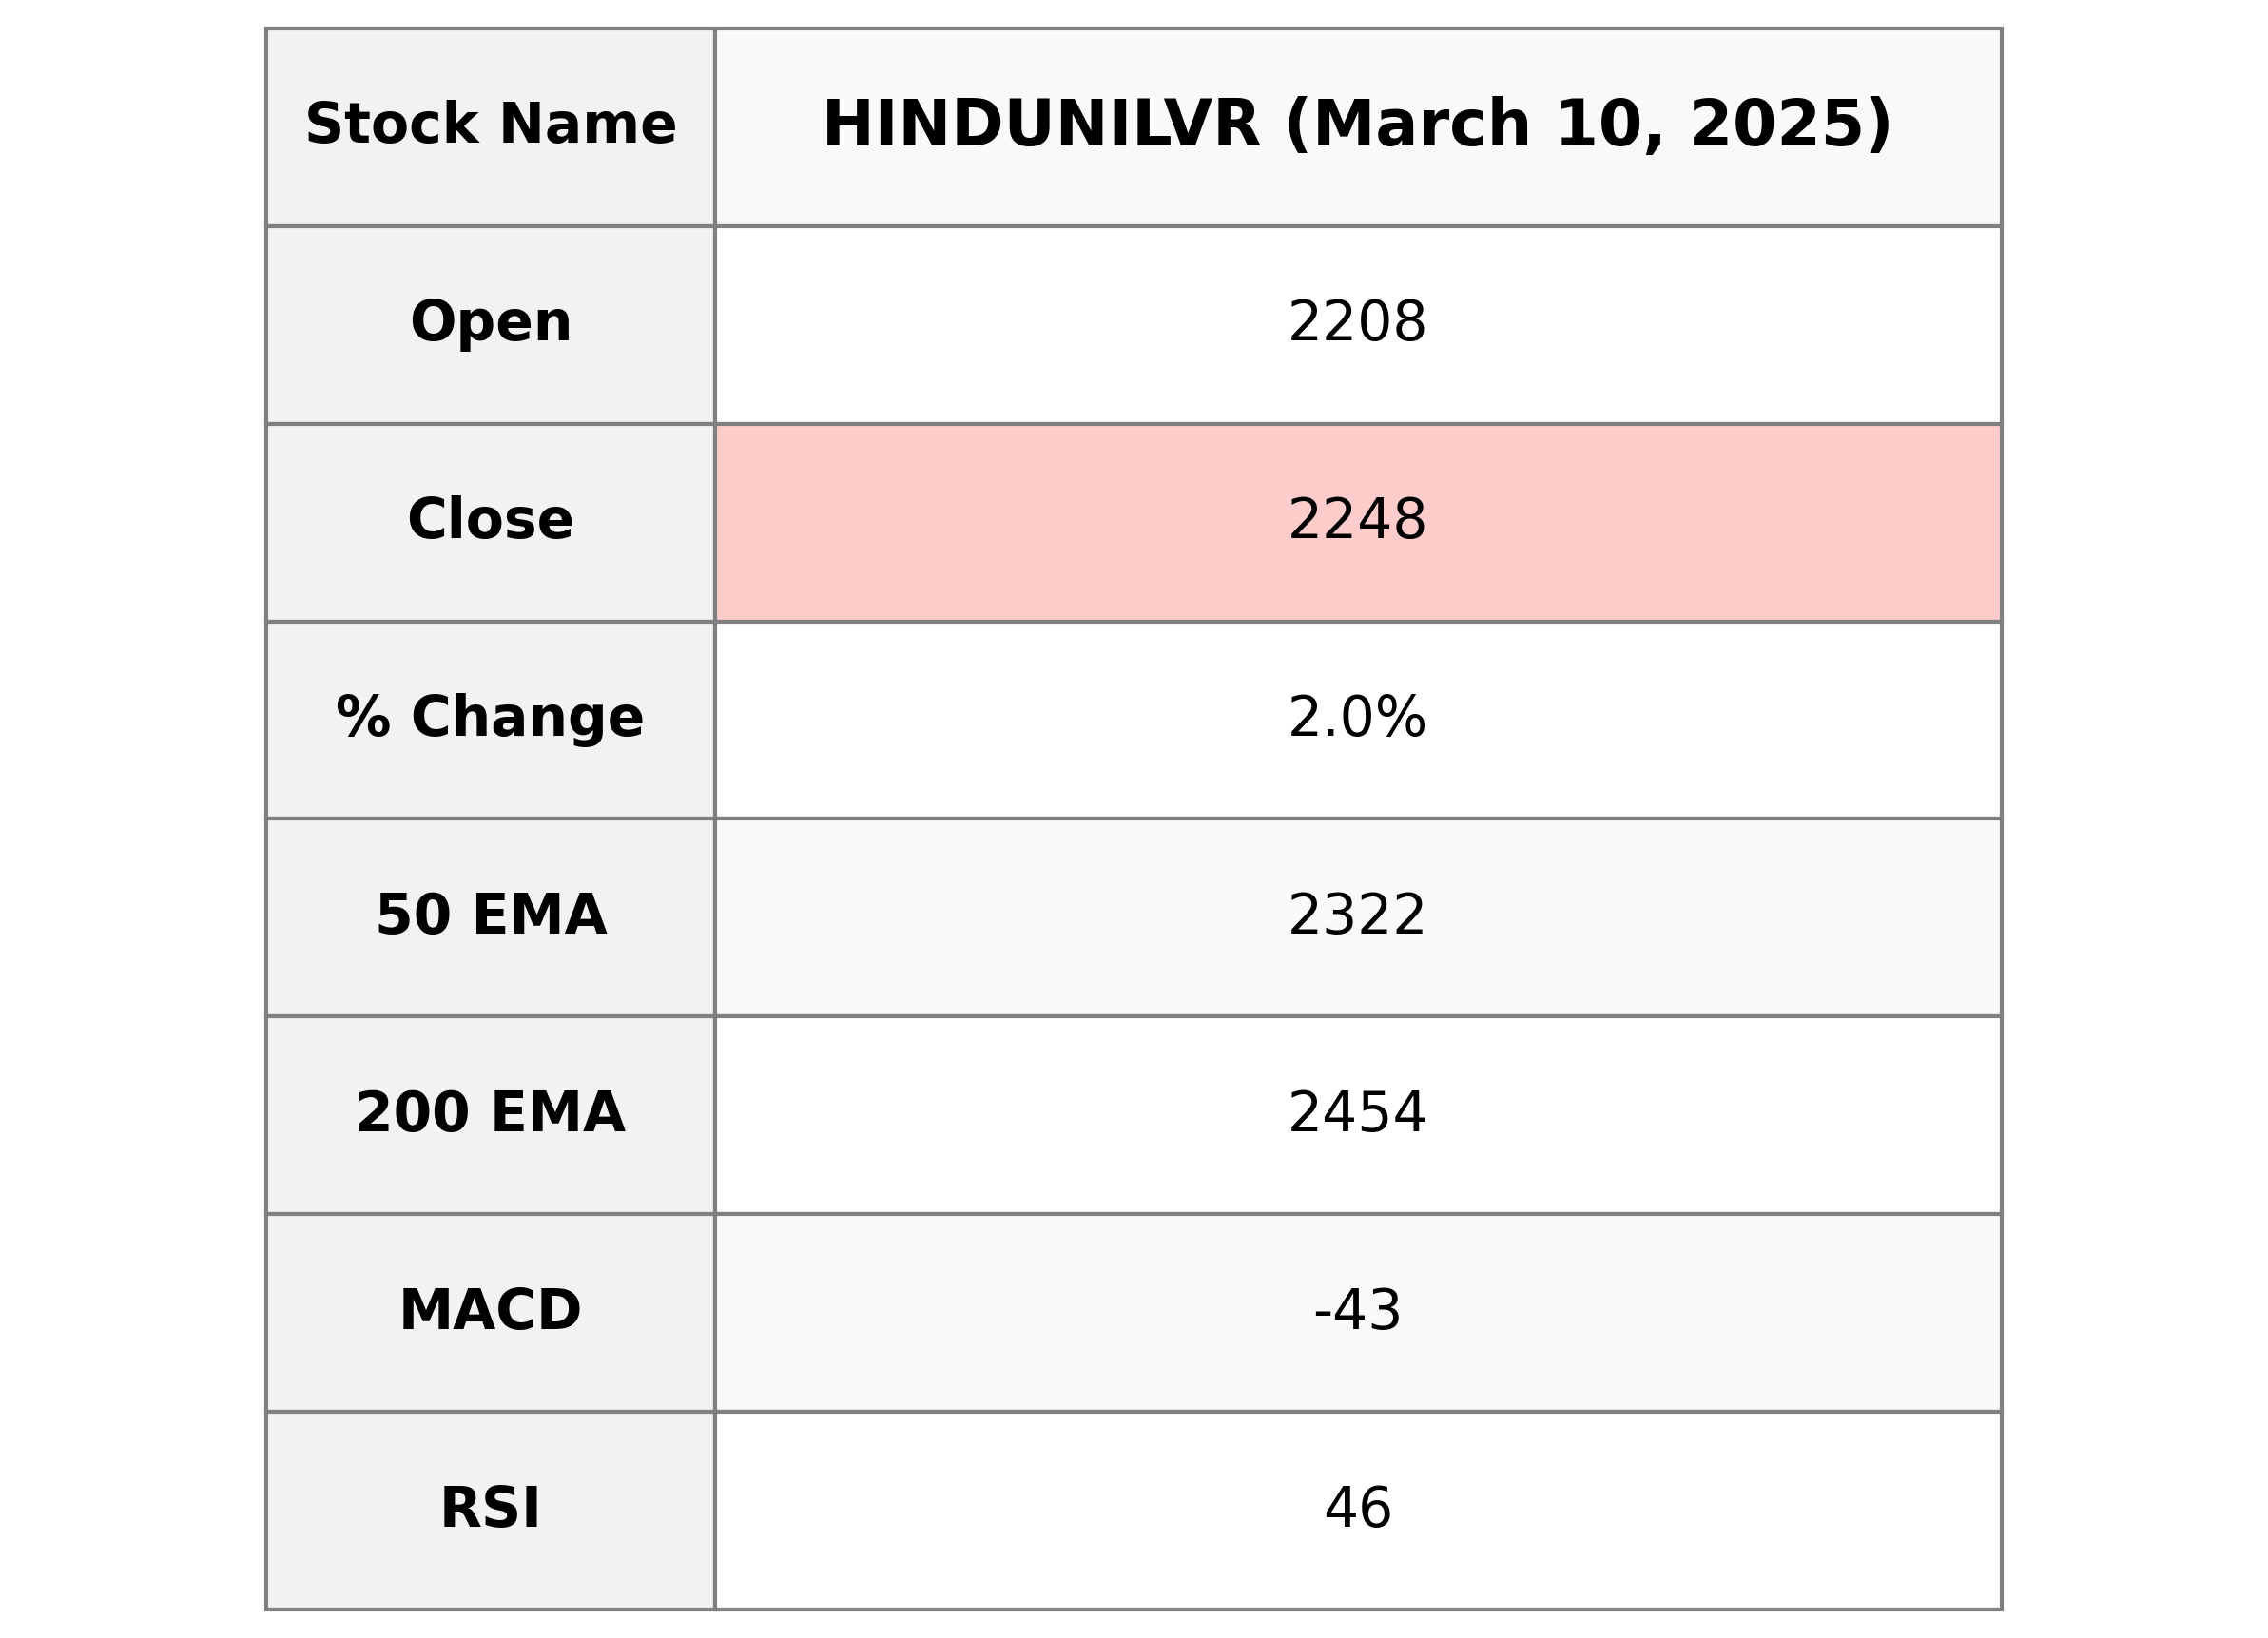
Hindustan Unilever demonstrated a positive movement with a closing price of 2247.75, reflecting a 1.96% increase from its previous close of 2204.55. Despite being below its 50 and 200 EMA, indicating potential short-term resistance, the stock shows a relatively stable RSI of 45.78. With a market cap of 5.28 trillion INR, it remains a significant player in the Consumer Defensive sector in India.

Relationship with Key Moving Averages
Hindustan Unilever's closing price of 2247.75 is above its 10_EMA (2221.68) and below its 50_EMA (2321.90) and 20_EMA (2253.85), indicating short-term bullishness but current positioning below longer-term averages. The 50_EMA is also below the 200_EMA (2454.18), suggesting a bearish overall trend.
Moving Averages Trend (MACD)
The MACD value for Hindustan Unilever is -42.85, while the MACD Signal is -43.84. As the MACD is above the signal line, this suggests potential bullish divergence, indicating a possible trend reversal or price correction in the near term.

RSI Analysis
The Relative Strength Index (RSI) for Hindustan Unilever is 45.78, which suggests that the stock is neither in an overbought nor oversold condition but is closer to the oversold range. RSI values between 30 and 70 indicate a relatively balanced condition.

Analysis for Infosys - March 10, 2025

Infosys shows a moderate single-day performance with a closing price of 1701.45, reflecting a slight increase of 0.92% from its previous close of 1686. The stock's current price is trading below key moving averages such as the 50 and 200-day EMAs, indicating a potential downward trend. Additionally, the RSI of 35 suggests that the stock might be approaching oversold territory.

Relationship with Key Moving Averages
The stock price of Infosys is trading below its 10 EMA, 20 EMA, 50 EMA, and 200 EMA, indicating a bearish trend. With the RSI at 35.00, Infosys may be considered oversold, suggesting potential buying opportunities depending on market conditions.
Moving Averages Trend (MACD)
Infosys is currently experiencing bearish momentum as indicated by the MACD value of -47.62, which is below the MACD Signal line at -39.96. This negative divergence suggests a potential continuation of the downtrend unless there is a reversal in the trend dynamics.

RSI Analysis
The RSI value for Infosys is 35.00, which suggests that the stock is currently in the oversold territory. An RSI below 30 is typically considered oversold, indicating potential undervaluation, so this reading is just above that threshold and might warrant careful monitoring for potential buying opportunities.

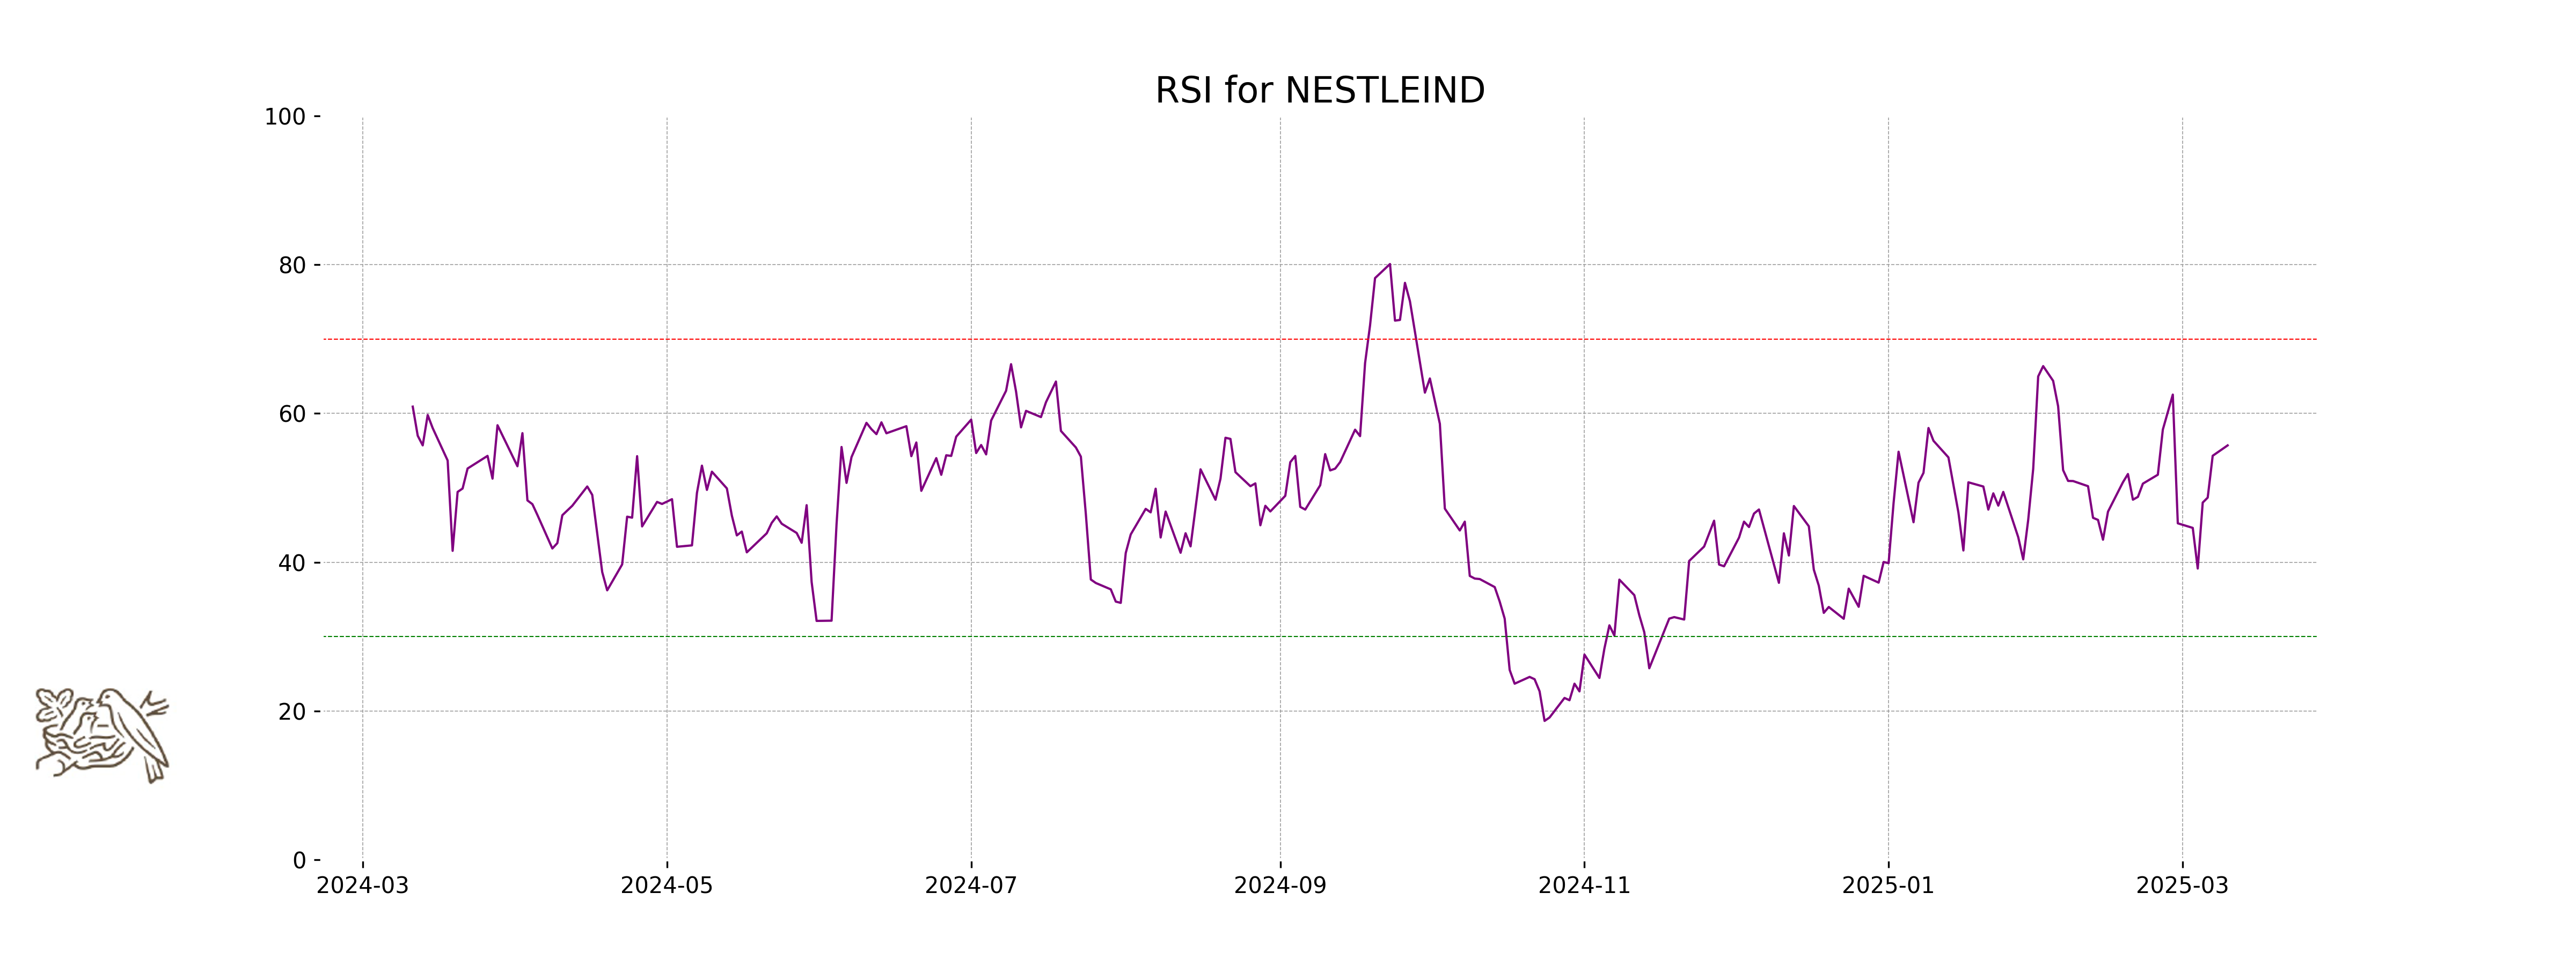
Analysis for Nestle - March 10, 2025

Nestle India Performance: Nestle India traded with an opening of 2239.20 and closed at 2248.40, marking a modest daily percentage change of 0.44% with a points increase of 9.95. The stock showed resilience with a favorable RSI of 55.71, indicating a positive trend above its 50 and 10 EMA, hinting at a short-term bullish outlook.

Relationship with Key Moving Averages
Nestle's stock closed at 2248.40, positioned above its 50-day EMA of 2218.55, 10-day EMA of 2215.98, and 20-day EMA of 2214.39, indicating a short-term bullish sentiment. However, it remains below the 200-day EMA of 2314.40, suggesting caution for long-term trends.
Moving Averages Trend (MACD)
MACD Analysis for Nestle: The MACD value for Nestle is 1.38, while its Signal line is -0.63, indicating a potentially bullish trend as the MACD line is above the Signal line. This suggests that the stock might be gaining upward momentum.

RSI Analysis
The relative strength index (RSI) for Nestle India stands at 55.71, suggesting a neutral position as it is neither in the overbought (above 70) nor oversold (below 30) territory. This indicates a balance between the recent gains and losses in the stock price, implying no strong momentum either up or down.
Analysis for Power Grid - March 10, 2025

Power Grid Corporation of India Limited The stock of Power Grid Corporation of India Limited opened at 261.05 and closed at 271.30, showing a percentage change of 3.04% with a volume of 30,232,773 shares traded. The stock's RSI of approximately 52.95 suggests moderate momentum, while its MACD indicates a weak bearish trend as it remains below the signal line. The company's financial health is underscored by a market cap of 2,523,252,654,080 INR, a PE ratio of 16.27, and an EPS of 16.67. It operates within the Utilities sector, specifically focusing on regulated electric utilities in India.

Relationship with Key Moving Averages
Power Grid's stock is currently trading below both its 50-day EMA and 200-day EMA, reflecting a bearish trend in a broader context. However, it is trading above its 10-day EMA and 20-day EMA, indicating potential short-term bullish momentum.
Moving Averages Trend (MACD)
Power Grid: The MACD value of -4.88, which is above the MACD Signal of -7.41, suggests a potential bullish trend. This indicates that momentum could be improving, as the MACD line is moving towards crossing above the MACD Signal line. Keep an eye on the RSI value of 52.95 to confirm this trend.

RSI Analysis
RSI Analysis for Power Grid: The Relative Strength Index (RSI) of Power Grid is currently at 52.95. This level suggests that the stock is neither overbought nor oversold, indicating a neutral position in terms of momentum. The RSI is hovering around the midpoint, which may indicate a balance between buying and selling pressures.

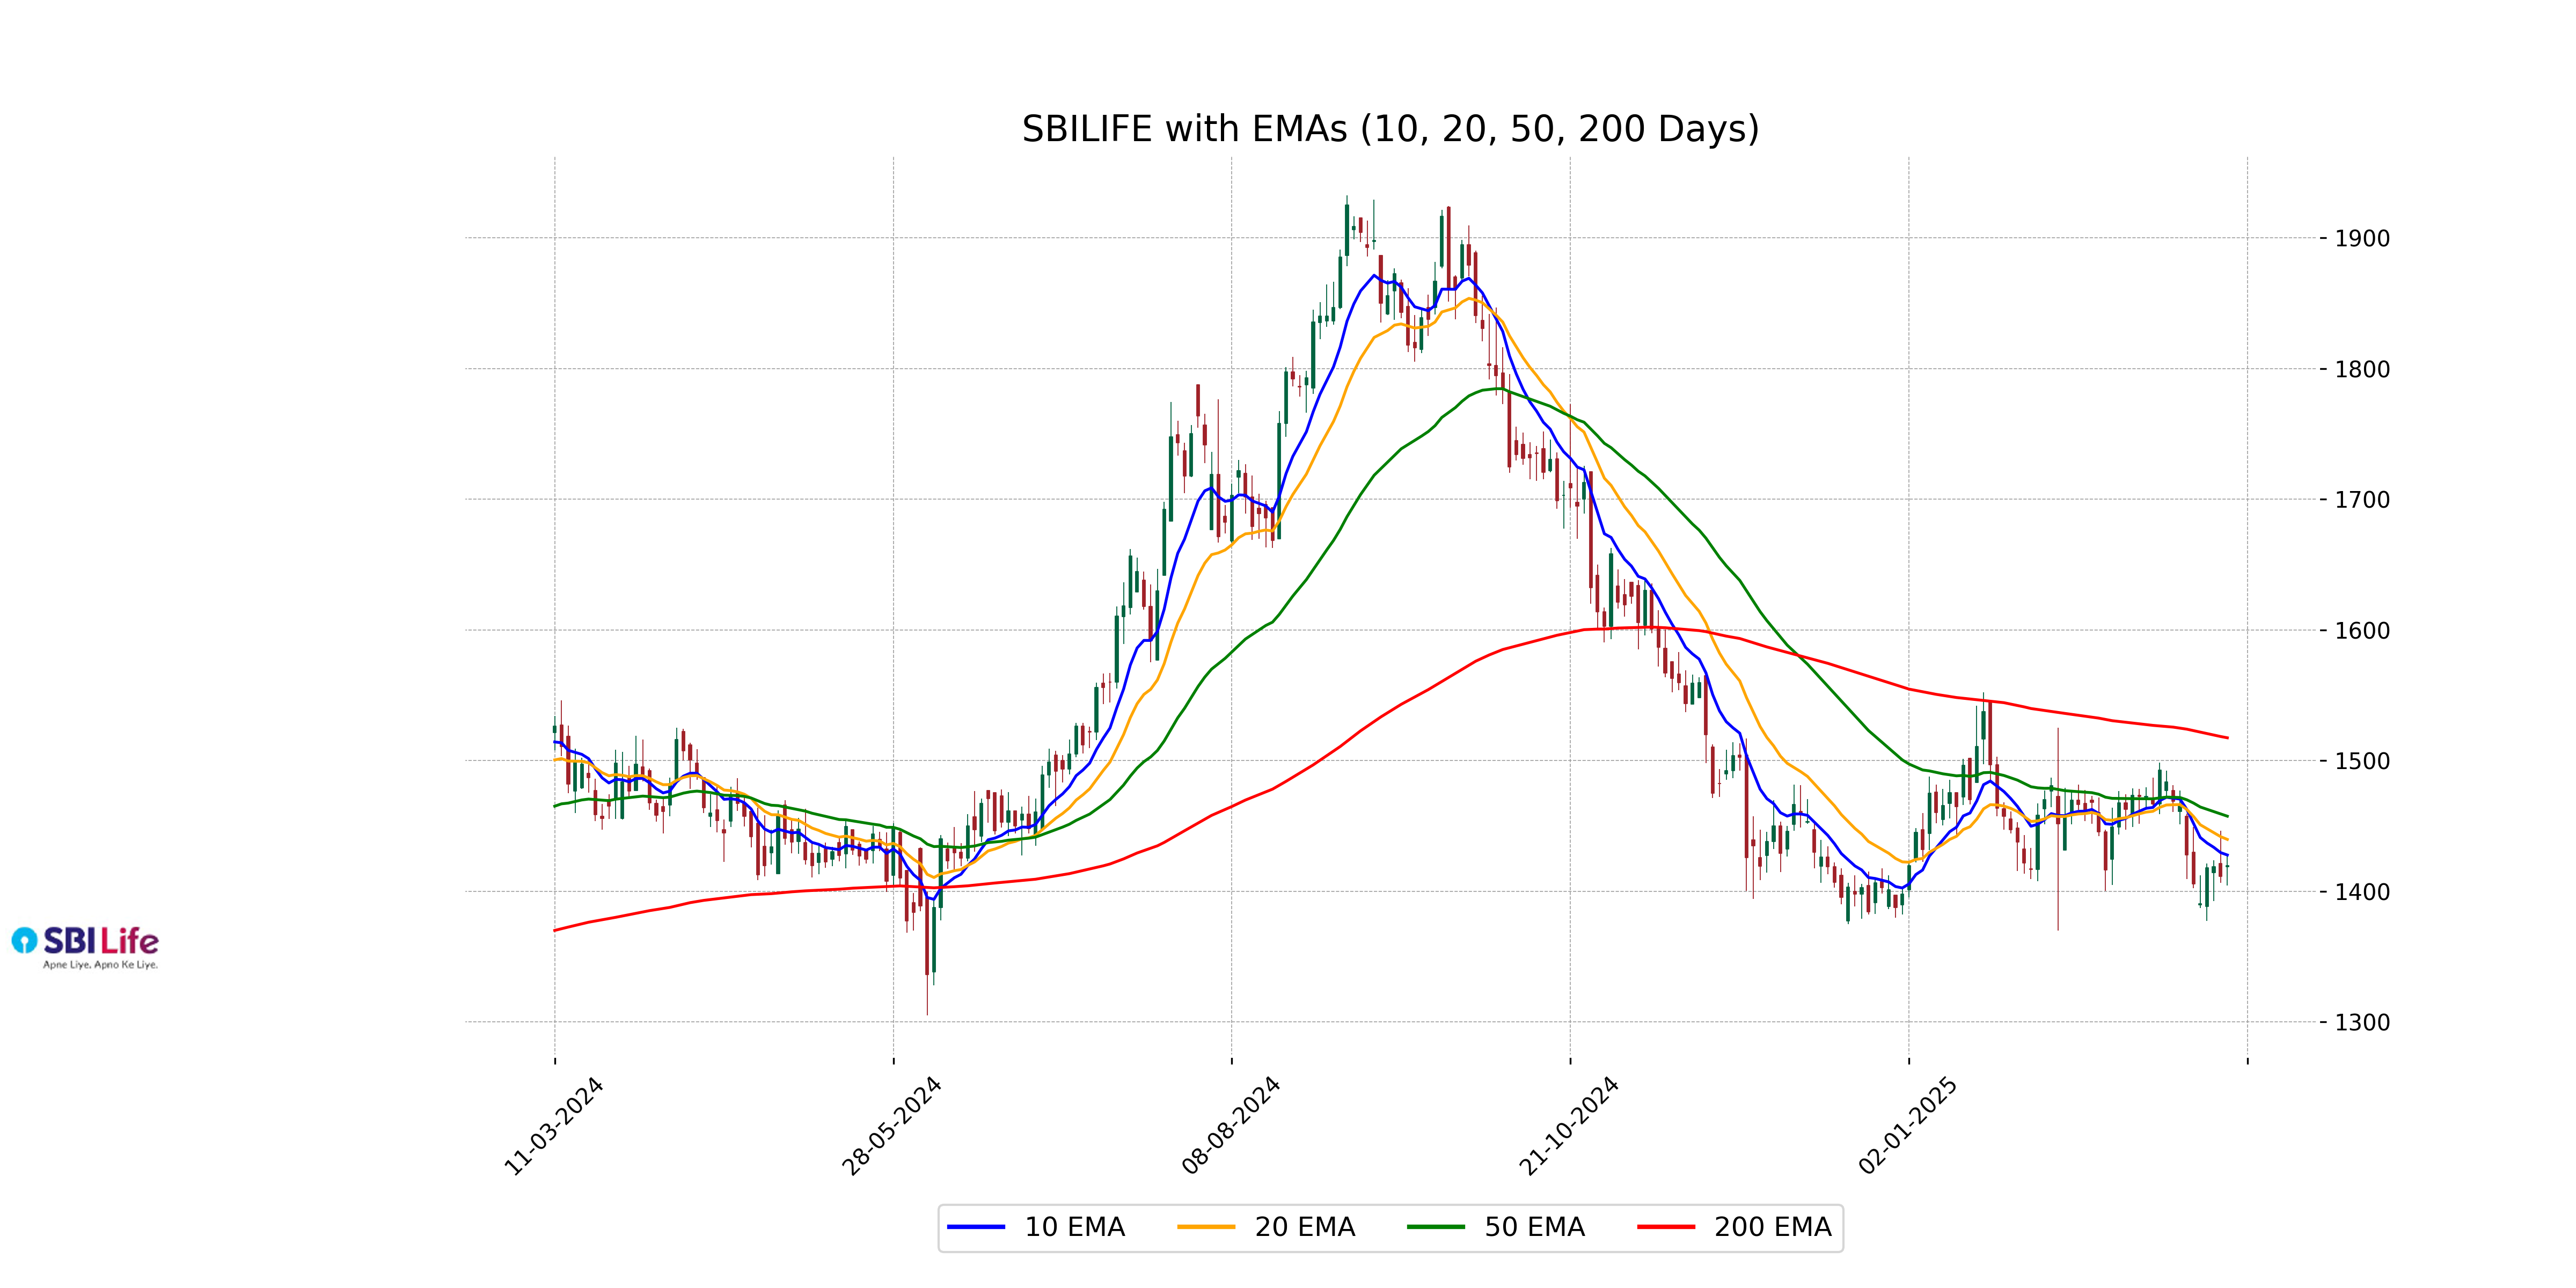
Analysis for SBI Life - March 10, 2025

SBI Life Insurance Company Limited Performance Overview: SBI Life Insurance Company Limited opened at 1419.0 INR and closed slightly higher at 1419.45 INR, marking a 0.56% change. The trading volume for the day was 1,092,901 shares. The company's 50-day EMA is 1457.46, while its 200-day EMA stands at 1517.44, indicating a bearish trend in the short term with an RSI of 43.37. The market cap is approximately 1.42 trillion INR with a PE ratio of 59.14.
Relationship with Key Moving Averages
SBI Life's current closing price of 1419.45 is below the 50-day EMA of 1457.46 and the 200-day EMA of 1517.44, indicating a bearish trend in the longer term. It is also slightly below the 10-day EMA of 1427.77 and the 20-day EMA of 1439.69, suggesting short to medium-term weakness as well.
Moving Averages Trend (MACD)
SBI Life's current MACD value is -12.42, with a MACD Signal line of -7.06, indicating a bearish trend as the MACD line is below the Signal line. This suggests potential downward momentum in the stock price.

RSI Analysis
The RSI value for SBI Life is 43.37, which suggests that the stock is closer to being oversold rather than overbought, as RSI values below 50 generally indicate weaker price momentum. However, it is not yet in the extreme oversold territory, which would be typically indicated by RSI values below 30.

Up Next
Top 5 Nifty 50 gainers today – March 10, 2025: Biggest stock moves

New Zealand commits USD 20 bn investment in India under FTA in 15 yrs; on lines of EFTA pact

India, New Zealand conclude FTA talks; pact to offer duty-free access, USD 20 bn FDI

FTA with New Zealand to significantly deepen bilateral economic engagement: Govt

Rupee breaches 91-mark against US dollar for first time in intra-day trade

Microsoft commits USD 17.5 billion investment in India: CEO Satya Nadella

More videos

CBI books Anil Ambani's son, Reliance Home Finance Ltd. in Rs 228 crore bank fraud case

RBI raises FY26 GDP growth projection to 7.3 pc

RBI trims policy interest rate by 25bps to 5.25pc, loans to get cheaper

Rupee slumps to all-time low of 90.25 against US dollar in intra-day trade

Reliance completes merger of Star Television Productions with Jiostar

India to lead emerging market growth with 7pc GDP rise in 2025: Moody’s

Nifty hits record high after 14 months; Sensex nears all-time peak

Reliance stops Russian oil use at its only-for-export refinery to comply with EU sanctions

ED attaches fresh assets worth over Rs 1,400 cr in case against Anil Ambani's Reliance Group

India signs one-year deal to import 2.2 million tonnes of LPG from US