


Highlights
- Adani Enterprises shows short-term bullish MACD movement
- Tata Steel trades above key moving averages
- Power Grid indicates potential stabilization around EMAs
Latest news

Indian student shot dead near University of Toronto campus

Another Hindu man lynched in Bangladesh over alleged extortion, government denies communal angle

US launches Christmas Day strikes on IS targets in Nigeria

Nitin Gadkari reveals how he met Hamas chief Ismail Haniyeh hours before assassination in Tehran

BNP acting chairman Tarique Rahman returns to Dhaka after 17 years in exile

India revamps tax regime in 2025, new I-T Act to take effect from April 1

BNP's acting chief Tarique Rahman set to return to Bangladesh after 17-year exile

Navi Mumbai International Airport starts commercial flight operations
Top 5 Nifty 50 gainers today – March 05, 2025: Biggest stock moves


In this article, we will explore the technical indicators of some of the high-performing stocks on the Indian stock market, including ADANIENT, ADANIPORTS, M&M, POWERGRID, and TATASTEEL.
By looking at these stocks through the lens of key technical factors, we aim to better understand their price movements, trends, and potential future performance.

Analysis for Adani Enterprises - March 05, 2025

Adani Enterprises opened at 2153.95 and closed at 2245.85, marking a percentage change of 4.71% and a points change of 101.05. The trading volume was 1,369,930 shares. The company operates in the Thermal Coal industry within India's energy sector, with a market cap of approximately 2,594.41 billion.

Relationship with Key Moving Averages
Adani Enterprises closed at 2245.85, which is below its 50 EMA of 2310.25 and significantly below its 200 EMA of 2647.76, suggesting a downtrend relative to these key moving averages. However, it is above its 10 EMA of 2166.75 and 20 EMA of 2201.07, indicating potential short-term upward momentum.
Moving Averages Trend (MACD)
MACD Analysis for Adani Enterprises: The MACD value for Adani Enterprises is -50.89, which is higher than the MACD Signal of -57.79. This suggests a bullish trend as the MACD line is moving closer to crossing above the signal line. A further rise could indicate a potential buying opportunity.

RSI Analysis
The Relative Strength Index (RSI) for Adani Enterprises is 51.87, which suggests that the stock is currently in a neutral zone. This indicates that neither the buyers nor the sellers are currently in control, providing no immediate buy or sell signals.

Analysis for Adani Ports - March 05, 2025

Adani Ports opened at 1056.80 and closed at 1112.70, marking a 5.18% increase from its previous close of 1057.95 with a point change of 54.75. The volume was 3,785,613, and the stock is trading below its 50-day and 200-day EMAs, indicating potential bearish momentum despite a positive RSI and MACD. Adani Ports, part of the Industrials sector and Marine Shipping industry in India, has a market cap of approximately 2.41 trillion INR, a PE ratio of 23.74, and an EPS of 46.87.
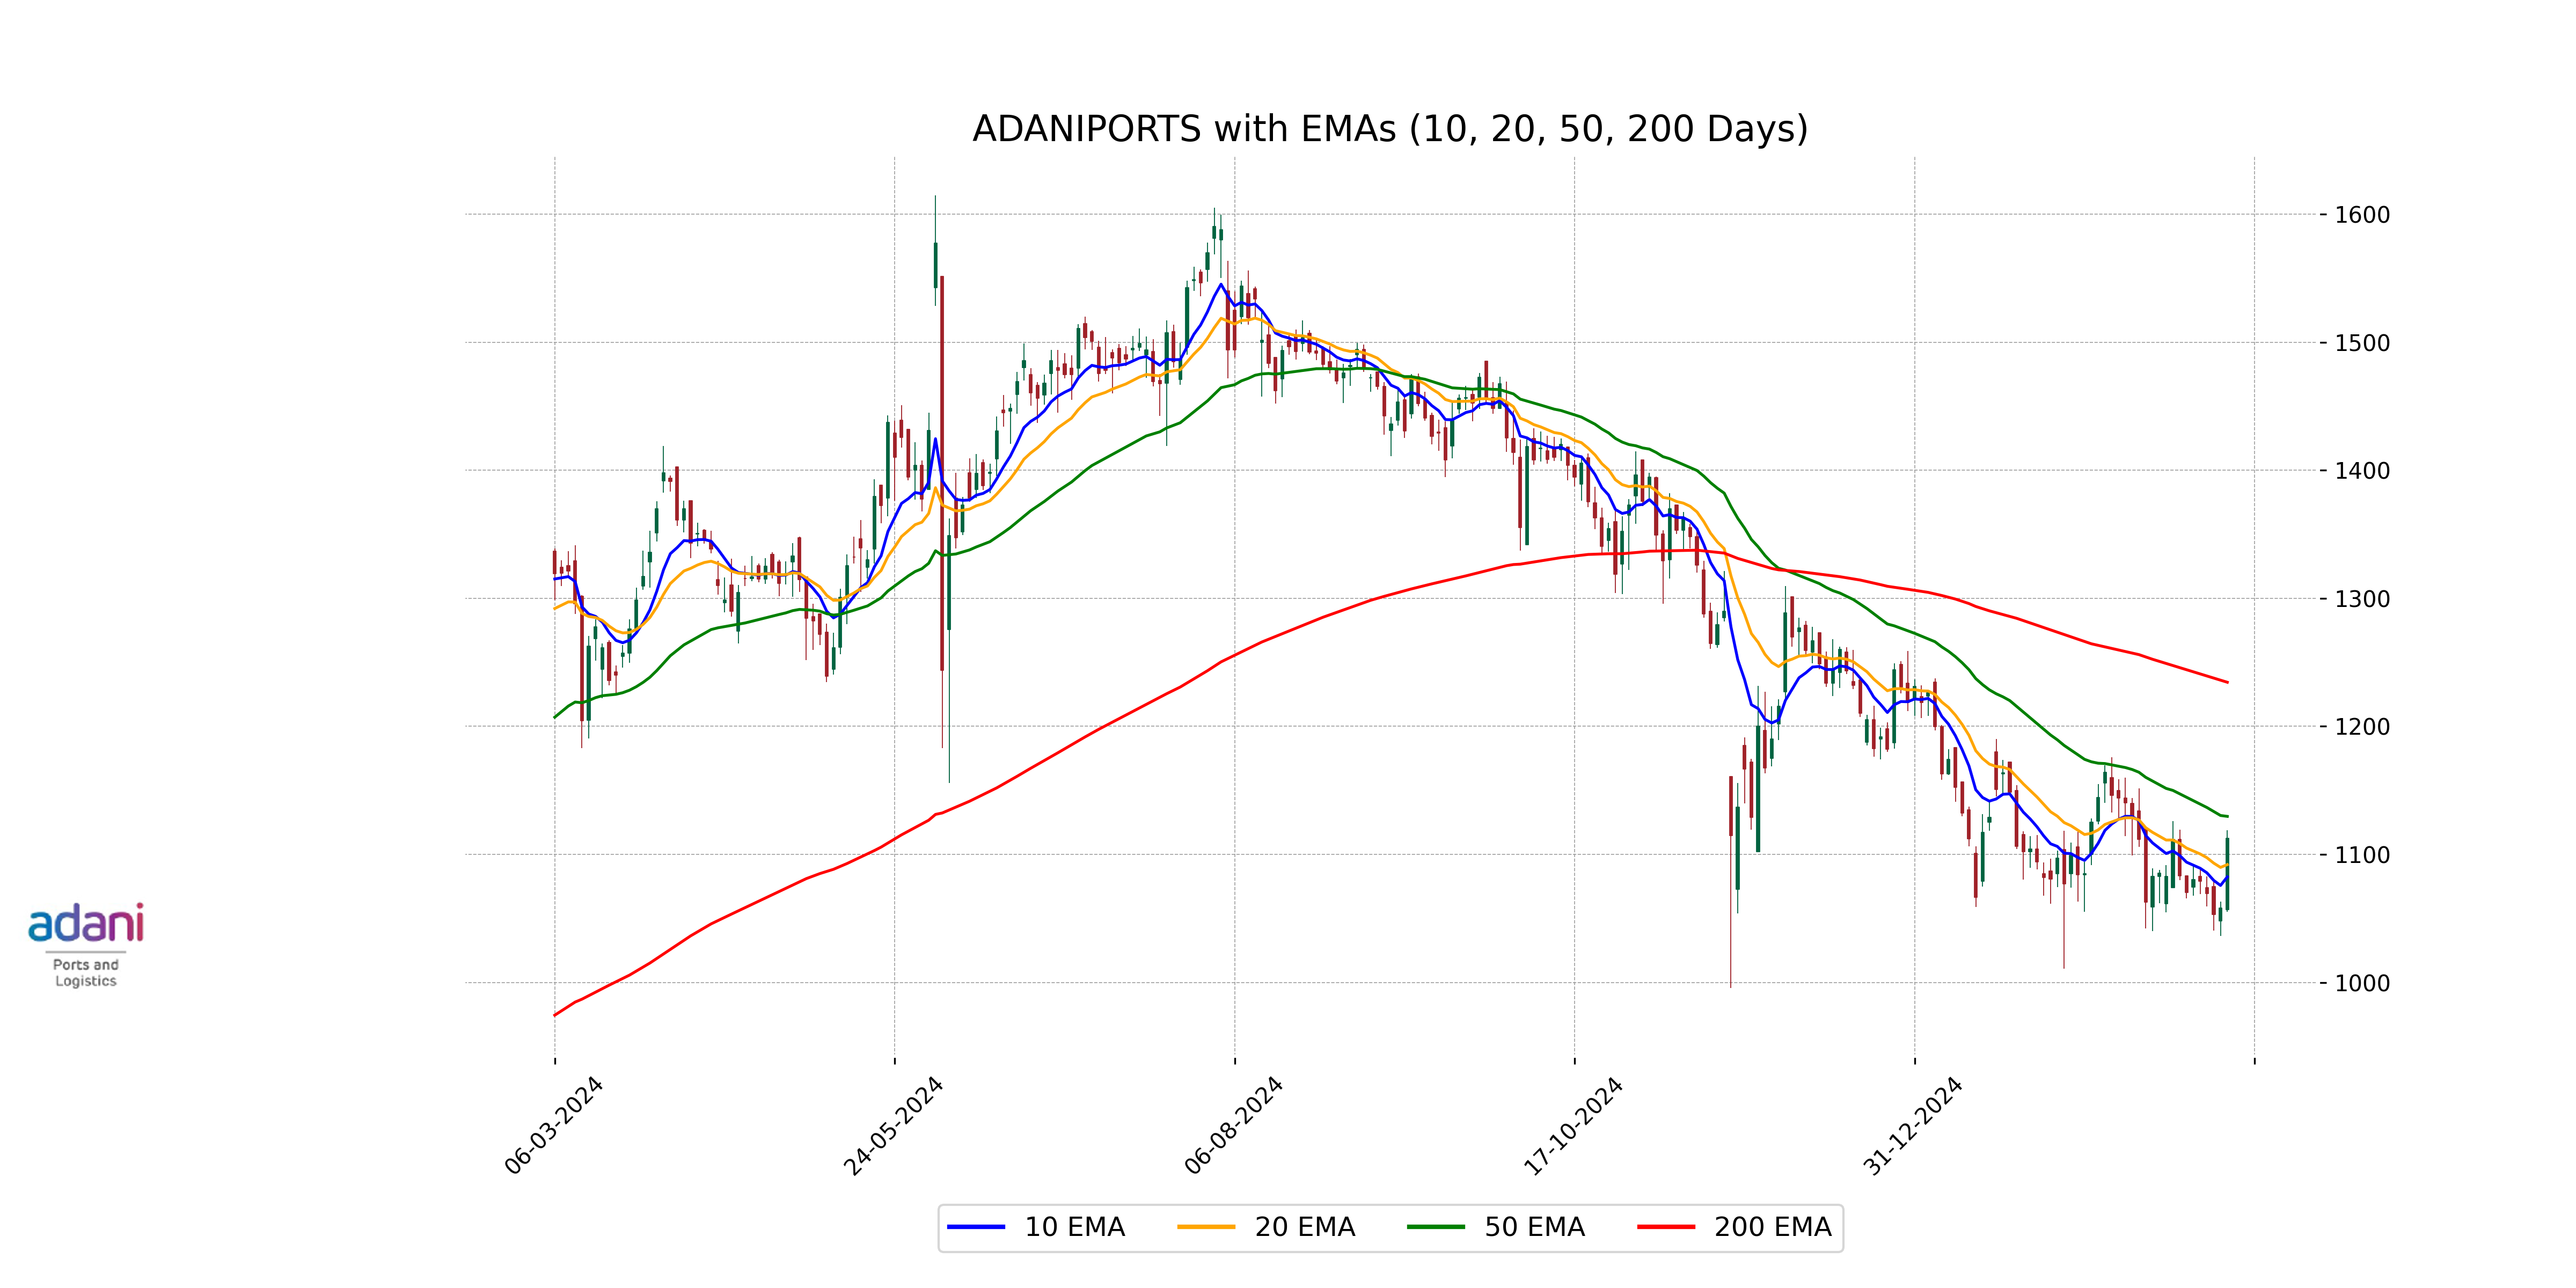
Relationship with Key Moving Averages
Adani Ports closed at 1112.70, which is below its 50-day EMA of 1129.67 and significantly below its 200-day EMA of 1234.40. However, it is trading above its 10-day EMA of 1082.44 and its 20-day EMA of 1091.99, indicating short-term bullish momentum compared to recent averages.
Moving Averages Trend (MACD)
Based on the MACD analysis, Adani Ports shows a MACD value of -14.28 with a signal line at -15.53, indicating a potential bullish crossover since the MACD is converging towards the signal line. This suggests growing positive momentum, which could be a precursor to an upward price movement if the trend continues.

RSI Analysis
Adani Ports, with an RSI of 52.84, is hovering near the mid-point of the RSI scale. This suggests a neutral trend, indicating neither overbought nor oversold conditions, implying potential stability or a wait-and-see attitude among investors.

Analysis for Mahindra & Mahindra - March 05, 2025
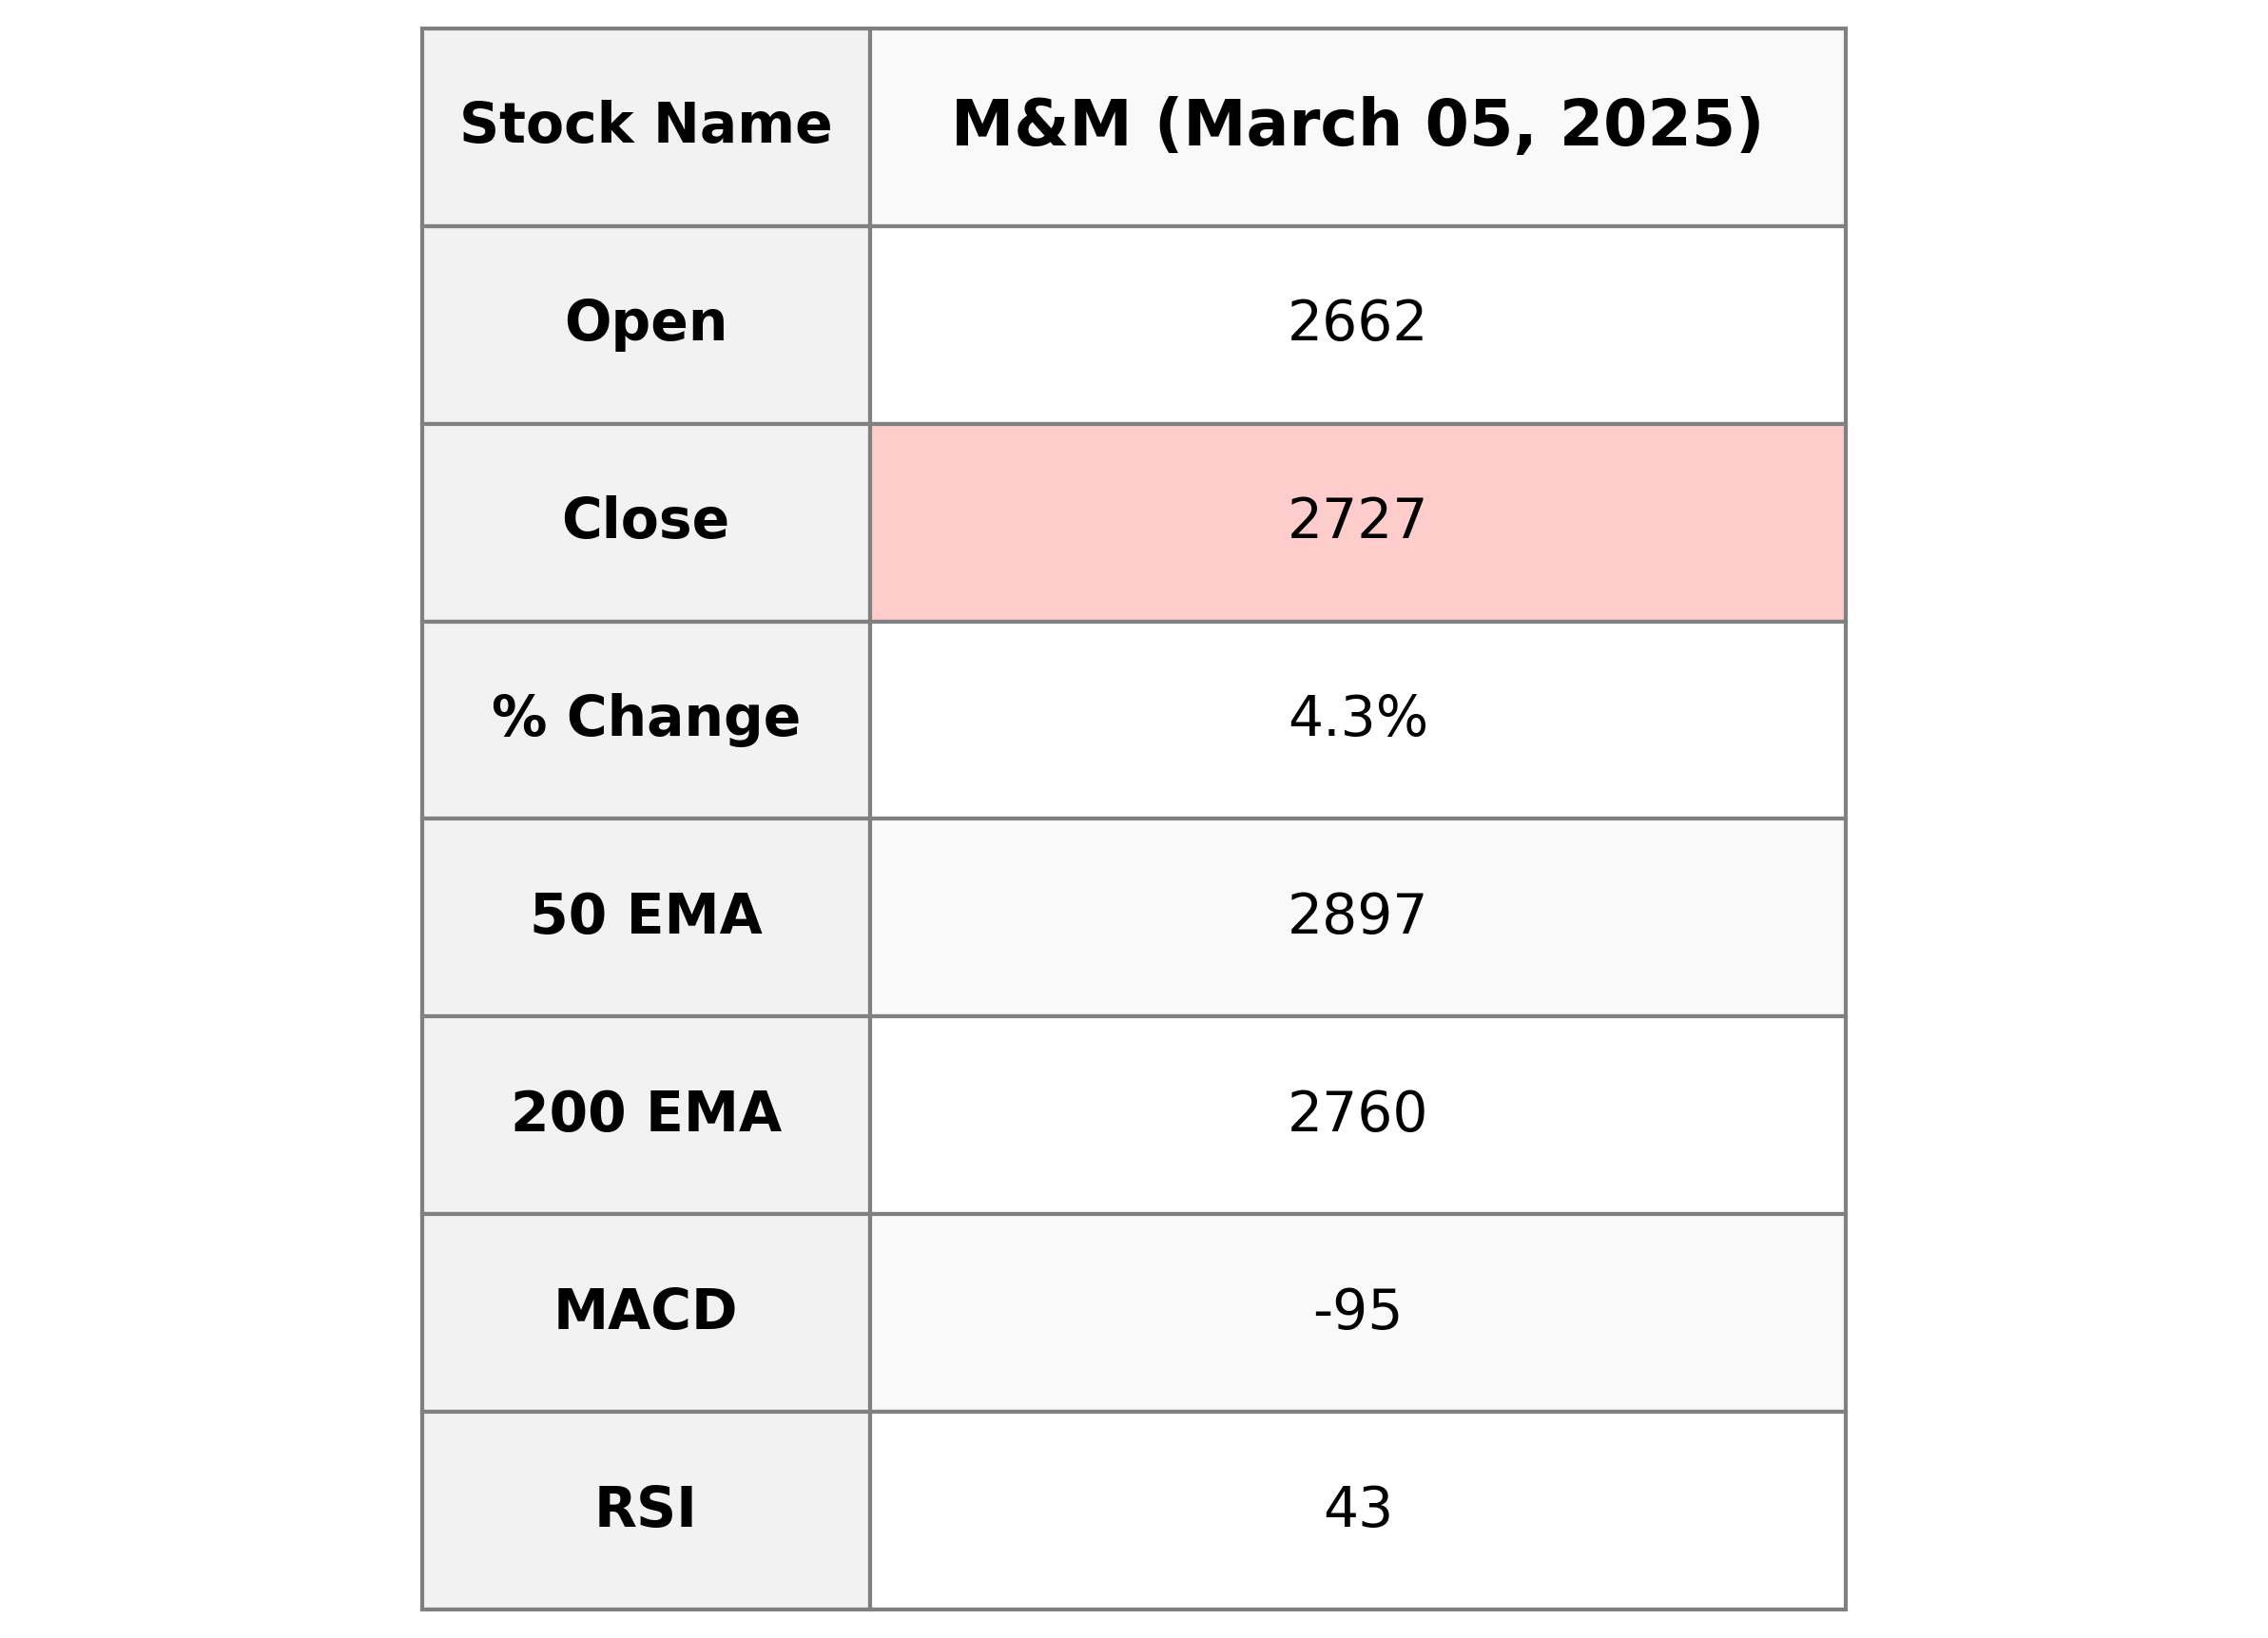
Mahindra & Mahindra has experienced a positive market performance, exhibiting a significant price increase of 4.33% with the stock closing at 2726.60. Despite this rise, the stock price is trading below its 200-day and 50-day Exponential Moving Averages, indicating a potential long-term bearish trend. With an RSI of 43.11, the stock is not in the overbought territory, and the negative MACD value suggests cautious market sentiment.

Relationship with Key Moving Averages
Mahindra & Mahindra's current closing price of 2726.60 is below its 50-day EMA of 2897.20 and its 200-day EMA of 2760.36, indicating a short to medium-term downtrend. However, it is slightly above the 10-day EMA of 2718.41, which may suggest a potential short-term upward movement.
Moving Averages Trend (MACD)
MACD Analysis for Mahindra & Mahindra: The MACD for Mahindra & Mahindra is currently at -95.35, which is below the MACD Signal of -75.60, suggesting a bearish trend. The negative value indicates that the stock might be experiencing downward momentum.

RSI Analysis
The Relative Strength Index (RSI) for Mahindra & Mahindra is 43.11, which suggests that the stock is in the lower end of the neutral range. This could indicate that the stock is neither overbought nor oversold and may have potential for upward movement if other indicators align.

Analysis for Power Grid - March 05, 2025

Power Grid Corporation of India Performance Overview: Power Grid saw a notable daily percentage increase in stock price, climbing roughly 4.09% compared to its previous close. Despite this positive movement, the company's stock is trading below its 50-day and 200-day EMAs, hinting at a longer-term bearish trend. With a PE ratio of 15.87 and an RSI of 46.29, the stock isn't oversold, suggesting moderate investor interest.

Relationship with Key Moving Averages
The closing price of Power Grid is 264.40, which is below both the 50-day EMA (279.66) and the 200-day EMA (294.35), indicating a bearish trend over these longer-term periods. However, it is slightly above the 10-day EMA (258.84), suggesting some short-term positivity. The proximity to the 20-day EMA (264.22) shows a potential stabilization around recent levels.
Moving Averages Trend (MACD)
MACD Analysis for Power Grid: The MACD value of -7.9899, which is above the MACD Signal of -8.9303, indicates a potential bullish momentum, as the MACD line is moving towards the signal line. However, the negative MACD suggests that the stock is still in a bearish phase, so investors should monitor for further confirmation.

RSI Analysis
The RSI (Relative Strength Index) for Power Grid is currently at 46.29, indicating that the stock is in a neutral position as it is neither in the overbought nor oversold territory. This suggests that there is no strong directional momentum in the stock price at the moment.

Analysis for Tata Steel - March 05, 2025

### Tata Steel Performance Overview Tata Steel opened at 139.0 and closed at 146.1, indicating a 4.85% increase from the previous close of 139.34, with a volume of 62,100,760. The company's technical indicators show a strong position above the 50 EMA of 136.75 and a MACD that exceeds its signal line, suggesting bullish momentum. With a market cap of approximately ₹1.82 trillion and a high PE ratio of 65.81, Tata Steel operates in the Basic Materials sector, focusing on the Steel industry in India.

Relationship with Key Moving Averages
Tata Steel's current price of 146.10 is above its 50-day EMA of 136.75 and 200-day EMA of 143.86, indicating a potential upward trend. The stock's 10-day and 20-day EMAs at 139.14 and 137.17 support this short-term bullish momentum as well.
Moving Averages Trend (MACD)
MACD Analysis for Tata Steel: The MACD value of 2.0491 is above the MACD Signal of 1.2563, indicating a potential bullish momentum for Tata Steel. This suggests that the stock's price may continue to rise, as the current trend appears positive. The RSI of 66.7325 also supports this bullish outlook, hovering near the overbought territory.

RSI Analysis
RSI Analysis for Tata Steel: The RSI for Tata Steel is 66.73, which is above the typical overbought threshold of 70. This suggests that while the stock is not yet in the overbought territory, it is approaching that level, indicating potential upward momentum but warranting caution for a possible pullback.

Up Next
Top 5 Nifty 50 gainers today – March 05, 2025: Biggest stock moves

New Zealand commits USD 20 bn investment in India under FTA in 15 yrs; on lines of EFTA pact

India, New Zealand conclude FTA talks; pact to offer duty-free access, USD 20 bn FDI

FTA with New Zealand to significantly deepen bilateral economic engagement: Govt

Rupee breaches 91-mark against US dollar for first time in intra-day trade

Microsoft commits USD 17.5 billion investment in India: CEO Satya Nadella

More videos

CBI books Anil Ambani's son, Reliance Home Finance Ltd. in Rs 228 crore bank fraud case

RBI raises FY26 GDP growth projection to 7.3 pc

RBI trims policy interest rate by 25bps to 5.25pc, loans to get cheaper

Rupee slumps to all-time low of 90.25 against US dollar in intra-day trade

Reliance completes merger of Star Television Productions with Jiostar

India to lead emerging market growth with 7pc GDP rise in 2025: Moody’s

Nifty hits record high after 14 months; Sensex nears all-time peak

Reliance stops Russian oil use at its only-for-export refinery to comply with EU sanctions

ED attaches fresh assets worth over Rs 1,400 cr in case against Anil Ambani's Reliance Group

India signs one-year deal to import 2.2 million tonnes of LPG from US