


Highlights
- Nifty 50 market showed promising signs of a rally
- Positive momentum in key sectors such as Industrials and Basic Materials
- Investors are likely to keep a watchful eye, anticipating continued gains
Latest news

Nitin Gadkari reveals how he met Hamas chief Ismail Haniyeh hours before assassination in Tehran

BNP acting chairman Tarique Rahman returns to Dhaka after 17 years in exile

India revamps tax regime in 2025, new I-T Act to take effect from April 1

BNP's acting chief Tarique Rahman set to return to Bangladesh after 17-year exile

Navi Mumbai International Airport starts commercial flight operations

PM Modi attends Christmas service at Delhi church, greets citizens

Gujarat AAP MLA Chaitar Vasava refutes Rs 75 lakh extortion claims by BJP MP

AAP MLA Gopal Italia alleges bullying, extortion at Visavadar groundnut centre
Top 5 Nifty 50 gainers today – March 03, 2025: Biggest stock moves


In this article, we will explore the technical indicators of some of the high-performing stocks on the Indian stock market, including BEL, BPCL, EICHERMOT, GRASIM, and JSWSTEEL.
By looking at these stocks through the lens of key technical factors, we aim to better understand their price movements, trends, and potential future performance.

Analysis for Bharat Electronics - March 03, 2025

Bharat Electronics opened at 247.5 and closed at 257.39, showing a positive change of 4.52% with a price increase of 11.14 points. Despite the recent rise, its 50 EMA and 200 EMA are below its current price, indicating potential resistance levels. The stock's RSI is at 46.05, suggesting it is neither overbought nor oversold. The PE ratio stands at 37.74, within a sector focused on aerospace and defense in India.

Relationship with Key Moving Averages
Bharat Electronics closed at 257.39, which is slightly above its 10 EMA of 255.43 but below both its 20 EMA of 260.27 and its 50 EMA of 271.00. This indicates a short-term bullish signal but may suggest bearishness over the longer term, as the price is beneath the longer moving averages.
Moving Averages Trend (MACD)
Bharat Electronics exhibits a negative MACD value of -6.59, indicating a bearish momentum as it is below the zero line. However, the MACD is slightly above the MACD Signal line of -6.65, suggesting a potential early signal for a trend reversal or slowing bearish momentum. Overall, this technical indicator suggests caution for investors.

RSI Analysis
Bharat Electronics currently has an RSI value of 46.05, indicating that the stock is neither in overbought nor oversold territory but is closer to the oversold range. This suggests a neutral market sentiment with a slight tendency towards increased buying interest.

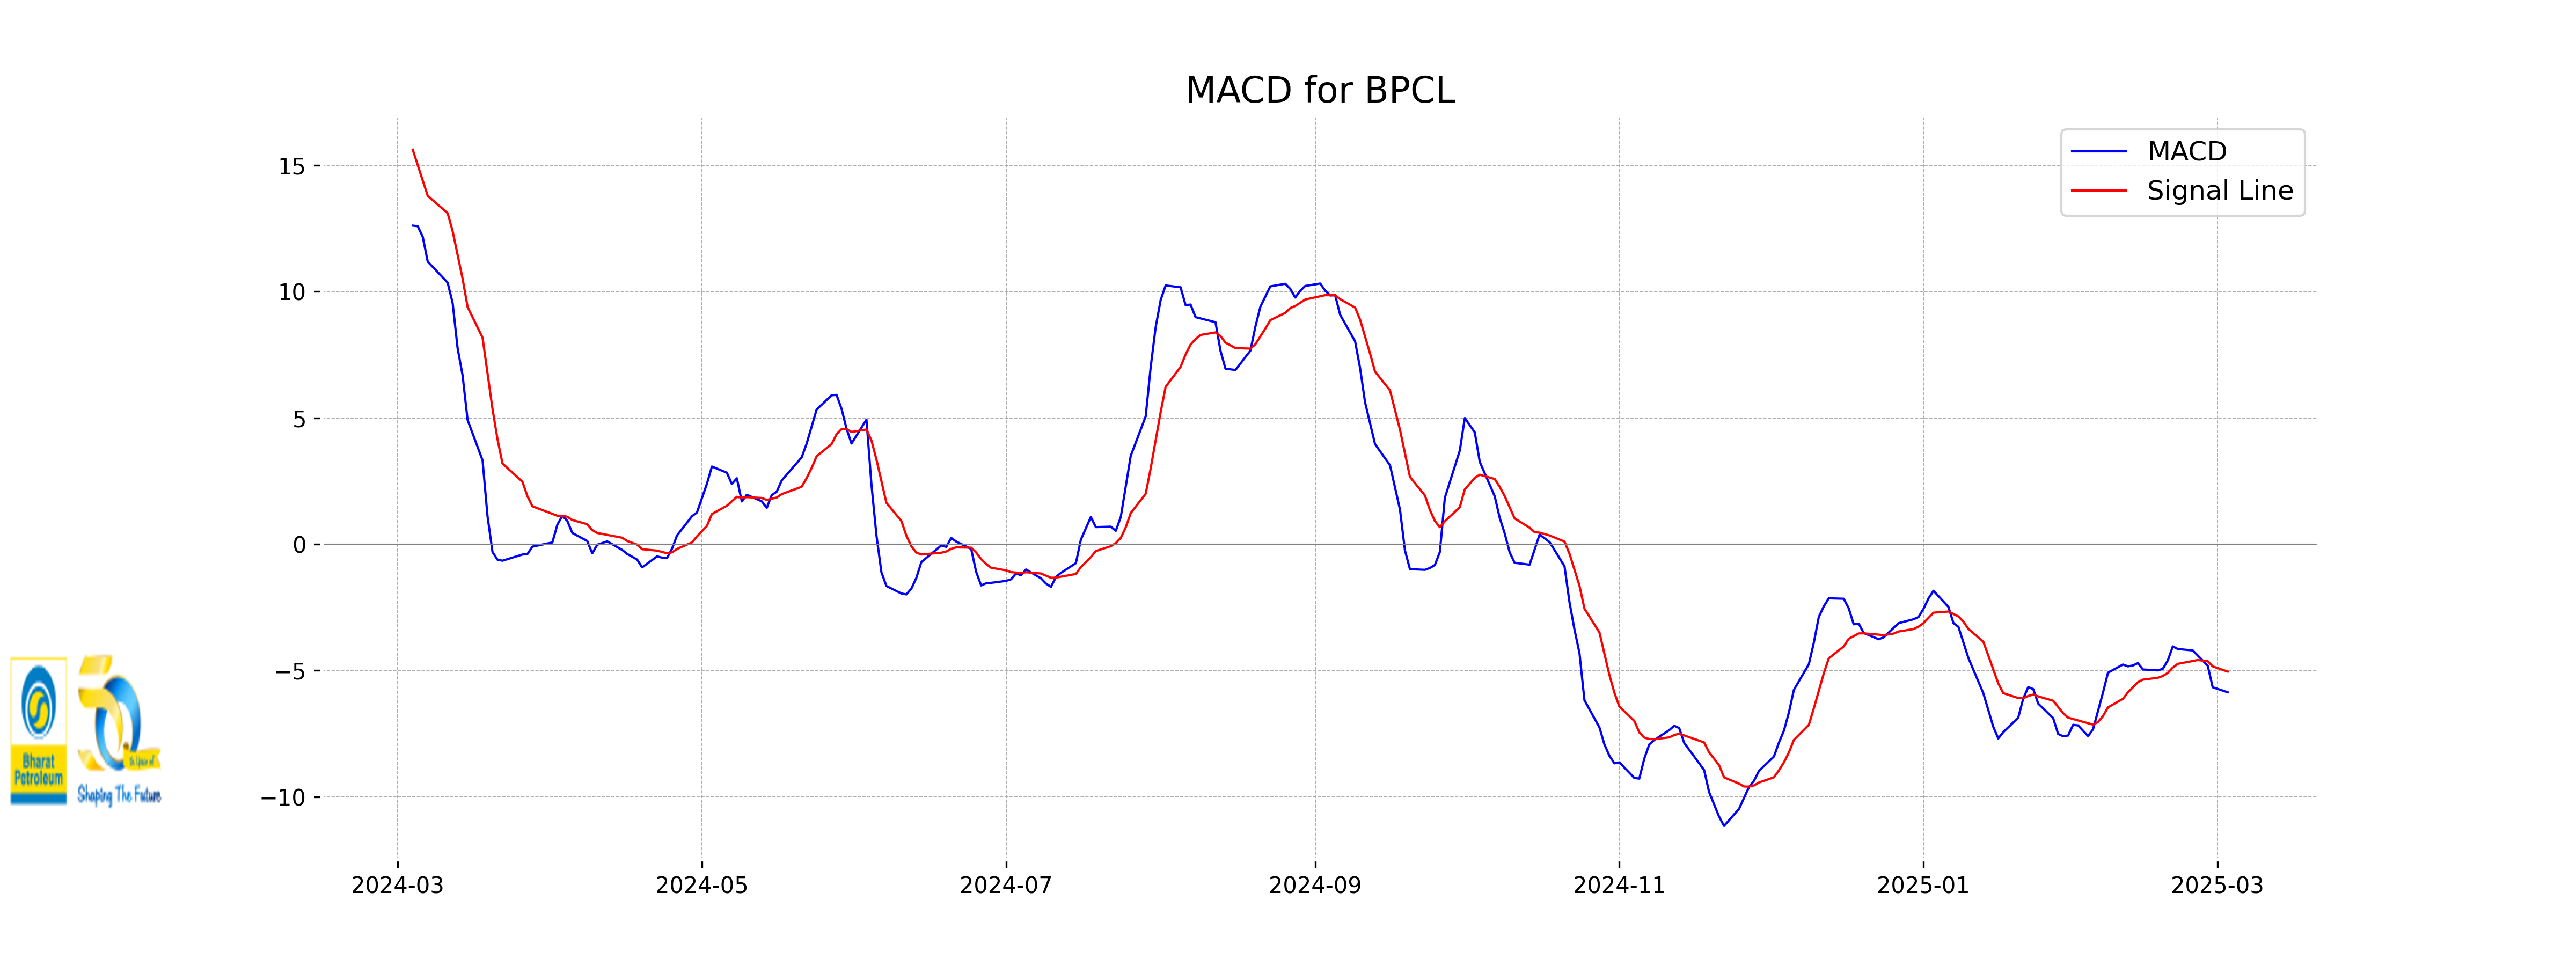
Analysis for BPCL - March 03, 2025

BPCL, an Indian company in the Energy sector specializing in Oil & Gas Refining & Marketing, has a closing stock price of 242.41, marking a 2.15% increase over the previous close. The stock demonstrates a bearish trend with a MACD of -5.86 and a low RSI of 36.45, indicating potential oversold conditions. With a Market Cap of 1.05 trillion INR, it has a healthy PE Ratio of 7.54 and an EPS of 32.15, showing decent profitability. Despite trading below its short, medium, and long EMAs, the company maintains significant trading volume at 6,864,543 shares.

Relationship with Key Moving Averages
Bharat Petroleum Corporation Limited closed at 242.41, which is below its 10 EMA of 247.91, 50 EMA of 263.96, and 200 EMA of 281.89, indicating a bearish trend in relation to its key moving averages. The stock's RSI is at 36.45, suggesting potential oversold conditions.
Moving Averages Trend (MACD)
MACD Analysis for BPCL: The MACD for BPCL is -5.86, which is below the signal line of -5.04. This negative MACD value, along with it being below the signal, indicates bearish momentum. Traders may interpret this as a possible sign of further downward pressure on the stock's price.
RSI Analysis
BPCL's RSI is currently at 36.45, suggesting that the stock is approaching oversold territory. This indicates potential buying opportunities as it nears the level where it could experience upward momentum.

Analysis for Eicher Motors - March 03, 2025

Eicher Motors experienced a positive performance with a closing price of 4906.60, which marks a change of approximately 2.79% from the previous close of 4773.60. The stock had a trading volume of 503549 and a market capitalization of 1.35 trillion INR. Key technical indicators like its RSI indicate a value of 46.48, suggesting it is in the neutral range, while the MACD value indicates a bearish trend.

Relationship with Key Moving Averages
Eicher Motors closed at 4906.60, which is below its 50-day EMA (4989.17) but slightly above its 200-day EMA (4765.44). The stock is also near its 10-day EMA (4911.32) and below its 20-day EMA (4961.80), indicating slight bearish pressure in the short-to-medium term.
Moving Averages Trend (MACD)
The MACD for Eicher Motors is -57.10, which is below the MACD signal line of -48.82. This indicates a bearish momentum as the MACD is in negative territory and below the signal line. It suggests potential weakness in the stock's price movement.

RSI Analysis
The RSI (Relative Strength Index) for Eicher Motors is currently at 46.48, suggesting a neutral trend as it is below the typical overbought threshold of 70. This indicates that the stock is neither overbought nor oversold, and thus, it might trade sideways without any strong directional movement in the short term.

Analysis for Grasim Industries - March 03, 2025

Grasim Industries Performance: Grasim Industries showed a positive market performance with a 3.07% increase in its stock price, closing at 2377.45 after opening at 2328.5. The company, in the Basic Materials sector and Building Materials industry, reported a high PE Ratio of 40.90 and EPS of 58.13, while facing bearish indicators like an RSI of 42.57 and a negative MACD.

Relationship with Key Moving Averages
Grasim Industries' closing price of 2377.45 is currently below its 50-day EMA of 2461.18 and 200-day EMA of 2488.98, indicating a bearish trend in the short to long-term moving averages. However, it is slightly higher than the 10-day EMA of 2393.83 but more notably, it remains below the 20-day EMA of 2420.25.
Moving Averages Trend (MACD)
Grasim Industries' MACD is -27.73, which is below the MACD Signal of -14.11, indicating a bearish momentum. This suggests that the stock may currently be experiencing downward pressure.

RSI Analysis
Grasim Industries has an RSI of 42.57, which is generally considered to be in the neutral range. An RSI below 30 usually indicates an oversold condition, while an RSI above 70 indicates an overbought condition. Therefore, the stock is currently neither overbought nor oversold.

Analysis for JSW Steel - March 03, 2025

JSW Steel Performance: On the given trading day, JSW Steel opened at 959.0 and closed at 976.05, marking a percentage increase of 2.67% from its previous close of 950.70. The company demonstrated upward momentum with a significant points change of 25.35 and high trading volume totaling 1,744,463. The stock's indicators such as the 50 EMA and 200 EMA suggest a positive trend, supported by an RSI of 56.29, indicating mild bullish momentum within the Basic Materials sector.

Relationship with Key Moving Averages
JSW Steel's close price of 976.05 is above its 50-day EMA of 951.82 and 200-day EMA of 929.53, indicating a bullish trend. However, it slightly exceeds the 10-day EMA of 967.77 and the 20-day EMA of 961.85, showing consistent short-term positive momentum.
Moving Averages Trend (MACD)
JSW Steel's MACD value is 8.5874, which is lower than its MACD Signal of 10.0657. This suggests a subdued bullish momentum or a potential upcoming bearish crossover. Monitoring for changes in these values could offer further insights into the stock's momentum in the short term.

RSI Analysis
JSW Steel has an RSI of 56.29, indicating a neutral momentum. The RSI is not in the overbought or oversold region, suggesting the stock might not experience significant price reversals imminently. It reflects moderate buying pressure in the market.

Up Next
Top 5 Nifty 50 gainers today – March 03, 2025: Biggest stock moves

New Zealand commits USD 20 bn investment in India under FTA in 15 yrs; on lines of EFTA pact

India, New Zealand conclude FTA talks; pact to offer duty-free access, USD 20 bn FDI

FTA with New Zealand to significantly deepen bilateral economic engagement: Govt

Rupee breaches 91-mark against US dollar for first time in intra-day trade

Microsoft commits USD 17.5 billion investment in India: CEO Satya Nadella

More videos

CBI books Anil Ambani's son, Reliance Home Finance Ltd. in Rs 228 crore bank fraud case

RBI raises FY26 GDP growth projection to 7.3 pc

RBI trims policy interest rate by 25bps to 5.25pc, loans to get cheaper

Rupee slumps to all-time low of 90.25 against US dollar in intra-day trade

Reliance completes merger of Star Television Productions with Jiostar

India to lead emerging market growth with 7pc GDP rise in 2025: Moody’s

Nifty hits record high after 14 months; Sensex nears all-time peak

Reliance stops Russian oil use at its only-for-export refinery to comply with EU sanctions

ED attaches fresh assets worth over Rs 1,400 cr in case against Anil Ambani's Reliance Group

India signs one-year deal to import 2.2 million tonnes of LPG from US