


Highlights
- Dr Reddy's stock shows short-term bullish momentum
- ICICI Bank stable with neutral RSI zone
- Power Grid shows bearish signs near resistance
Latest news

Middle East war: US counterterrorism official resigns, says 'war started under Israel's pressure'

India 'unequivocally' condemns Pakistan's 'barbaric' airstrike on Kabul rehab centre

Iran 'negotiating' with FIFA over moving World Cup games to Mexico: embassy

Attempts underway on domestic, international fronts to address LPG shortage: Centre tells HC

Israel claims killing of Iran’s security chief Ali Larijani amid escalating Middle East war

Mamata vs Suvendu: Bhabanipur set for ‘mother of all electoral battles’ in repeat of 2021 rivalry
 to Modernise Patient & Donor Engagement")
St. Stephen's Hospital Announces Two-Year Digital Transformation Partnership with Green Bamboo Pictures (GBP) to Modernise Patient & Donor Engagement

Dr. Abhishek Manu Singhvi Calls for Radical Reform to Address the Pendency Crisis
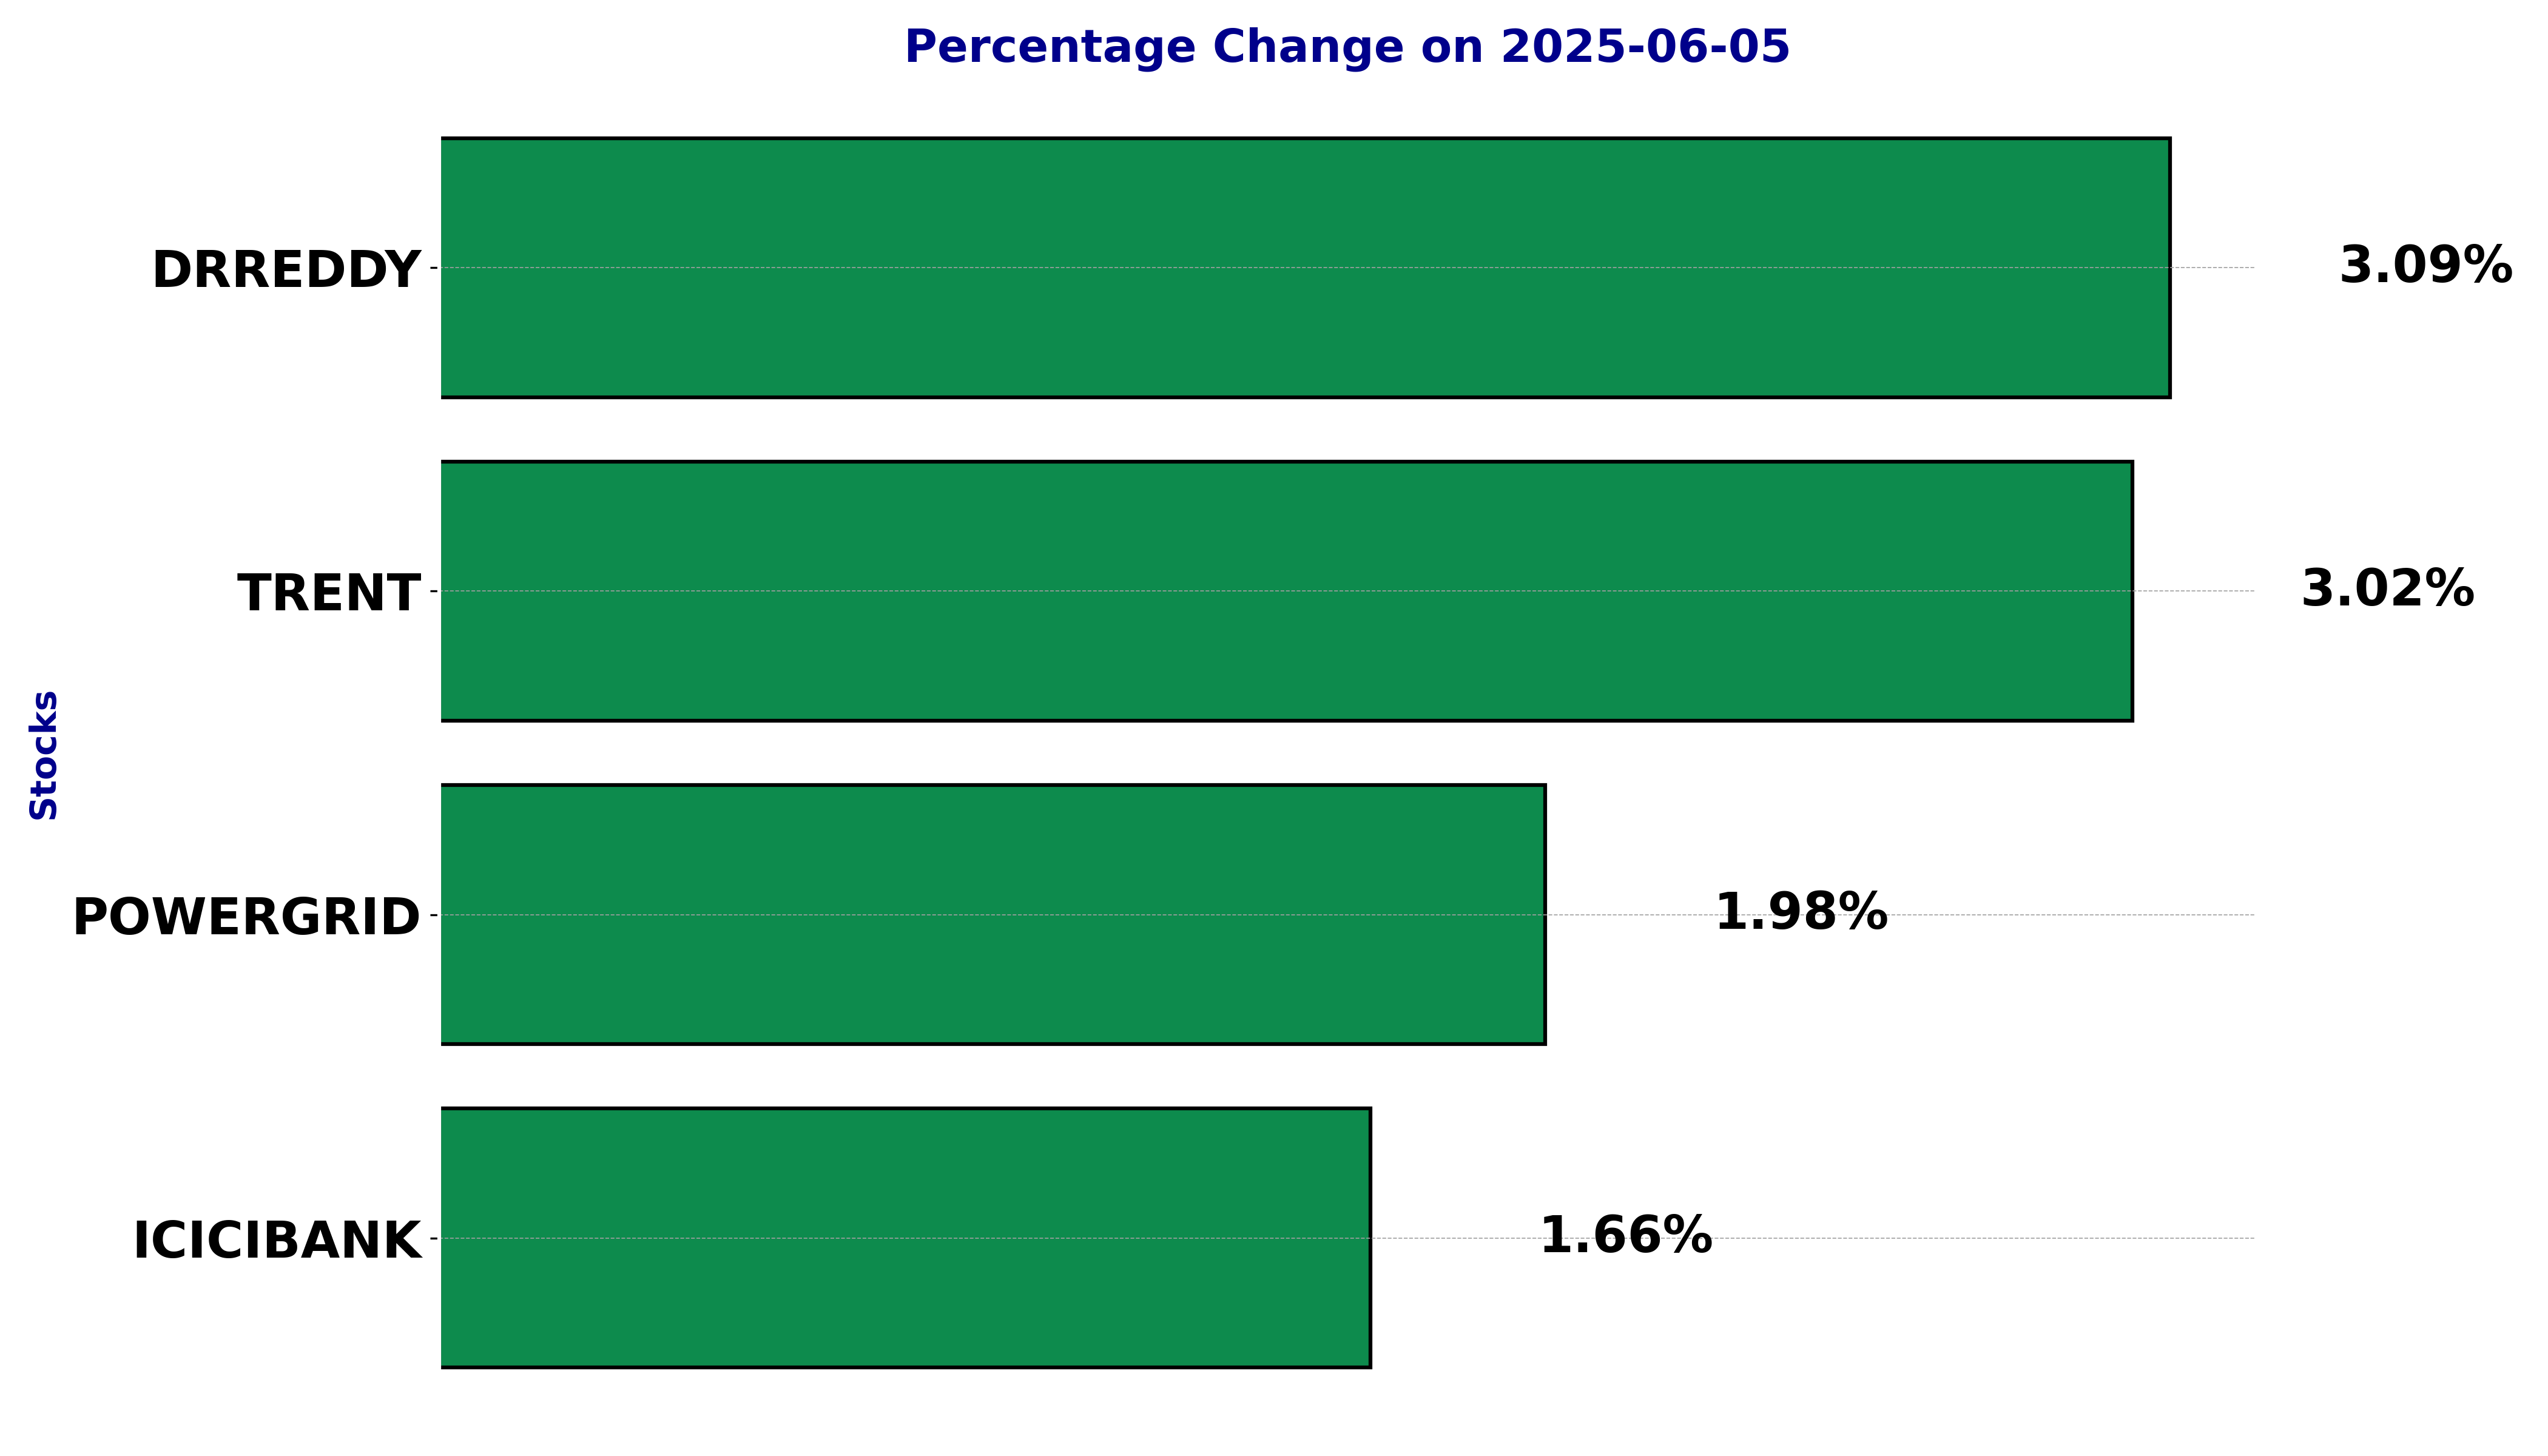
Top 5 Nifty 50 gainers today – June 05, 2025: Biggest stock moves


In this article, we will explore the technical indicators of some of the high-performing stocks on the Indian stock market, including DRREDDY, ICICIBANK, POWERGRID, and TRENT.
By looking at these stocks through the lens of key technical factors, we aim to better understand their price movements, trends, and potential future performance.
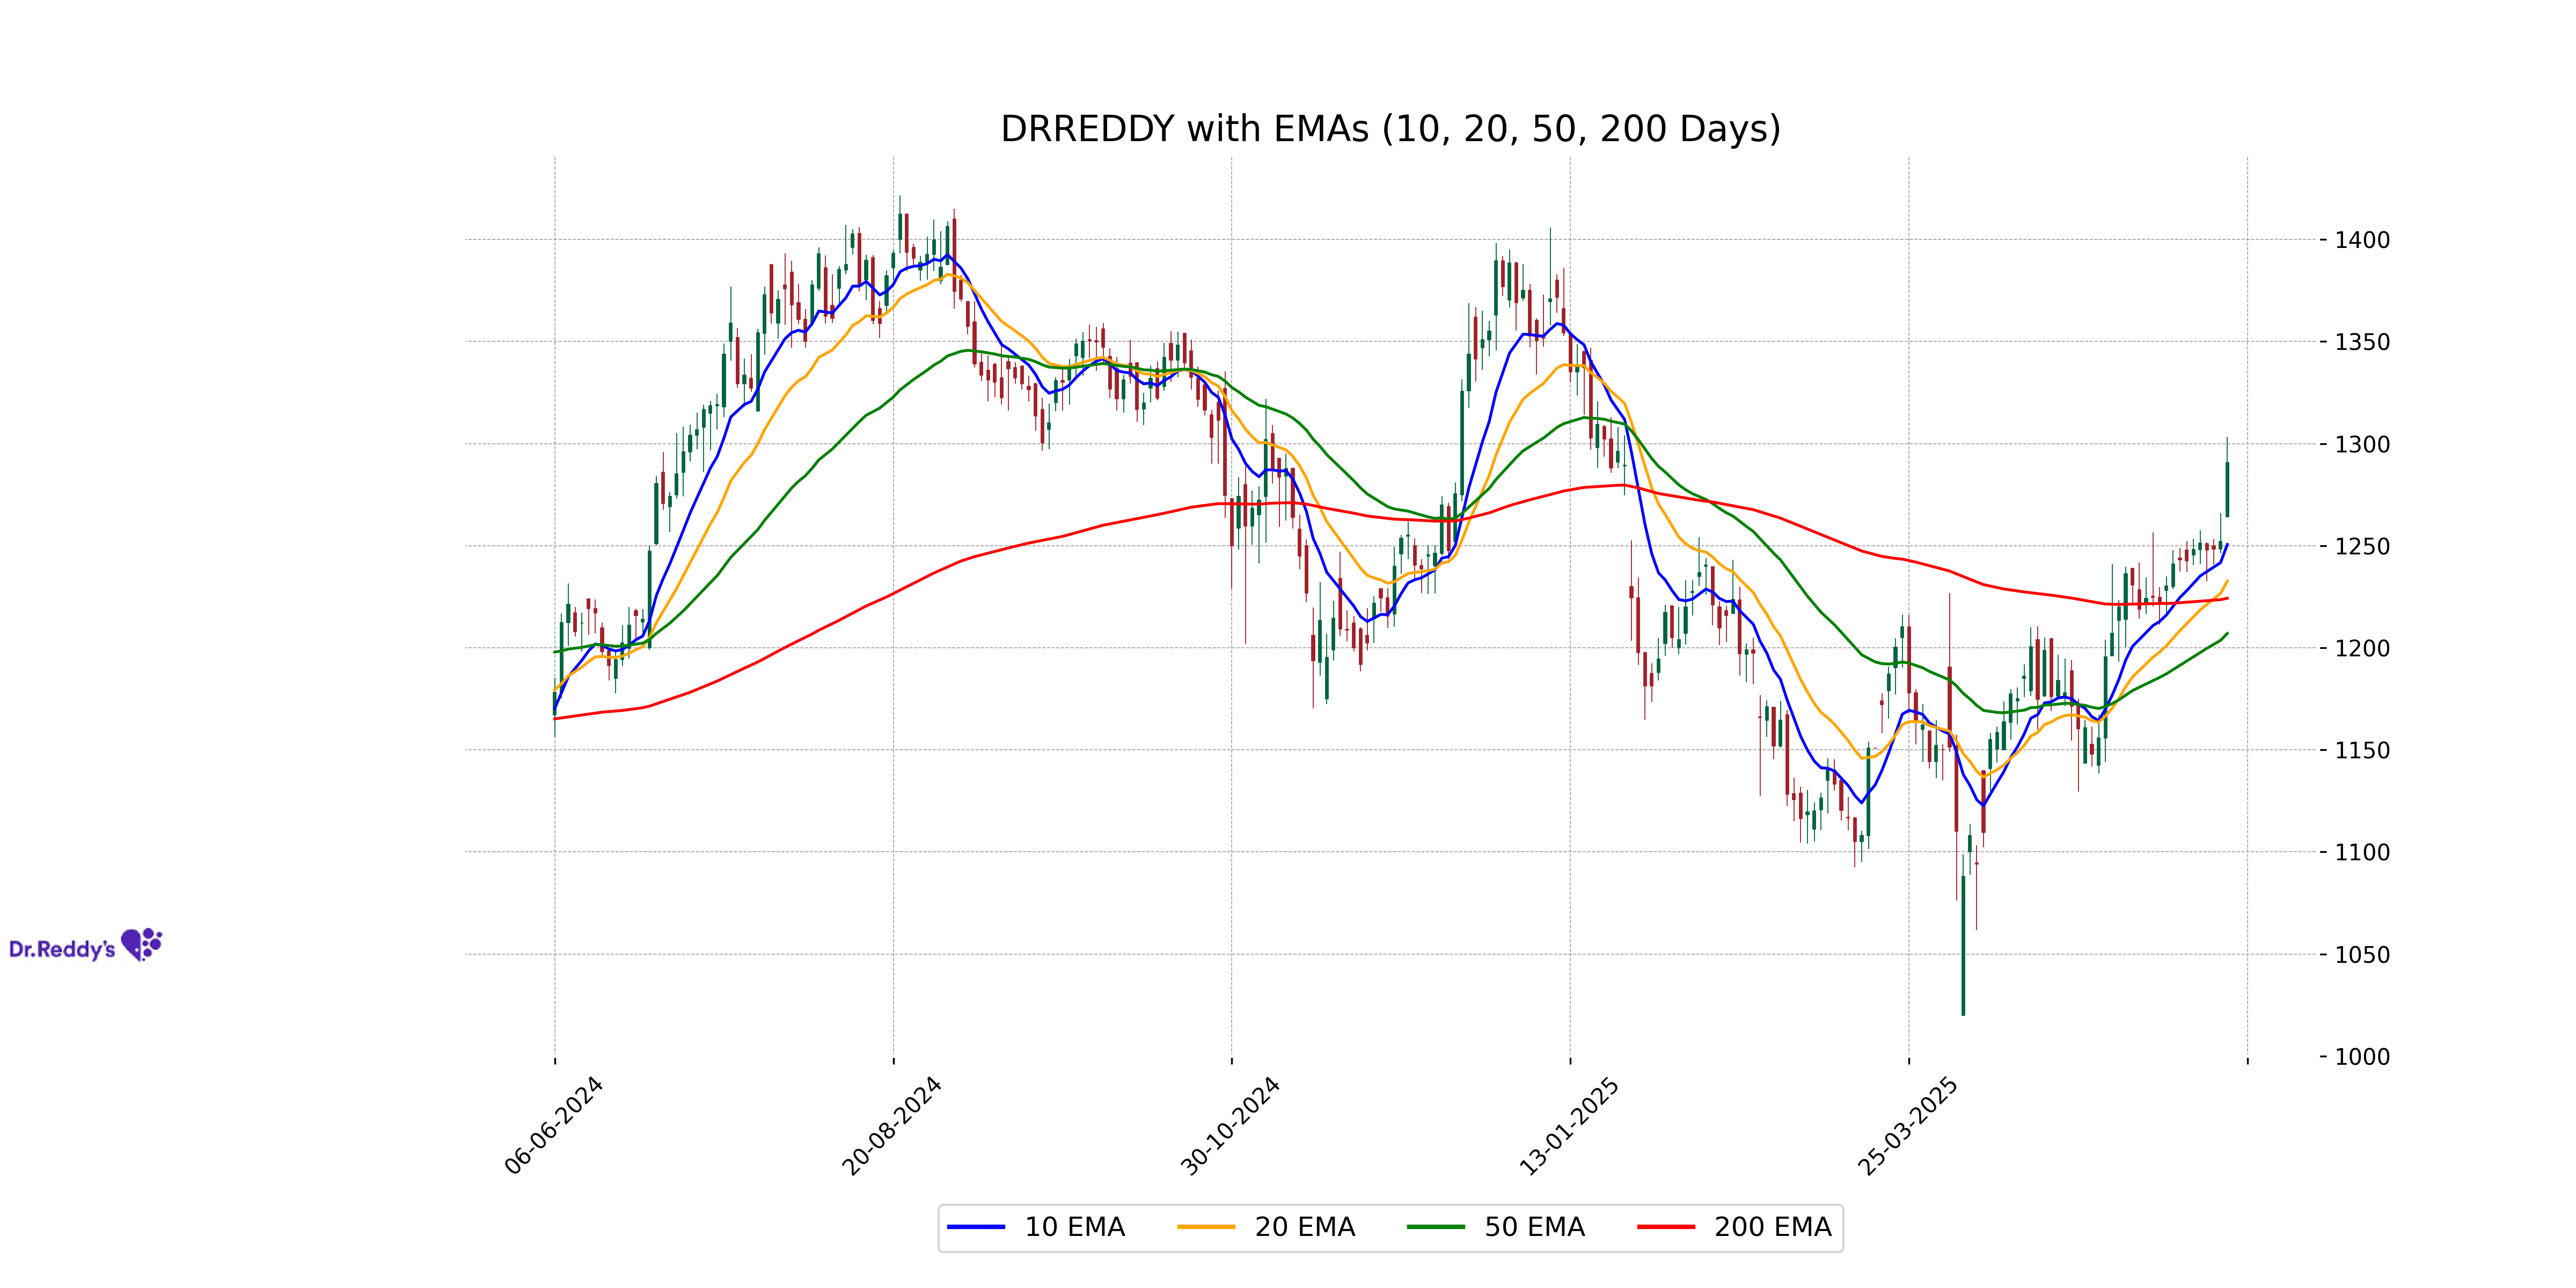
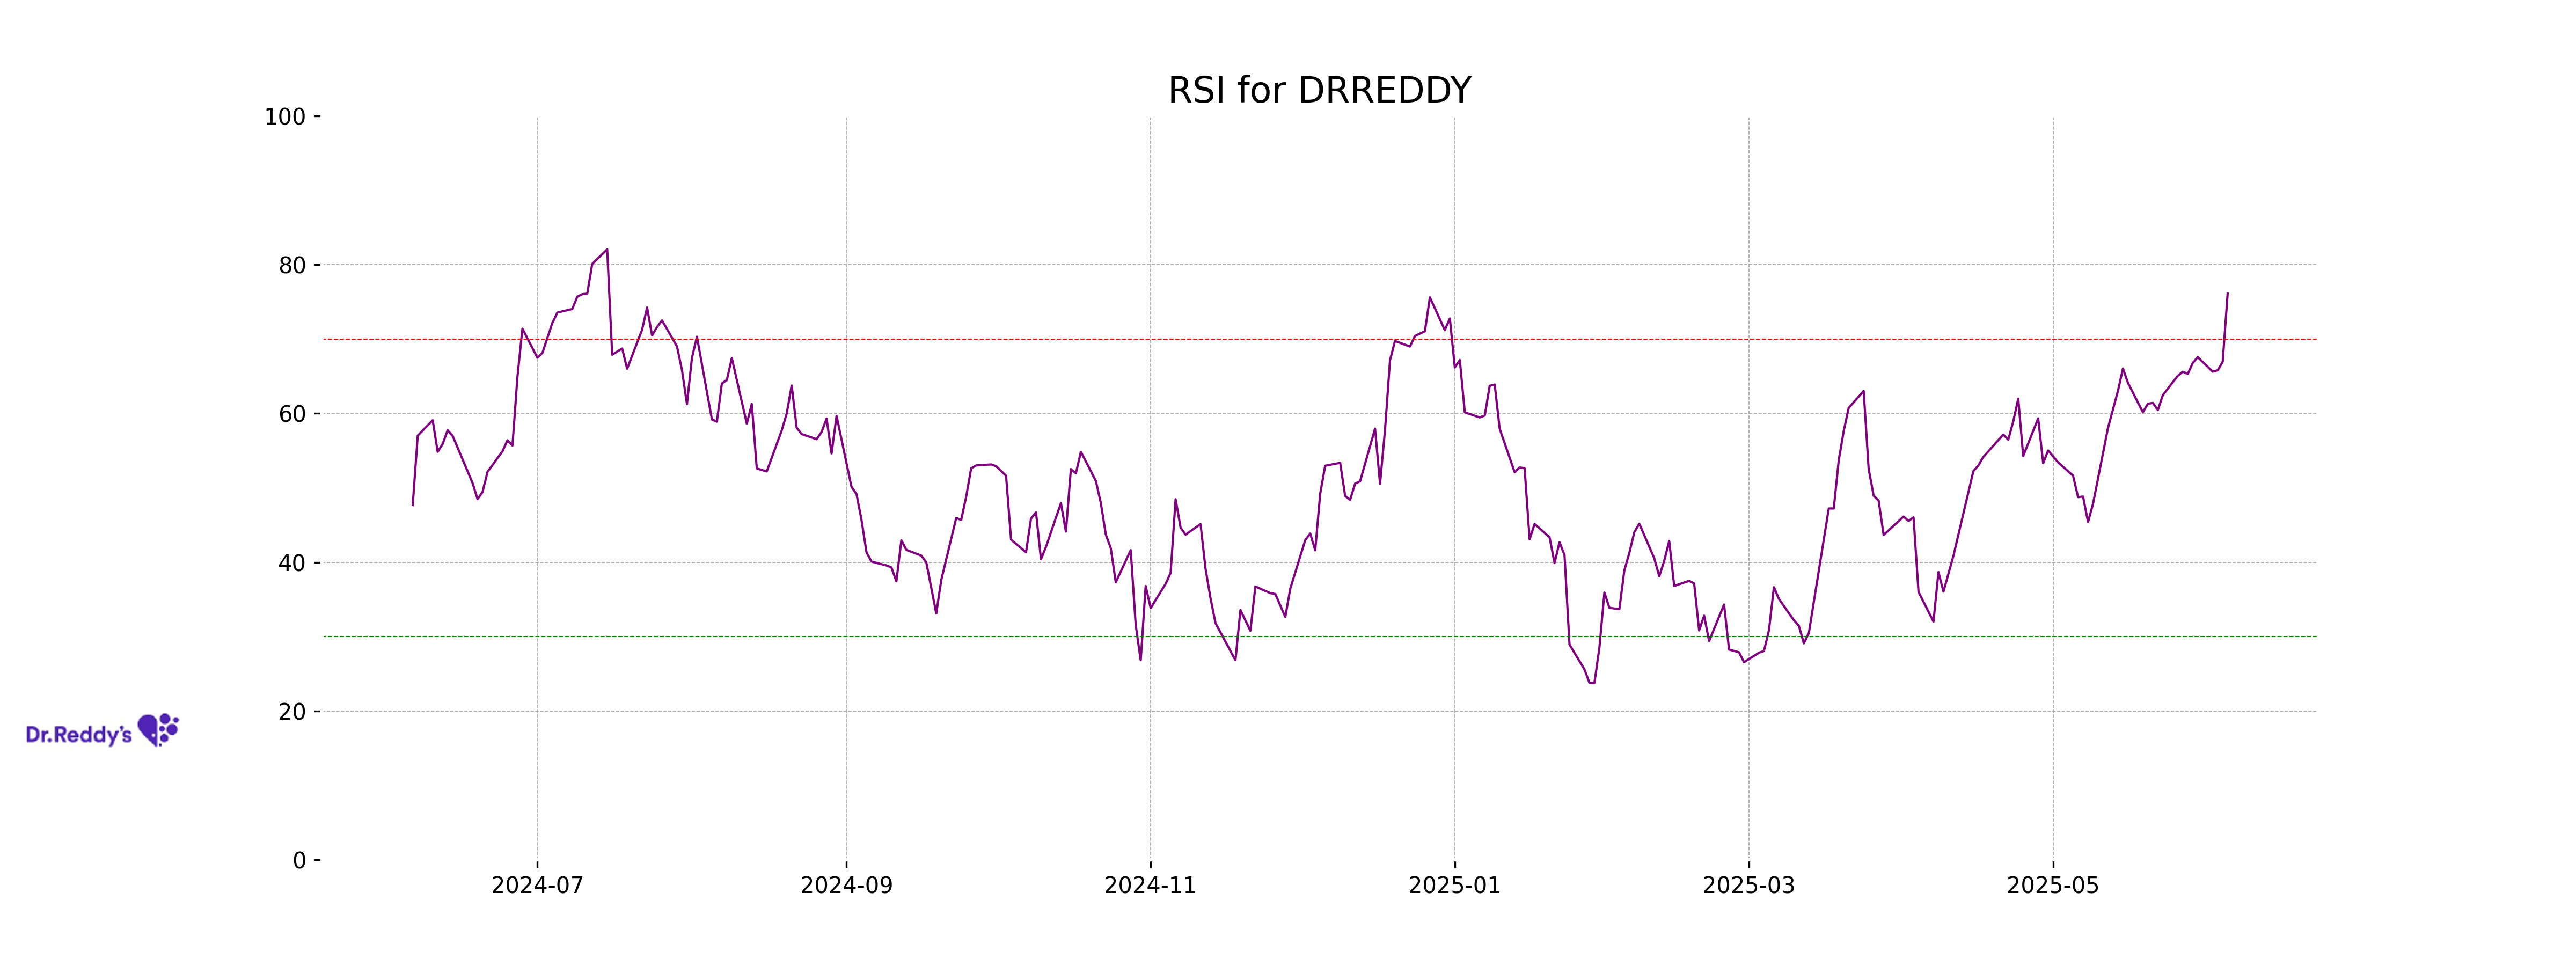
Analysis for Dr Reddys Labs - June 05, 2025
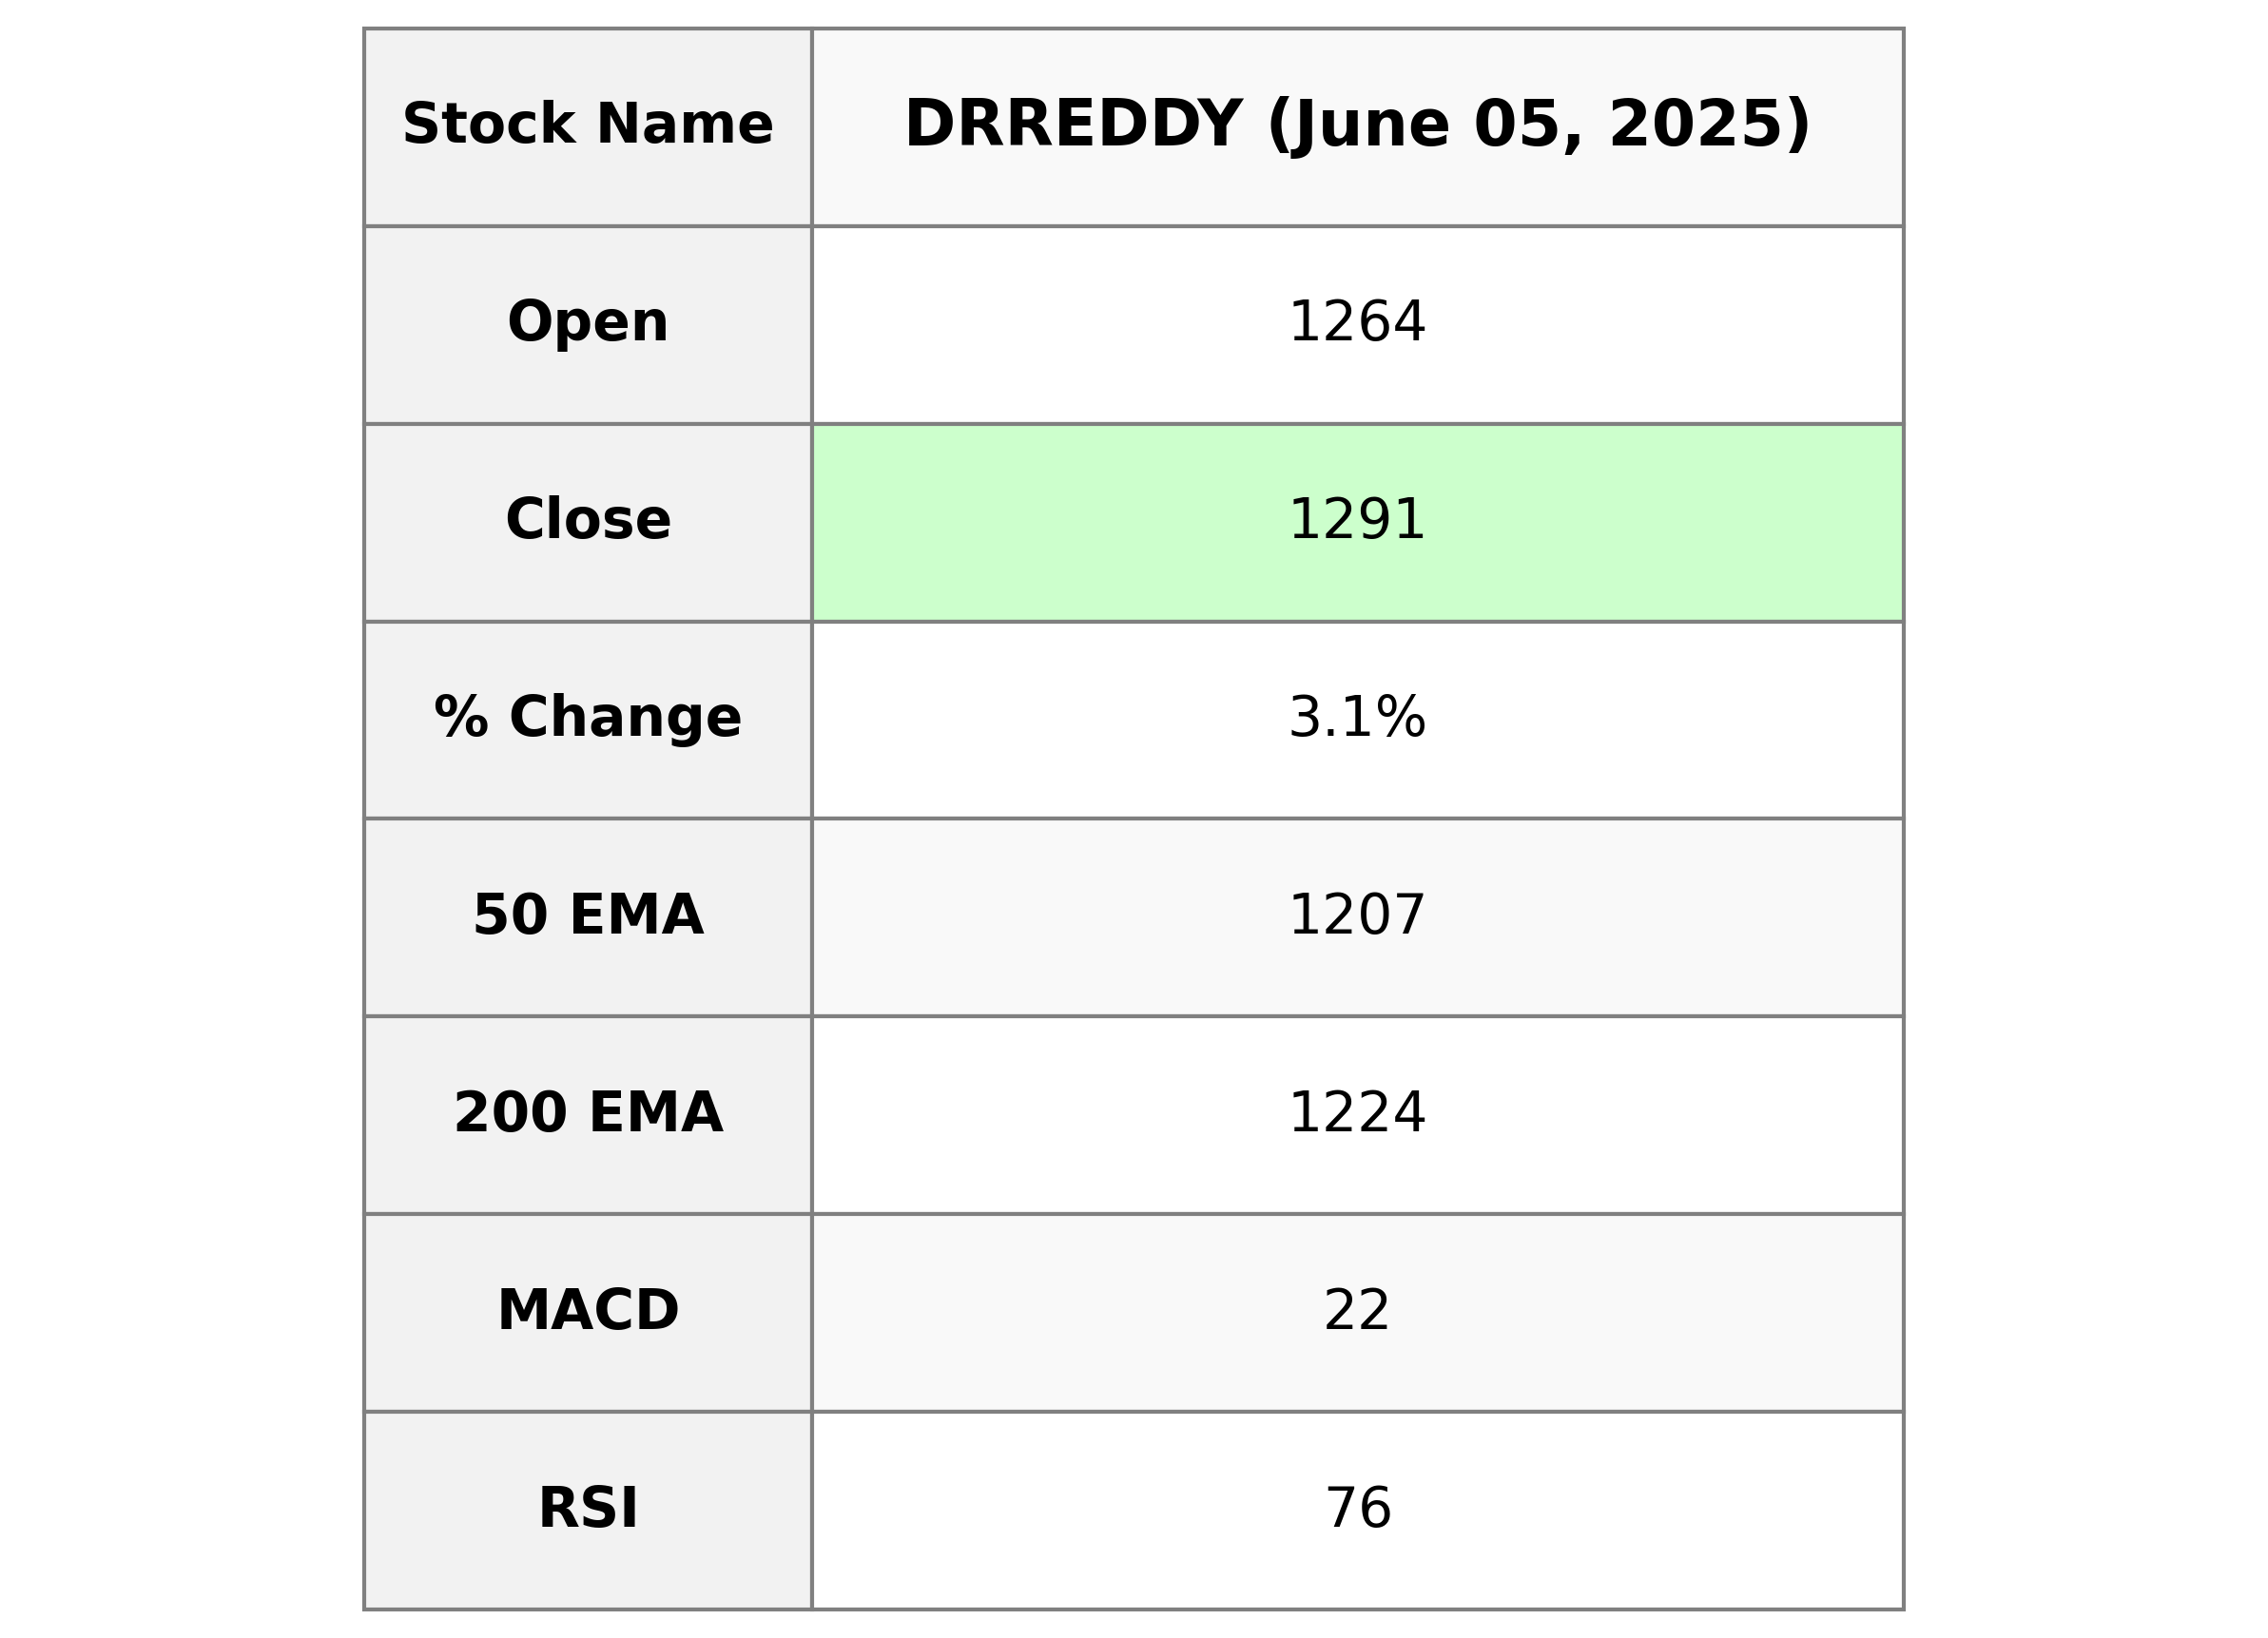
Dr Reddy's Laboratories opened at 1264.20 and closed at 1290.60, marking a 3.09% increase from its previous close of 1251.90. The stock exhibited a significant trading volume of 3,834,429 shares, and its market cap stands at 1,074,072,125,440. Notably, the RSI is at 76.12, indicating a possible overbought condition. With a PE ratio of 19.06 and an EPS of 67.73, Dr Reddy's is positioned within the Healthcare sector, specifically in the Drug Manufacturers - Specialty & Generic industry in India.
Relationship with Key Moving Averages
Dr Reddy's Laboratories is currently trading above its 50-day EMA (1207.01) and 200-day EMA (1224.21), indicating a positive trend. The stock is also above its 10-day EMA (1250.58) and 20-day EMA (1232.68), suggesting short-term bullish momentum.
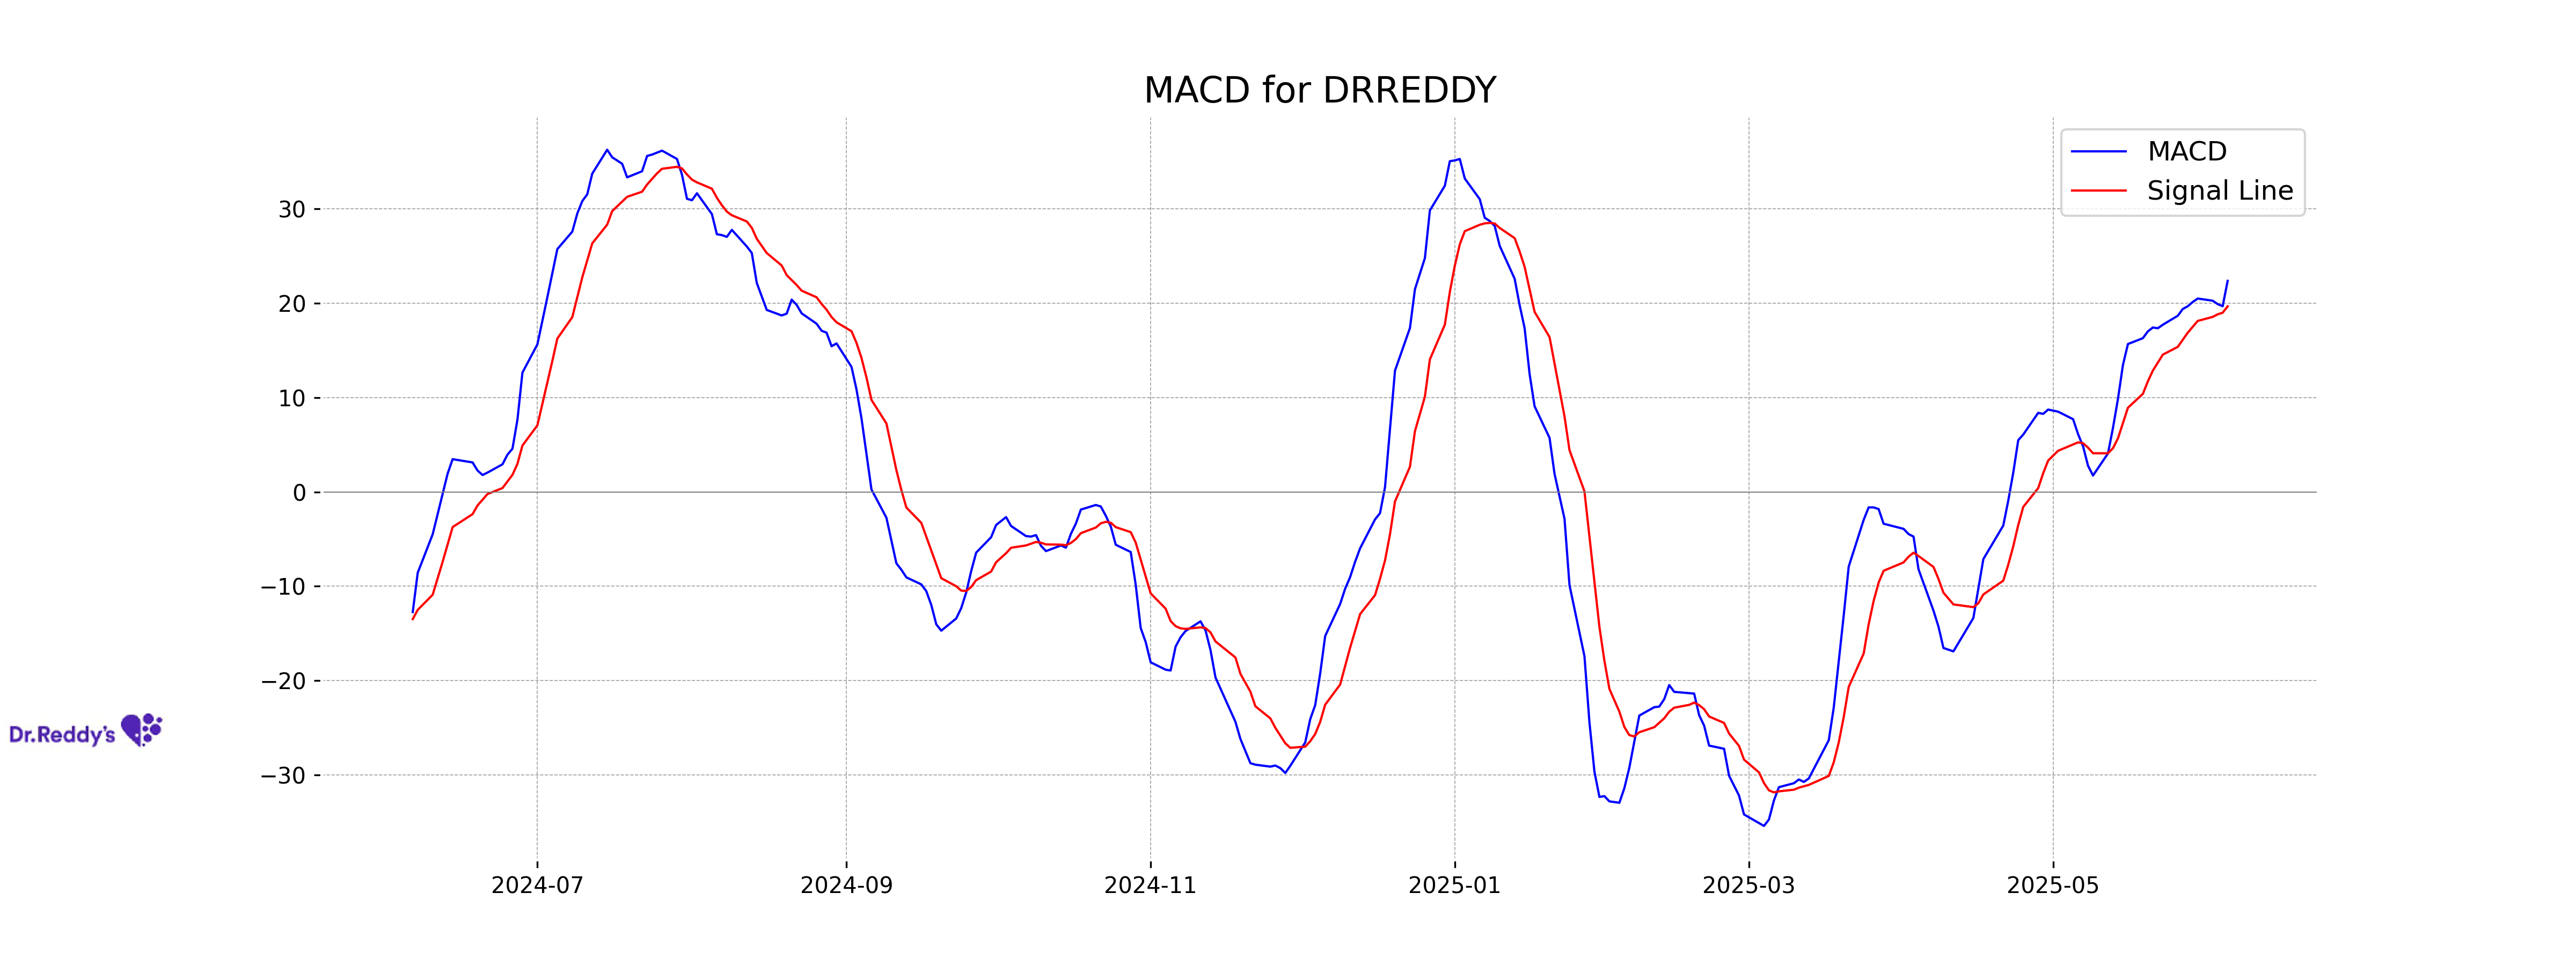
Moving Averages Trend (MACD)
The MACD (Moving Average Convergence Divergence) for Dr Reddys Labs is currently at 22.36, with a MACD signal of 19.66. This positive difference indicates a bullish trend, suggesting that the stock price may continue to rise in the near term.
RSI Analysis
The RSI for Dr Reddys Labs is at 76.12, indicating that the stock is in overbought territory. This suggests that the stock may be overvalued in the short term and could be due for a price correction or pullback. Caution is advised for new buyers at this level.
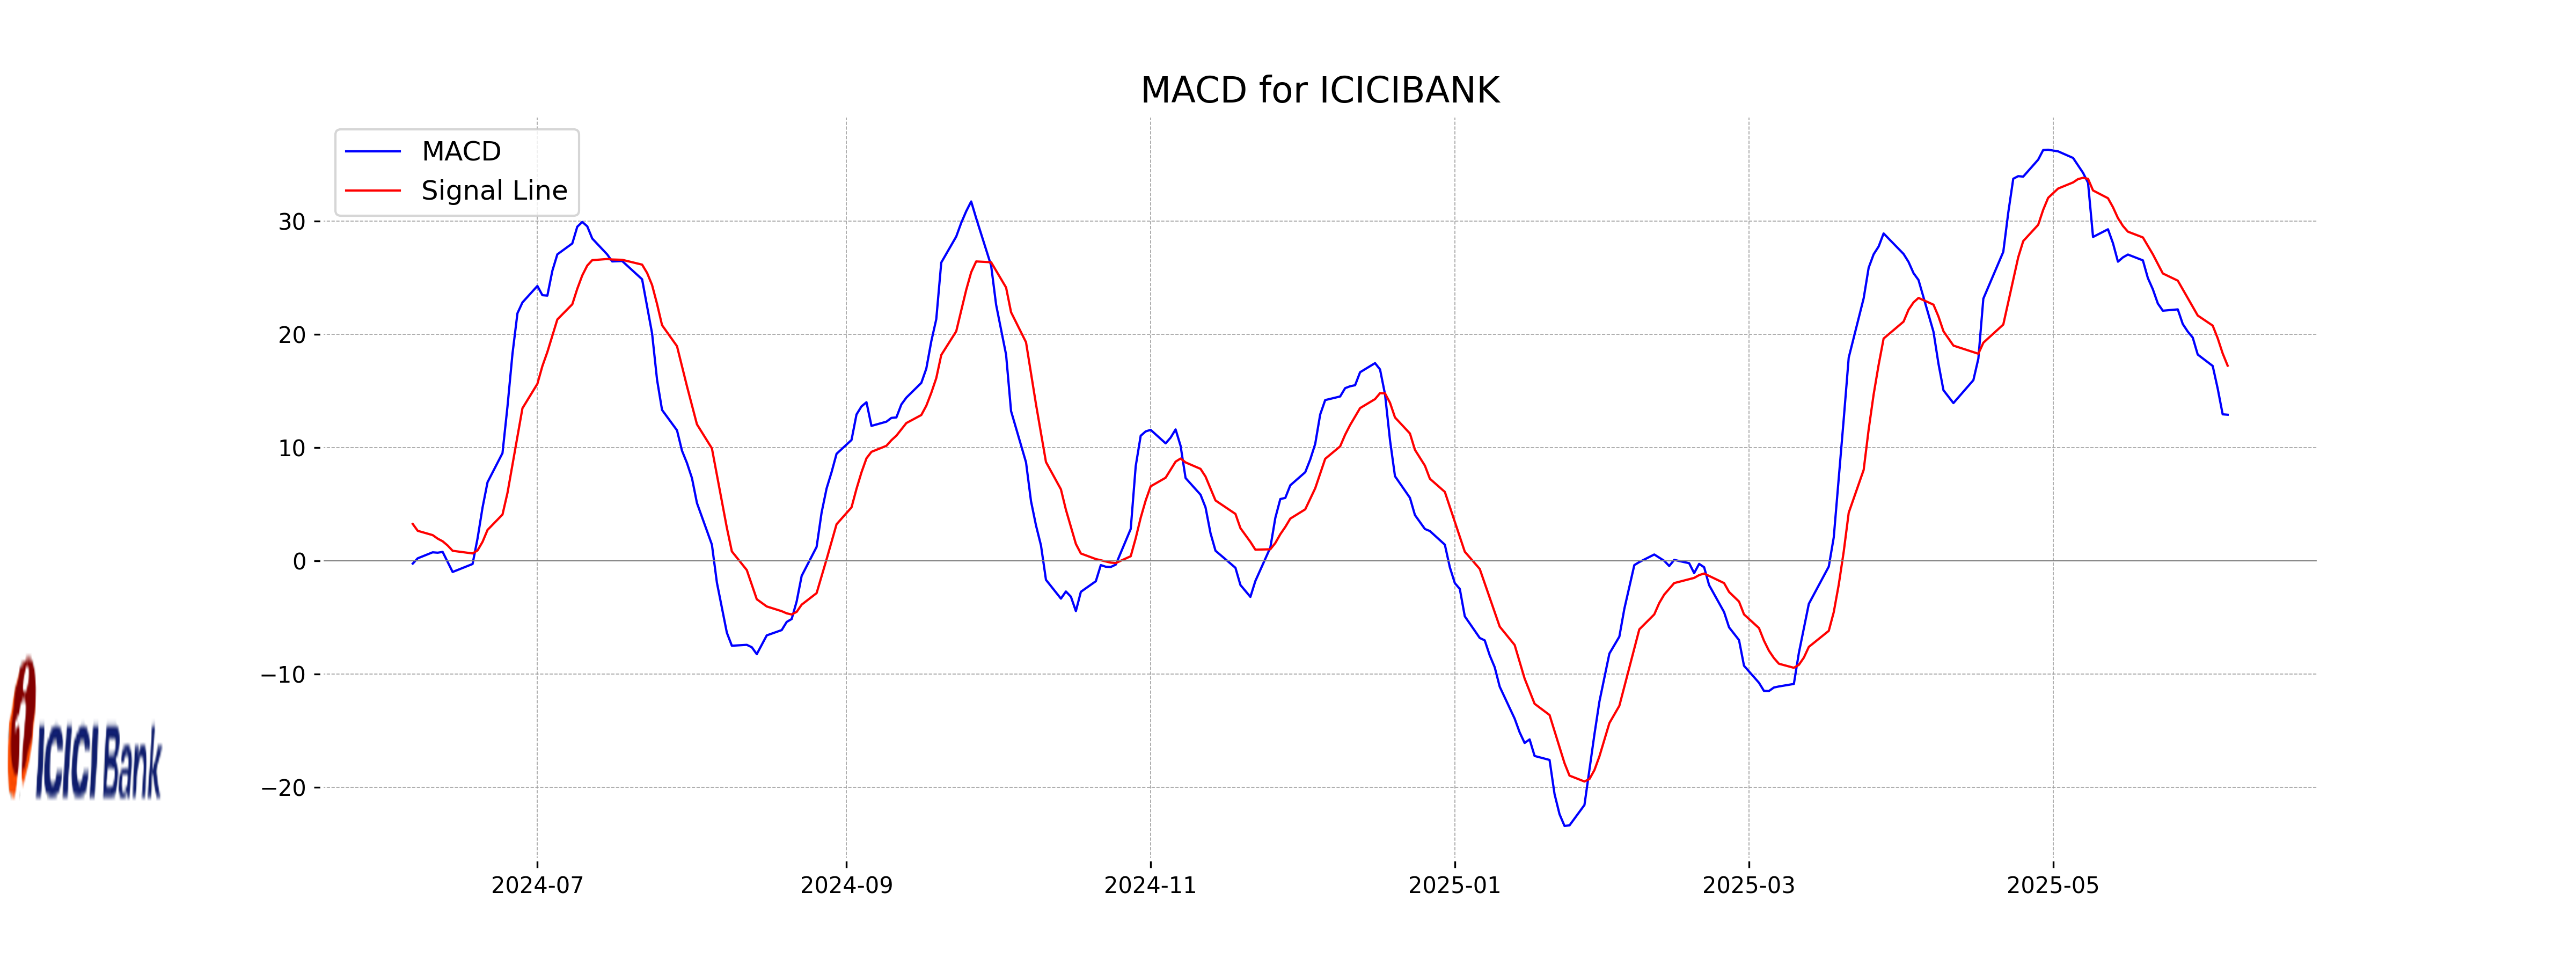
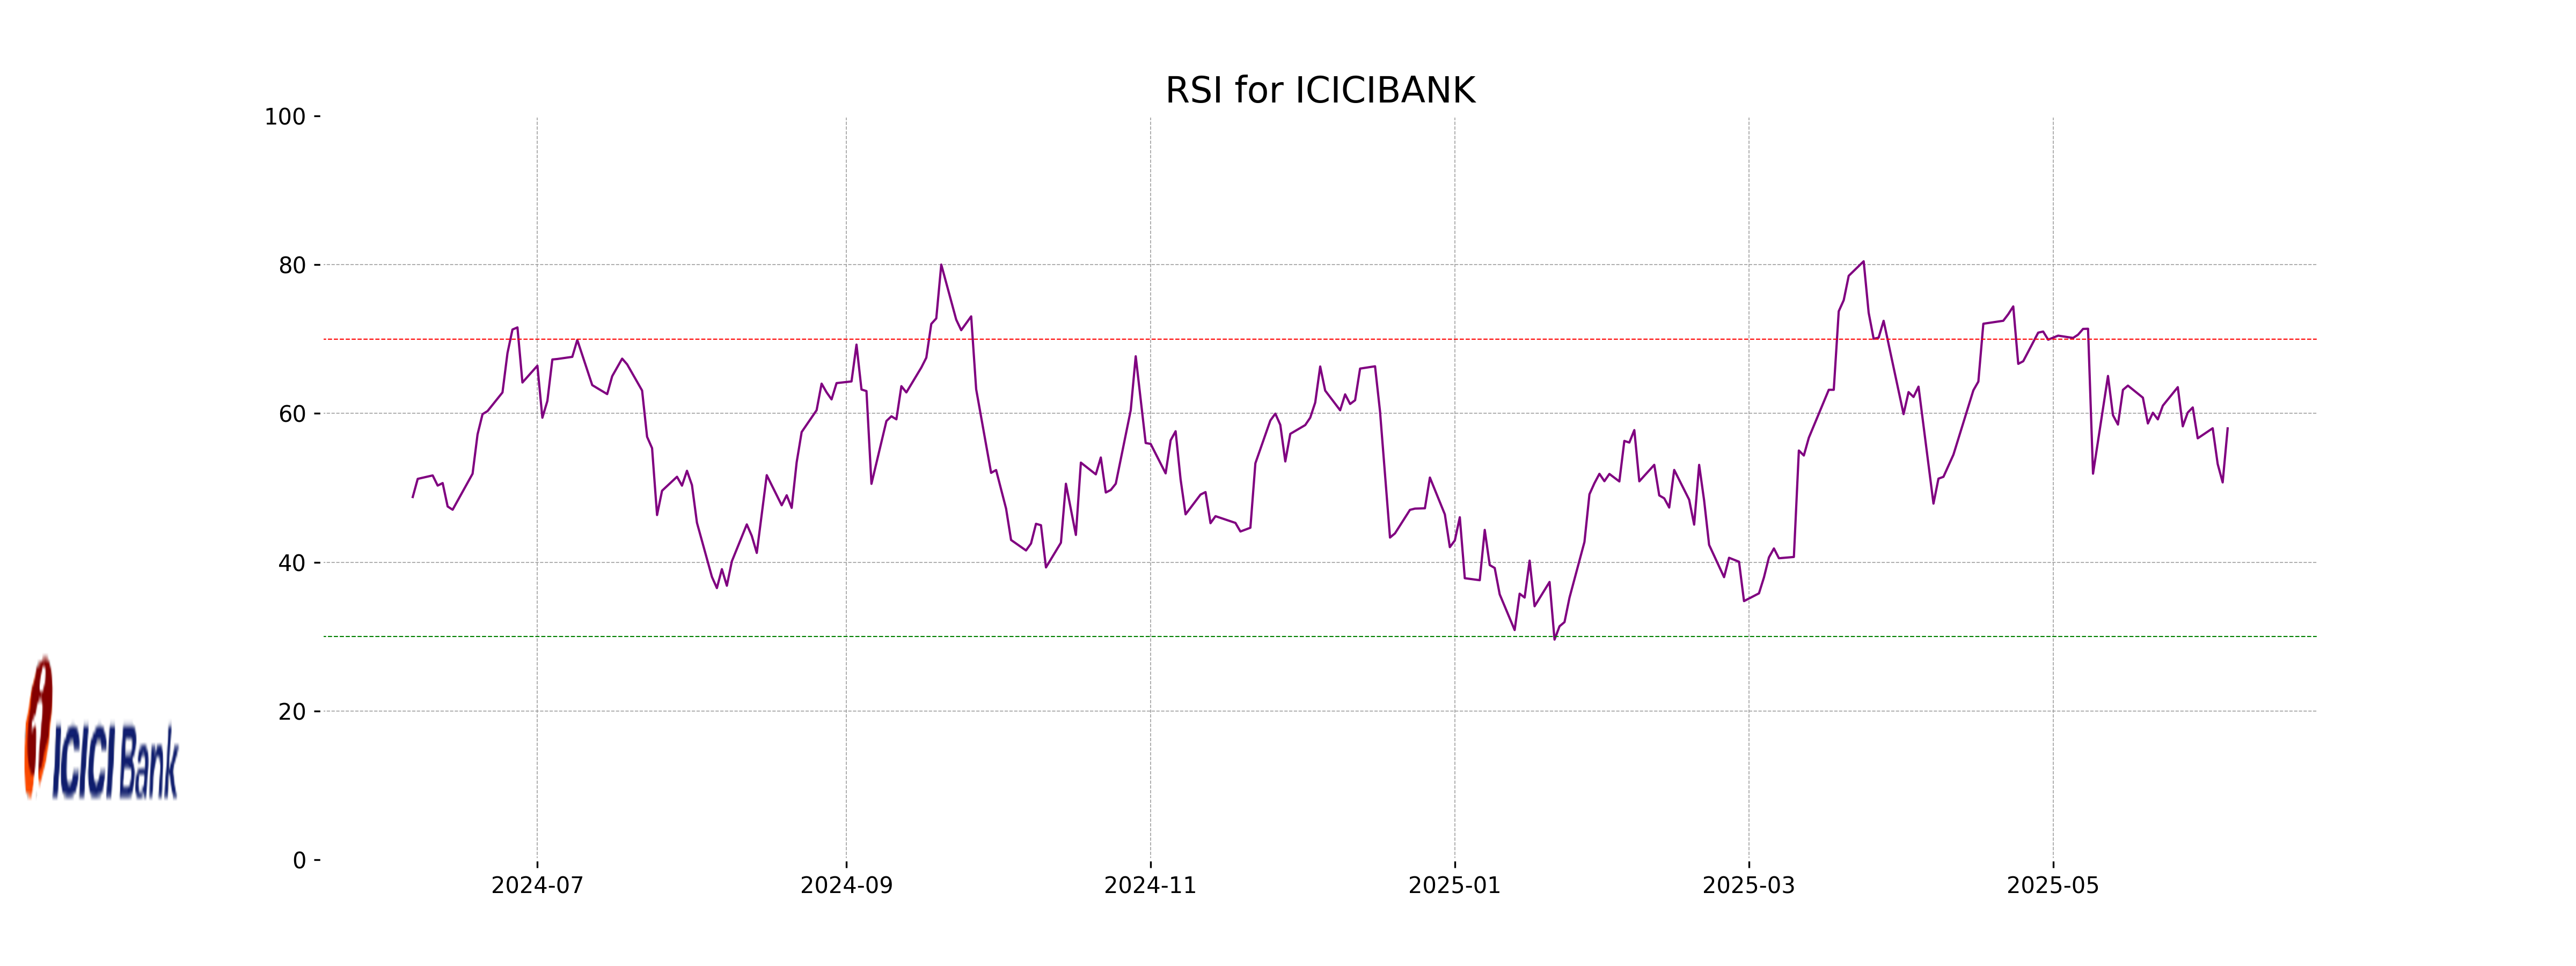
Analysis for ICICI Bank - June 05, 2025
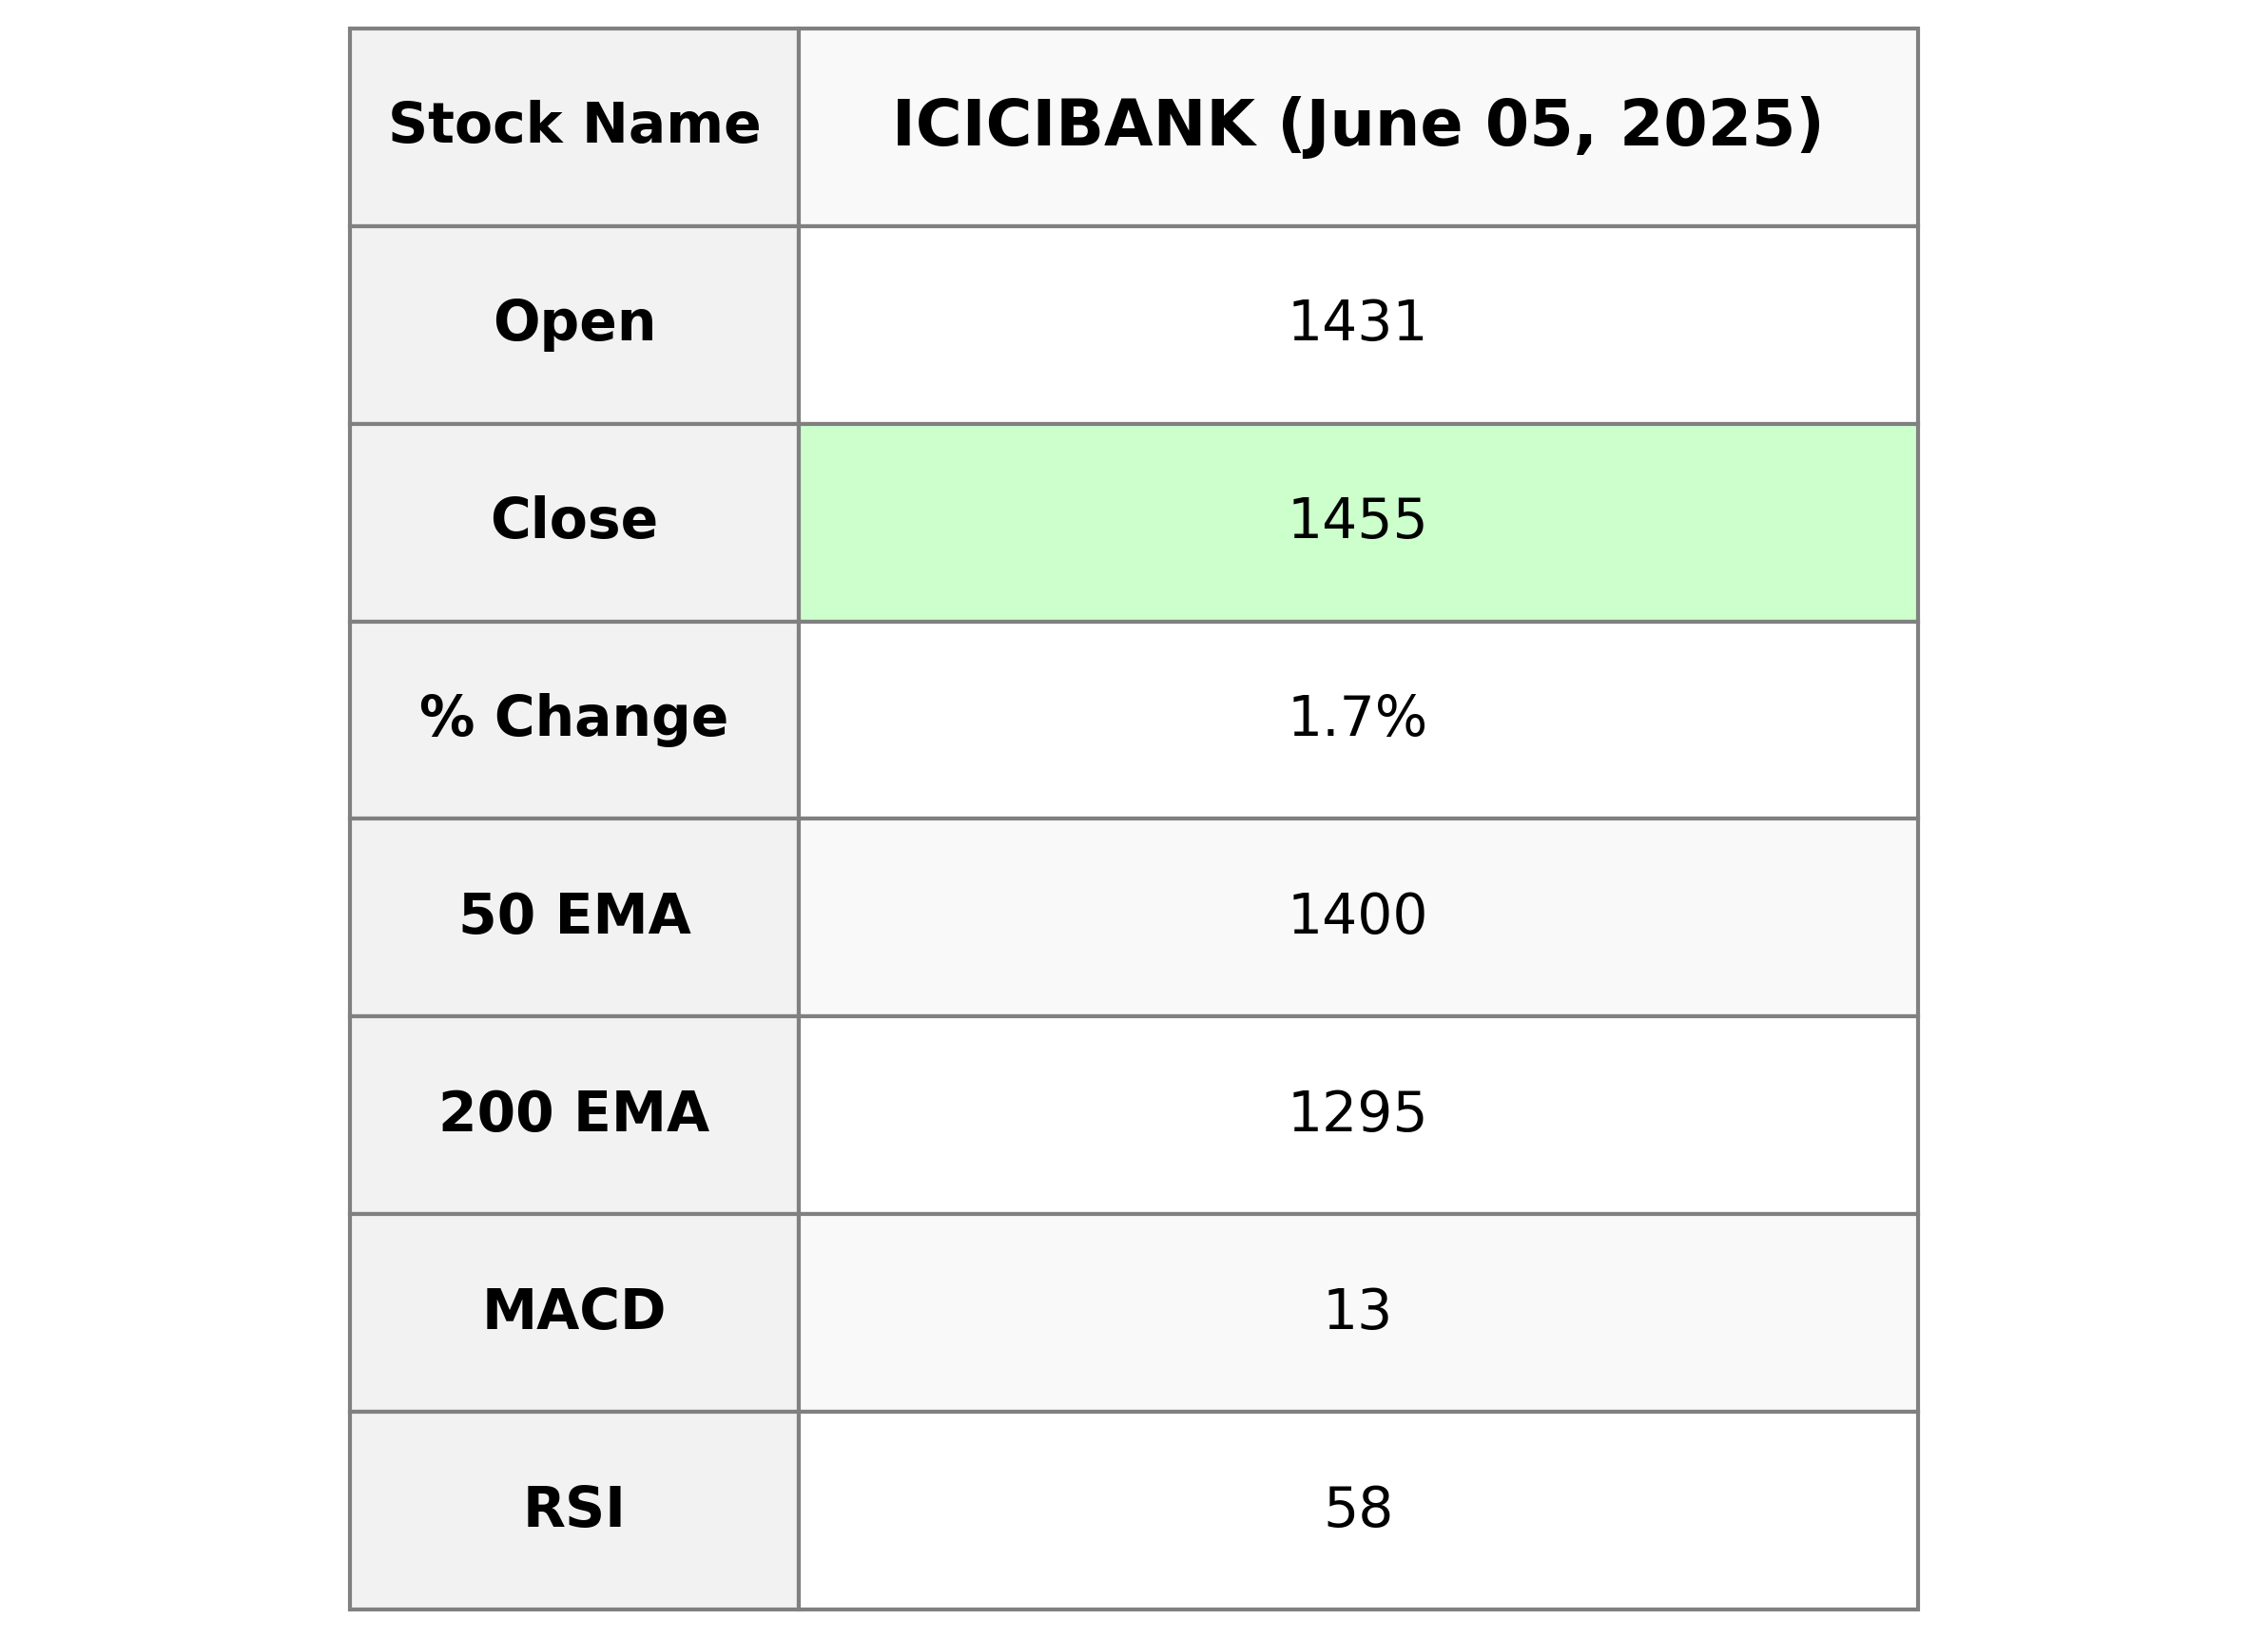
ICICI Bank experienced a positive trading day, with its stock closing at 1454.80, marking an increase of 1.66% from the previous close of 1431.00. The stock traded with a volume of 11,385,186 shares and showed strong technical indicators with its 10 EMA at 1445.65 and RSI at 57.99, signaling moderate momentum. Additionally, the bank's market cap stood at 10.38 trillion INR, with a PE Ratio of 20.46, reflecting solid financial performance in the regional banking sector in India.
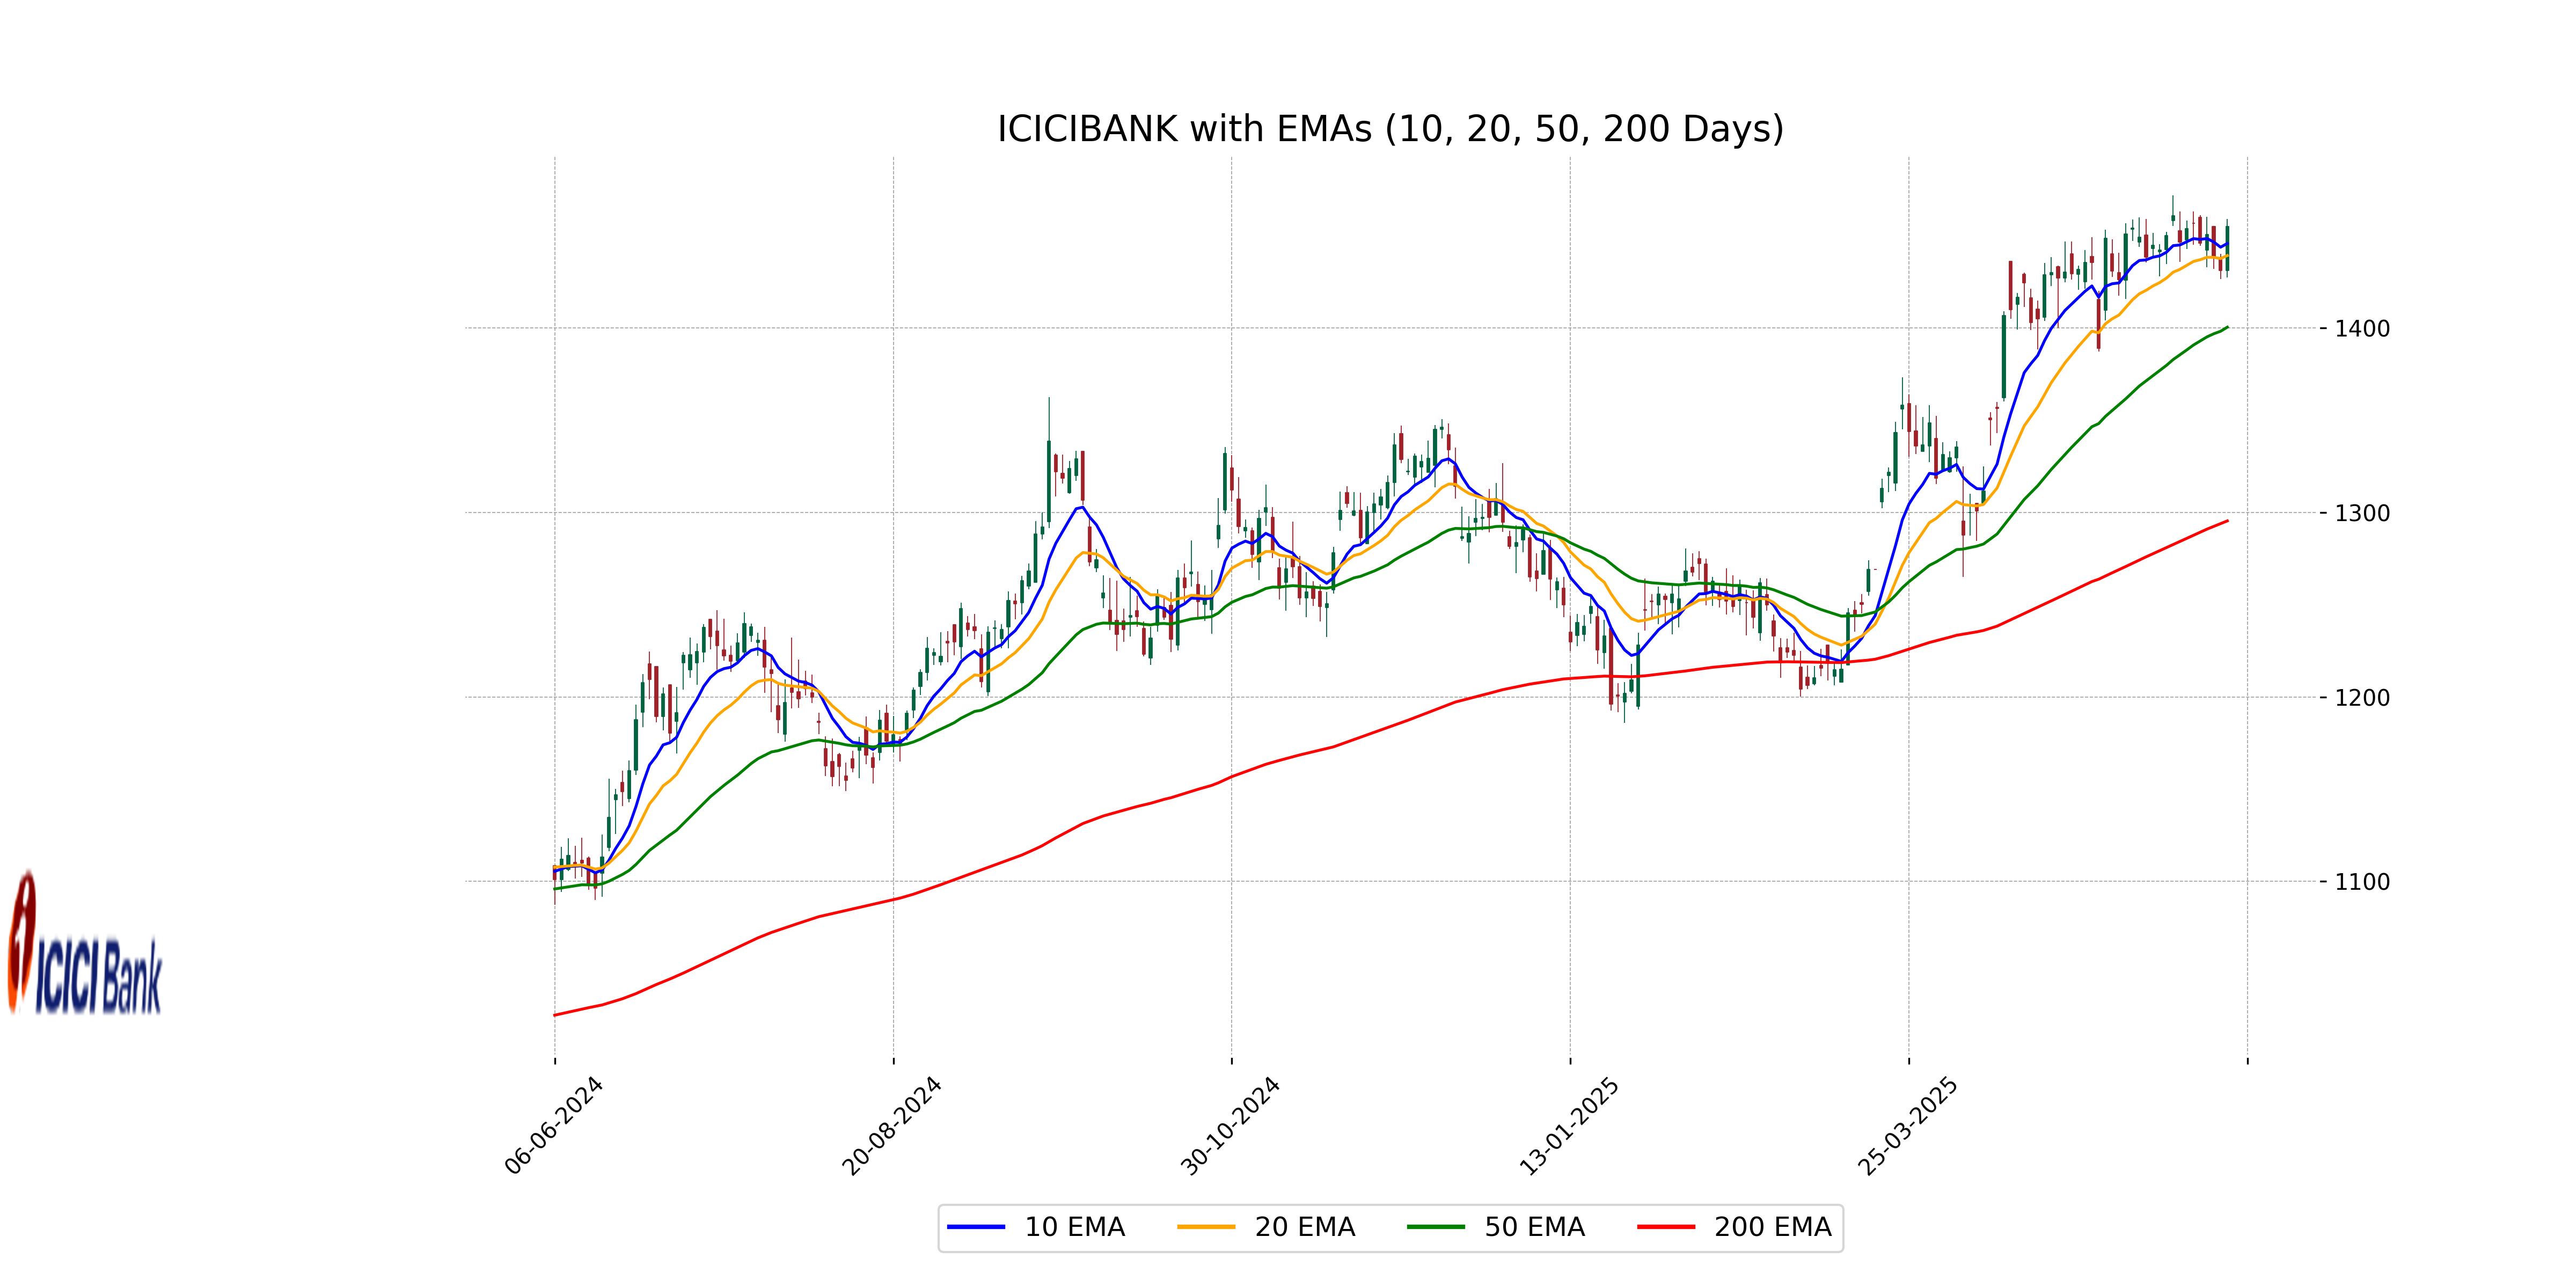
Relationship with Key Moving Averages
ICICI Bank is trading above its 50 EMA and 200 EMA, indicating a potential bullish trend. The stock's current price is also higher than its 10 EMA and 20 EMA, suggesting short-term strength.
Moving Averages Trend (MACD)
ICICI Bank's MACD value is 12.90 while the MACD Signal line is 17.23. This indicates the MACD is below the Signal line, which may suggest a bearish signal. However, being in the positive territory shows some underlying positive sentiment.
RSI Analysis
The Relative Strength Index (RSI) for ICICI Bank is 57.99, which suggests that the stock is in the neutral range. An RSI value between 30 and 70 typically indicates that the stock is neither overbought nor oversold, thus it might be considered stable without an immediate threat of significant price correction.
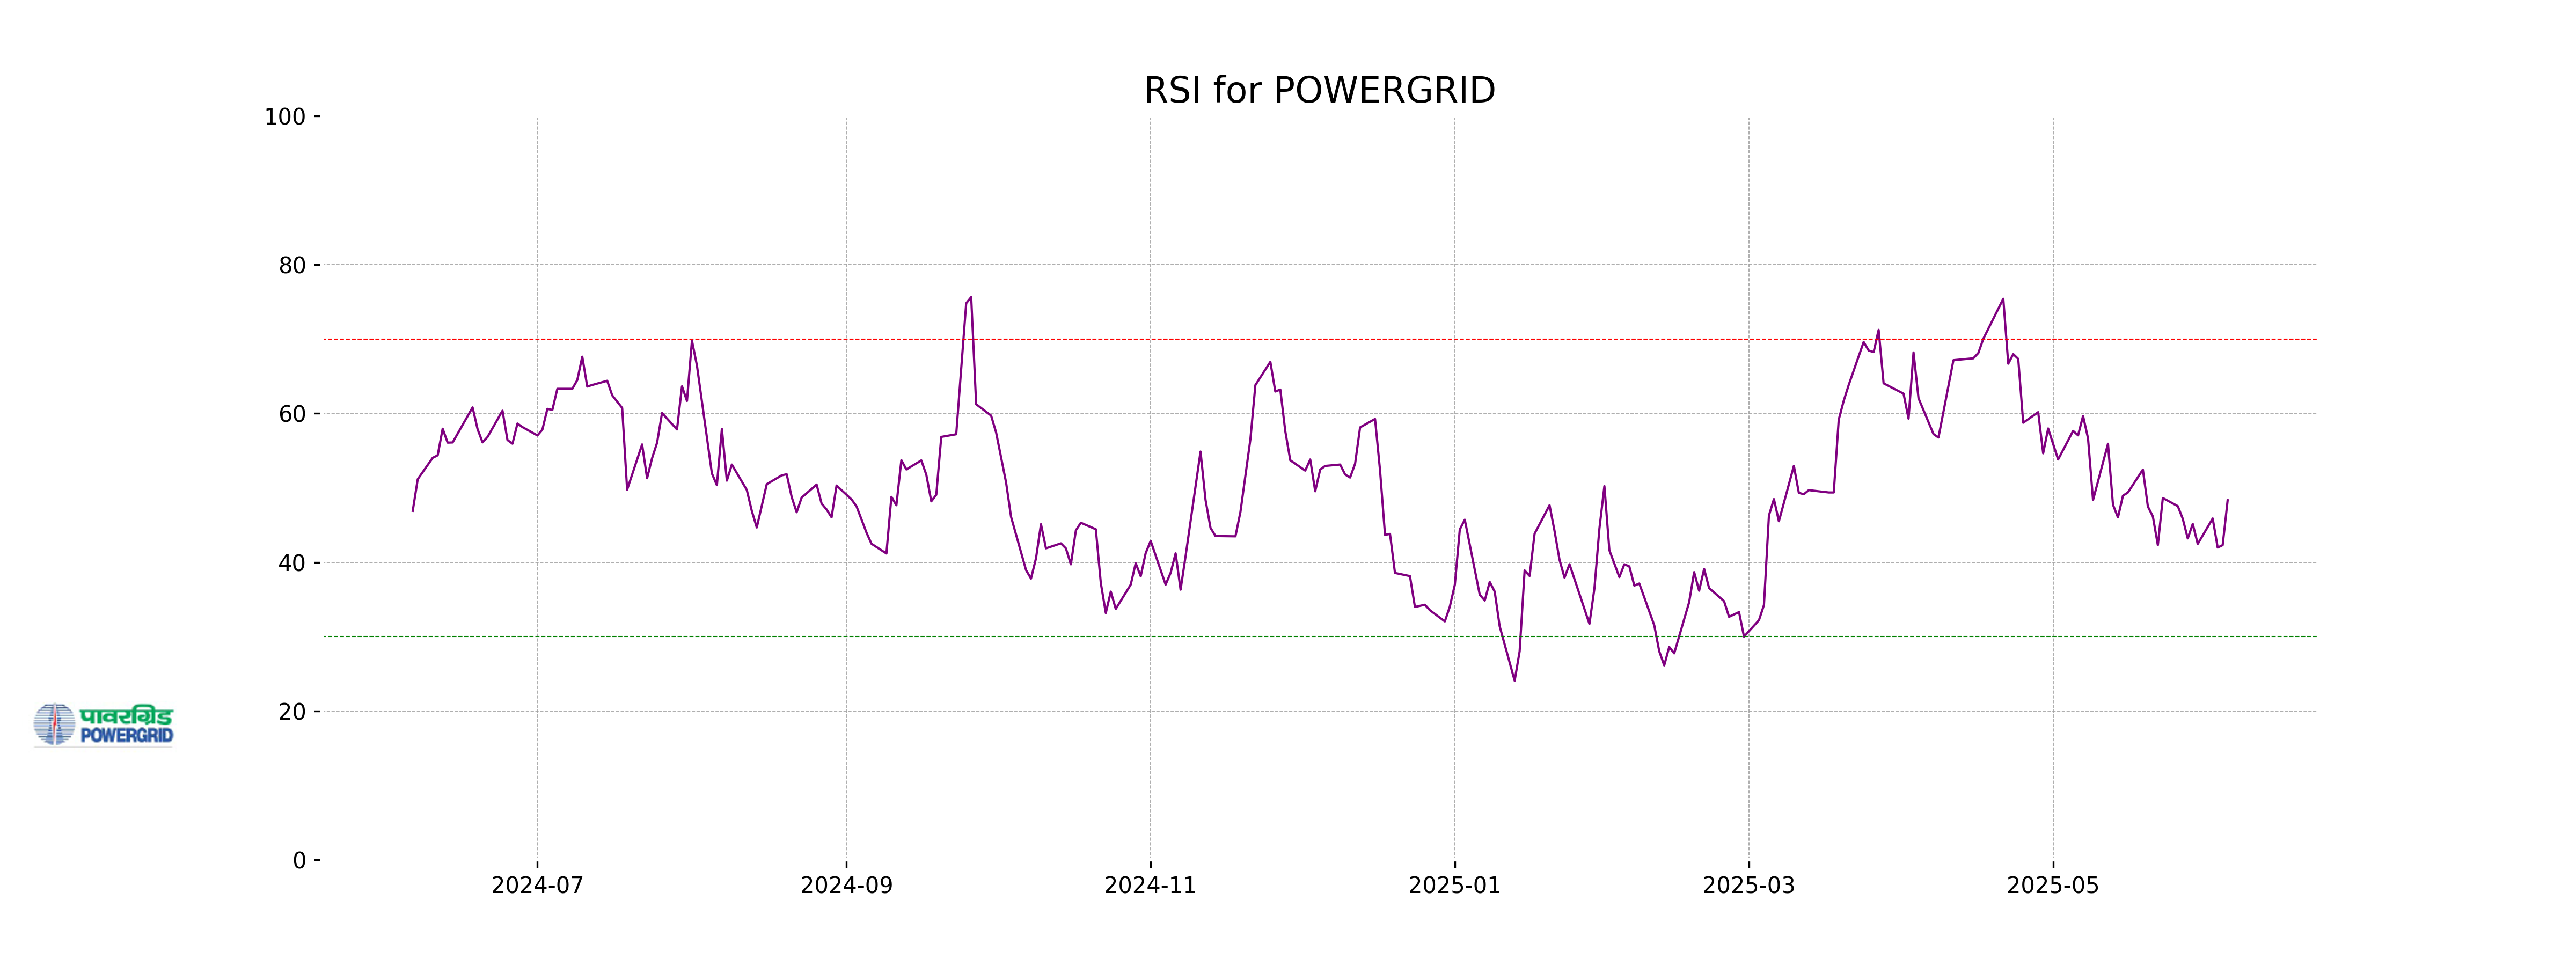
Analysis for Power Grid - June 05, 2025
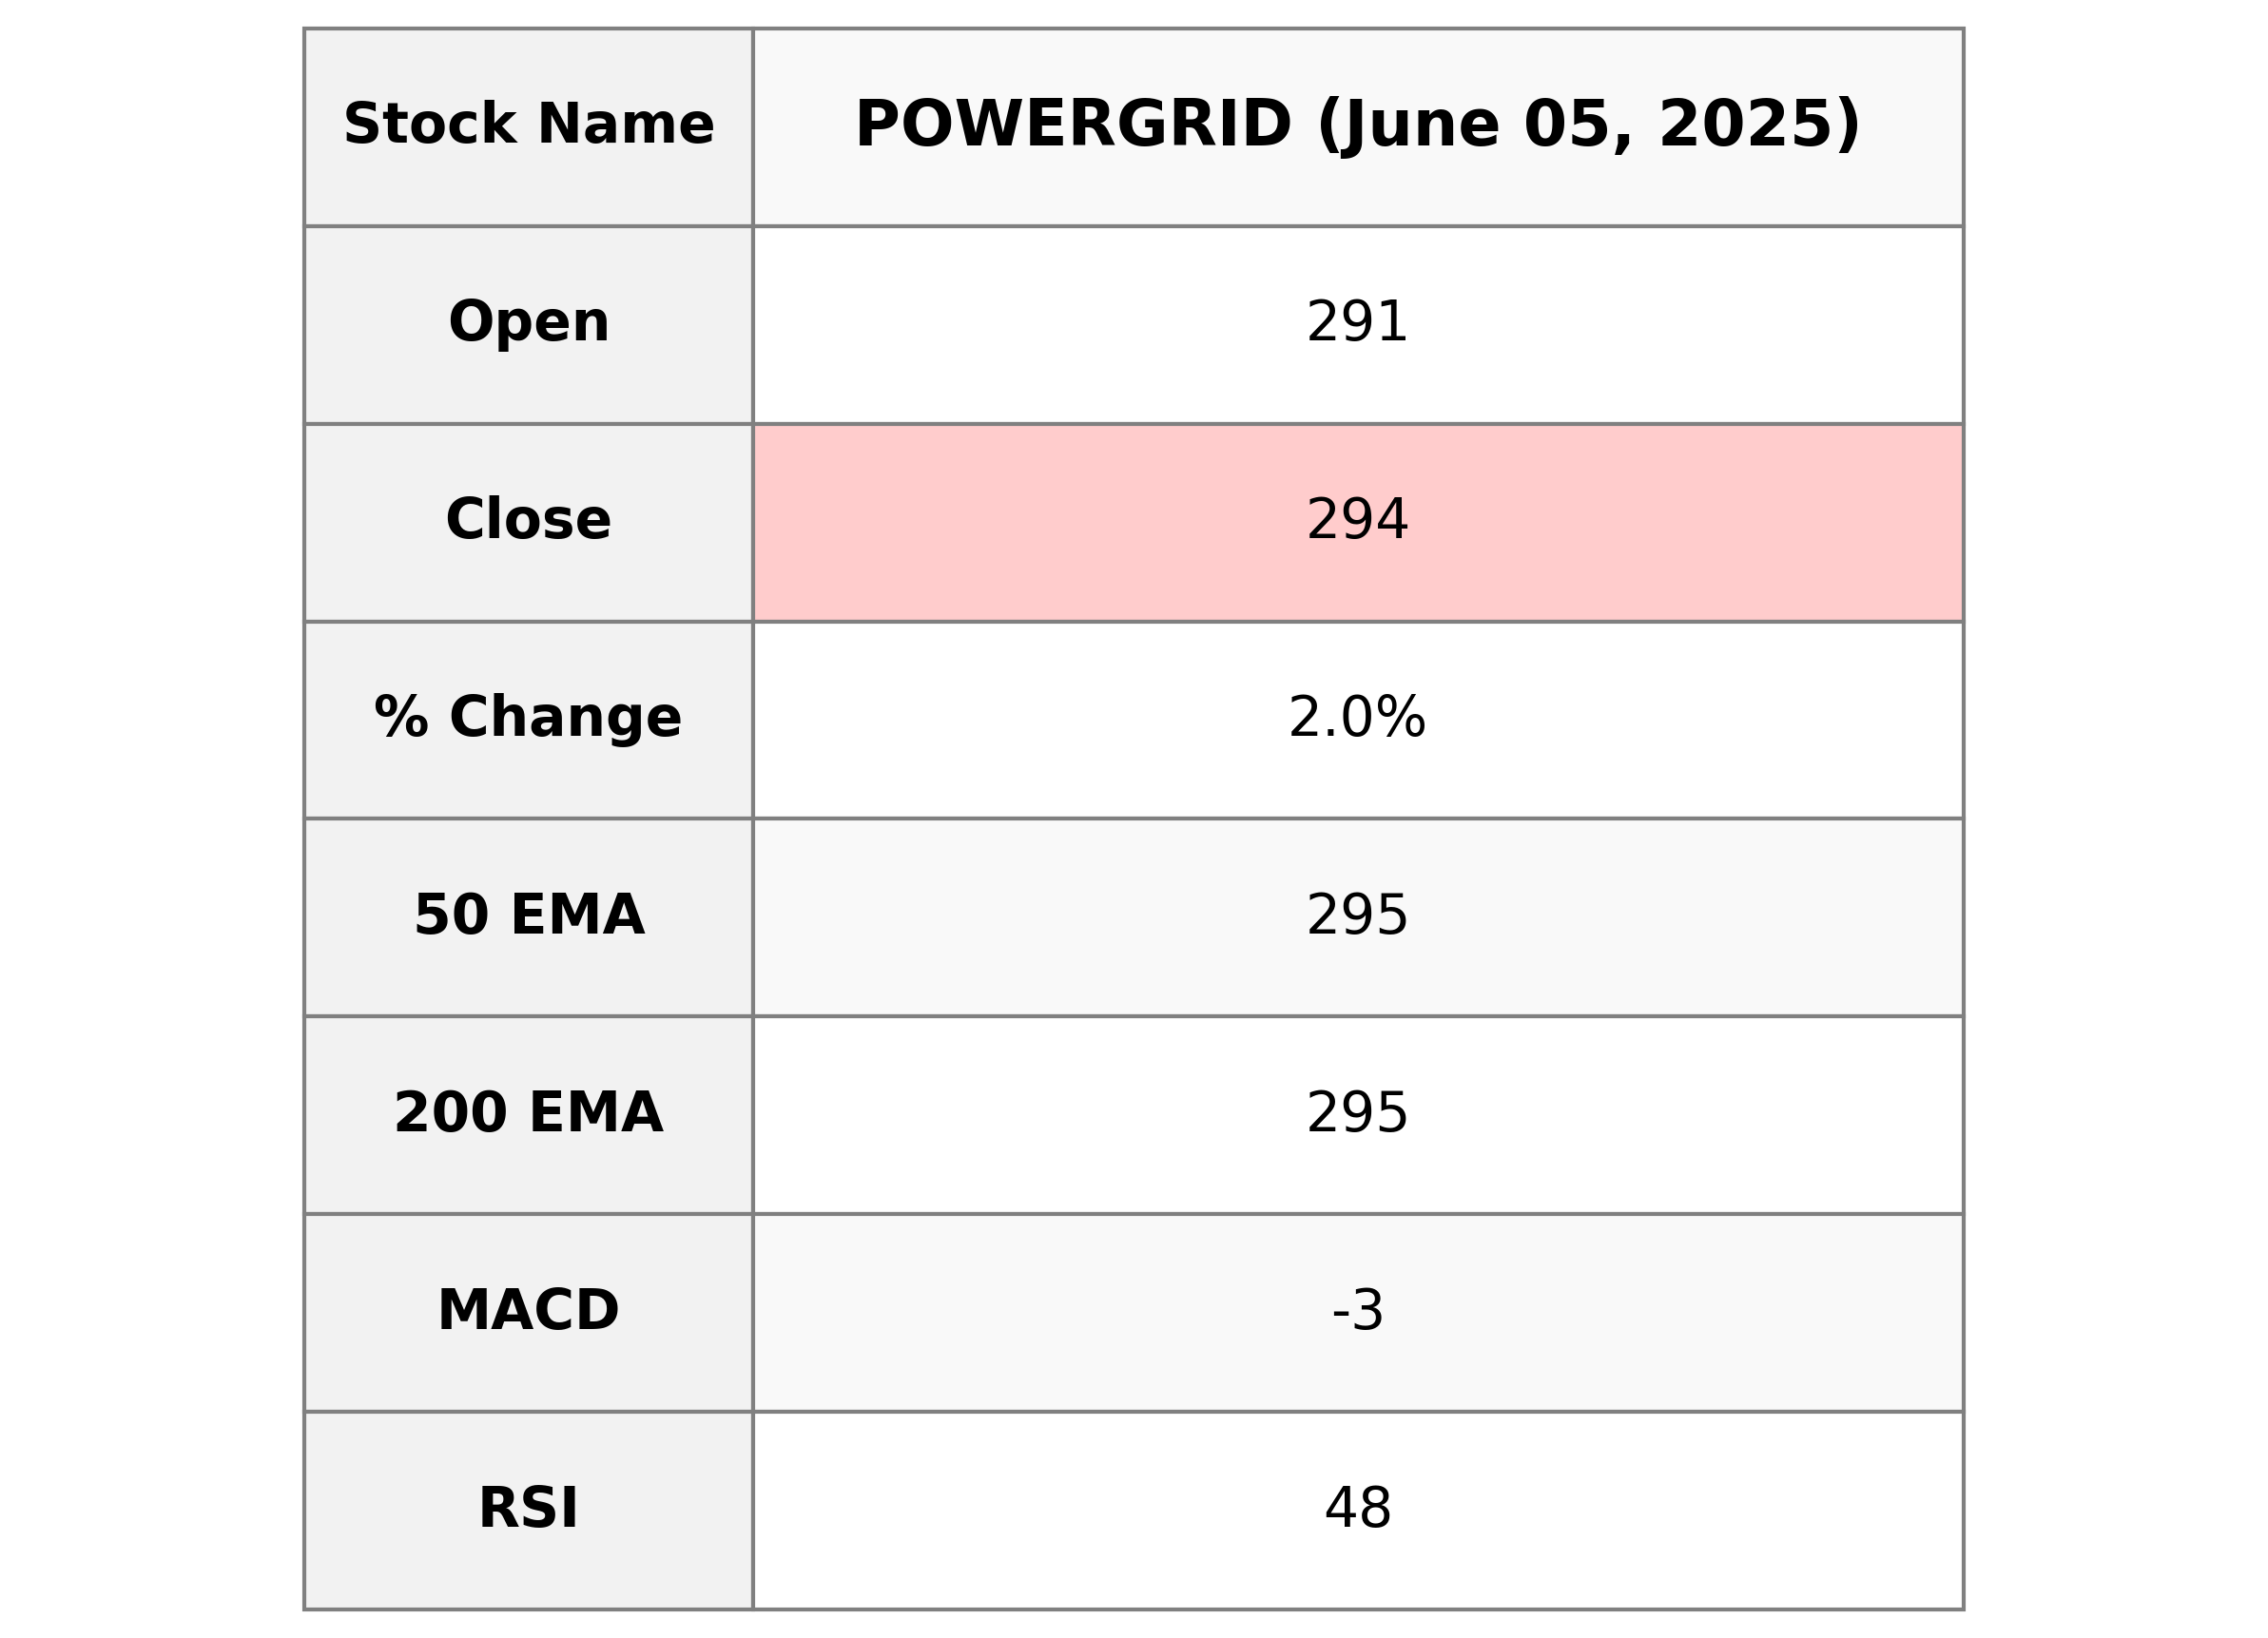
Power Grid performed well with a closing price at 294.25, registering a 1.98% increase from the previous close of 288.55. The stock shows a healthy volume of 13,109,654 and trades within a 50-day EMA of 295.21. The company's market cap stands at 2,737,178,148,864 INR within the Utilities sector, highlighting its significance in the regulated electric industry in India.
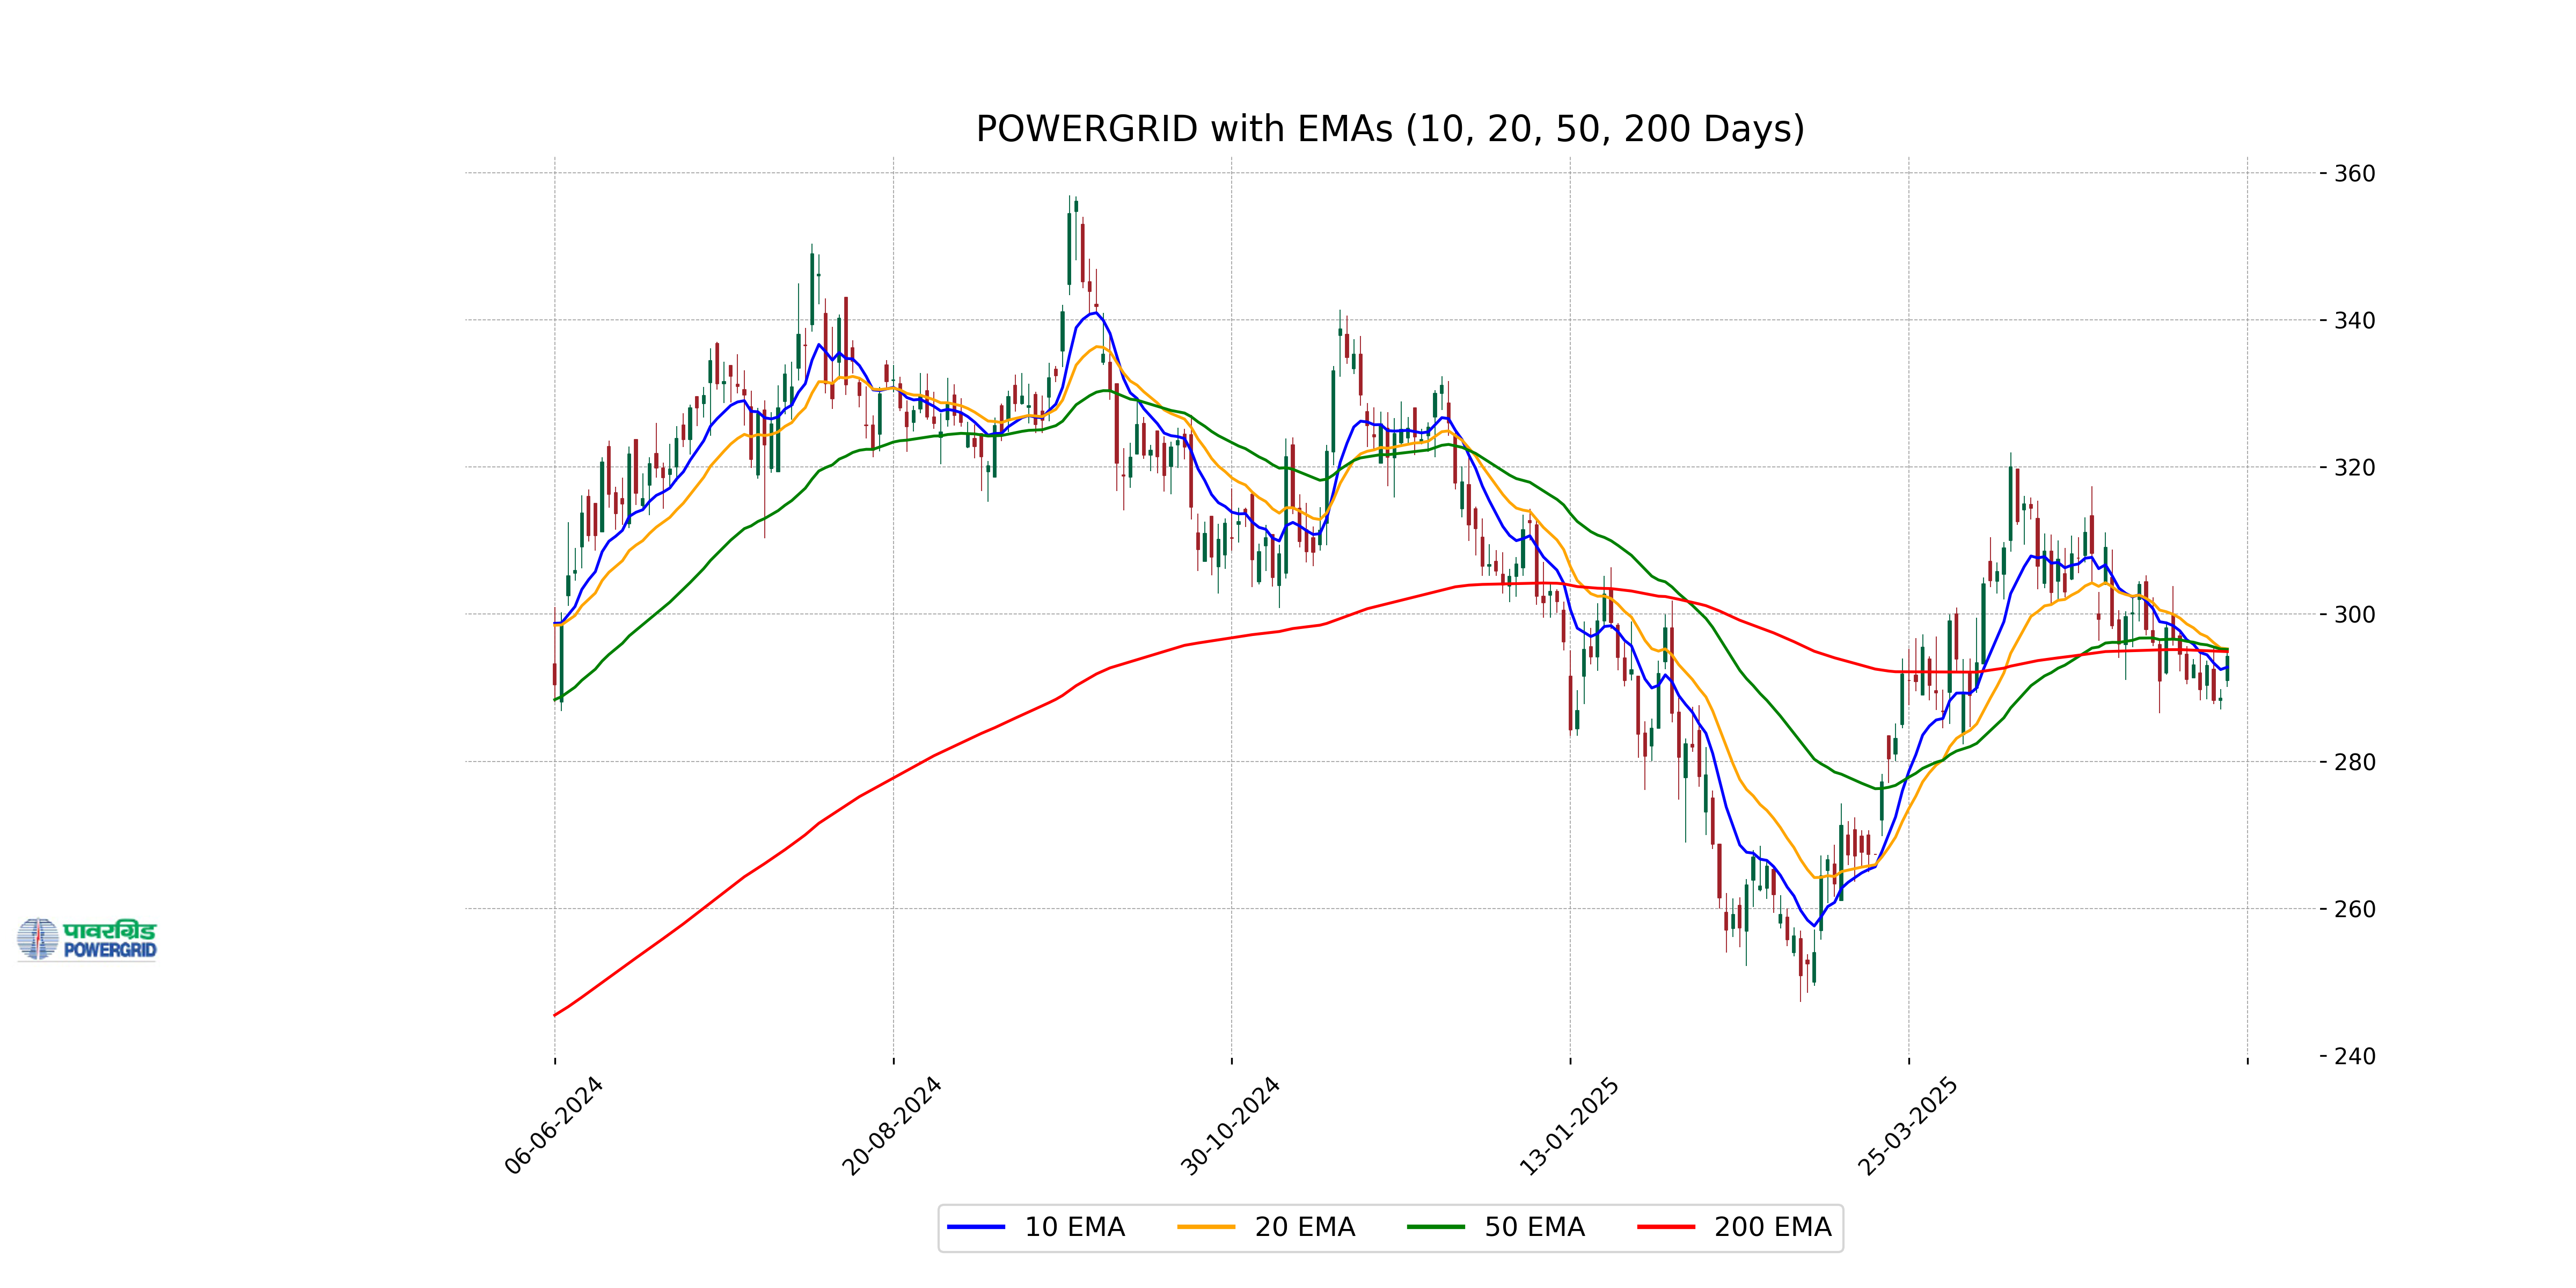
Relationship with Key Moving Averages
Power Grid's close price of 294.25 is slightly below its 50 EMA of 295.21 and its 20 EMA of 295.28, indicating a potential bearish trend in the short term. However, it is above its 200 EMA of 294.91, suggesting long-term support.
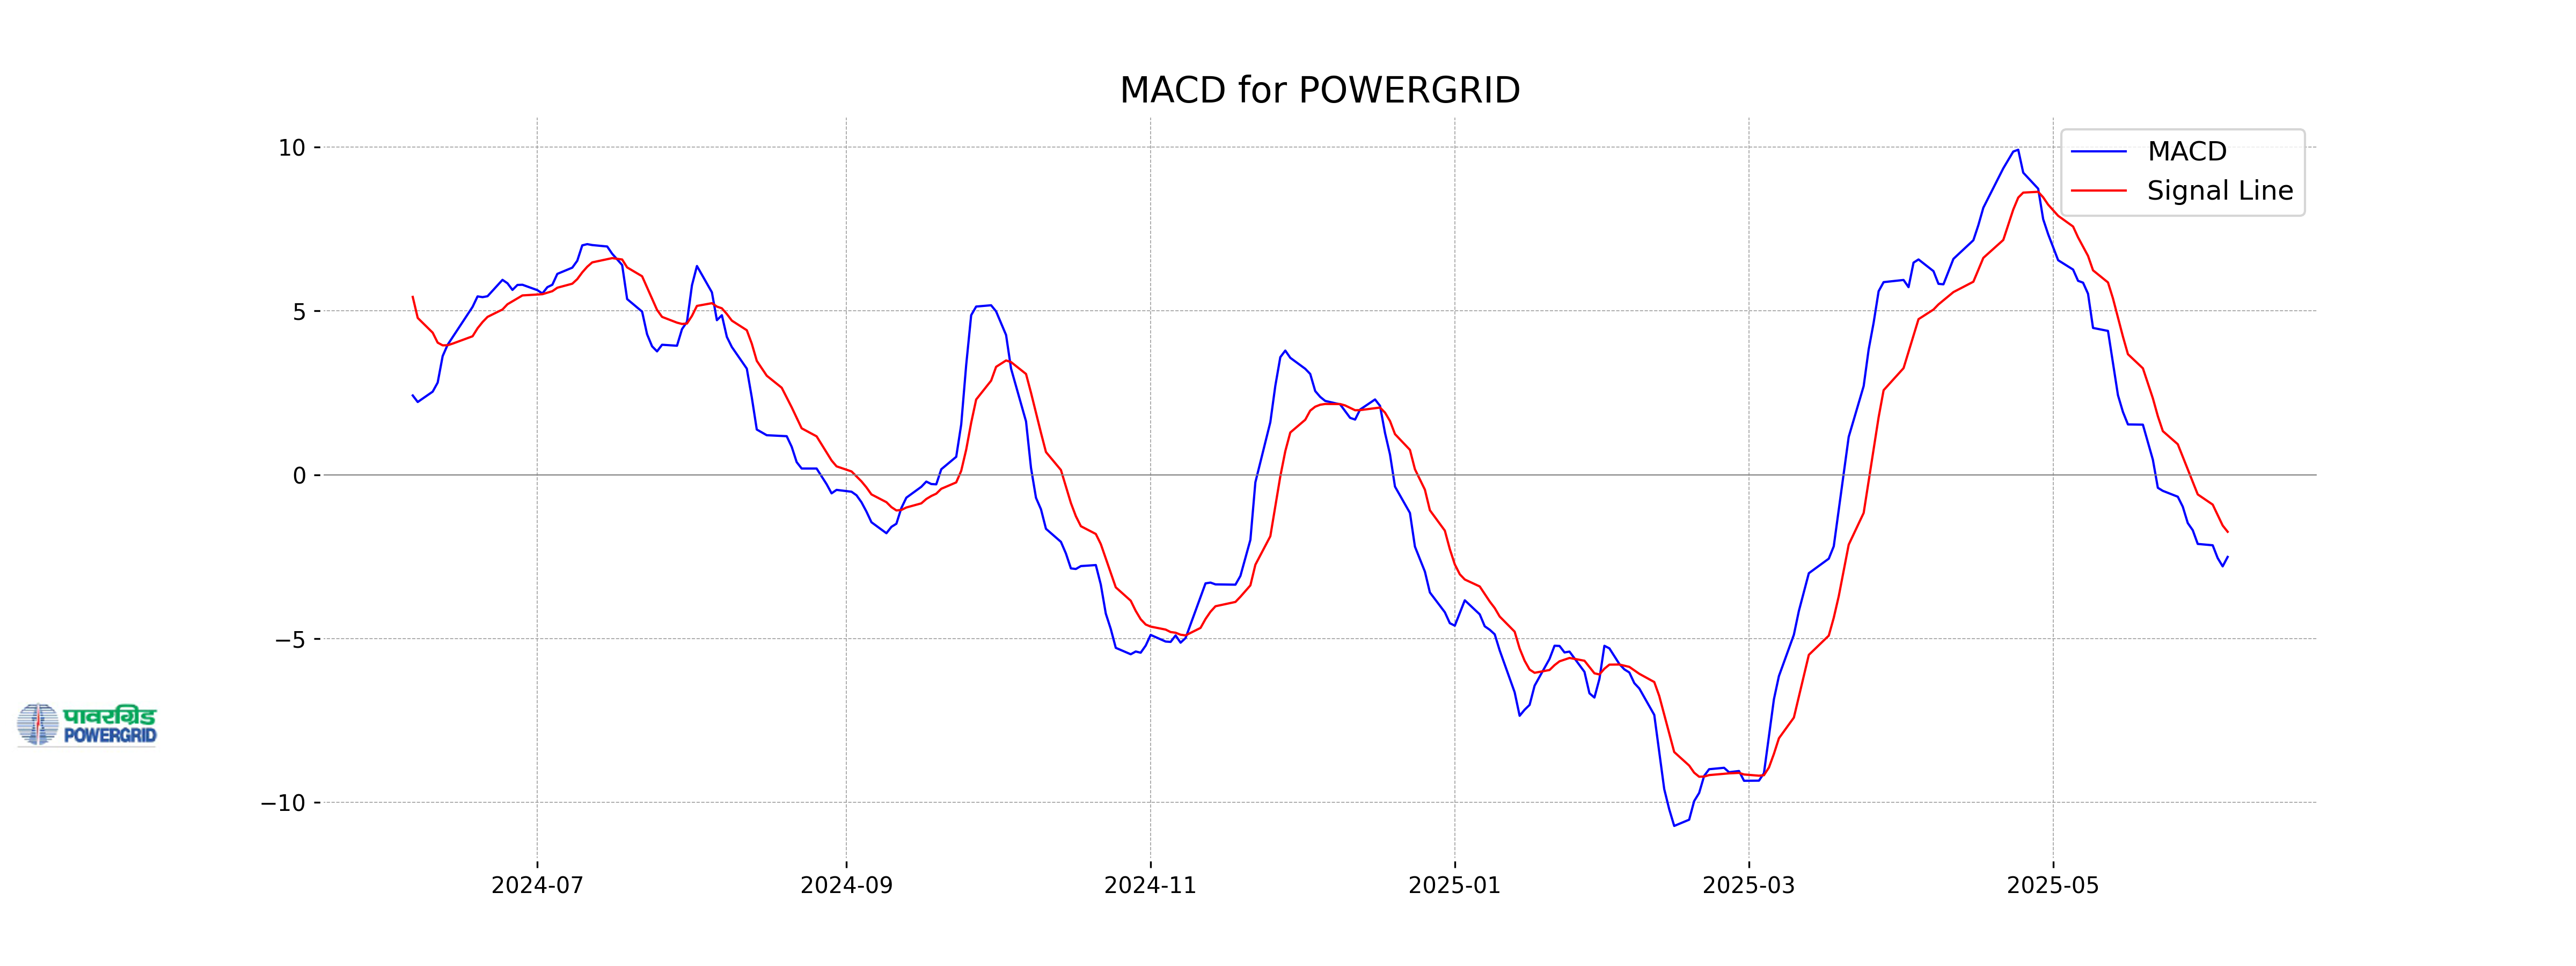
Moving Averages Trend (MACD)
The MACD for Power Grid is -2.505, indicating a bearish signal as it is below the MACD Signal line of -1.738. This suggests that the stock has been experiencing downward momentum.
RSI Analysis
The RSI for Power Grid is 48.33, indicating that the stock is neither overbought nor oversold, suggesting a neutral momentum. An RSI level close to 50 usually implies a period of consolidation or minimal price movement in the short term.
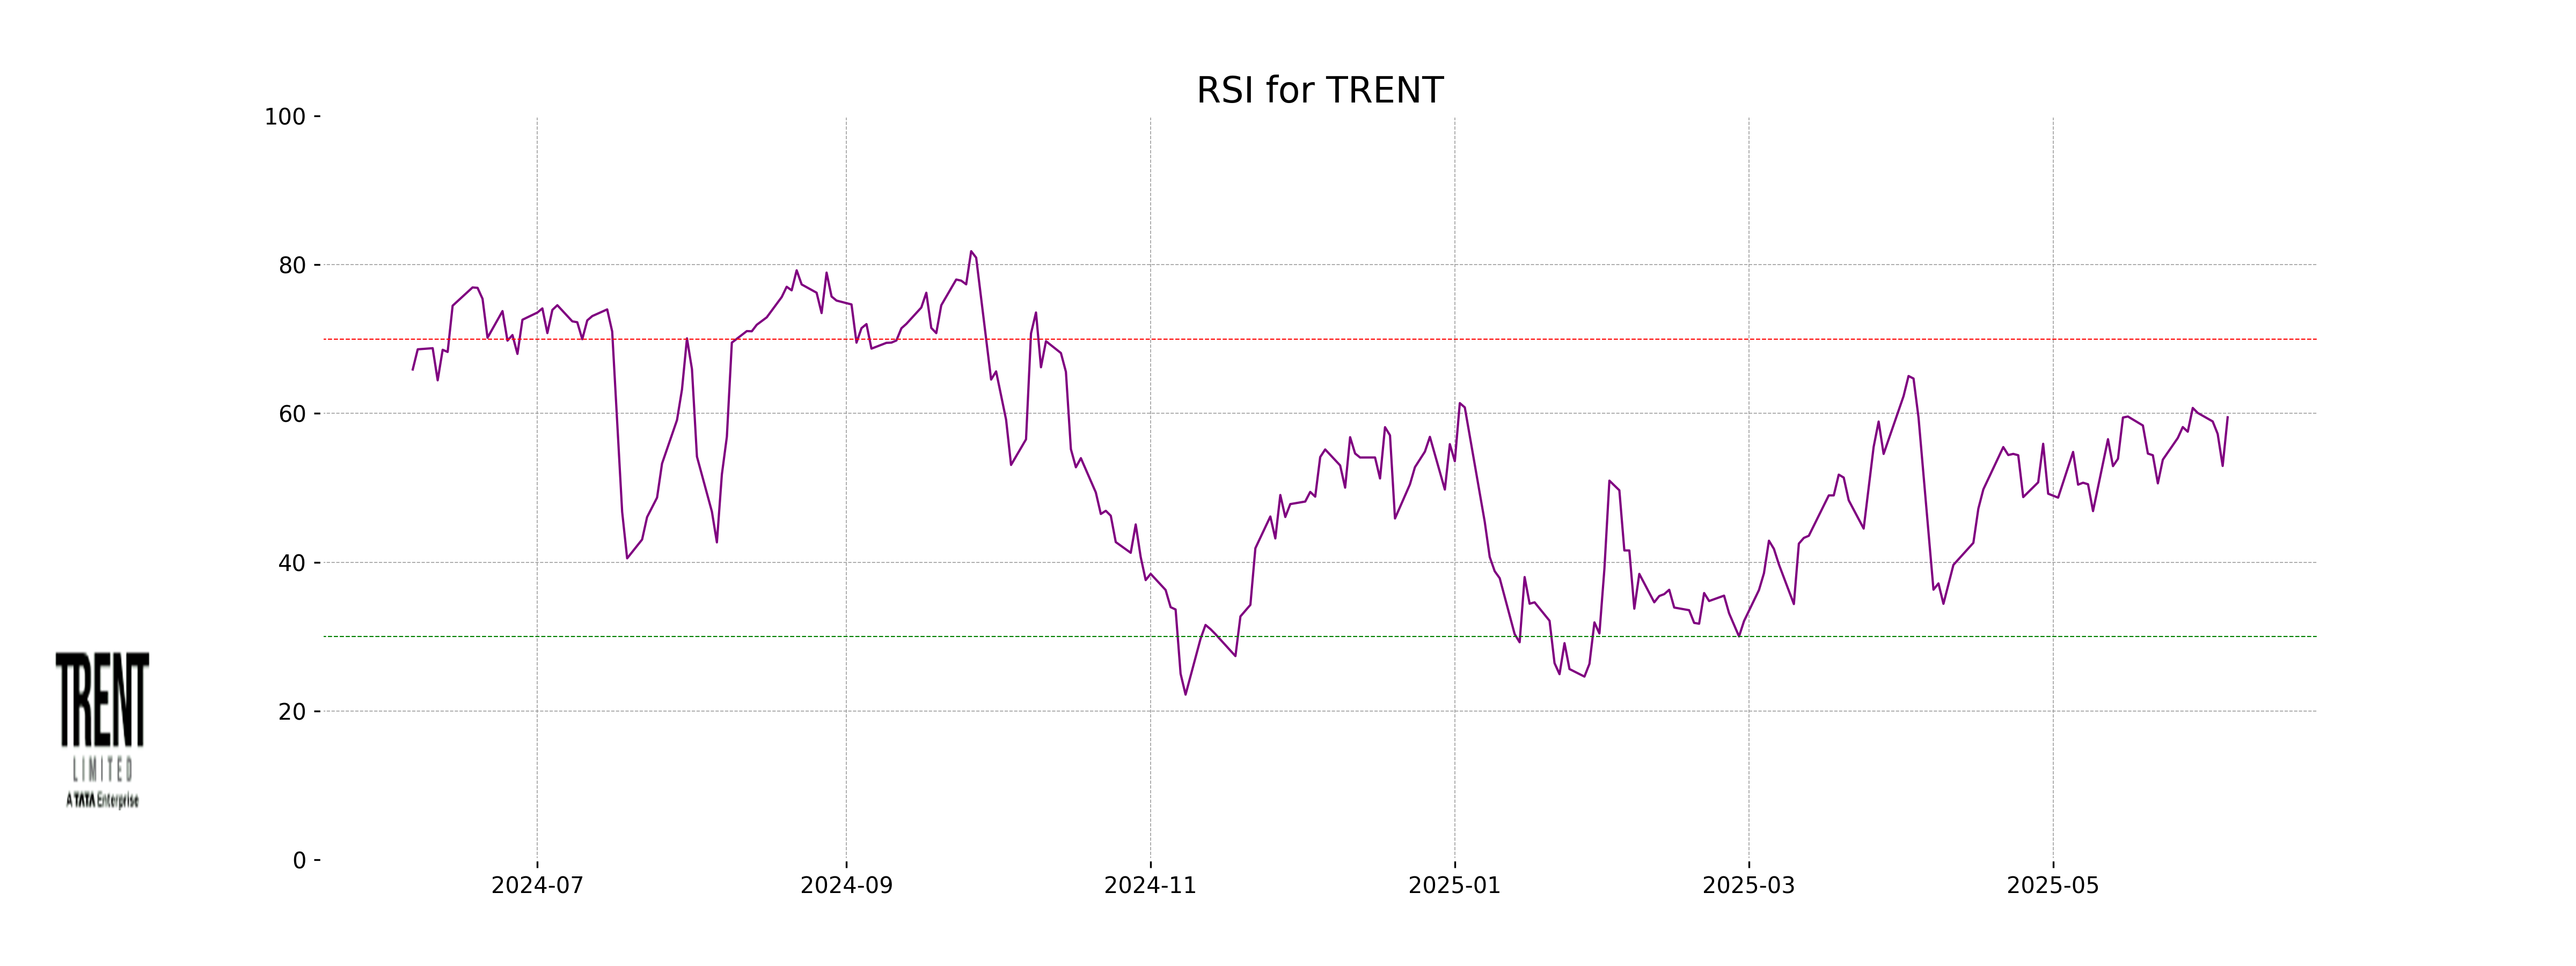
Analysis for Trent - June 05, 2025
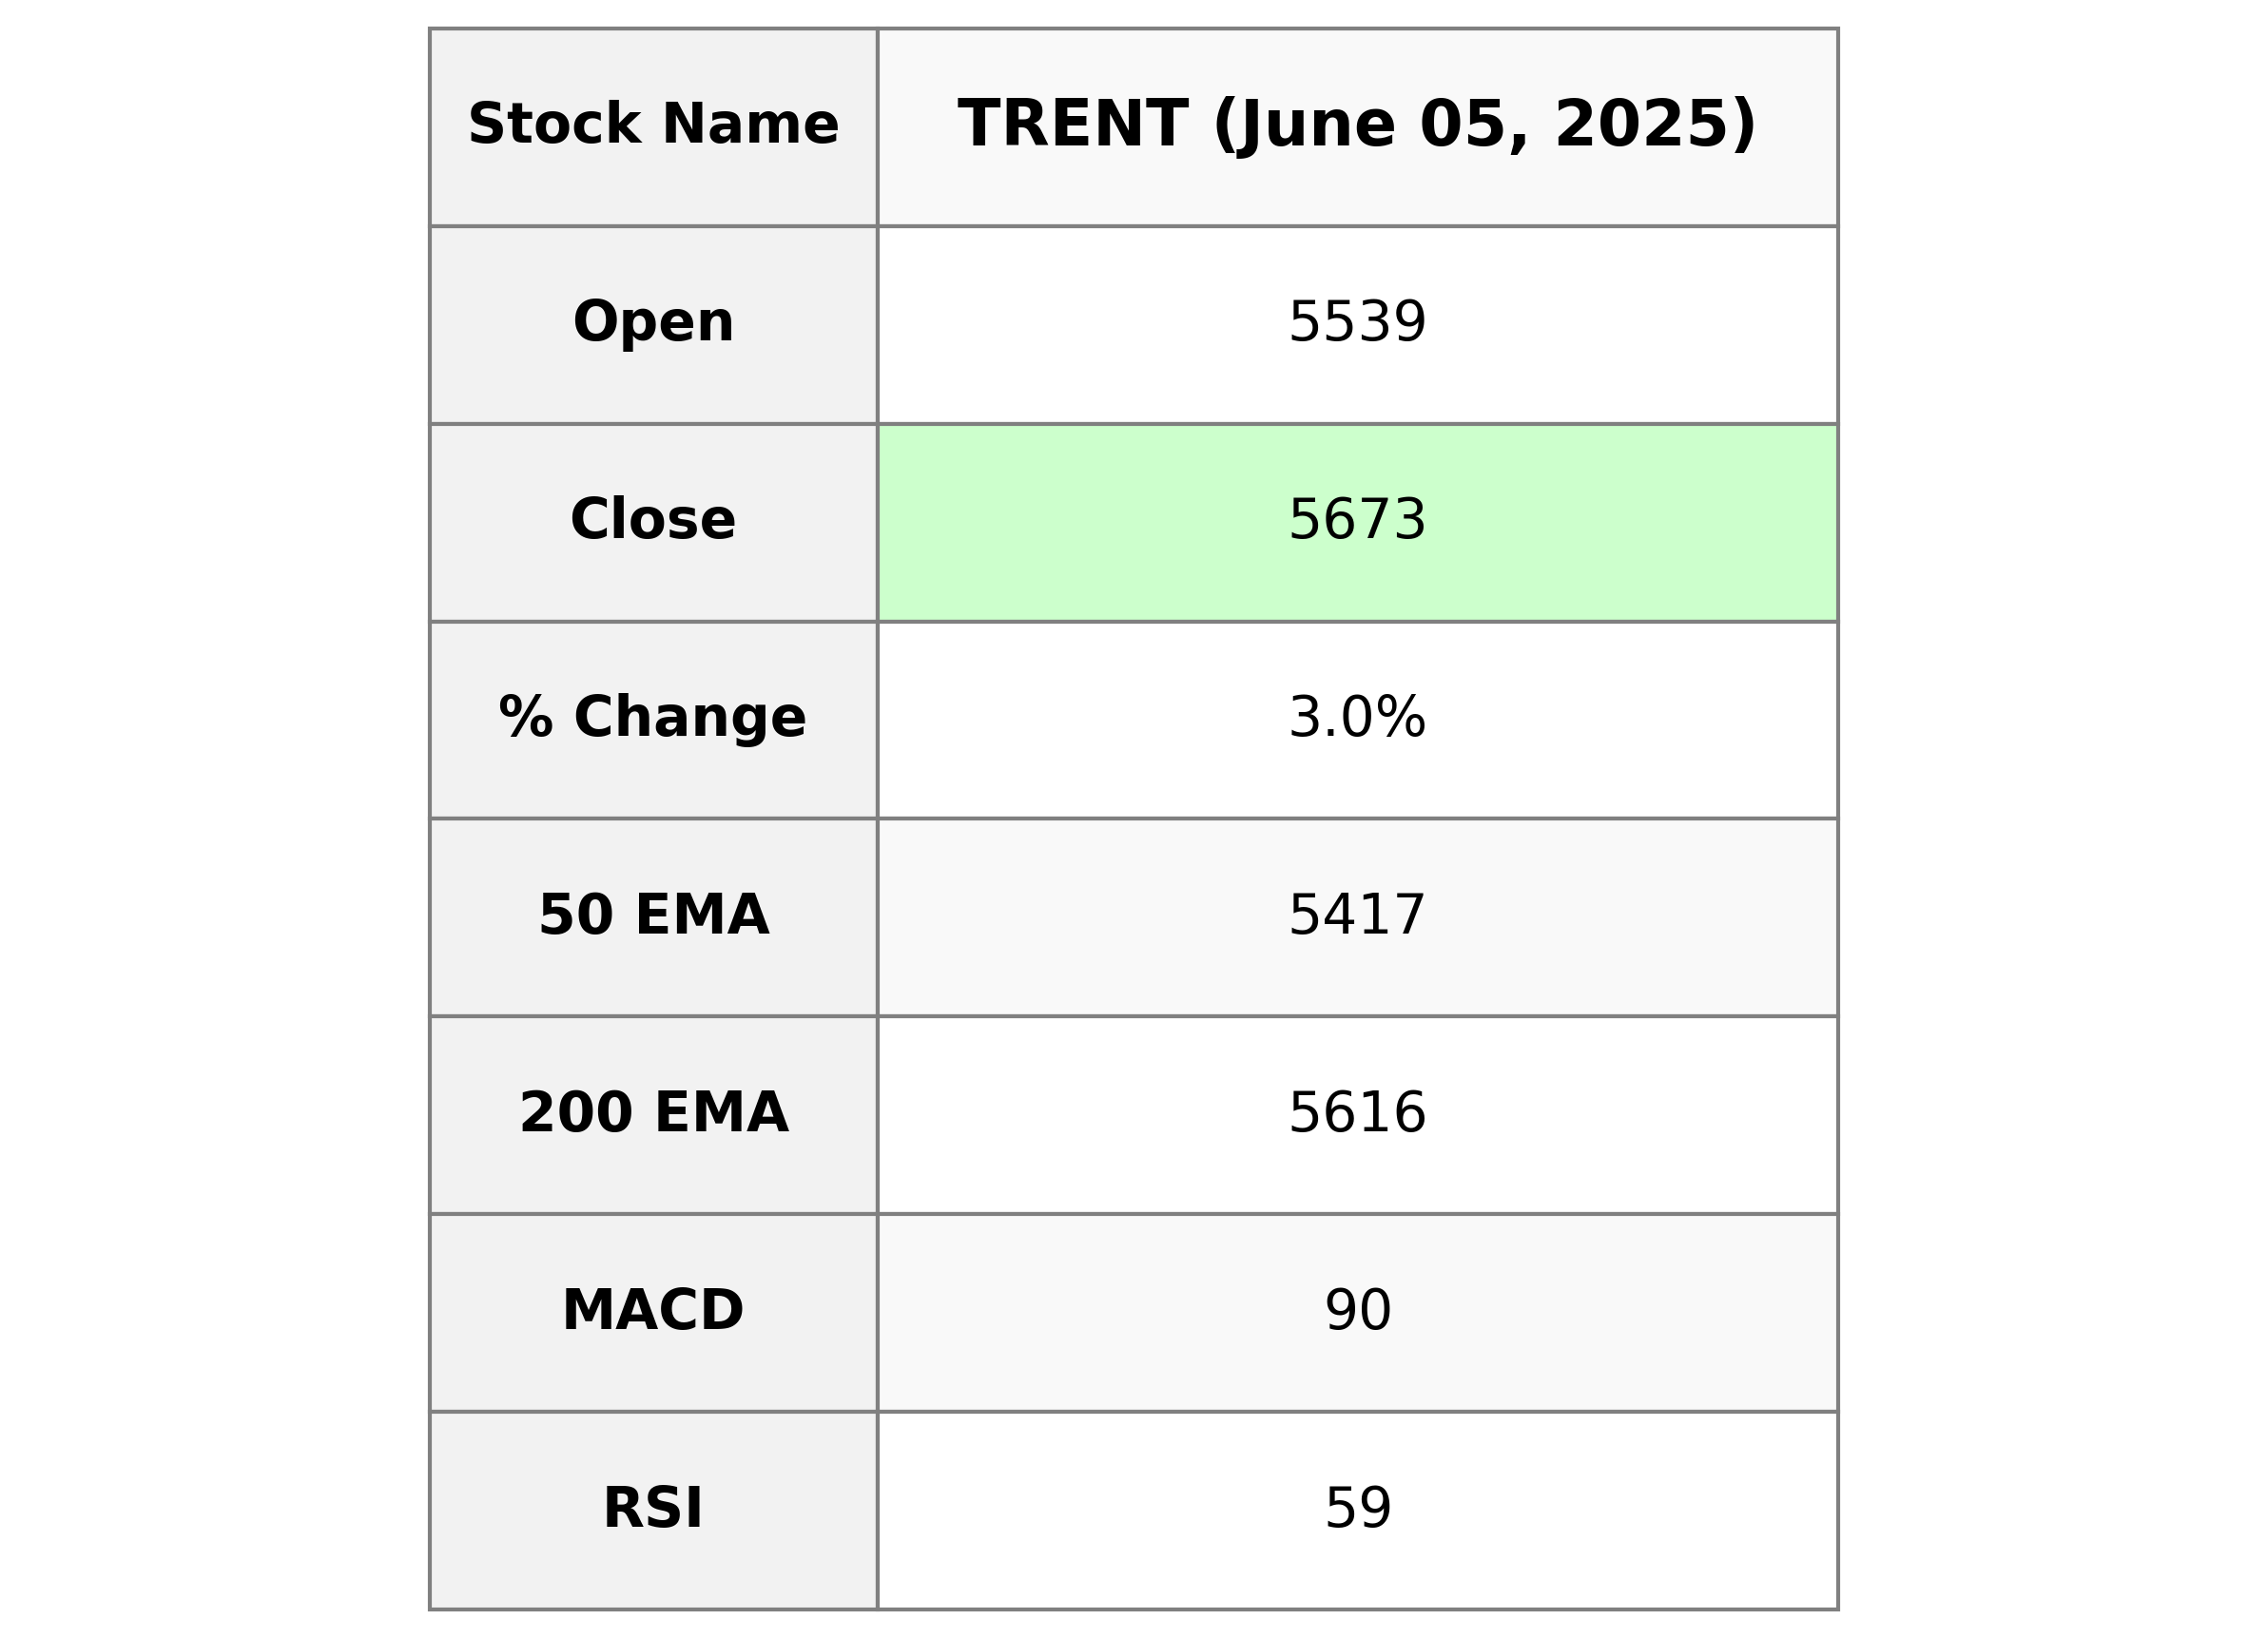
Trent Performance Trent opened at 5539.0 and closed at 5673.0, showing a positive change of 3.02% in its stock price. The company managed a volume of 1,212,728 shares, reflecting a solid interest in the market. With a PE Ratio of 130.41 and an EPS of 43.5, Trent operates in the Consumer Cyclical sector within the Apparel Retail industry in India.
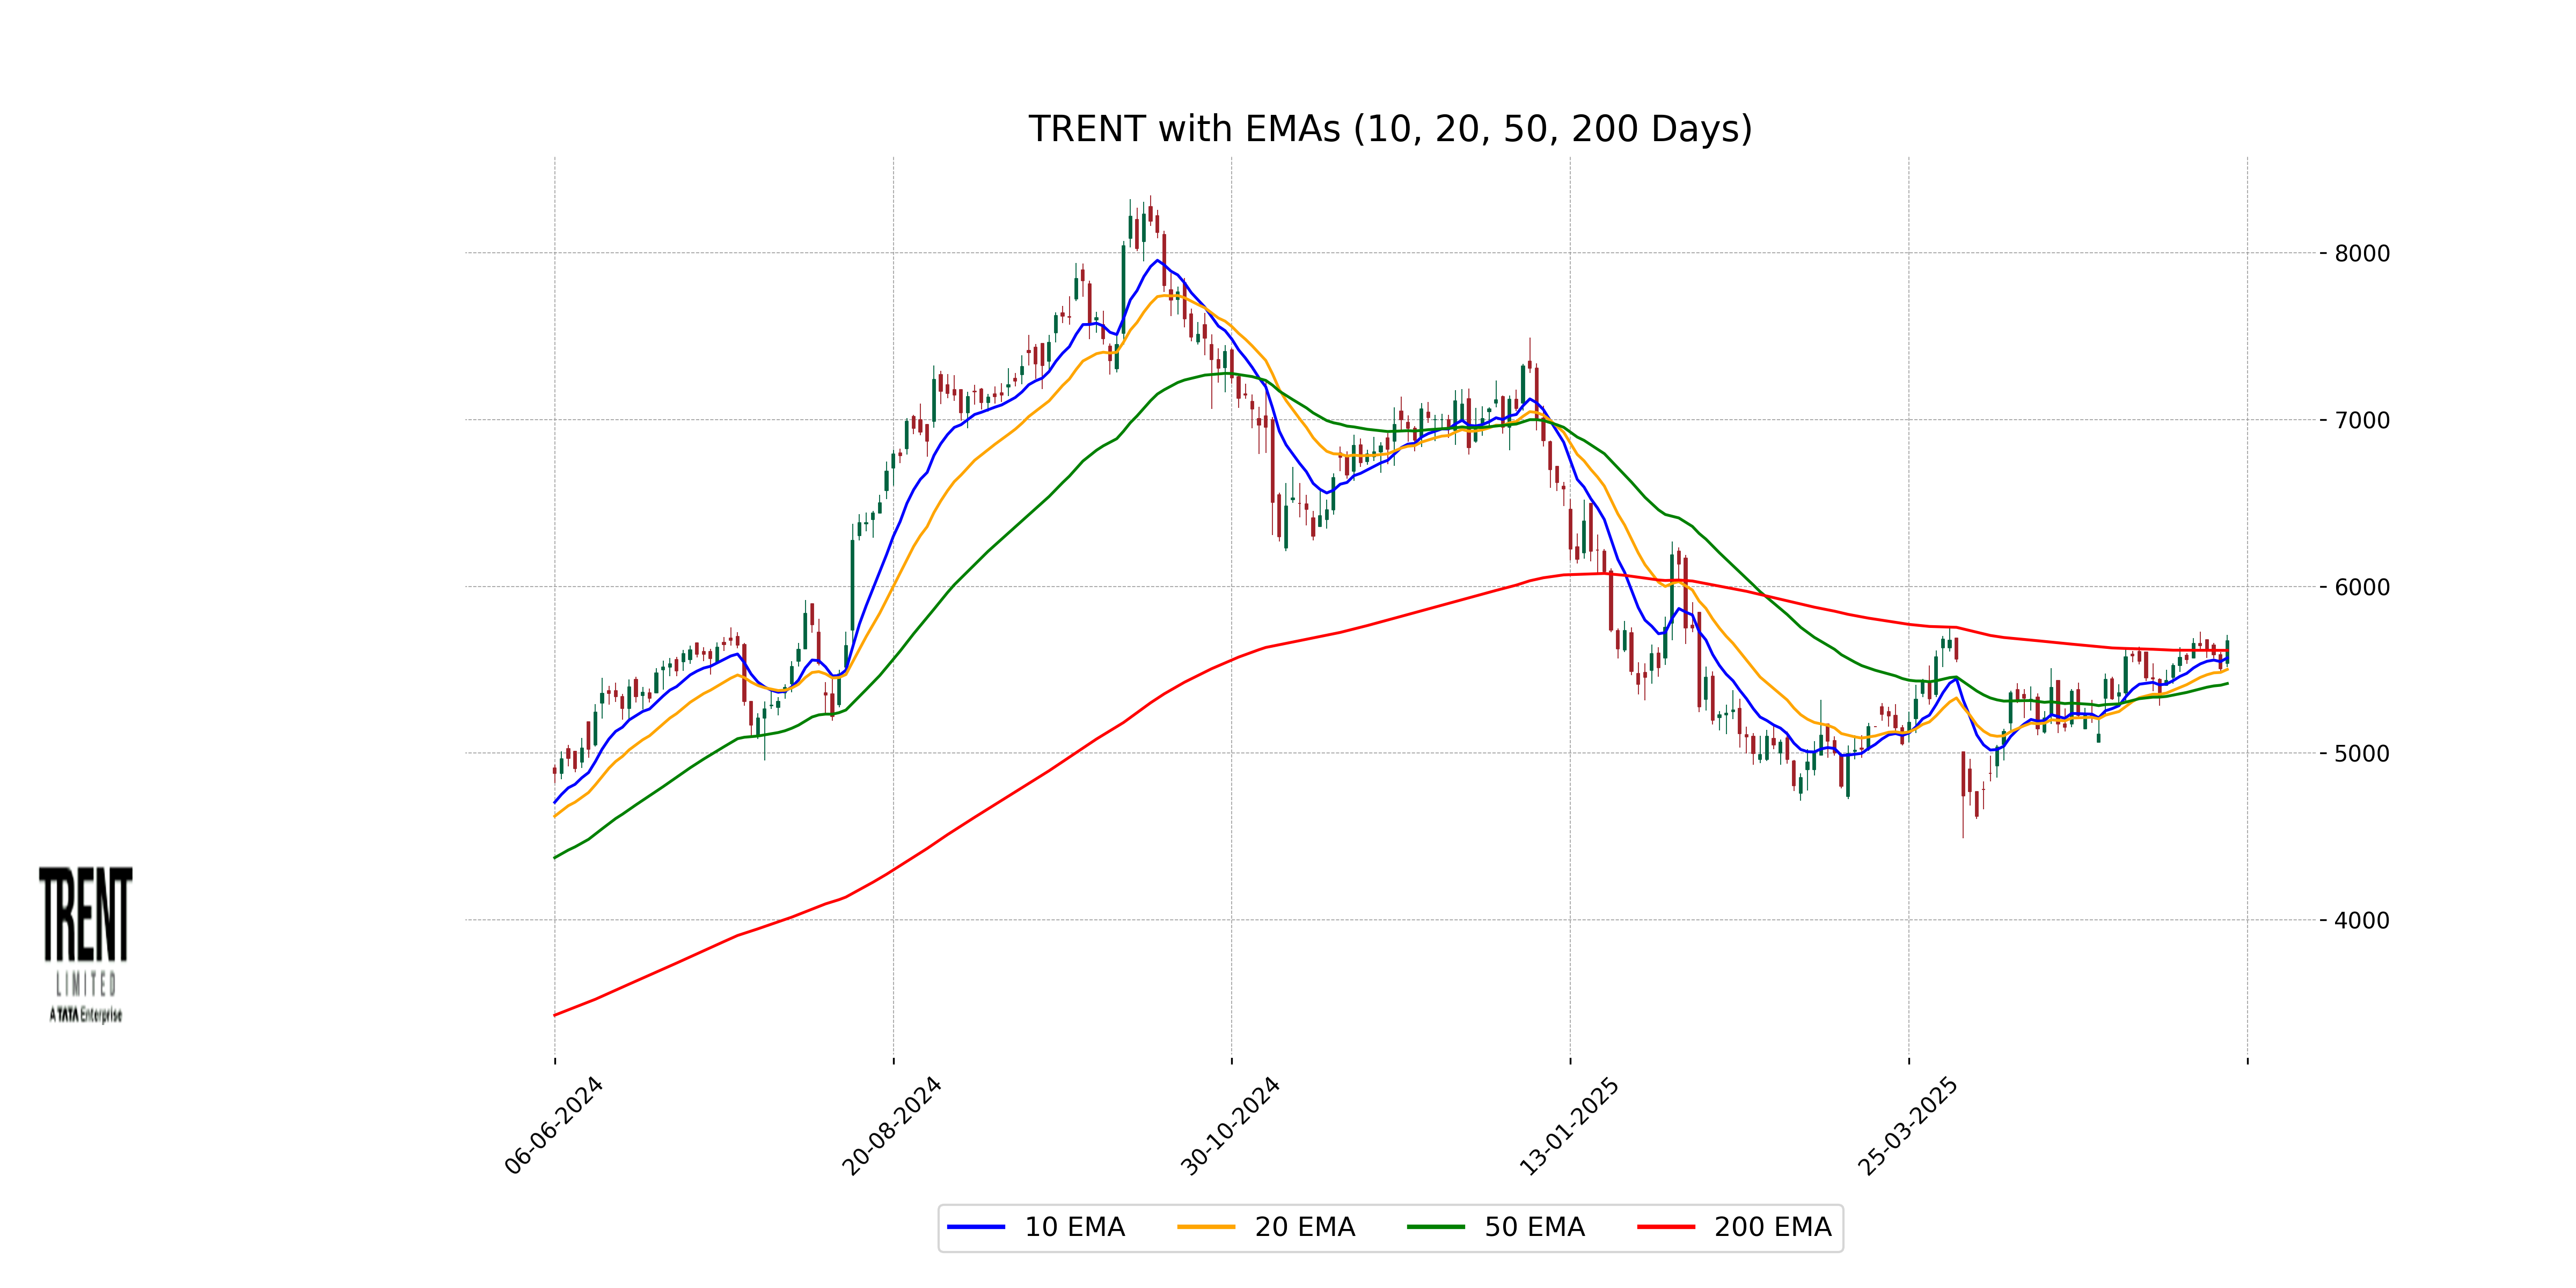
Relationship with Key Moving Averages
The closing price for Trent at 5673.0 is above its 50 EMA of 5416.86 and the 20 EMA of 5501.44, but slightly below its 200 EMA of 5615.75. This indicates a bullish short-term trend while being close to the long-term stability level.
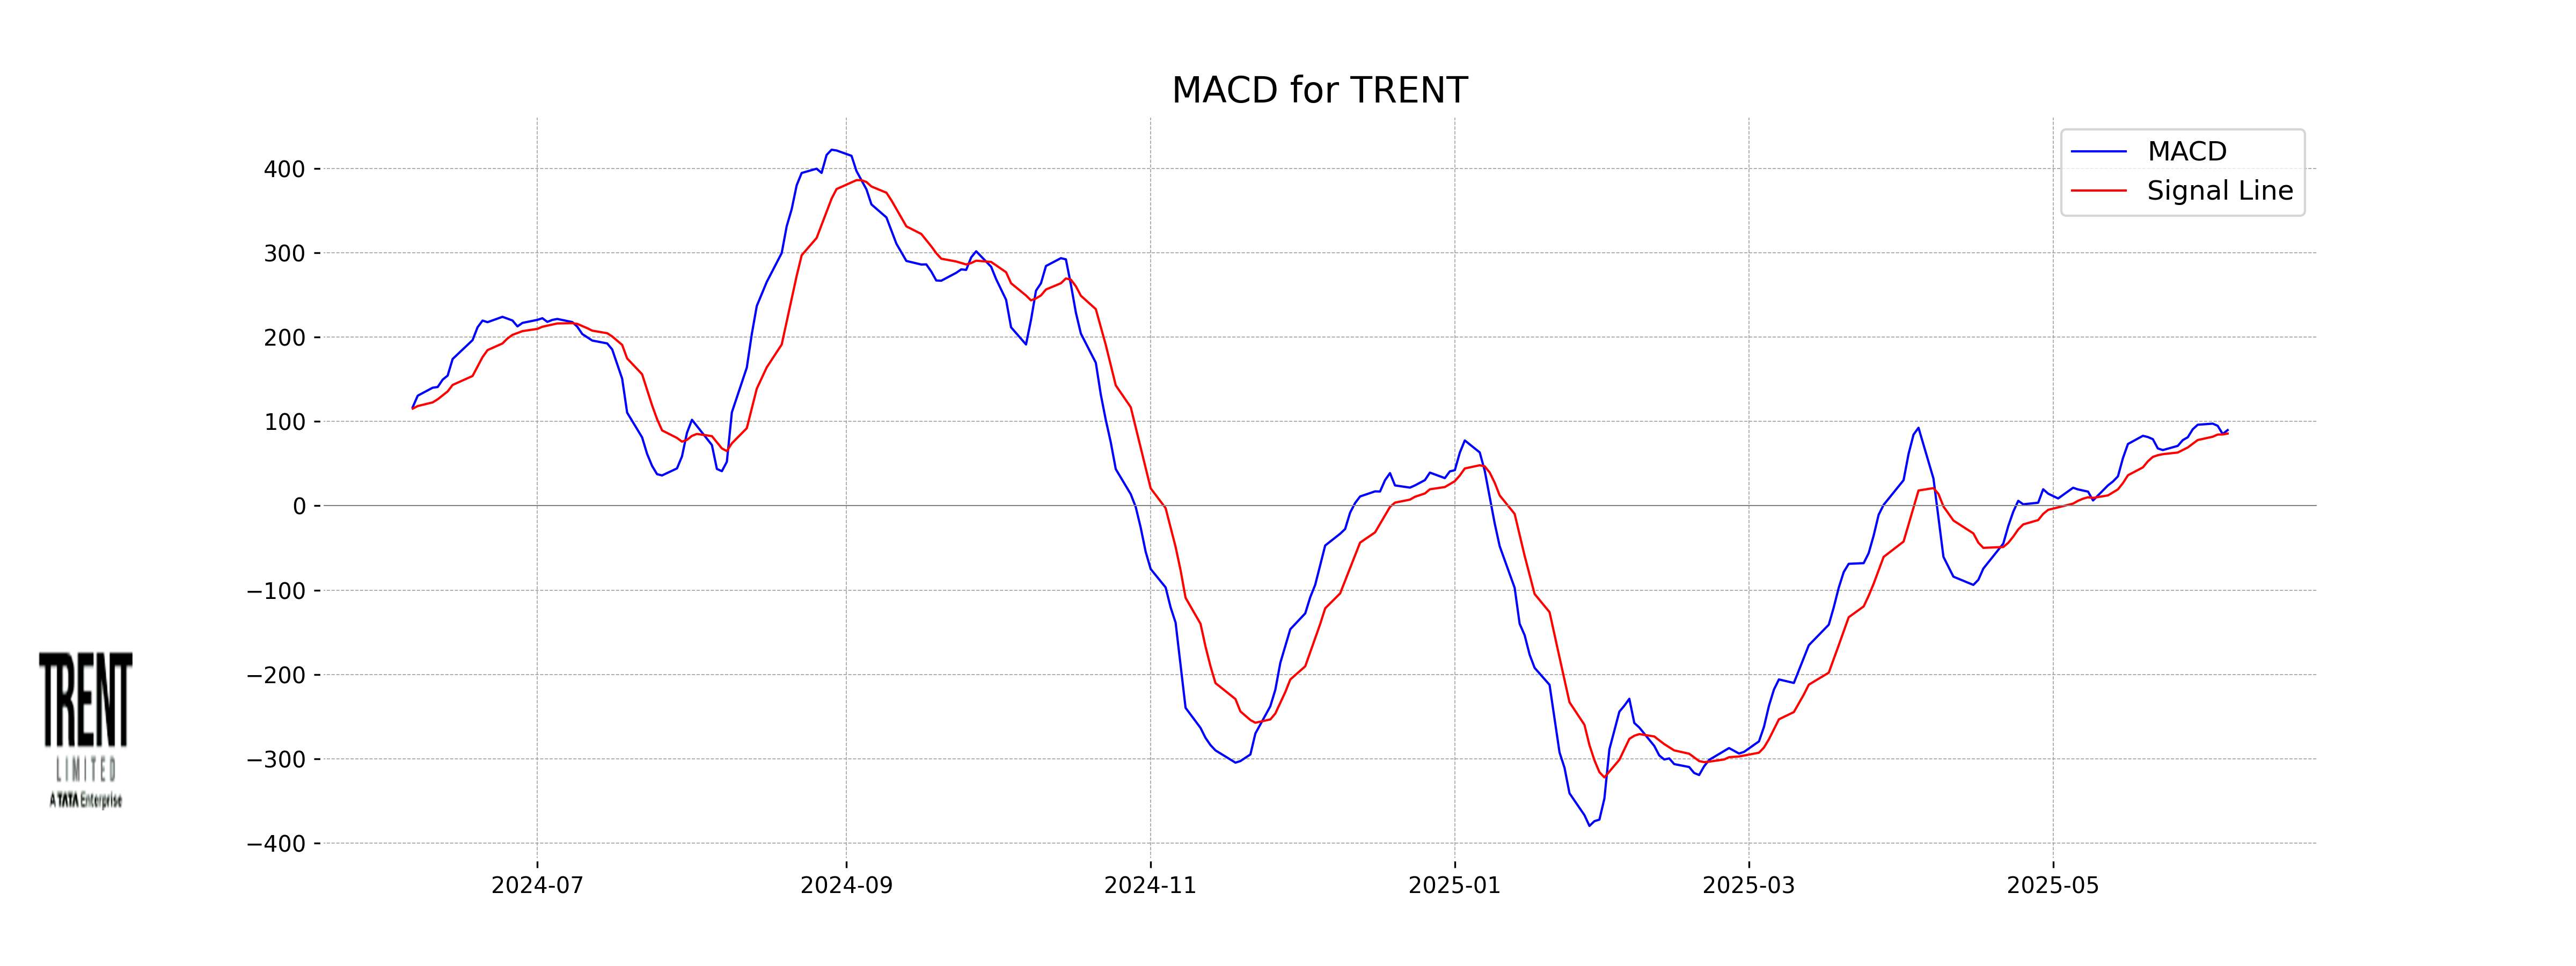
Moving Averages Trend (MACD)
MACD Analysis for Trent: The MACD value of 89.70 indicates a bullish sentiment as it is above the MACD Signal line at 85.57, suggesting positive momentum. This implies a possible continuation of the upward trend, given the recent price movements and other factors.
RSI Analysis
The RSI (Relative Strength Index) for Trent is 59.49, suggesting a moderately positive momentum as it is nearing the overbought threshold of 70. This indicates that the stock may have further room for growth before potentially facing overbought conditions.
Up Next
Top 5 Nifty 50 gainers today – June 05, 2025: Biggest stock moves

India's GDP expected to register over 8 pc growth in Sep-Dec: Report

Govt announces seven measures to help boost exports

RBI keeps interest rates on hold after US trade deal boosts outlook

RBI proposes to compensate customers up to Rs 25,000 loss due to fraud

RBI raises GDP growth projection of Q1, Q2 of FY27

More videos

RBI pauses rate cuts, retains interest rate at 5.25 pc

Rupee jumps 122 paise to close at 90.27 against US dollar on India-US trade deal

Stock markets cheer India-US trade deal: Sensex, Nifty surge 2.5 pc

UPI transactions hit record high of Rs 230 lakh crore in 2025-26 till Dec: Govt

Explained: India-US trade deal, tariffs and trade benefits

Trade deal with US adds momentum to India's growth ambition: Industry leaders

Rupee jumps 119 paise to 90.30 against the US dollar on India-US trade deal

President Trump announces US-India trade deal, lowers tariffs from 25 pc to 18 pc

Stock markets cheer India-US trade deal: Sensex jumps over 5 pc; Nifty nears all-time high

Sustaining 7–8% growth top priority to create jobs: FM Nirmala Sitharaman