


Highlights
- Cipla trades strongly above key moving averages
- Hero MotoCorp shows strength across all EMAs
- Shriram Finance faces short-term resistance zones
Latest news

Samsung Galaxy M17 5G Review: Best Budget Samsung Phone Under ₹15,000?

OnePlus 15R first look: OnePlus changes the R-series playbook

India's retail inflation rises to 0.71% in November

Cabinet approves CoalSETU window for auction of coal to boost industrial use and export

Cabinet approves Minimum Support Price for Copra for 2026 season

Fire never left: Vinesh Phogat comes out of retirement, targets LA Olympics

Flexible office segment in India set to grow faster, over 25% annually by 2027: Report

Rahul Gandhi flags issue of air pollution, seeks discussion in Lok Sabha
Top 5 Nifty 50 gainers today – July 28, 2025: Biggest stock moves


In this article, we will explore the technical indicators of some of the high-performing stocks on the Indian stock market, including ASIANPAINT, CIPLA, HEROMOTOCO, HINDUNILVR, and SHRIRAMFIN.
By looking at these stocks through the lens of key technical factors, we aim to better understand their price movements, trends, and potential future performance.

Analysis for Asian Paints - July 28, 2025

Asian Paints Performance Description: Asian Paints experienced a positive day with a closing price of 2359.60, reflecting a 1.00% increase from the previous close. Despite moving between a high of 2366.40 and a low of 2320.00, the stock's closing was above its 50-day EMA, hinting at short-term strength. However, the RSI of 48.44 implies a relatively balanced momentum, neither in oversold nor overbought territory.
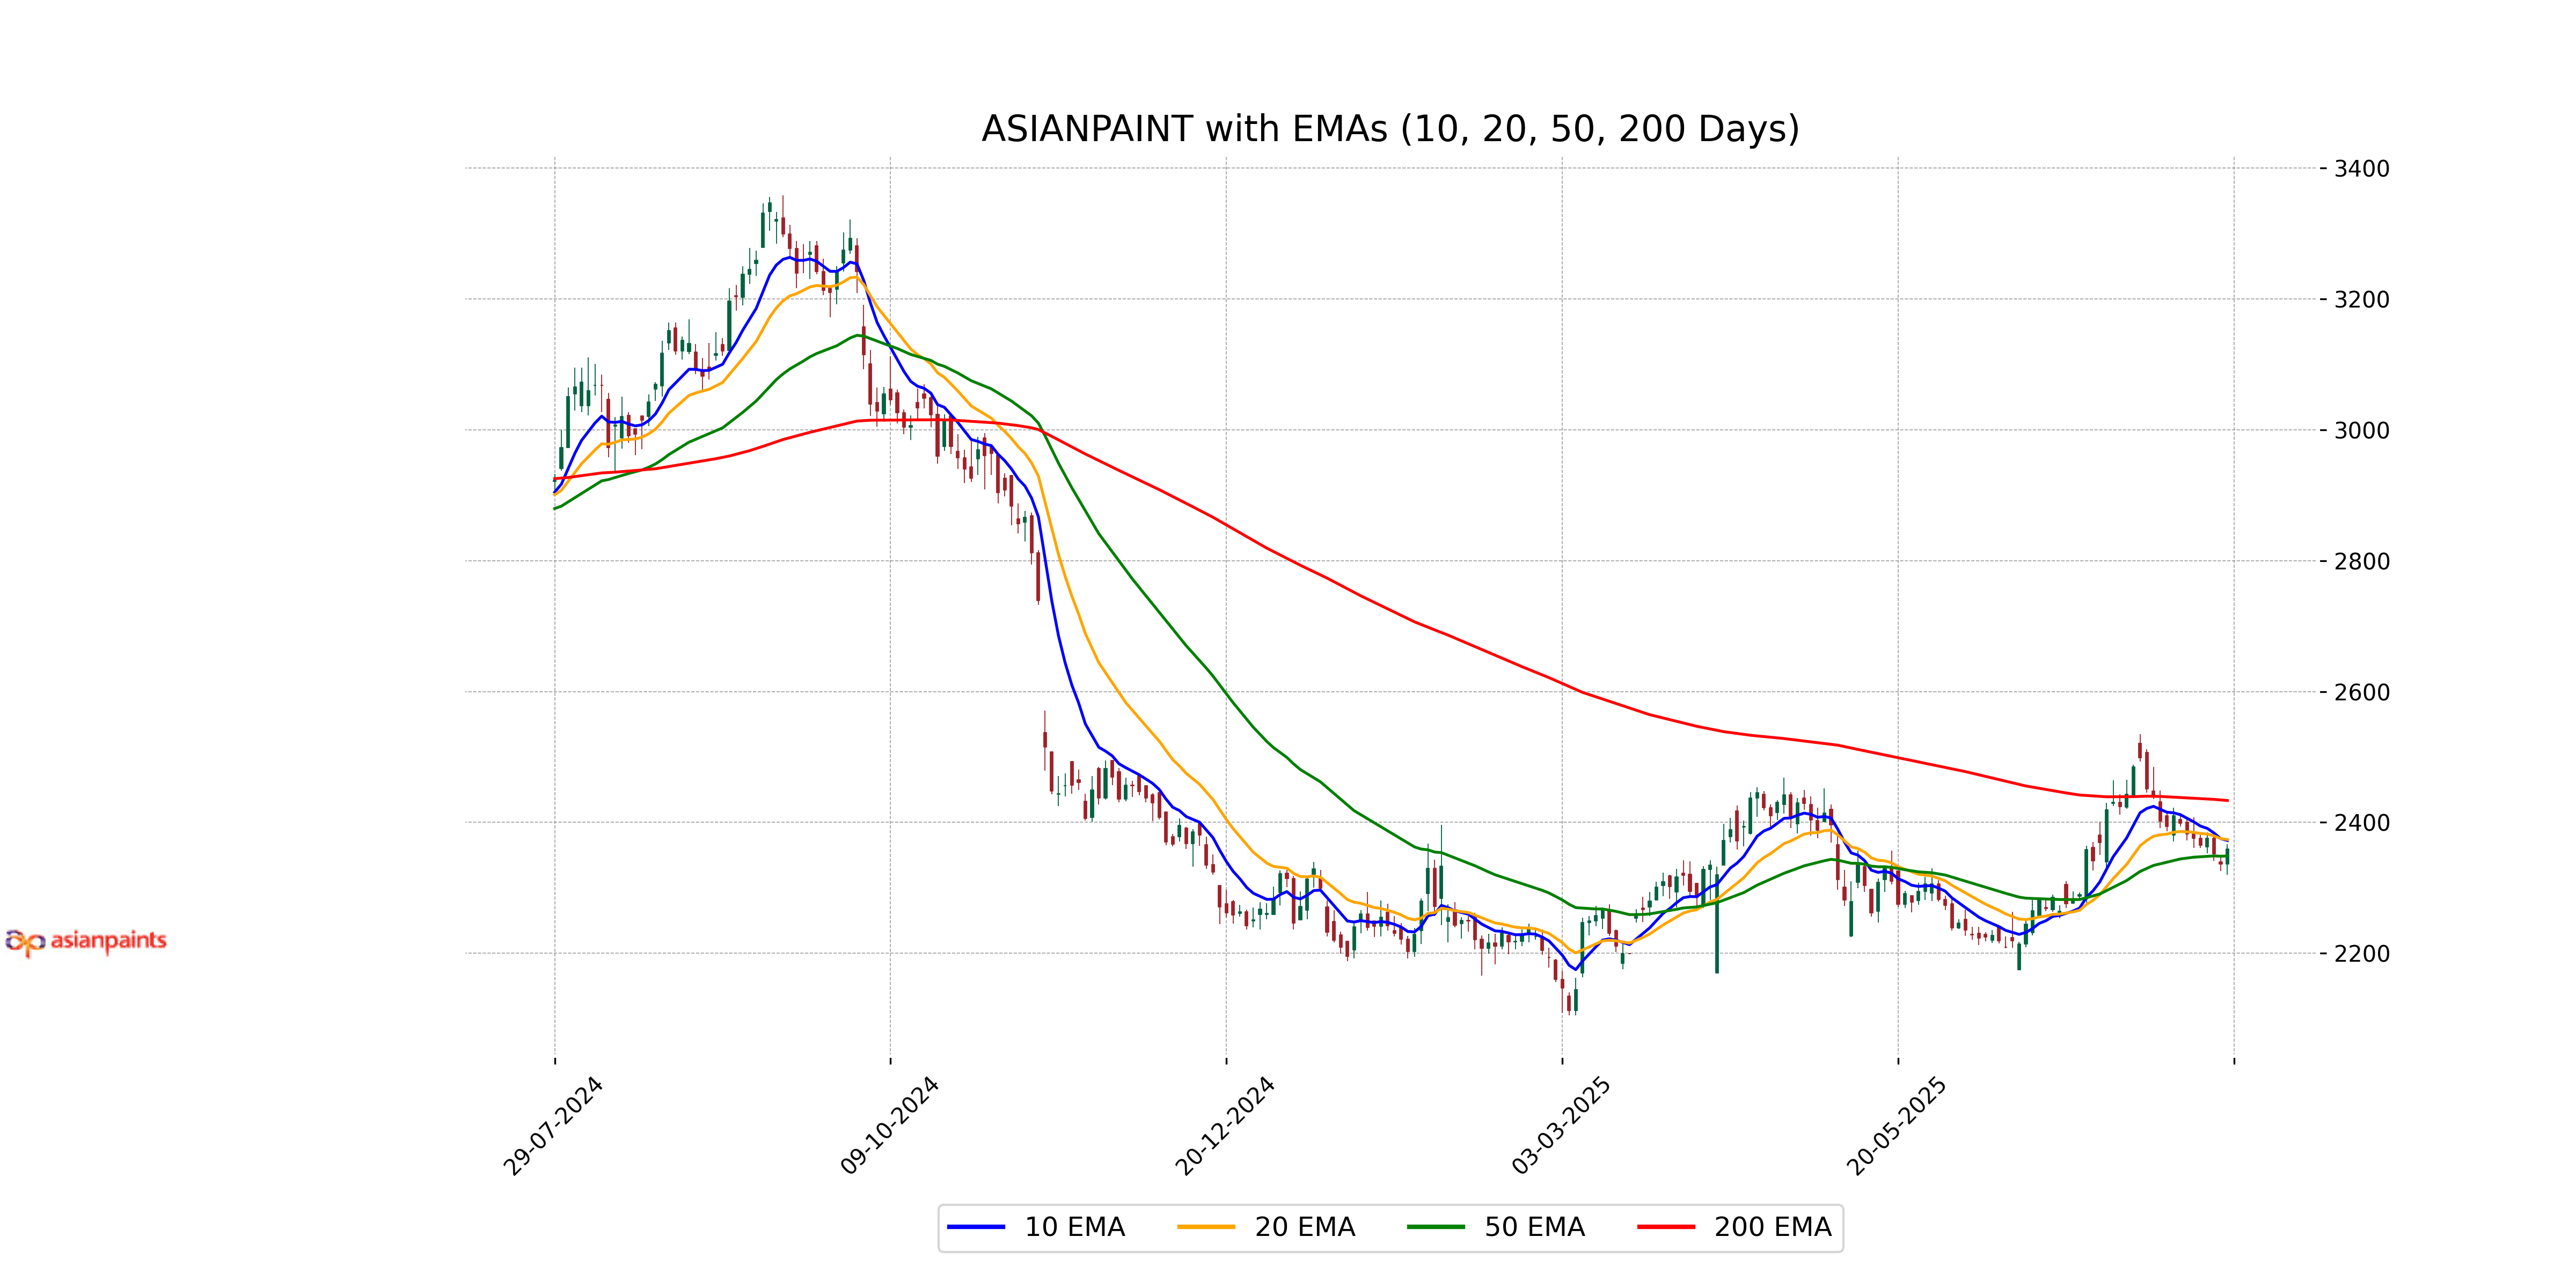
Relationship with Key Moving Averages
Asian Paints closed at 2359.60, slightly above its 50-day EMA of 2348.69, indicating modest short-term momentum, yet remained below its 10-day EMA of 2372.33 and 20-day EMA of 2373.77, suggesting potential resistance in immediate price movements. The stock is also below its 200-day EMA of 2433.45, highlighting a longer-term downtrend.
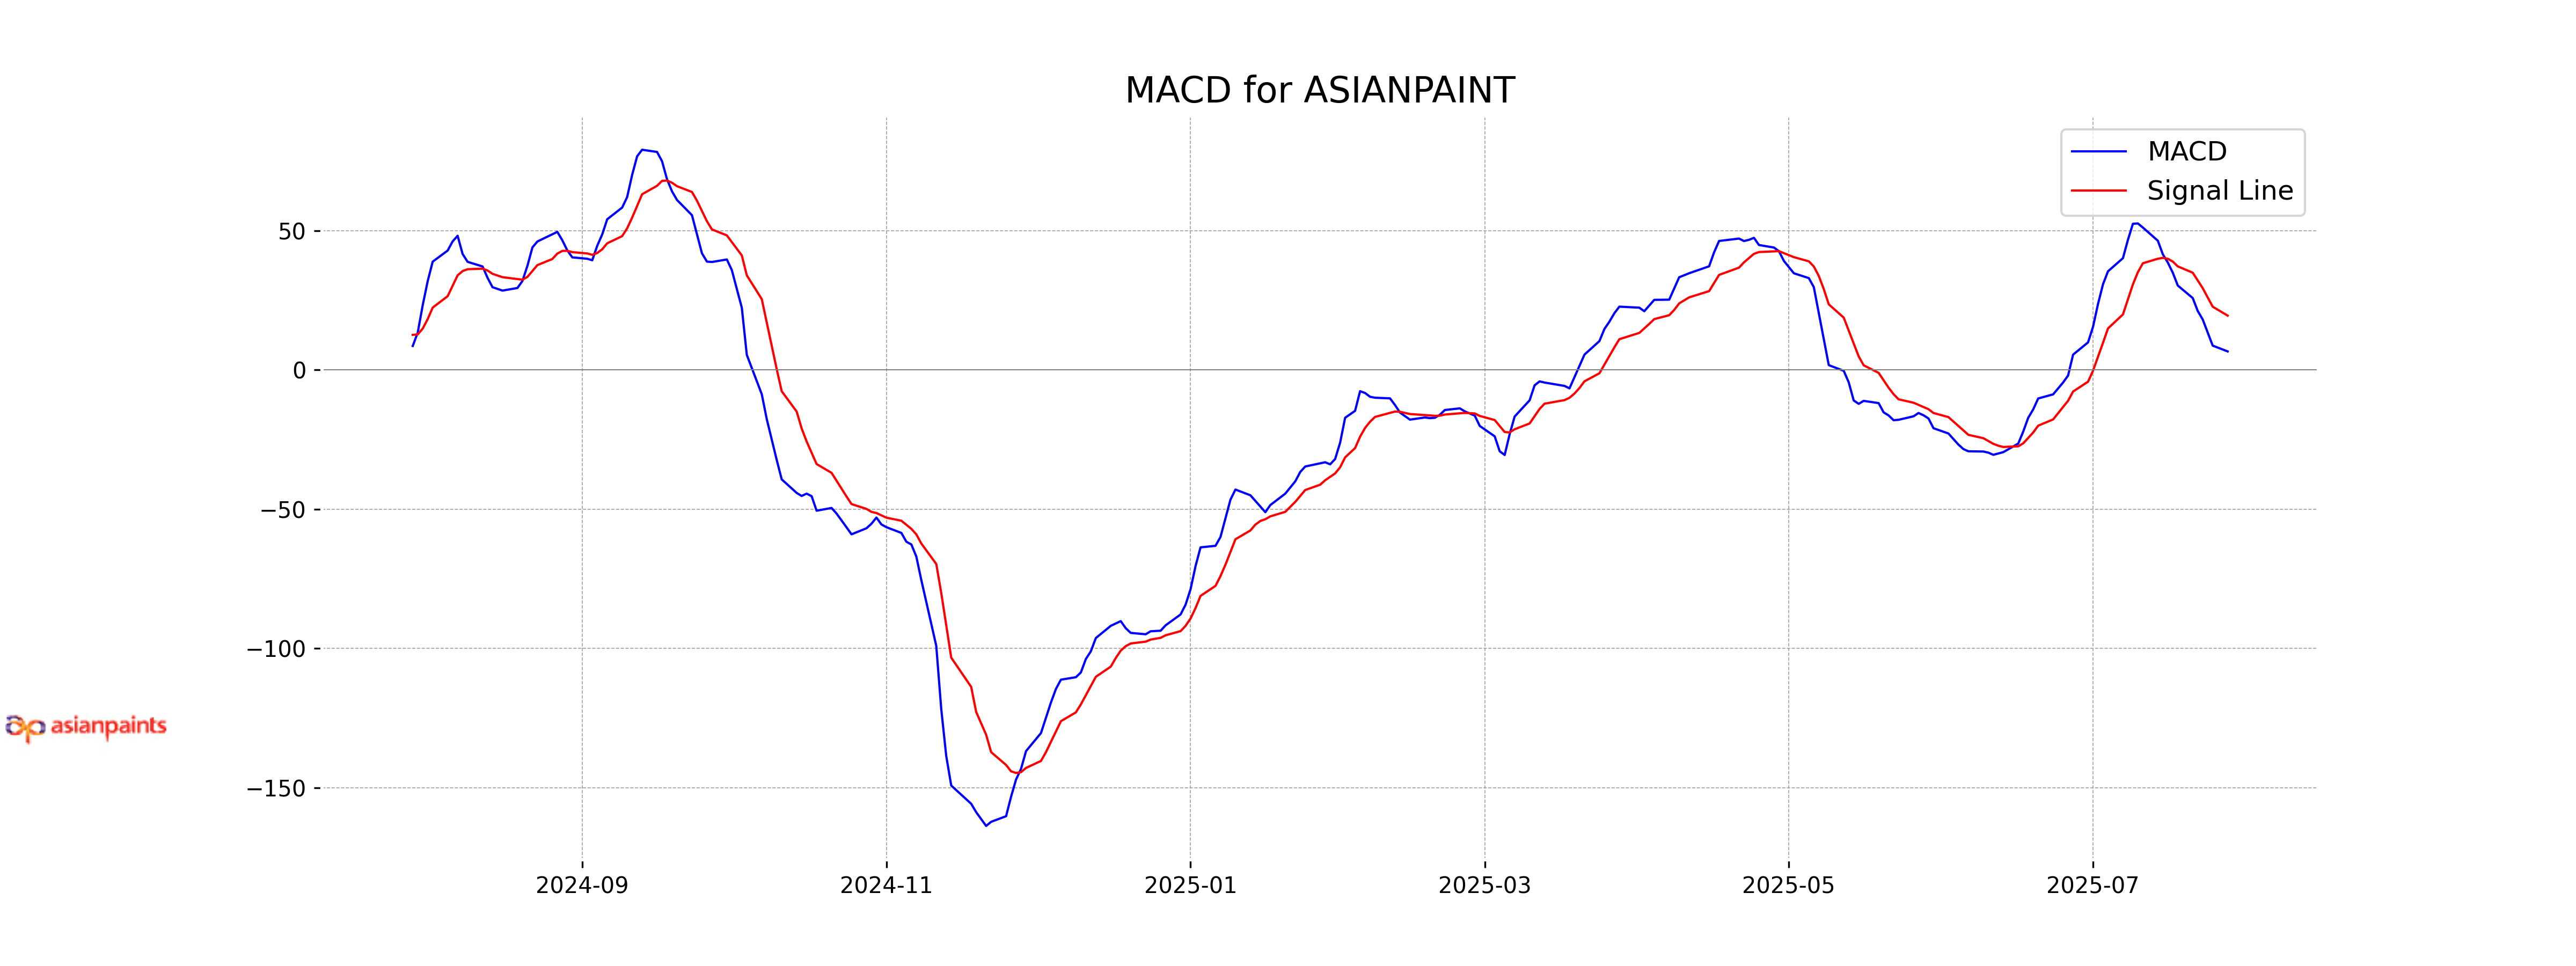
Moving Averages Trend (MACD)
MACD Analysis for Asian Paints: The MACD value of 6.62 suggests a potential bullish signal as it moves above the signal line value of 19.47. However, monitoring for further confirmation is advised since the MACD is still relatively below the signal line.
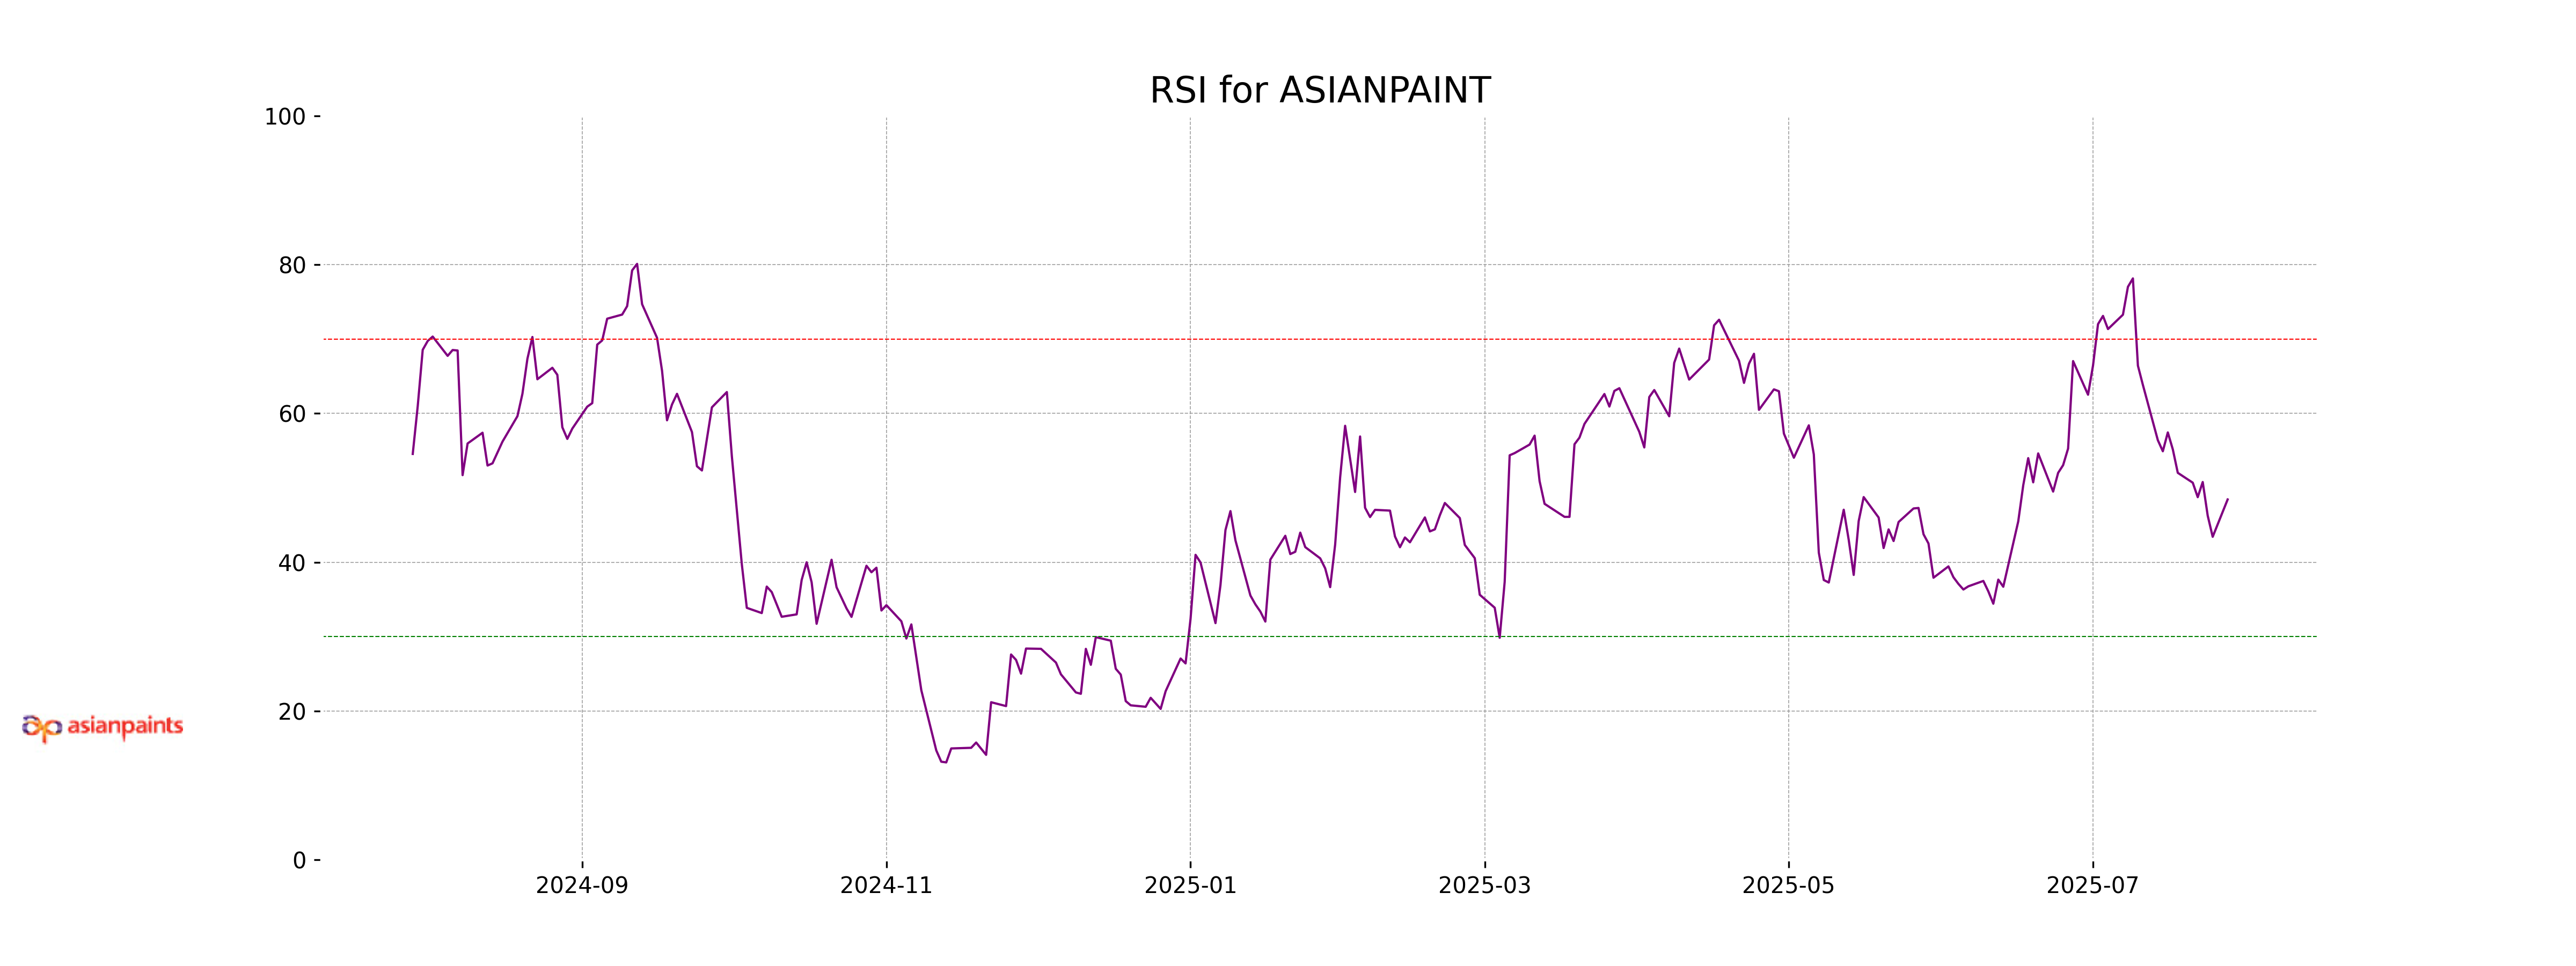
RSI Analysis
RSI Analysis for Asian Paints: The RSI of 48.44 suggests that Asian Paints is in a neutral zone, indicating neither overbought nor oversold conditions. This level implies a balance between buying and selling pressures, providing no strong directional signal.
Analysis for Cipla - July 28, 2025

Cipla demonstrated a notable performance in the latest trading session, opening at 1541.20 and closing higher at 1572.00, marking a 2.58% increase. The company's market capitalization stands at 1.27 trillion INR, supported by strong trading volume nearing 3.8 million shares. The Relative Strength Index (RSI) at 71.72 suggests an overbought condition, while the MACD indicates a positive trend.
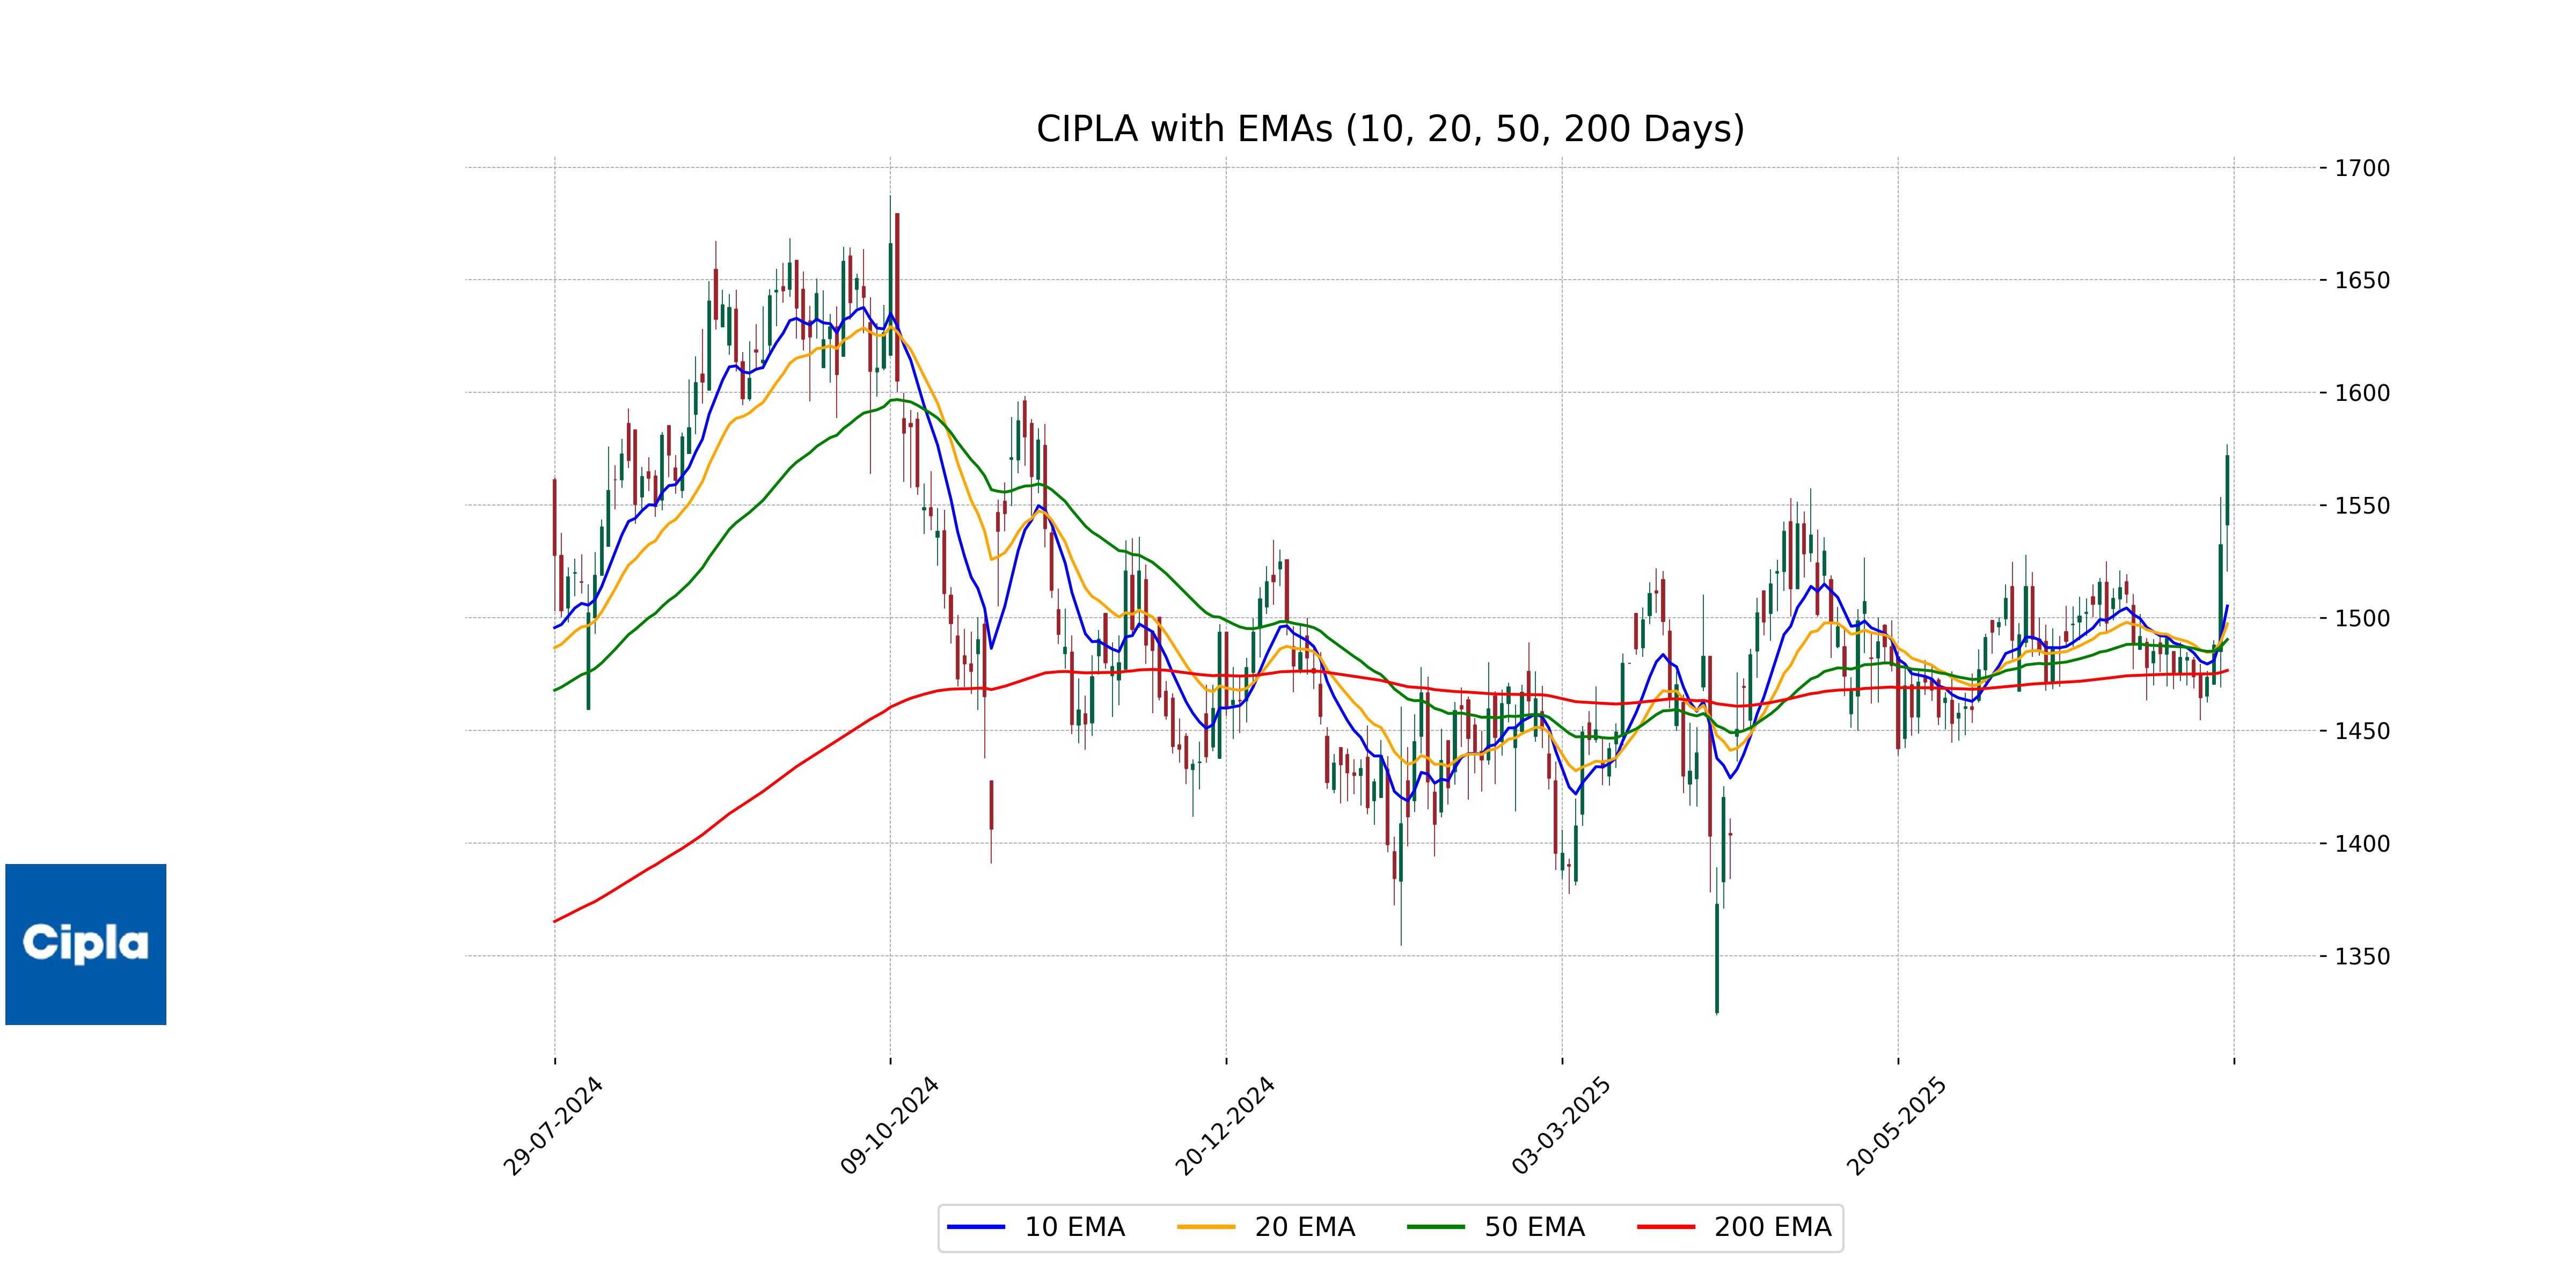
Relationship with Key Moving Averages
Cipla's current closing price of 1572.0 is above its 50-day EMA of 1490.35 and its 200-day EMA of 1476.60, indicating a strong upward trend. Moreover, the price is significantly above the 10-day EMA of 1505.19 and the 20-day EMA of 1497.30, suggesting short-term bullish momentum.
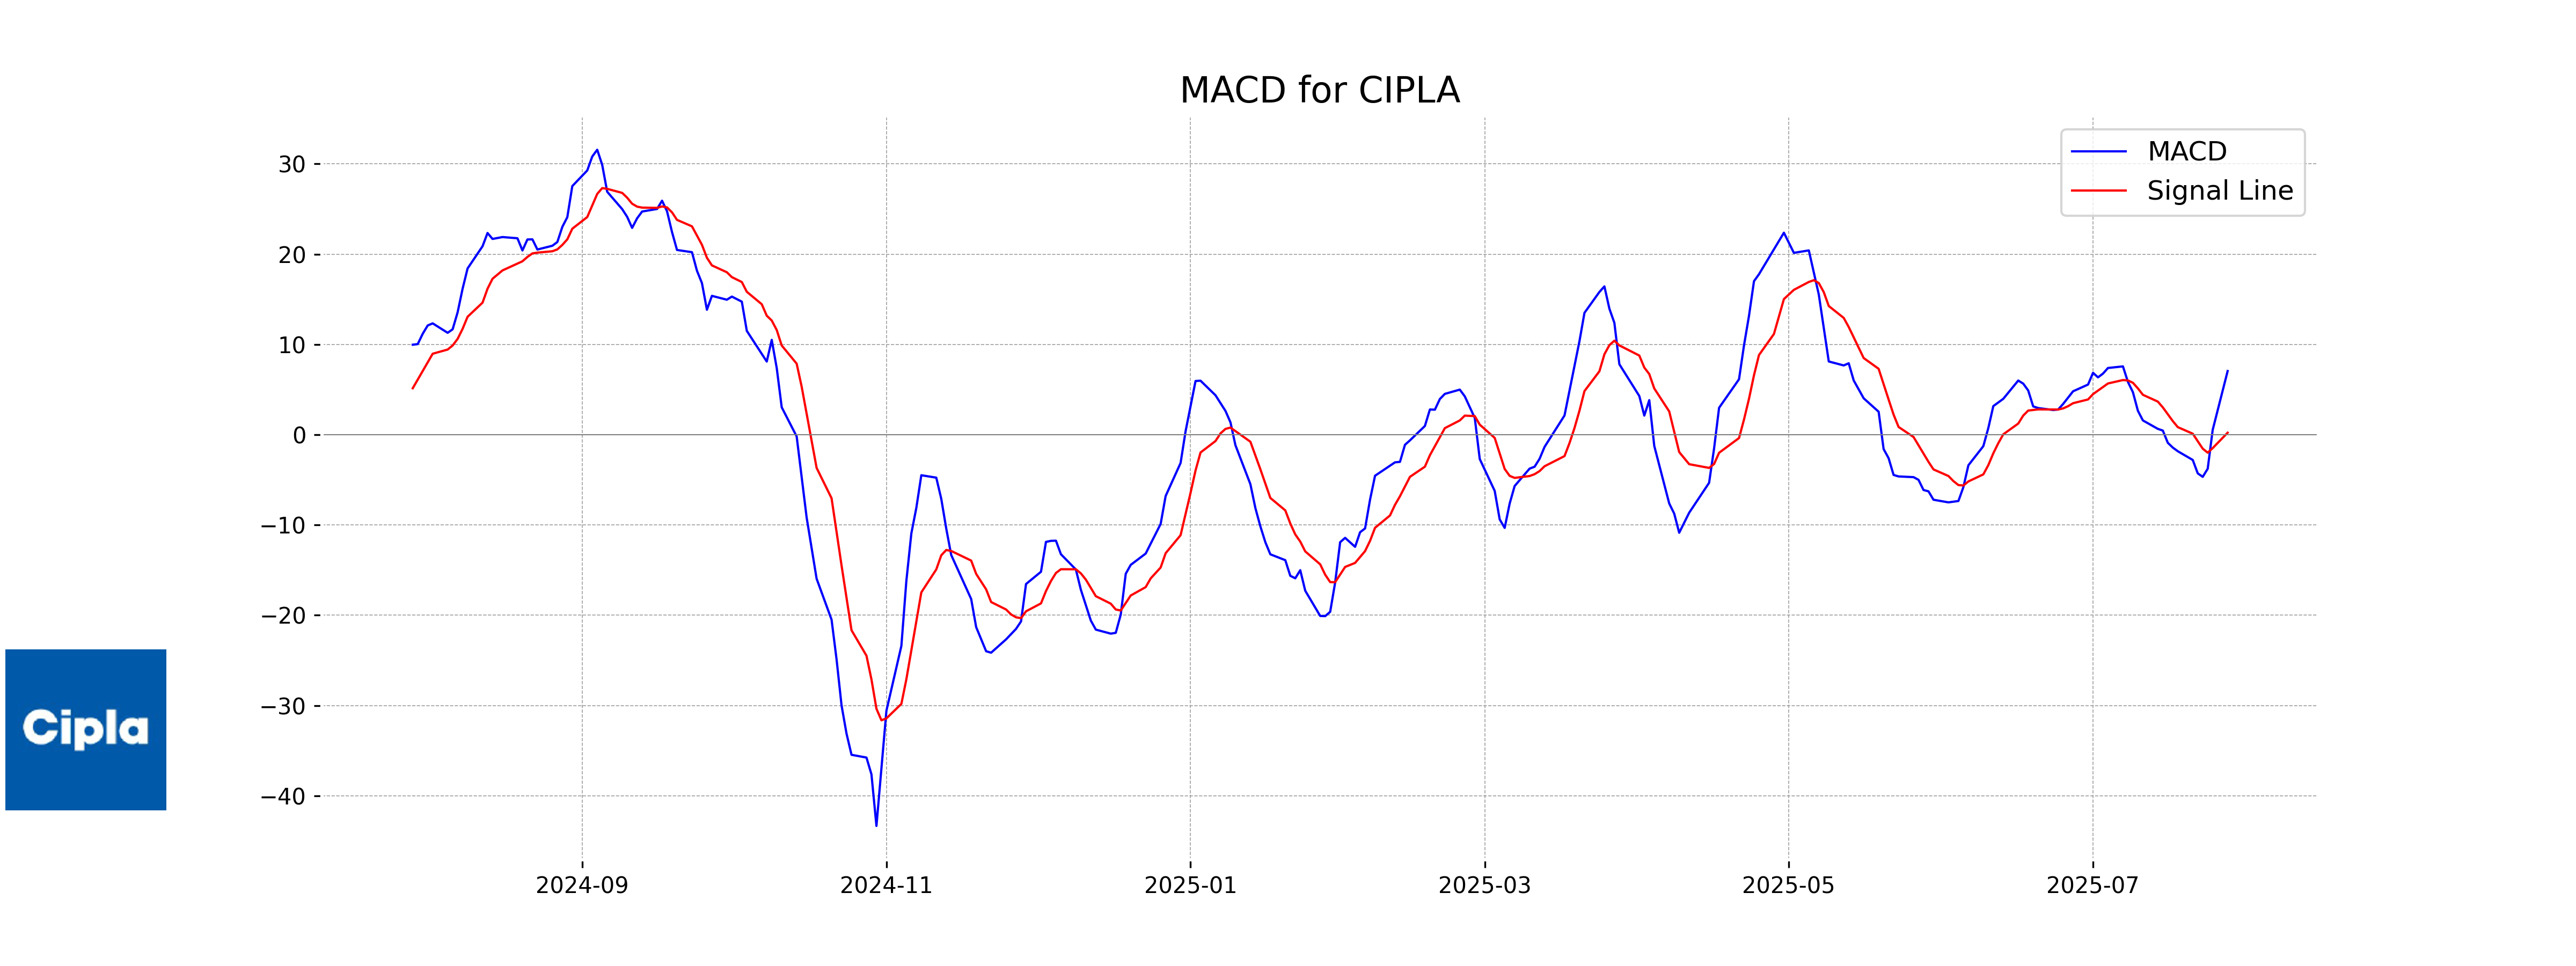
Moving Averages Trend (MACD)
Cipla's MACD Analysis: The MACD value of 7.05 indicates a strong upward momentum in the stock price, as it is significantly above the signal line value of 0.22. This positive MACD crossover suggests a bullish trend, indicating potential for further price appreciation.
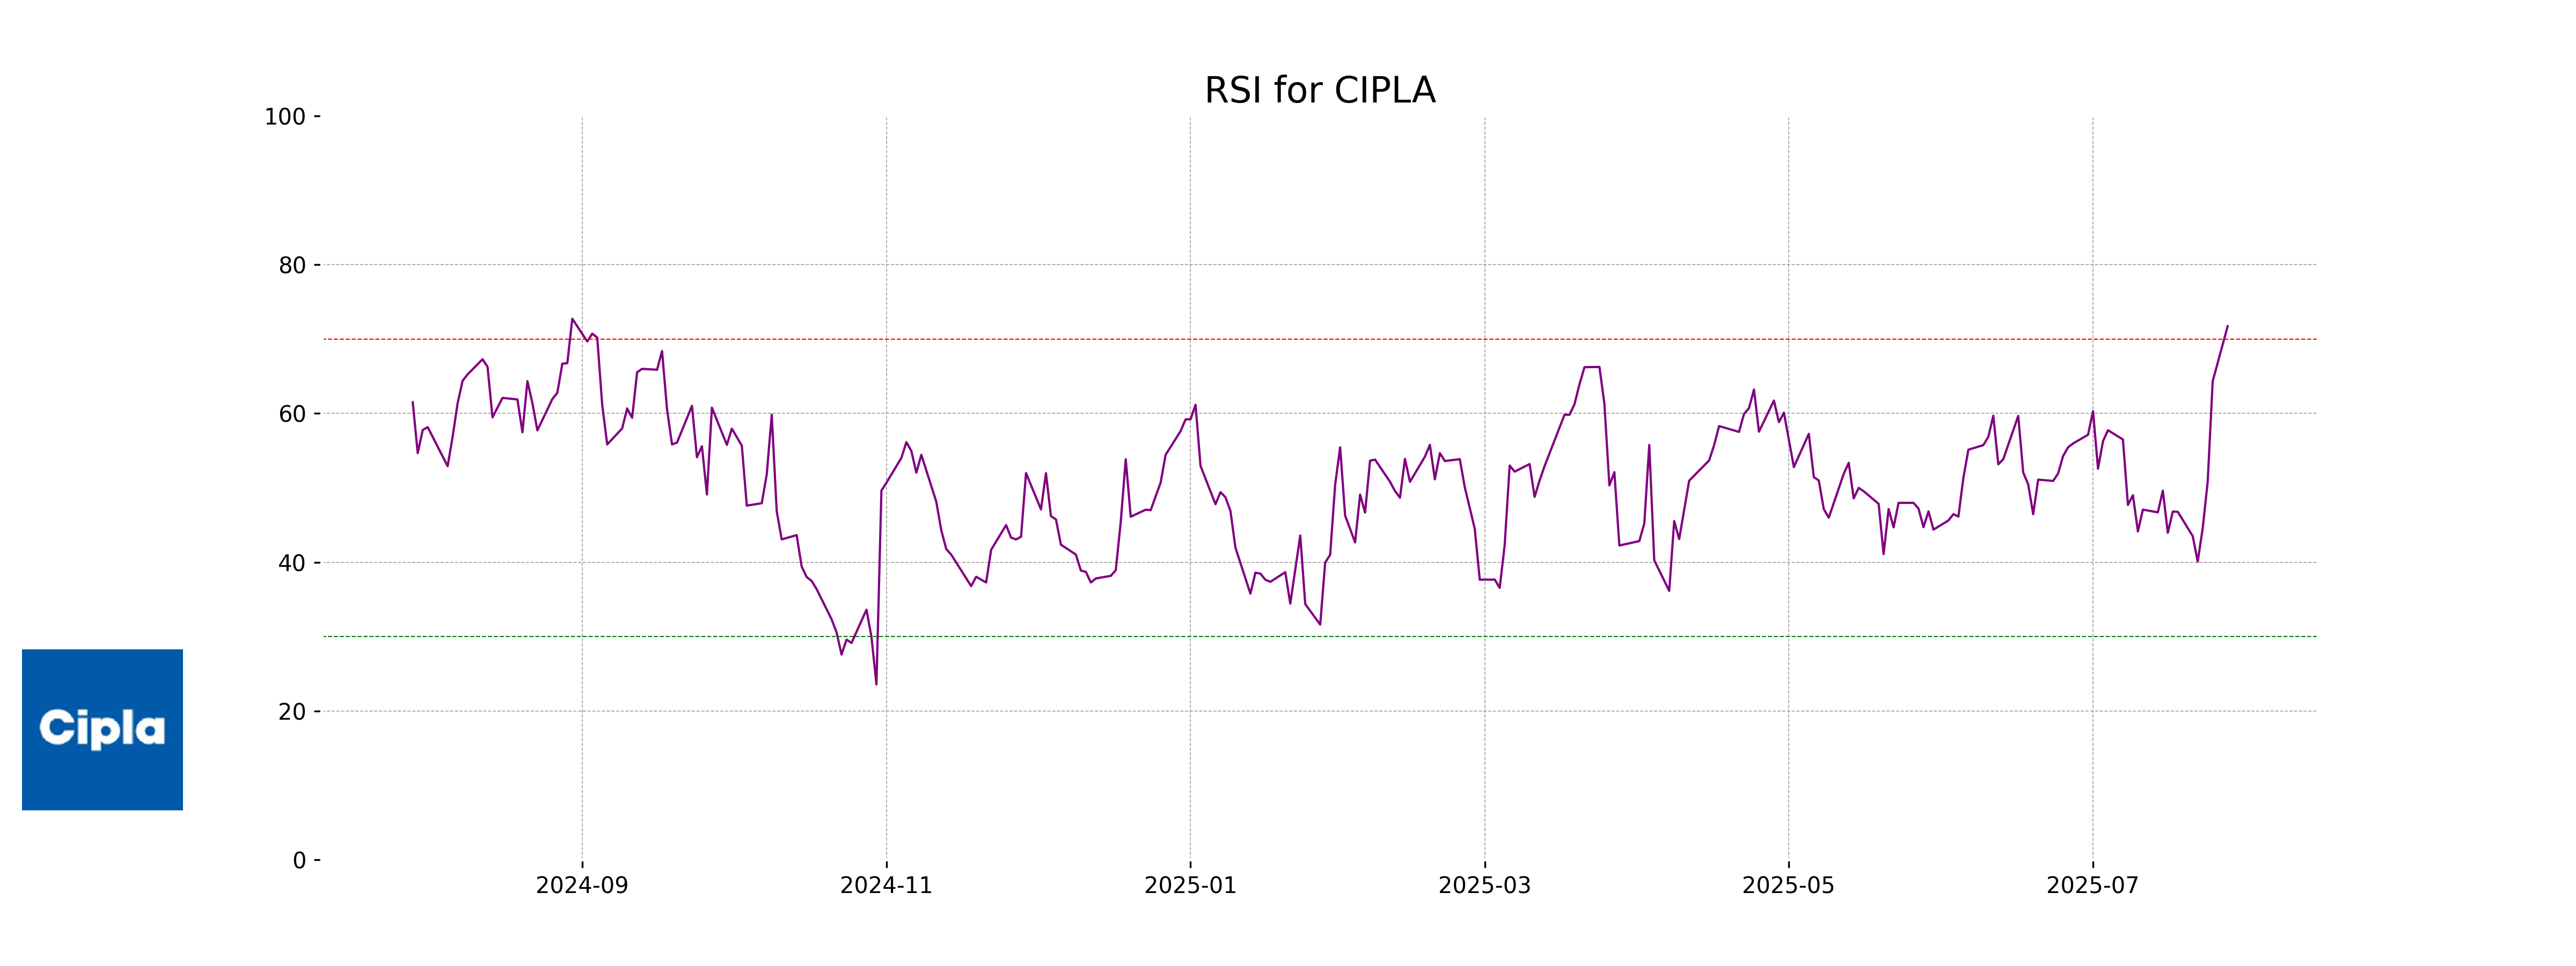
RSI Analysis
The Relative Strength Index (RSI) for Cipla is 71.72, which suggests that the stock is in overbought territory. This high RSI value indicates that the stock may be experiencing upward momentum, but it could also be a signal for potential price correction or consolidation in the near term.
Analysis for Hero MotoCorp - July 28, 2025

Hero MotoCorp Performance: Hero MotoCorp opened at 4215.5 and closed at 4291.1, marking a positive change of 1.43% from its previous close of 4230.7. The stock traded with a volume of 462,805 shares. With a market cap of approximately 873.77 billion INR, the PE Ratio stands at 19.62, and the EPS is 218.73. In terms of technical indicators, the RSI is 52.23, suggesting a relatively balanced momentum. Hero MotoCorp is a key player in the Consumer Cyclical sector, specifically in the Auto Manufacturers industry, operating out of India.
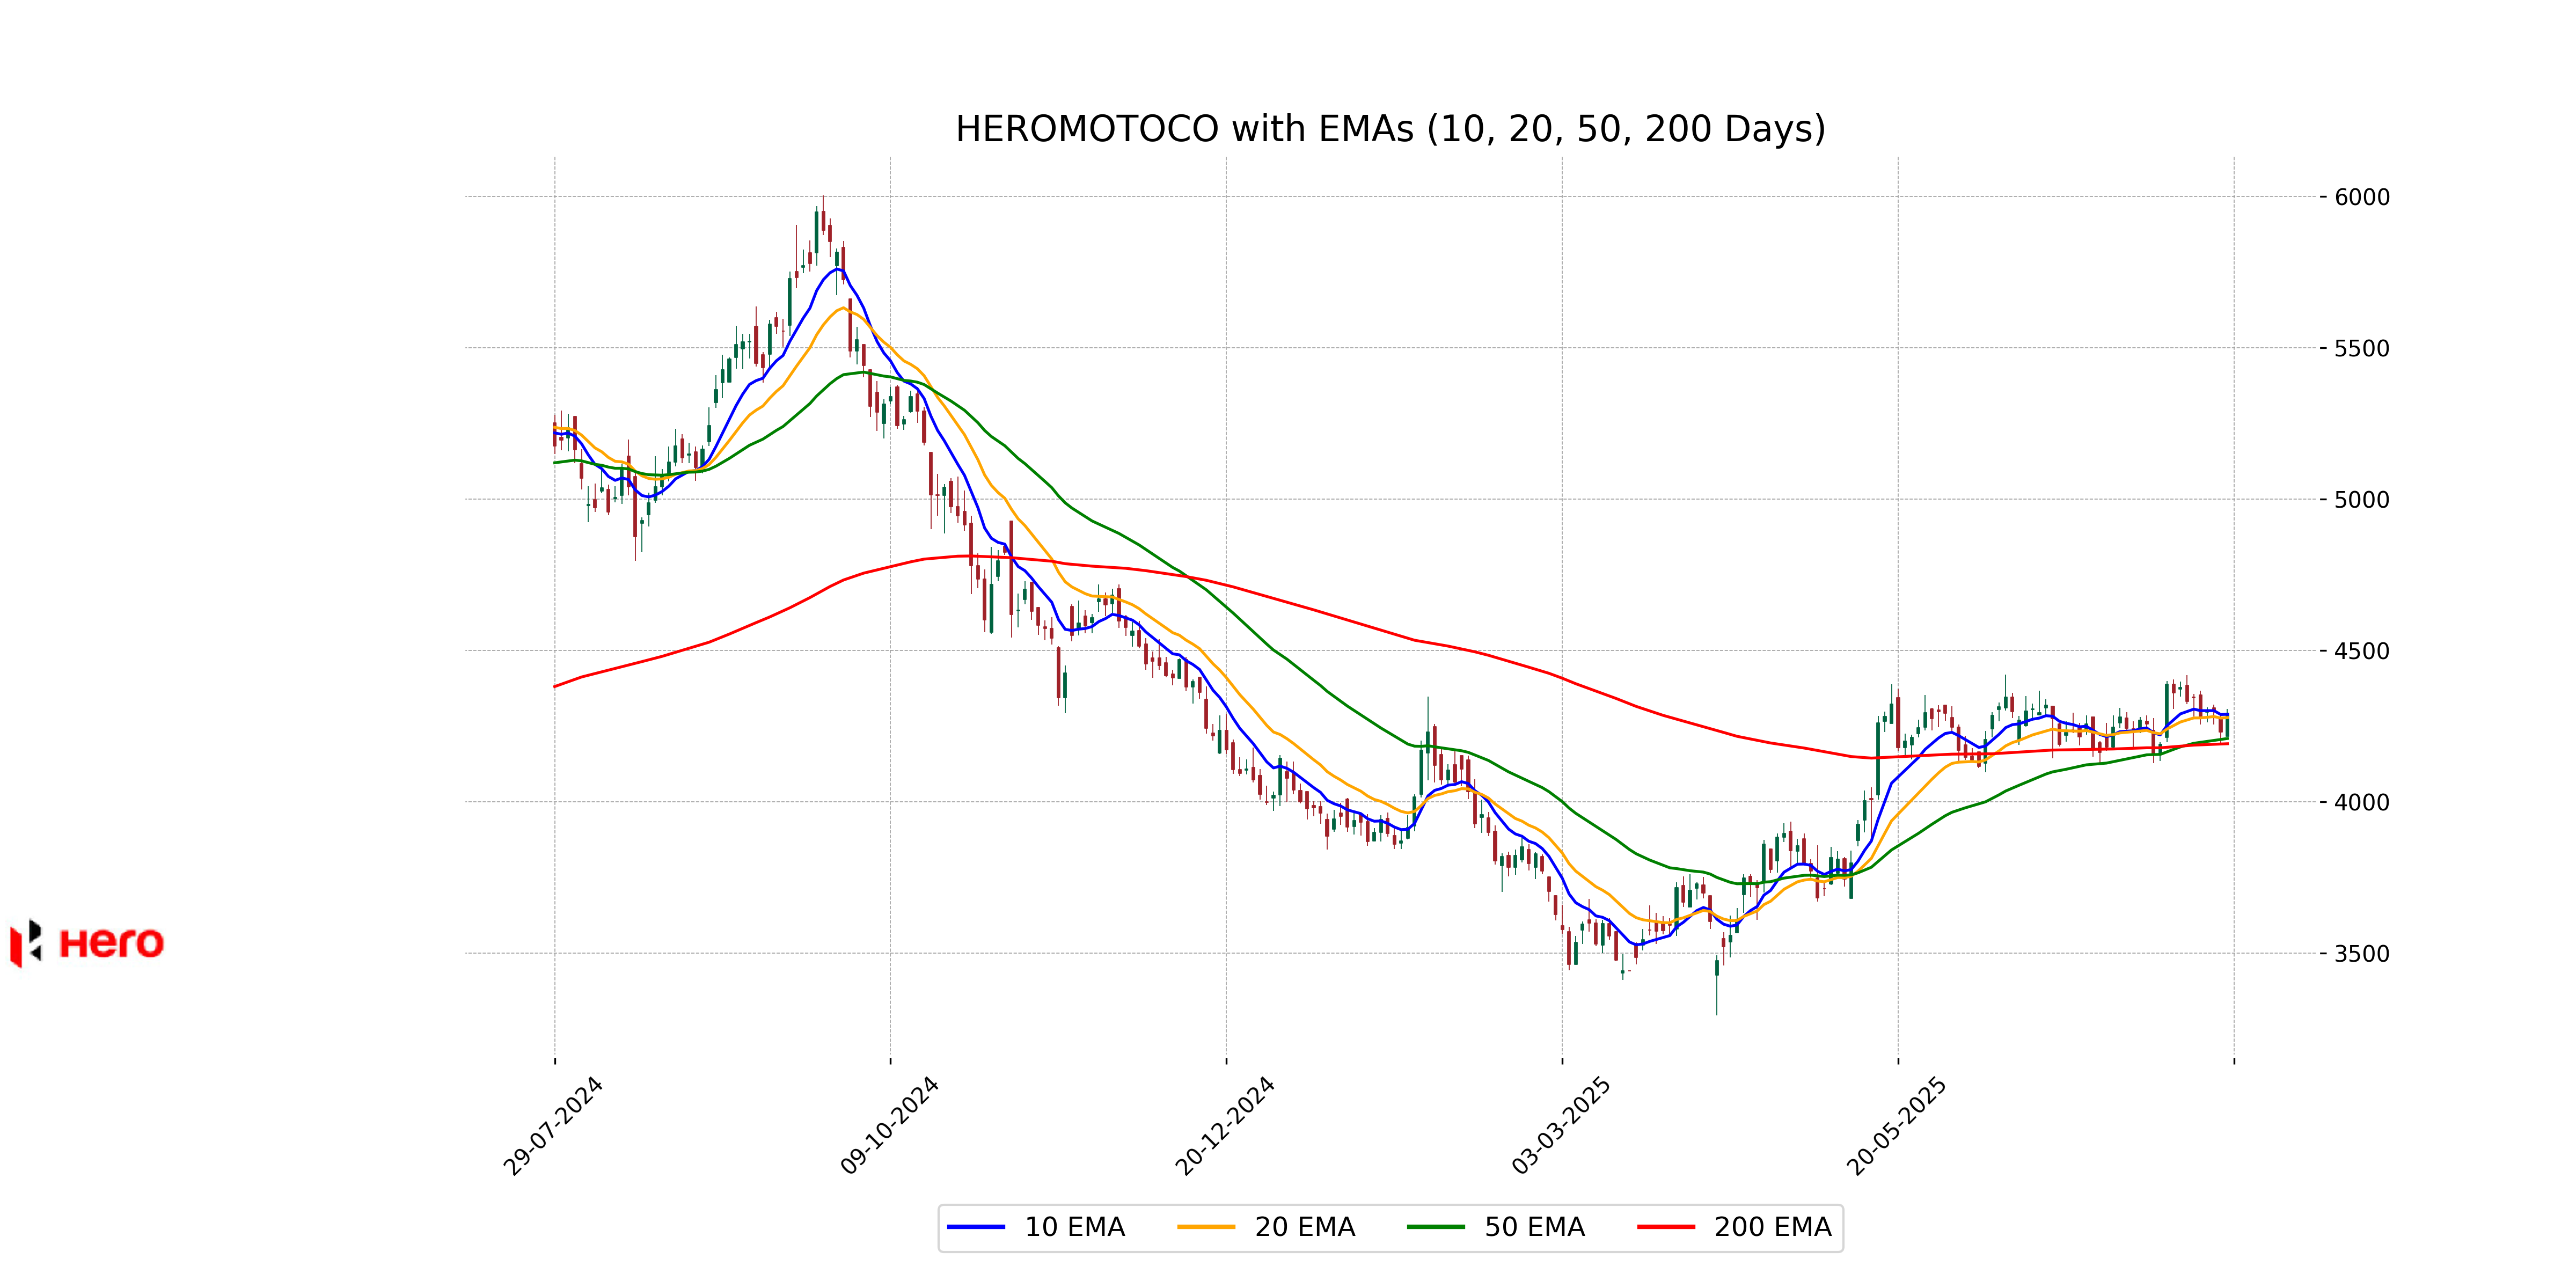
Relationship with Key Moving Averages
Hero MotoCorp closed at 4291.10, above both its 50 EMA of 4208.42 and 200 EMA of 4191.14, indicating a recent upward momentum. It also closed slightly above its 10 EMA of 4288.39 and 20 EMA of 4277.50, suggesting short-term strength.
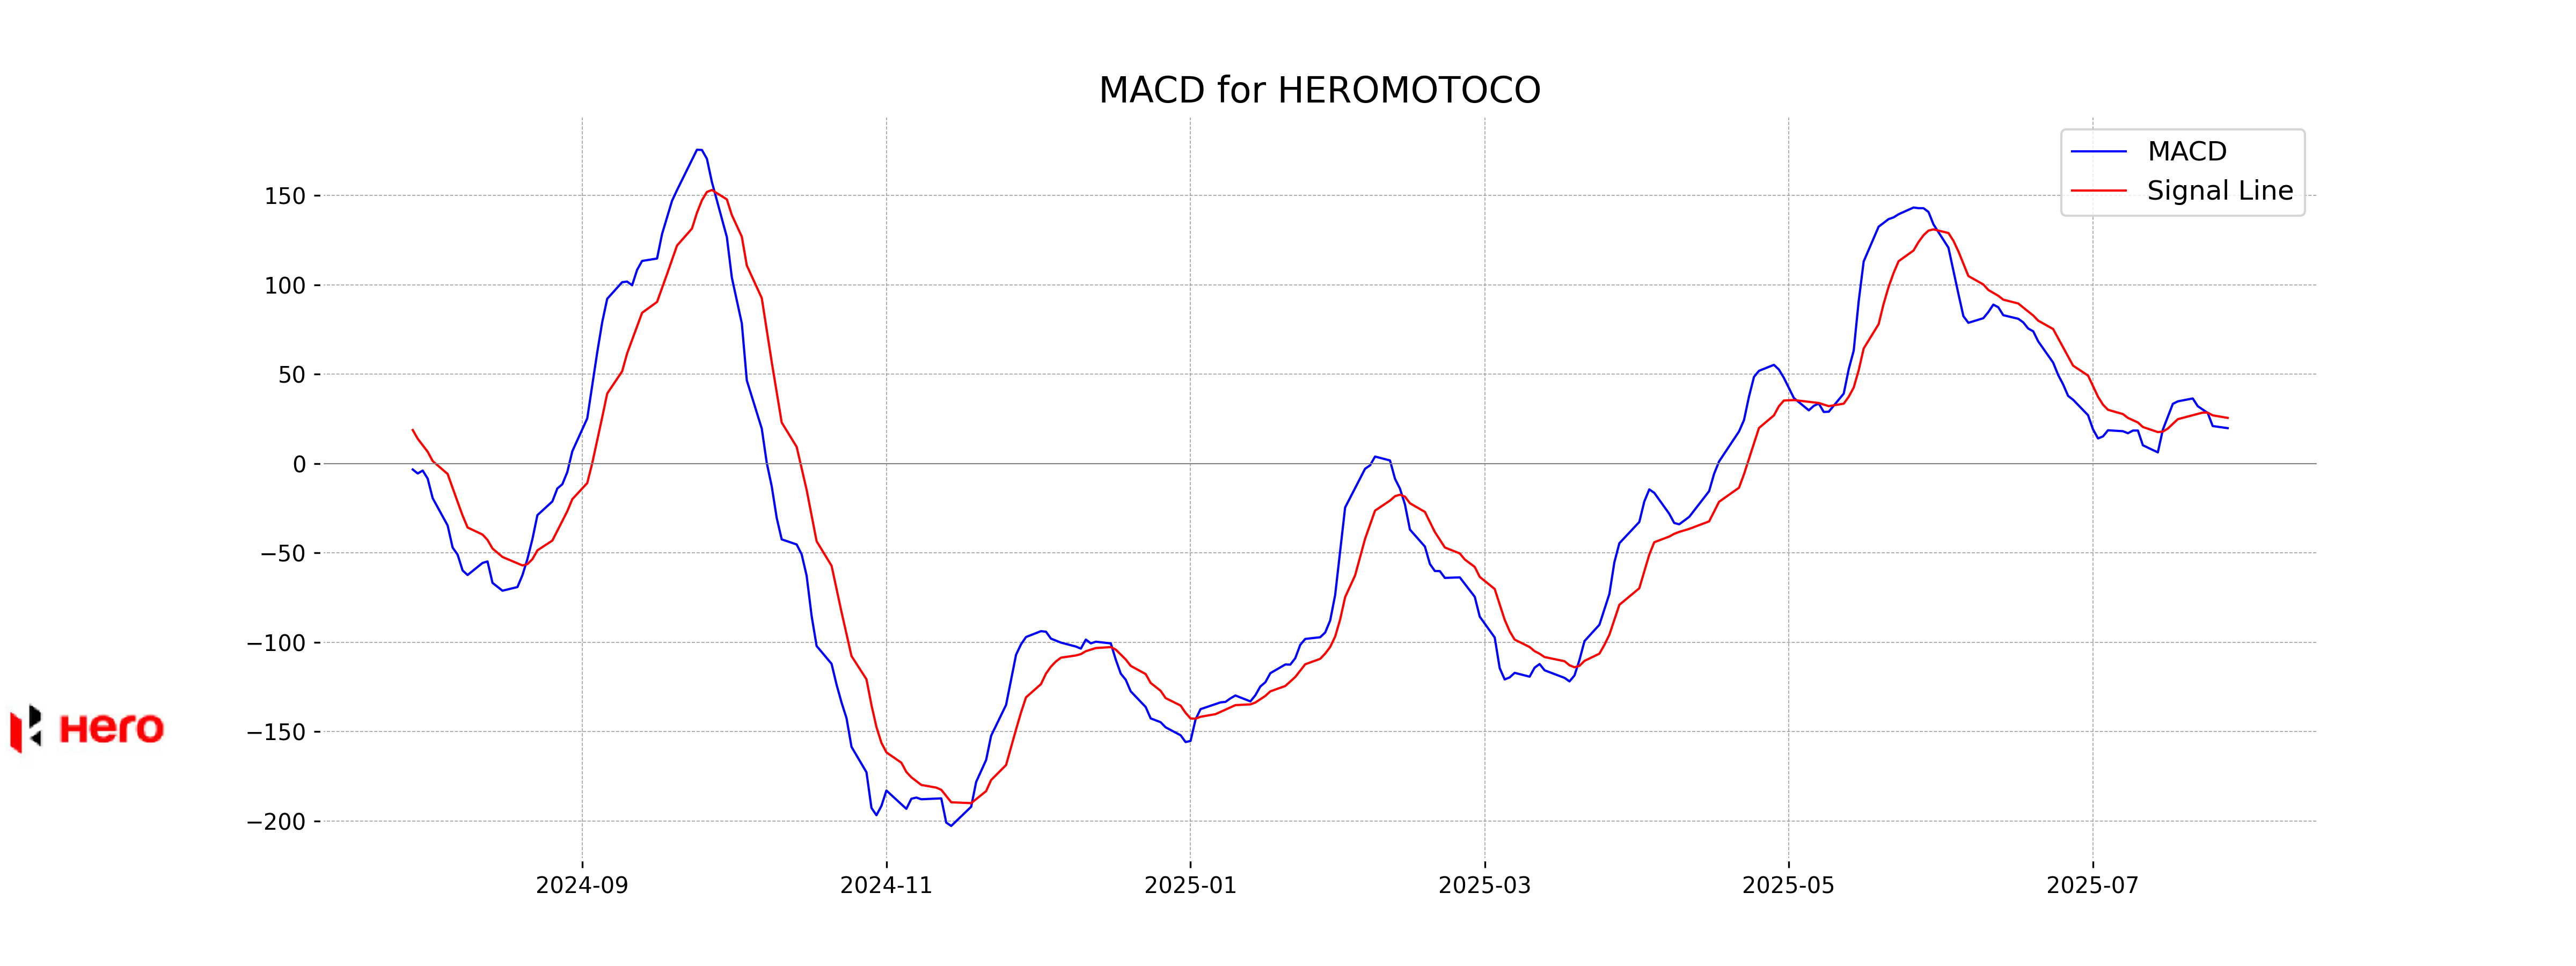
Moving Averages Trend (MACD)
MACD Analysis for Hero MotoCorp: The current MACD value is 19.84, which is below the signal line value of 25.58, indicating a bearish momentum. This suggests that the stock may be experiencing a downward trend, and investors might want to monitor for further signals or potential reversals.
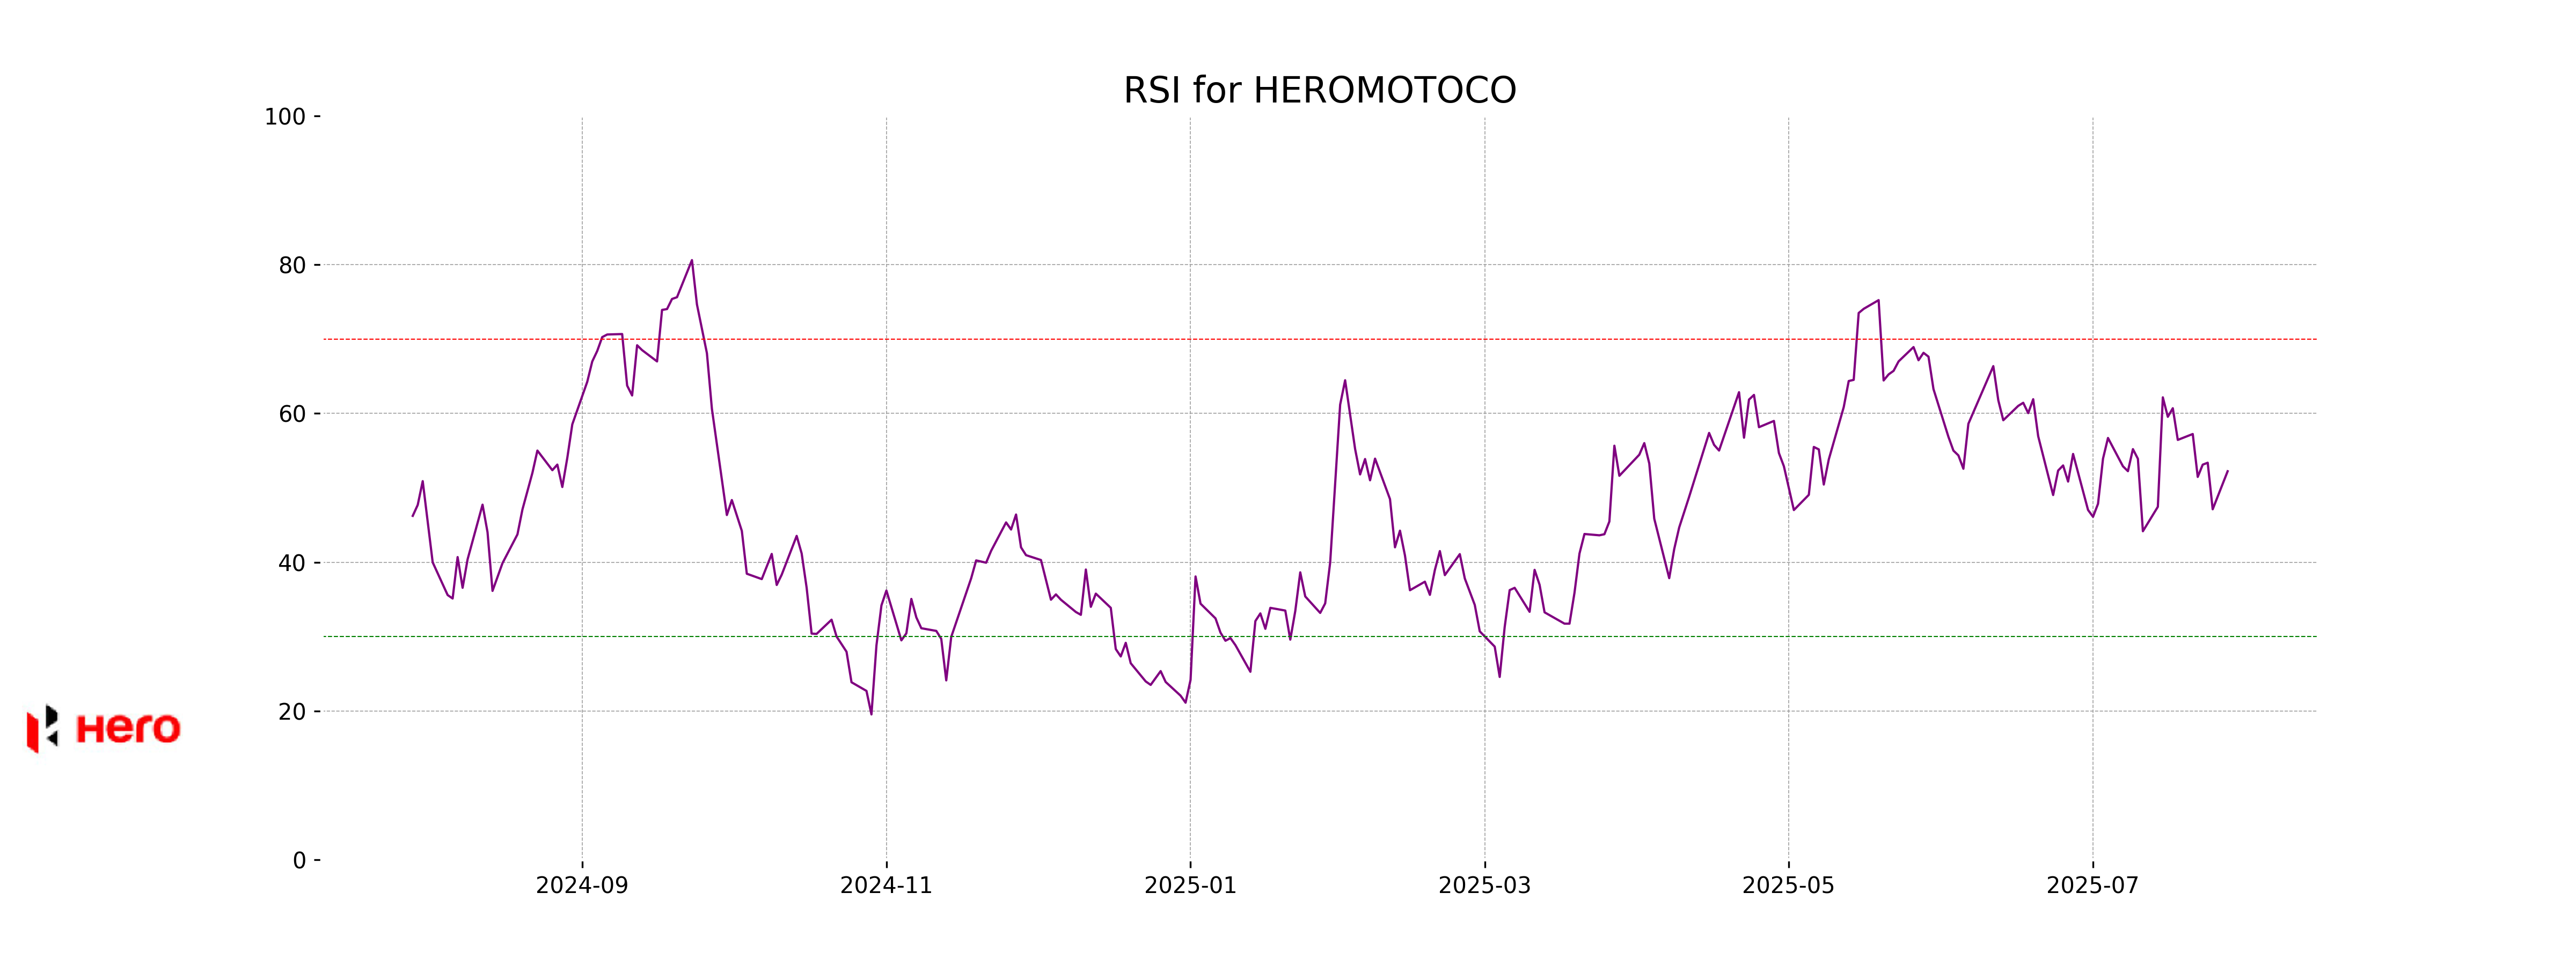
RSI Analysis
The Relative Strength Index (RSI) for Hero MotoCorp is 52.23, which is typically considered a neutral zone. This indicates that the stock is neither overbought nor oversold at the moment, suggesting balanced momentum.
Analysis for Hindustan Unilever - July 28, 2025

Hindustan Unilever showed a positive performance, with its stock price increasing by 1.08% to close at 2441.60. The stock's volume reached 987,847, indicating healthy market activity. Positioned within the consumer defensive sector, particularly in household and personal products, Hindustan Unilever sustains a solid market cap and a notable PE ratio.
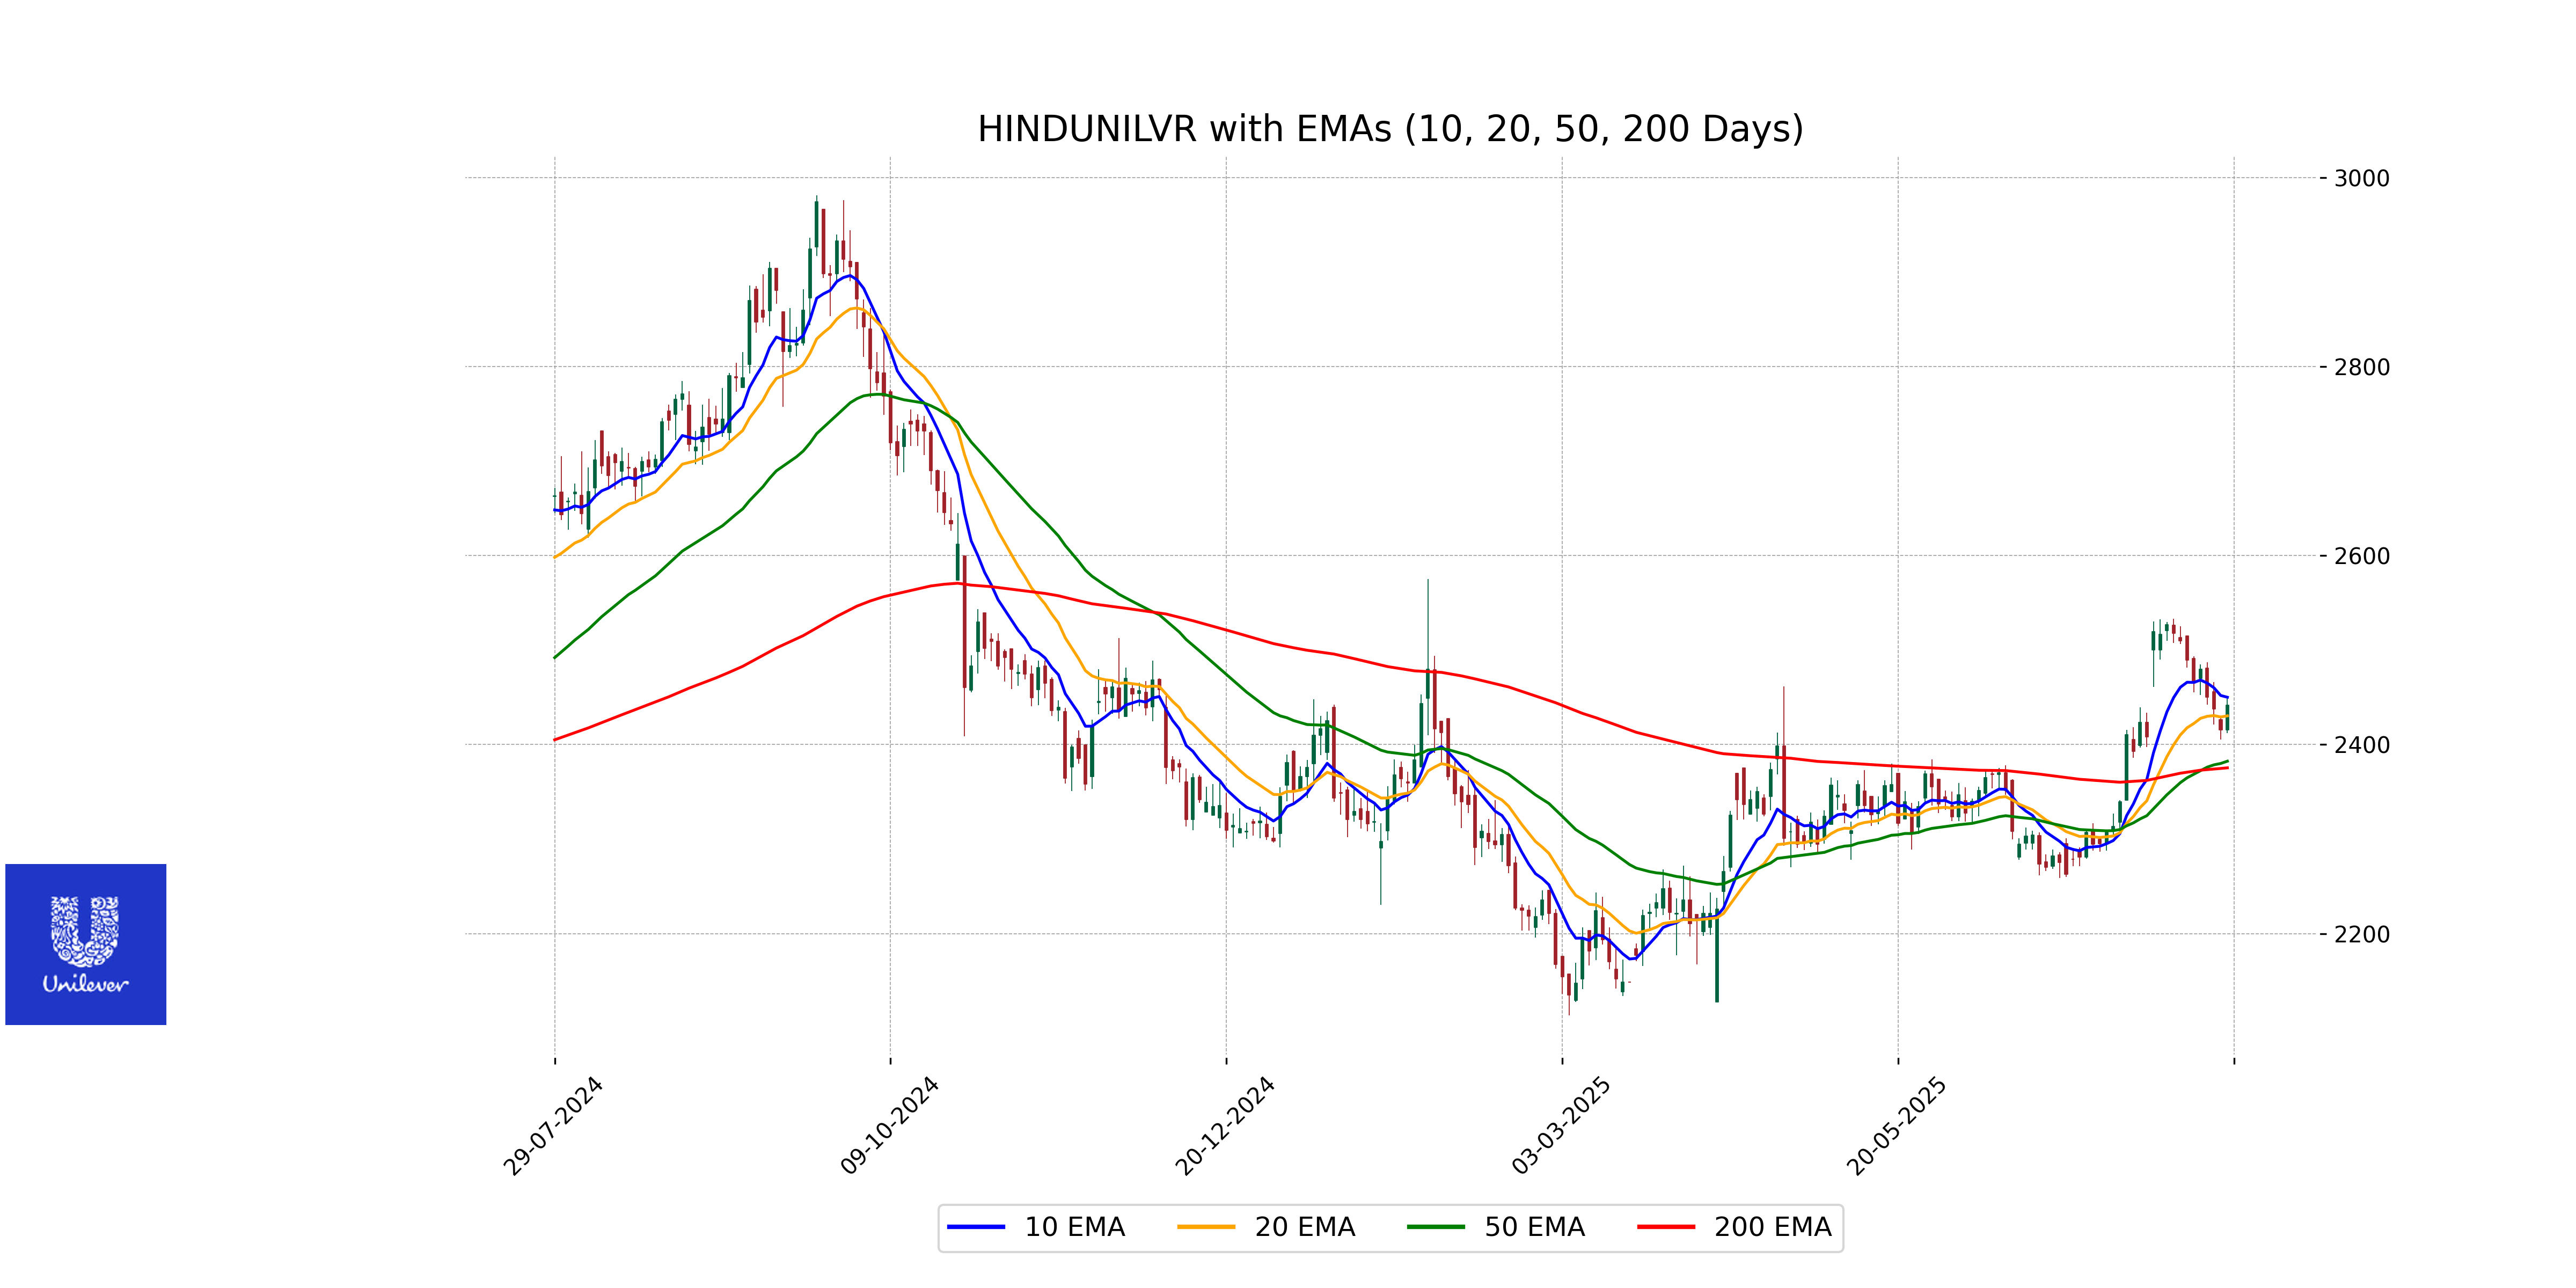
Relationship with Key Moving Averages
Hindustan Unilever's closing price of 2441.60 is currently above its 50-day EMA of 2382.44 and its 200-day EMA of 2375.42, indicating a potential bullish trend in the long term. However, it is slightly below the 10-day EMA of 2450.08, suggesting near-term resistance.
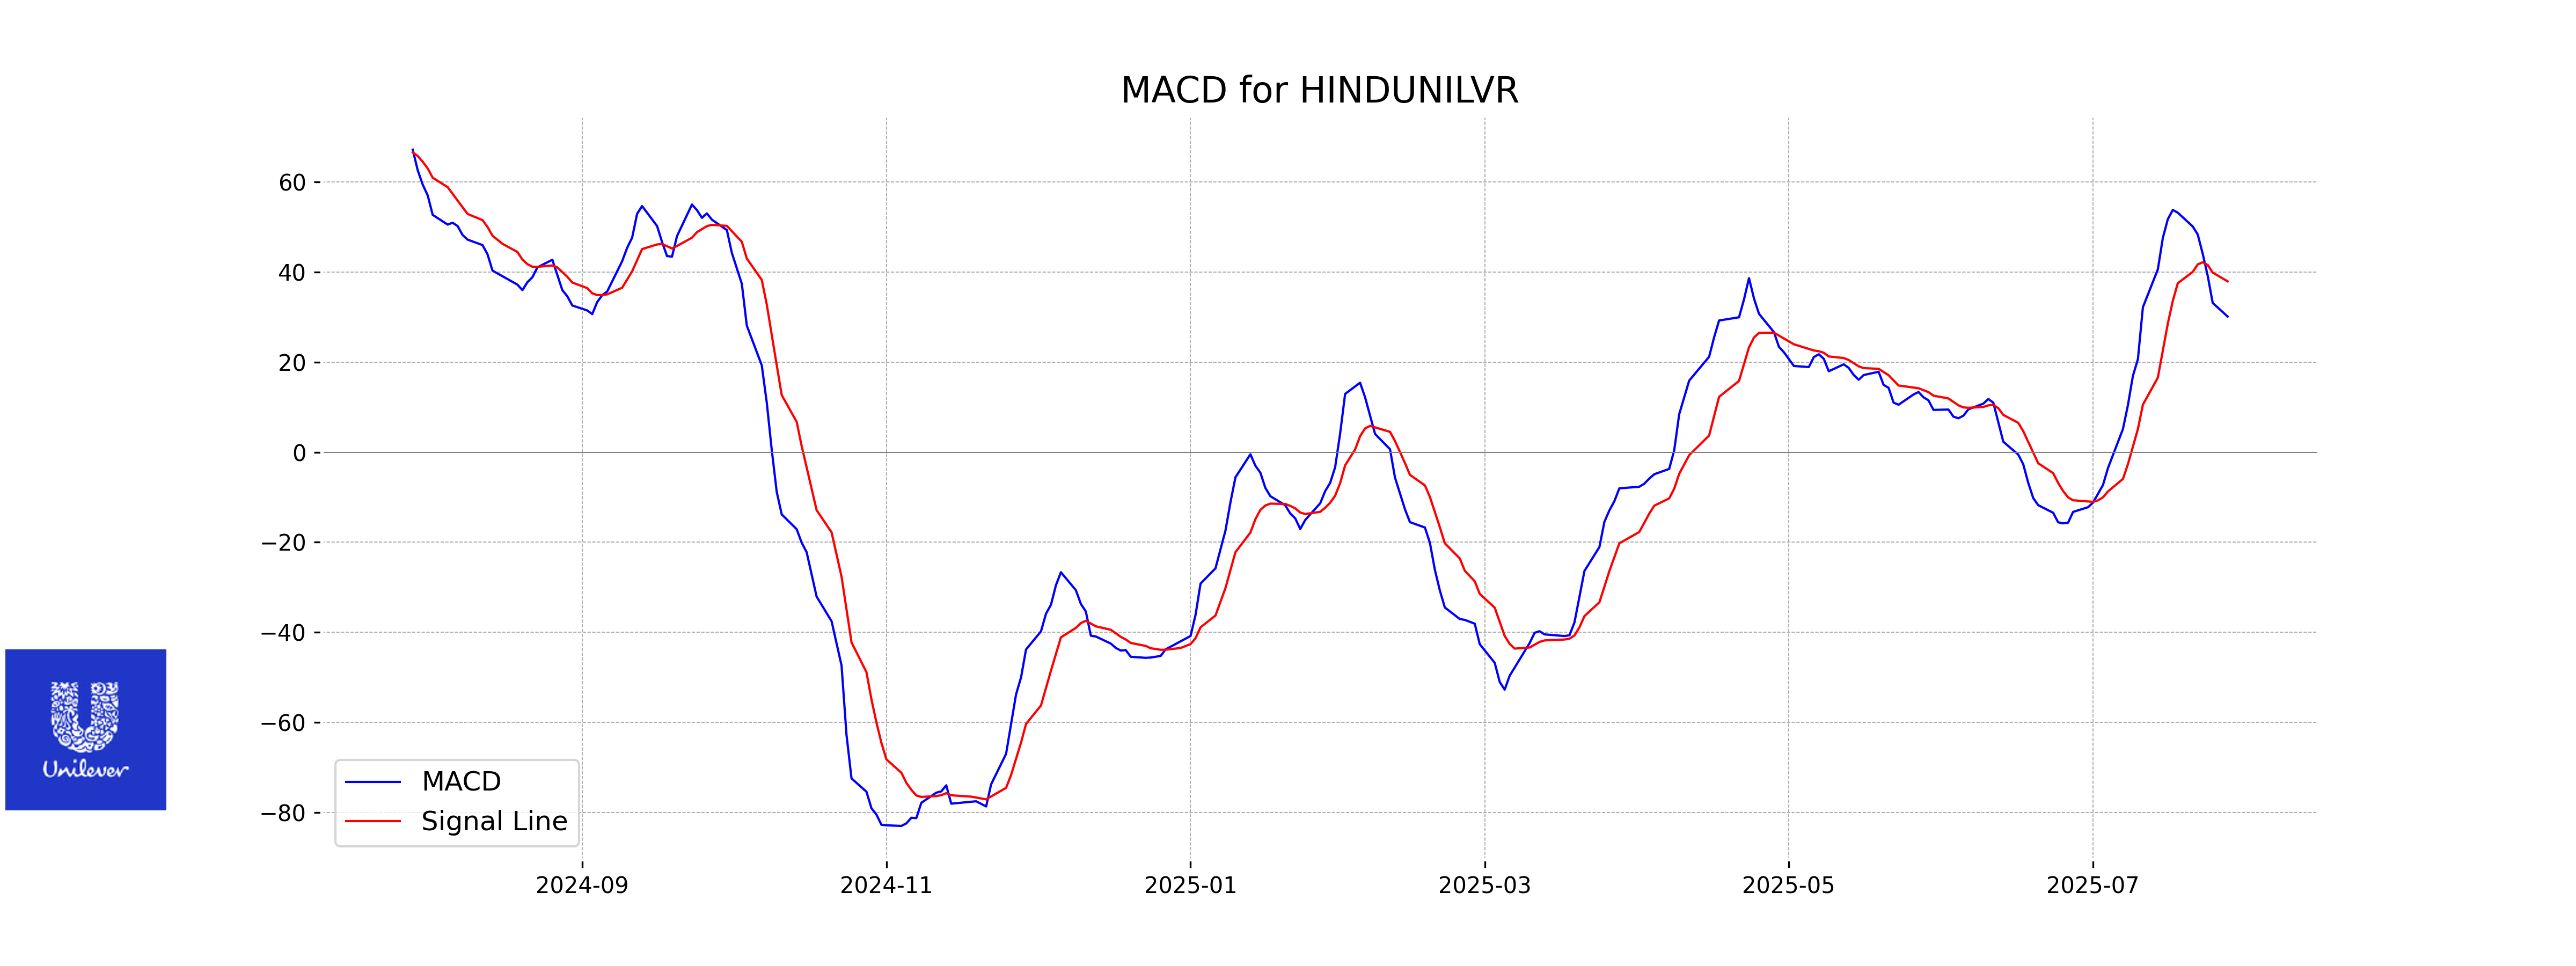
Moving Averages Trend (MACD)
Hindustan Unilever's MACD is currently at 30.13, which is below its MACD Signal line at 37.94. This indicates a potential bearish momentum in the stock. Traders may interpret this as a signal for possible downward movement or a cautionary sign for bullish positions.
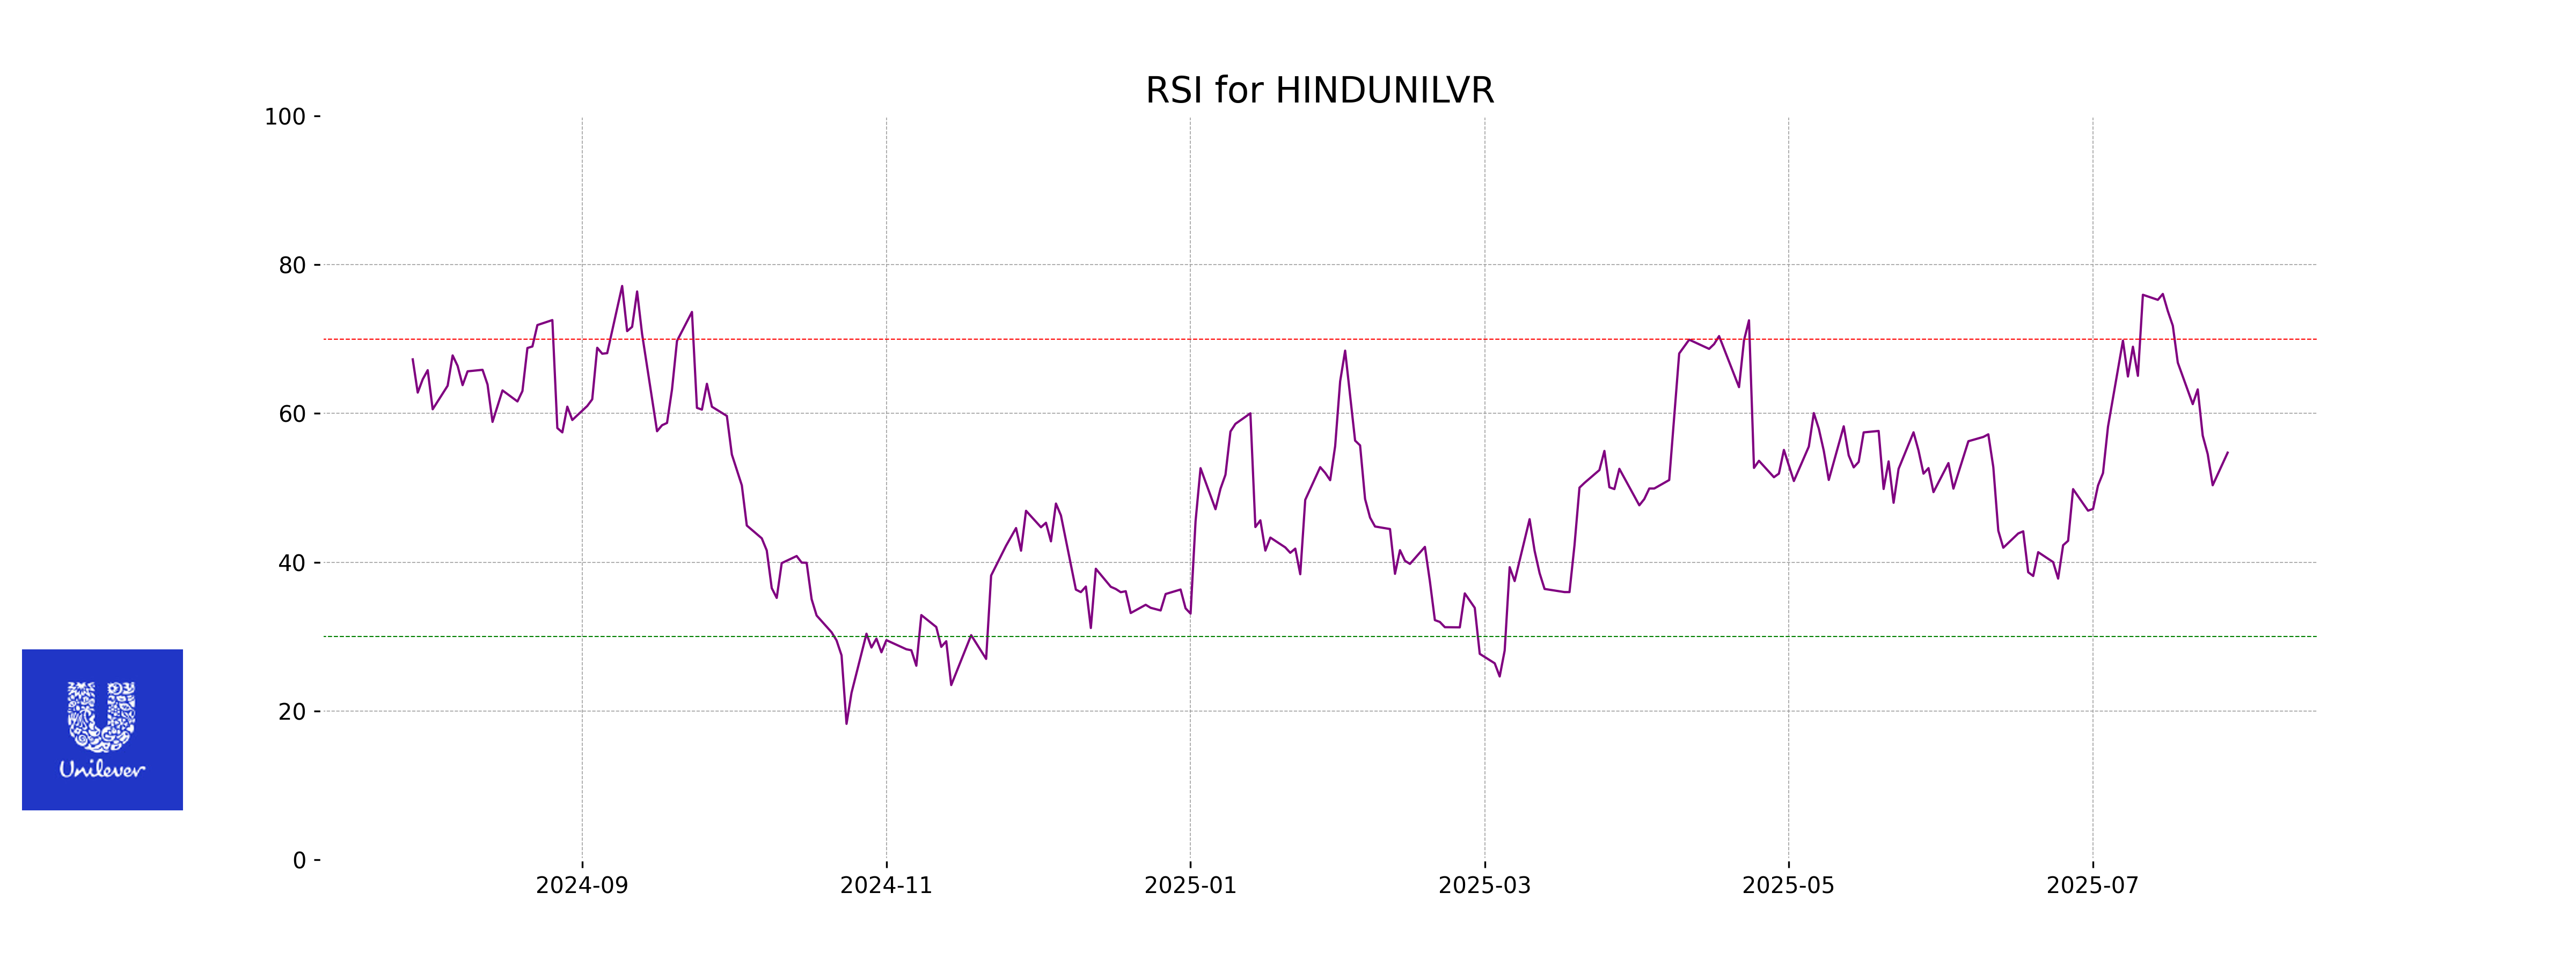
RSI Analysis
Hindustan Unilever currently has an RSI of 54.73, which indicates a neutral momentum in its stock price. This value suggests that the stock is neither overbought nor oversold, providing no strong buy or sell signals but rather indicating a balanced state in its current trading activity.
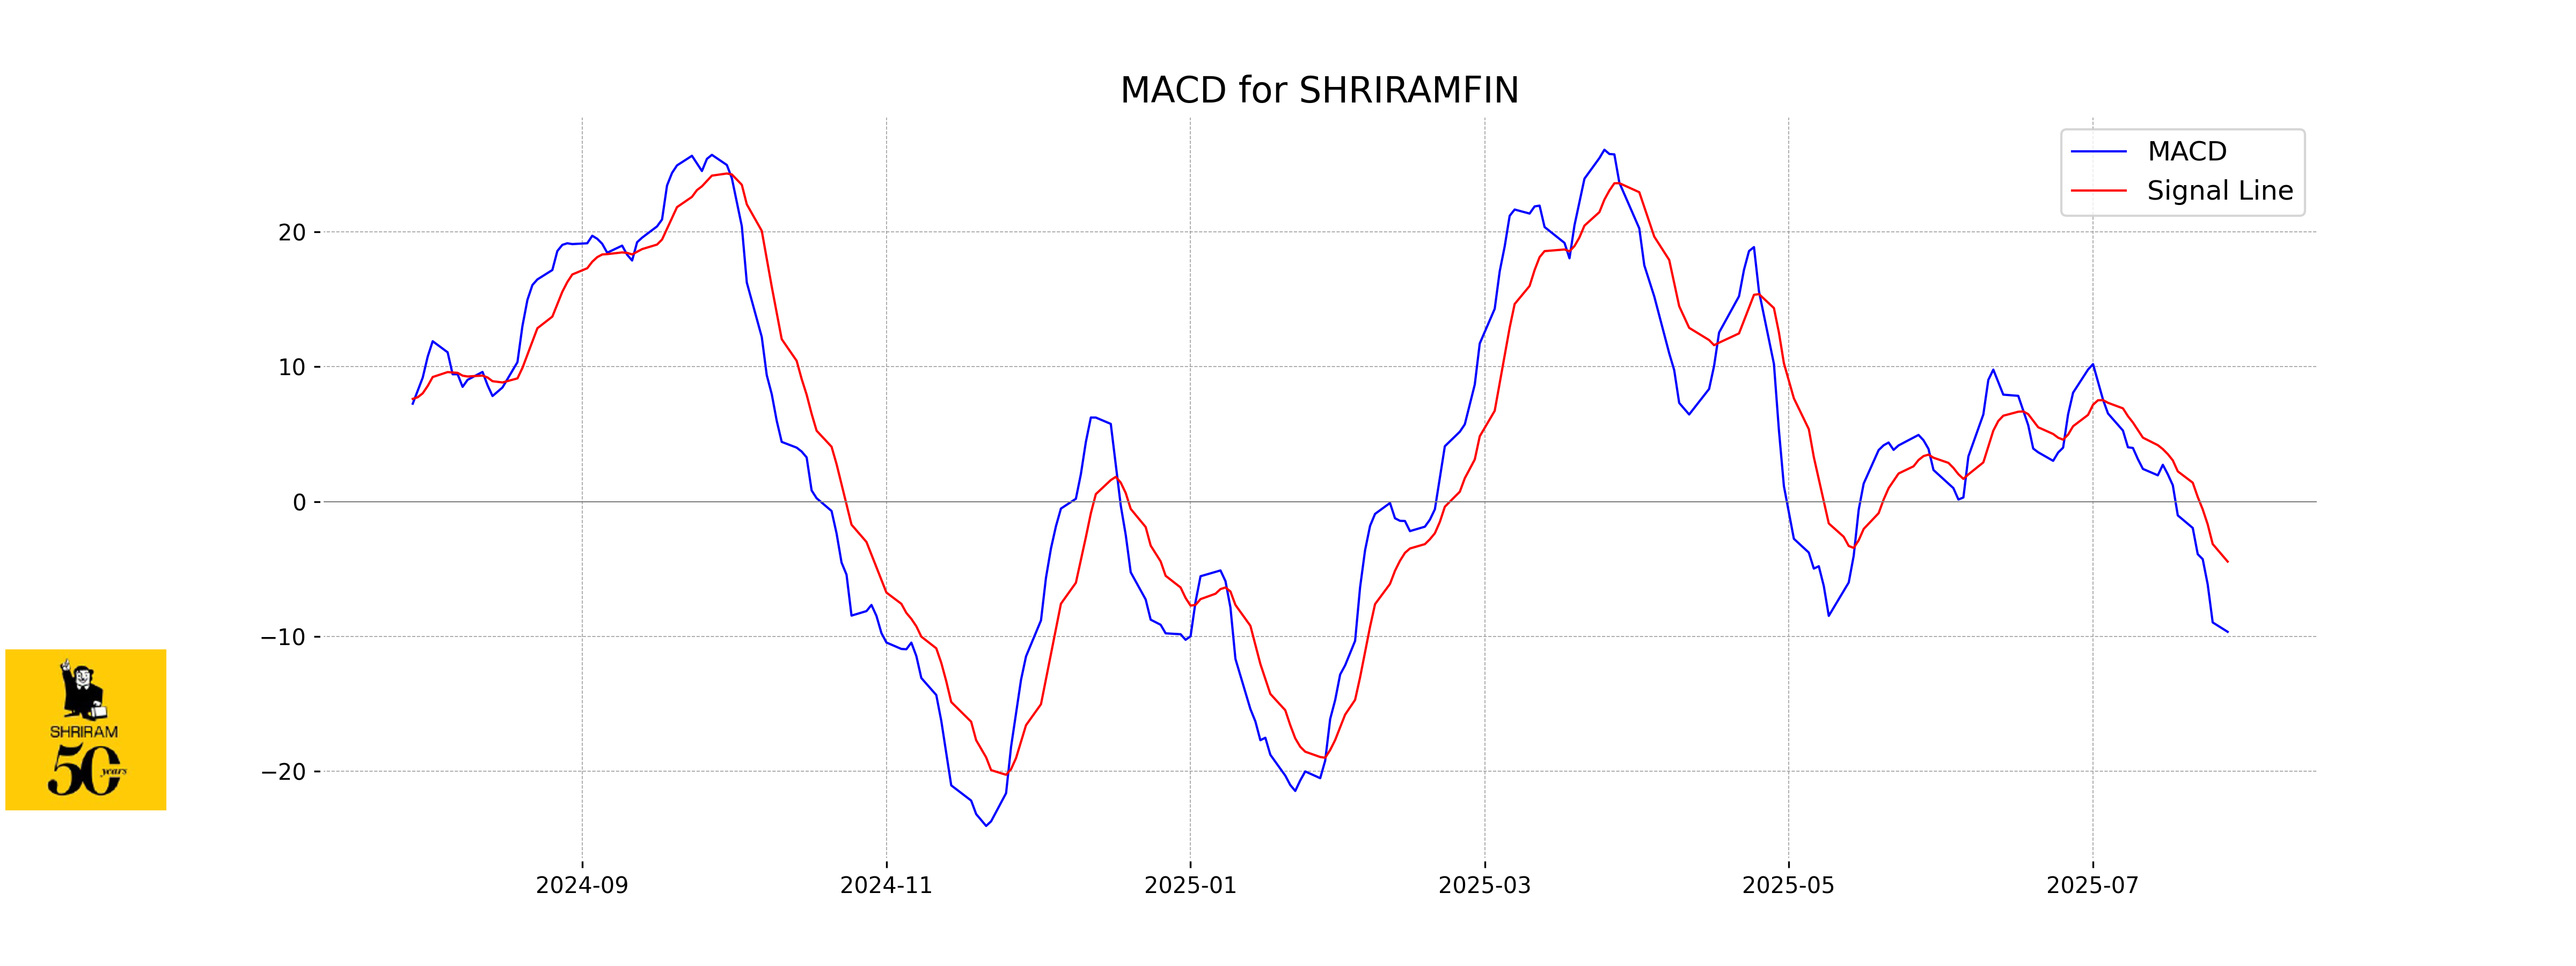
Analysis for Shriram Finance - July 28, 2025

Shriram Finance showed a positive performance with its stock closing at 633.45, reflecting a 2.86% increase from the previous close. Despite an increase in price, the company trades below the 50-day EMA, with an RSI indicating it is under 50, pointing to potential bearish momentum in the near term. The PE ratio of 12.41 suggests a relatively low valuation in the Financial Services Sector.

Relationship with Key Moving Averages
Shriram Finance's recent closing price of 633.45 is below its 50-day EMA of 658.09 and 10-day EMA of 645.06, but above its 200-day EMA of 622.18. This suggests short-term bearish momentum, though it remains above long-term support levels.
Moving Averages Trend (MACD)
- The MACD for Shriram Finance is -9.66, which is below the MACD Signal of -4.45, suggesting a bearish trend. - This indicates that the stock's recent momentum is negative, and it may experience some downward pressure in its price movement.
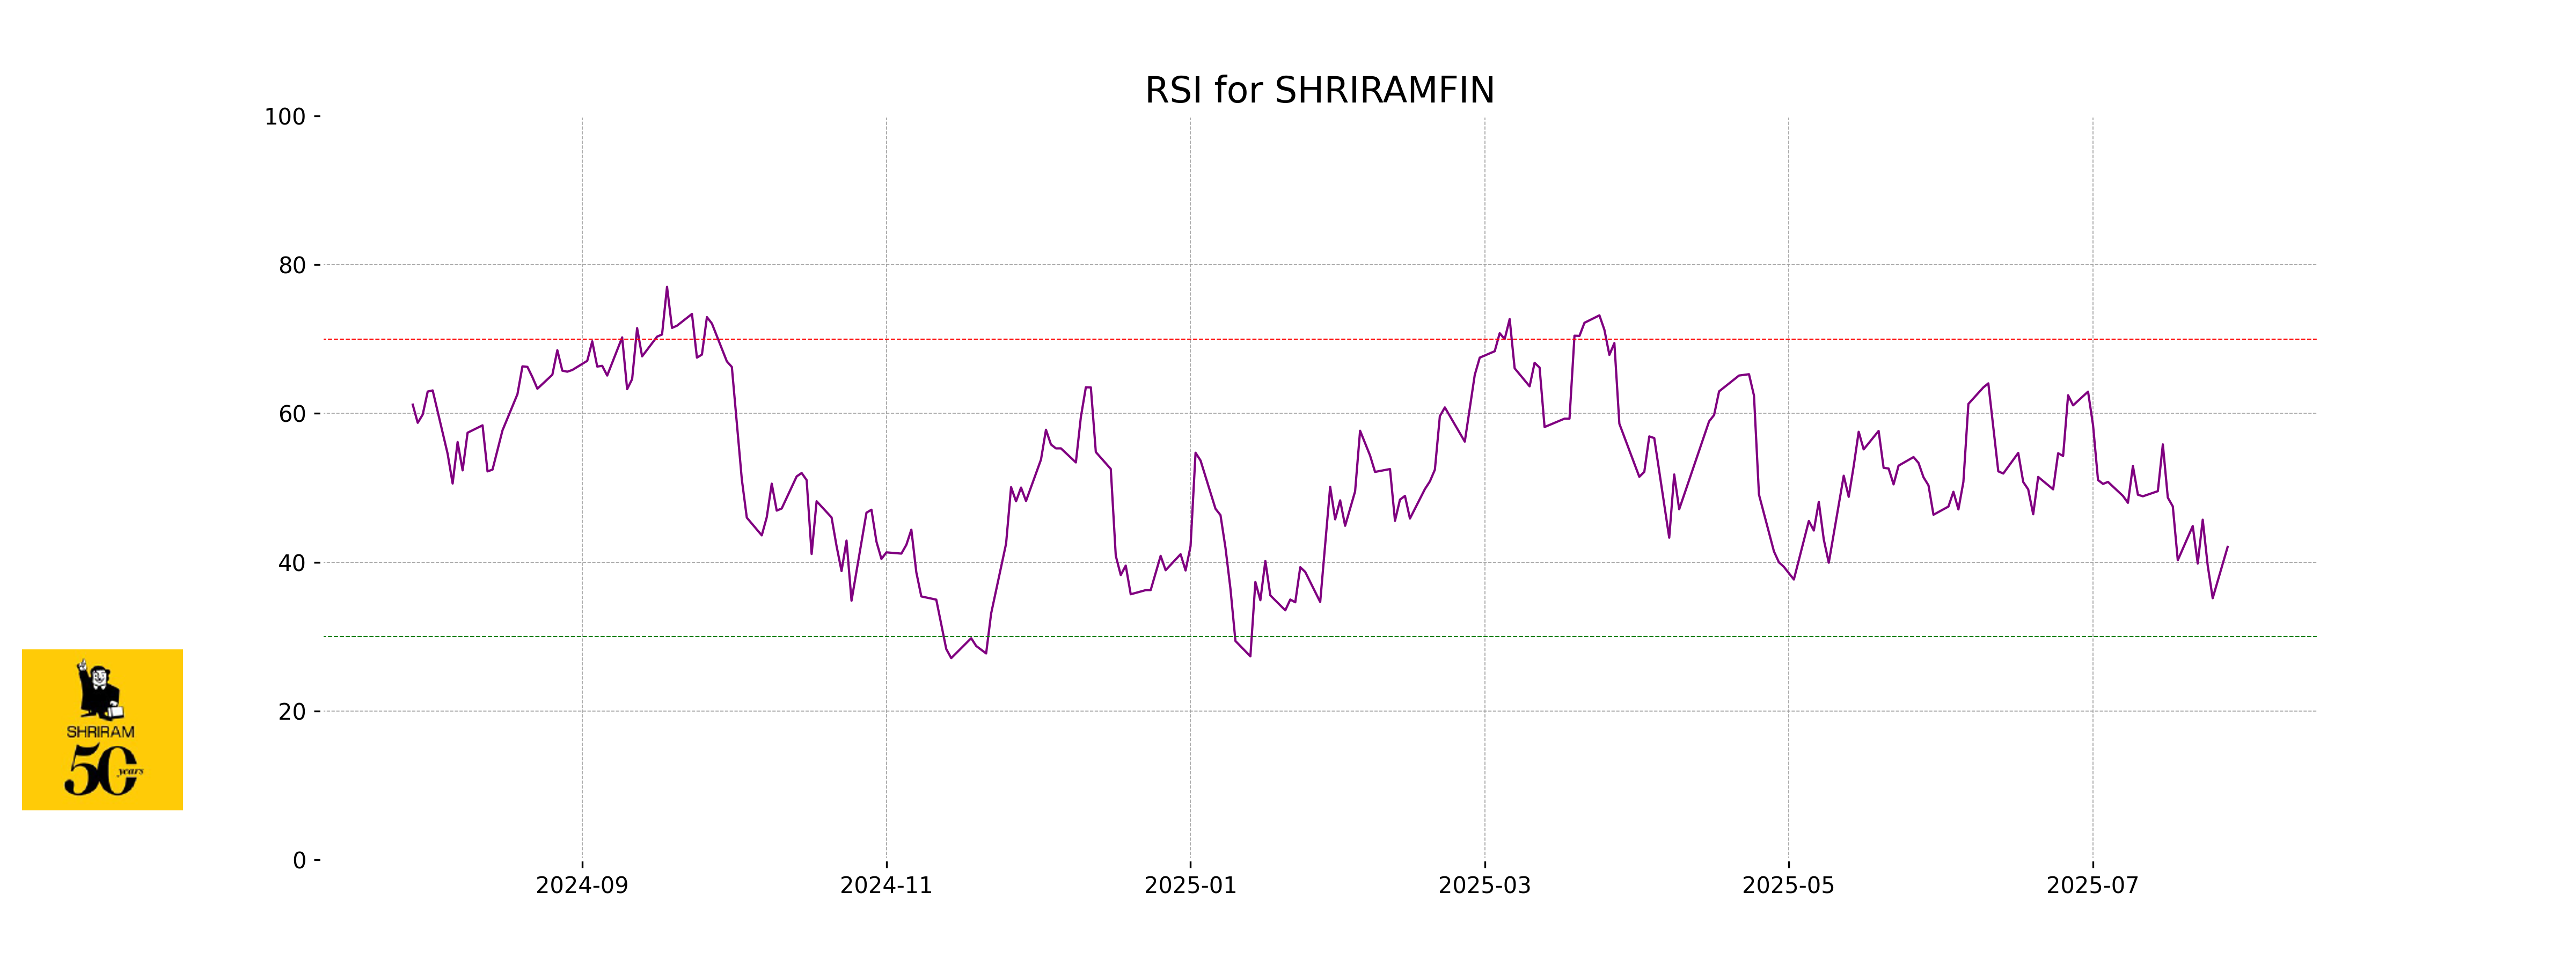
RSI Analysis
The RSI for Shriram Finance is 42.06, indicating a weak momentum as it is below the neutral level of 50. This suggests that the stock is neither in the overbought nor oversold territory, but it is closer to being oversold. Investors may need to monitor any potential downward or upward movements in the stock price from this level.
Up Next
Top 5 Nifty 50 gainers today – July 28, 2025: Biggest stock moves

Microsoft commits USD 17.5 billion investment in India: CEO Satya Nadella

CBI books Anil Ambani's son, Reliance Home Finance Ltd. in Rs 228 crore bank fraud case

RBI raises FY26 GDP growth projection to 7.3 pc

RBI trims policy interest rate by 25bps to 5.25pc, loans to get cheaper

Rupee slumps to all-time low of 90.25 against US dollar in intra-day trade

More videos

Reliance completes merger of Star Television Productions with Jiostar

India to lead emerging market growth with 7pc GDP rise in 2025: Moody’s

Nifty hits record high after 14 months; Sensex nears all-time peak

Reliance stops Russian oil use at its only-for-export refinery to comply with EU sanctions

ED attaches fresh assets worth over Rs 1,400 cr in case against Anil Ambani's Reliance Group

India signs one-year deal to import 2.2 million tonnes of LPG from US

India International Trade Fair begins at Pragati Maidan amid tight security

Stock markets decline in initial trade on foreign fund outflows, weak Asian peers

Amazon to lay off 30,000 office workers amid AI-driven cost cuts

US sanctions on Russian firms to hit Reliance; PSUs likely to keep buying Russian oil via traders