


Highlights
- Coal India shows moderate growth with bearish momentum
- HDFC Bank maintains bullish momentum above key EMAs
- Shriram Finance nears overbought levels with strong RSI
Latest news

Nitin Gadkari reveals how he met Hamas chief Ismail Haniyeh hours before assassination in Tehran

BNP acting chairman Tarique Rahman returns to Dhaka after 17 years in exile

India revamps tax regime in 2025, new I-T Act to take effect from April 1

BNP's acting chief Tarique Rahman set to return to Bangladesh after 17-year exile

Navi Mumbai International Airport starts commercial flight operations

PM Modi attends Christmas service at Delhi church, greets citizens

Gujarat AAP MLA Chaitar Vasava refutes Rs 75 lakh extortion claims by BJP MP

AAP MLA Gopal Italia alleges bullying, extortion at Visavadar groundnut centre
Top 5 Nifty 50 gainers today – February 28, 2025: Biggest stock moves


In this analysis, we examine key technical indicators for some of the high-performing stocks in the Indian stock market on February 28, 2025, including COALINDIA, HDFCBANK, HINDALCO, SHRIRAMFIN, and TRENT.
By evaluating these stocks through essential technical factors, we aim to gain insights into their price movements, prevailing trends, and potential future performance.

Analysis for Coal India - February 28, 2025

Coal India: On examining the recent stock performance, Coal India opened at 366.80 and closed at 369.35, marking a percentage change of 1.51% from its previous close of 363.85. Despite this positive movement, the MACD is negative, indicating a bearish momentum. The RSI is close to neutral at 49.98, suggesting a balanced market sentiment. Overall, the stock shows moderate growth while trading below its 50-day and 200-day EMAs.

Relationship with Key Moving Averages
Coal India's current close price of 369.35 is above its 10-day EMA of 365.55 and slightly above the 20-day EMA of 367.57, indicating short-term strength. However, this is below both the 50-day EMA of 377.23 and the 200-day EMA of 404.04, suggesting a possible longer-term weakness relative to these averages.
Moving Averages Trend (MACD)
MACD Analysis for Coal India: The MACD for Coal India stands at -3.262, which is below the signal line at -3.955. This indicates a bearish momentum, suggesting that the stock may continue its declining trend in the near term.

RSI Analysis
Coal India's RSI is 49.98, which is close to the neutral 50 mark, indicating that the stock is neither overbought nor oversold. This suggests that current price movements are relatively balanced, without a strongly bullish or bearish momentum.

Analysis for HDFC Bank - February 28, 2025
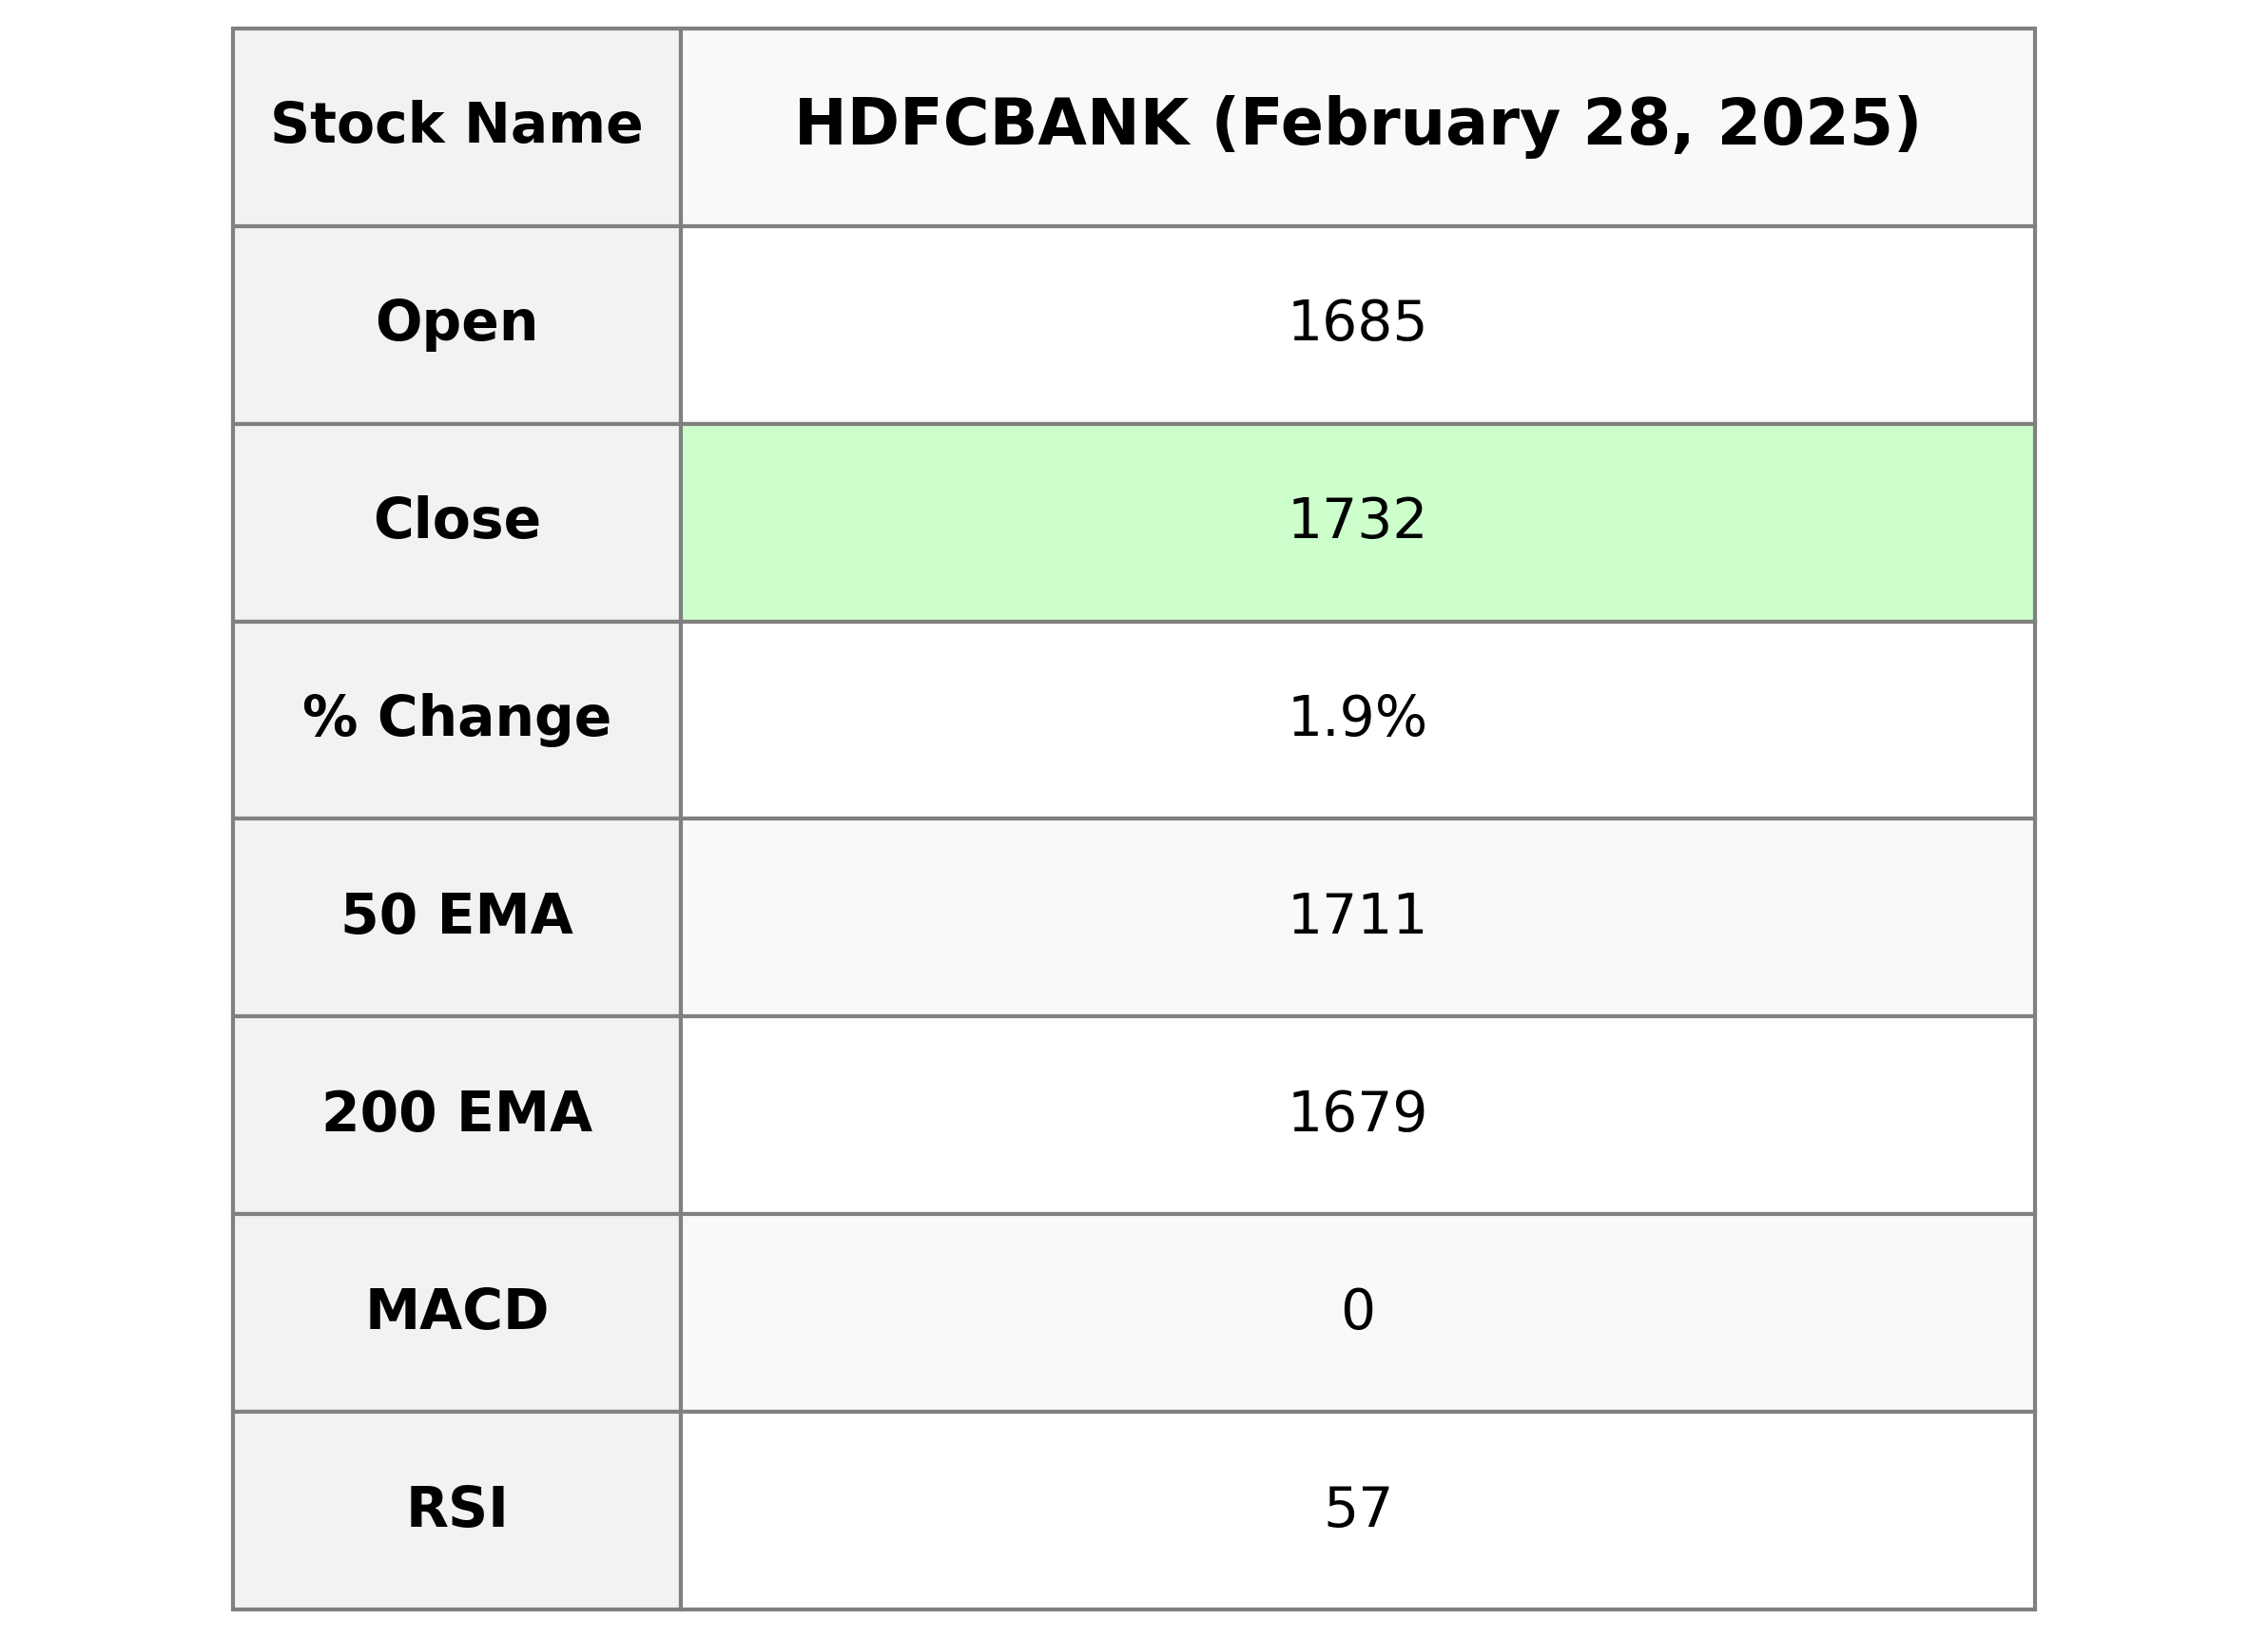
HDFC Bank Performance: HDFC Bank showed a positive performance with a closing price of 1732.40, marking a 1.86% increase from the previous close of 1700.70. The stock witnessed strong trading activity with a significant volume of 27,256,239. The bank's market cap stands at approximately 13.25 trillion, and it maintains a PE ratio of 19.37 and an EPS of 89.46, reflecting its robust financial metrics.

Relationship with Key Moving Averages
HDFC Bank's current closing price of 1732.4 is above its 50-day EMA of 1711.28 and 200-day EMA of 1678.85, indicating a positive trend relative to these key moving averages. The current price is also above the 10-day EMA of 1703.85 and 20-day EMA of 1702.54, suggesting recent upward momentum.
Moving Averages Trend (MACD)
MACD Analysis for HDFC Bank: HDFC Bank's MACD is currently at 0.08, which is above the MACD Signal line of -1.22. This positive divergence suggests a potential bullish momentum, indicating that the stock might continue to rise if the trend persists.

RSI Analysis
HDFC Bank's RSI (Relative Strength Index) is at 57.10, suggesting that the stock is in a neutral zone and not currently overbought or oversold. This indicates a balanced momentum without any extreme price movements expected imminently.

Analysis for HINDALCO - February 28, 2025

Stock Performance for Hindalco Hindalco opened at 630.0 with a high of 636.60 and closed at 634.35, indicating a slight increase from its previous close of 631.95. The stock shows a positive change in percentage and points, with a notable trading volume of 13,040,620. Technical indicators like the 50 EMA, 200 EMA, RSI, and MACD suggest moderate bullish sentiment. The company holds a market cap of 1,408,326,828,032 INR with a PE ratio of 10.16, operating in the Basic Materials sector under the Aluminum industry in India.

Relationship with Key Moving Averages
HINDALCO is trading above its 50 EMA, indicating a short-term bullish trend. It is also slightly above its 200 EMA, suggesting that the overall momentum is positive. The current price is above both the 10 EMA and 20 EMA, reinforcing the short-term strength of the stock.
Moving Averages Trend (MACD)
The Moving Average Convergence Divergence (MACD) for Hindalco, at 9.21, is above its Signal Line, which is at 5.95. This indicates a bullish trend, suggesting upward momentum in the stock's price movement.

RSI Analysis
The Relative Strength Index (RSI) for Hindalco is 58.13, indicating that the stock is in neutral territory as it ranges between 30 and 70. This suggests that Hindalco is neither oversold nor overbought, and there is no immediate signal for a trend reversal.

Analysis for Shriram Finance - February 28, 2025

Shriram Finance Performance Shriram Finance showed positive momentum with a close of 617.30, marking a 1.73% increase from the previous close. With strong support from technical indicators such as a high RSI of 67.53 and a favorable MACD, the stock is performing well above its 50 and 200 EMA, indicating a bullish trend in the financial services sector in India. The company maintains a healthy market cap and a reasonable PE ratio, pointing towards stable growth prospects.

Relationship with Key Moving Averages
Shriram Finance is currently above its key moving averages, trading at 617.30 compared to its 50 EMA of 566.95 and 200 EMA of 554.07. This indicates a bullish trend, with its current price suggesting strong upward momentum above short and long-term averages.
Moving Averages Trend (MACD)
MACD Analysis for Shriram Finance: The MACD value for Shriram Finance is 11.81, with a signal line at 4.91. This positive MACD value indicates that the stock may be experiencing bullish momentum, as the MACD line is above the signal line.

RSI Analysis
RSI Analysis for Shriram Finance: The RSI for Shriram Finance is at 67.53, which indicates that the stock is approaching an overbought condition. Typically, an RSI above 70 suggests an overbought situation, where there might be limited upside potential without a correction. However, it is currently still below 70, indicating there may be some room for further price increases.

Analysis for Trent - February 28, 2025
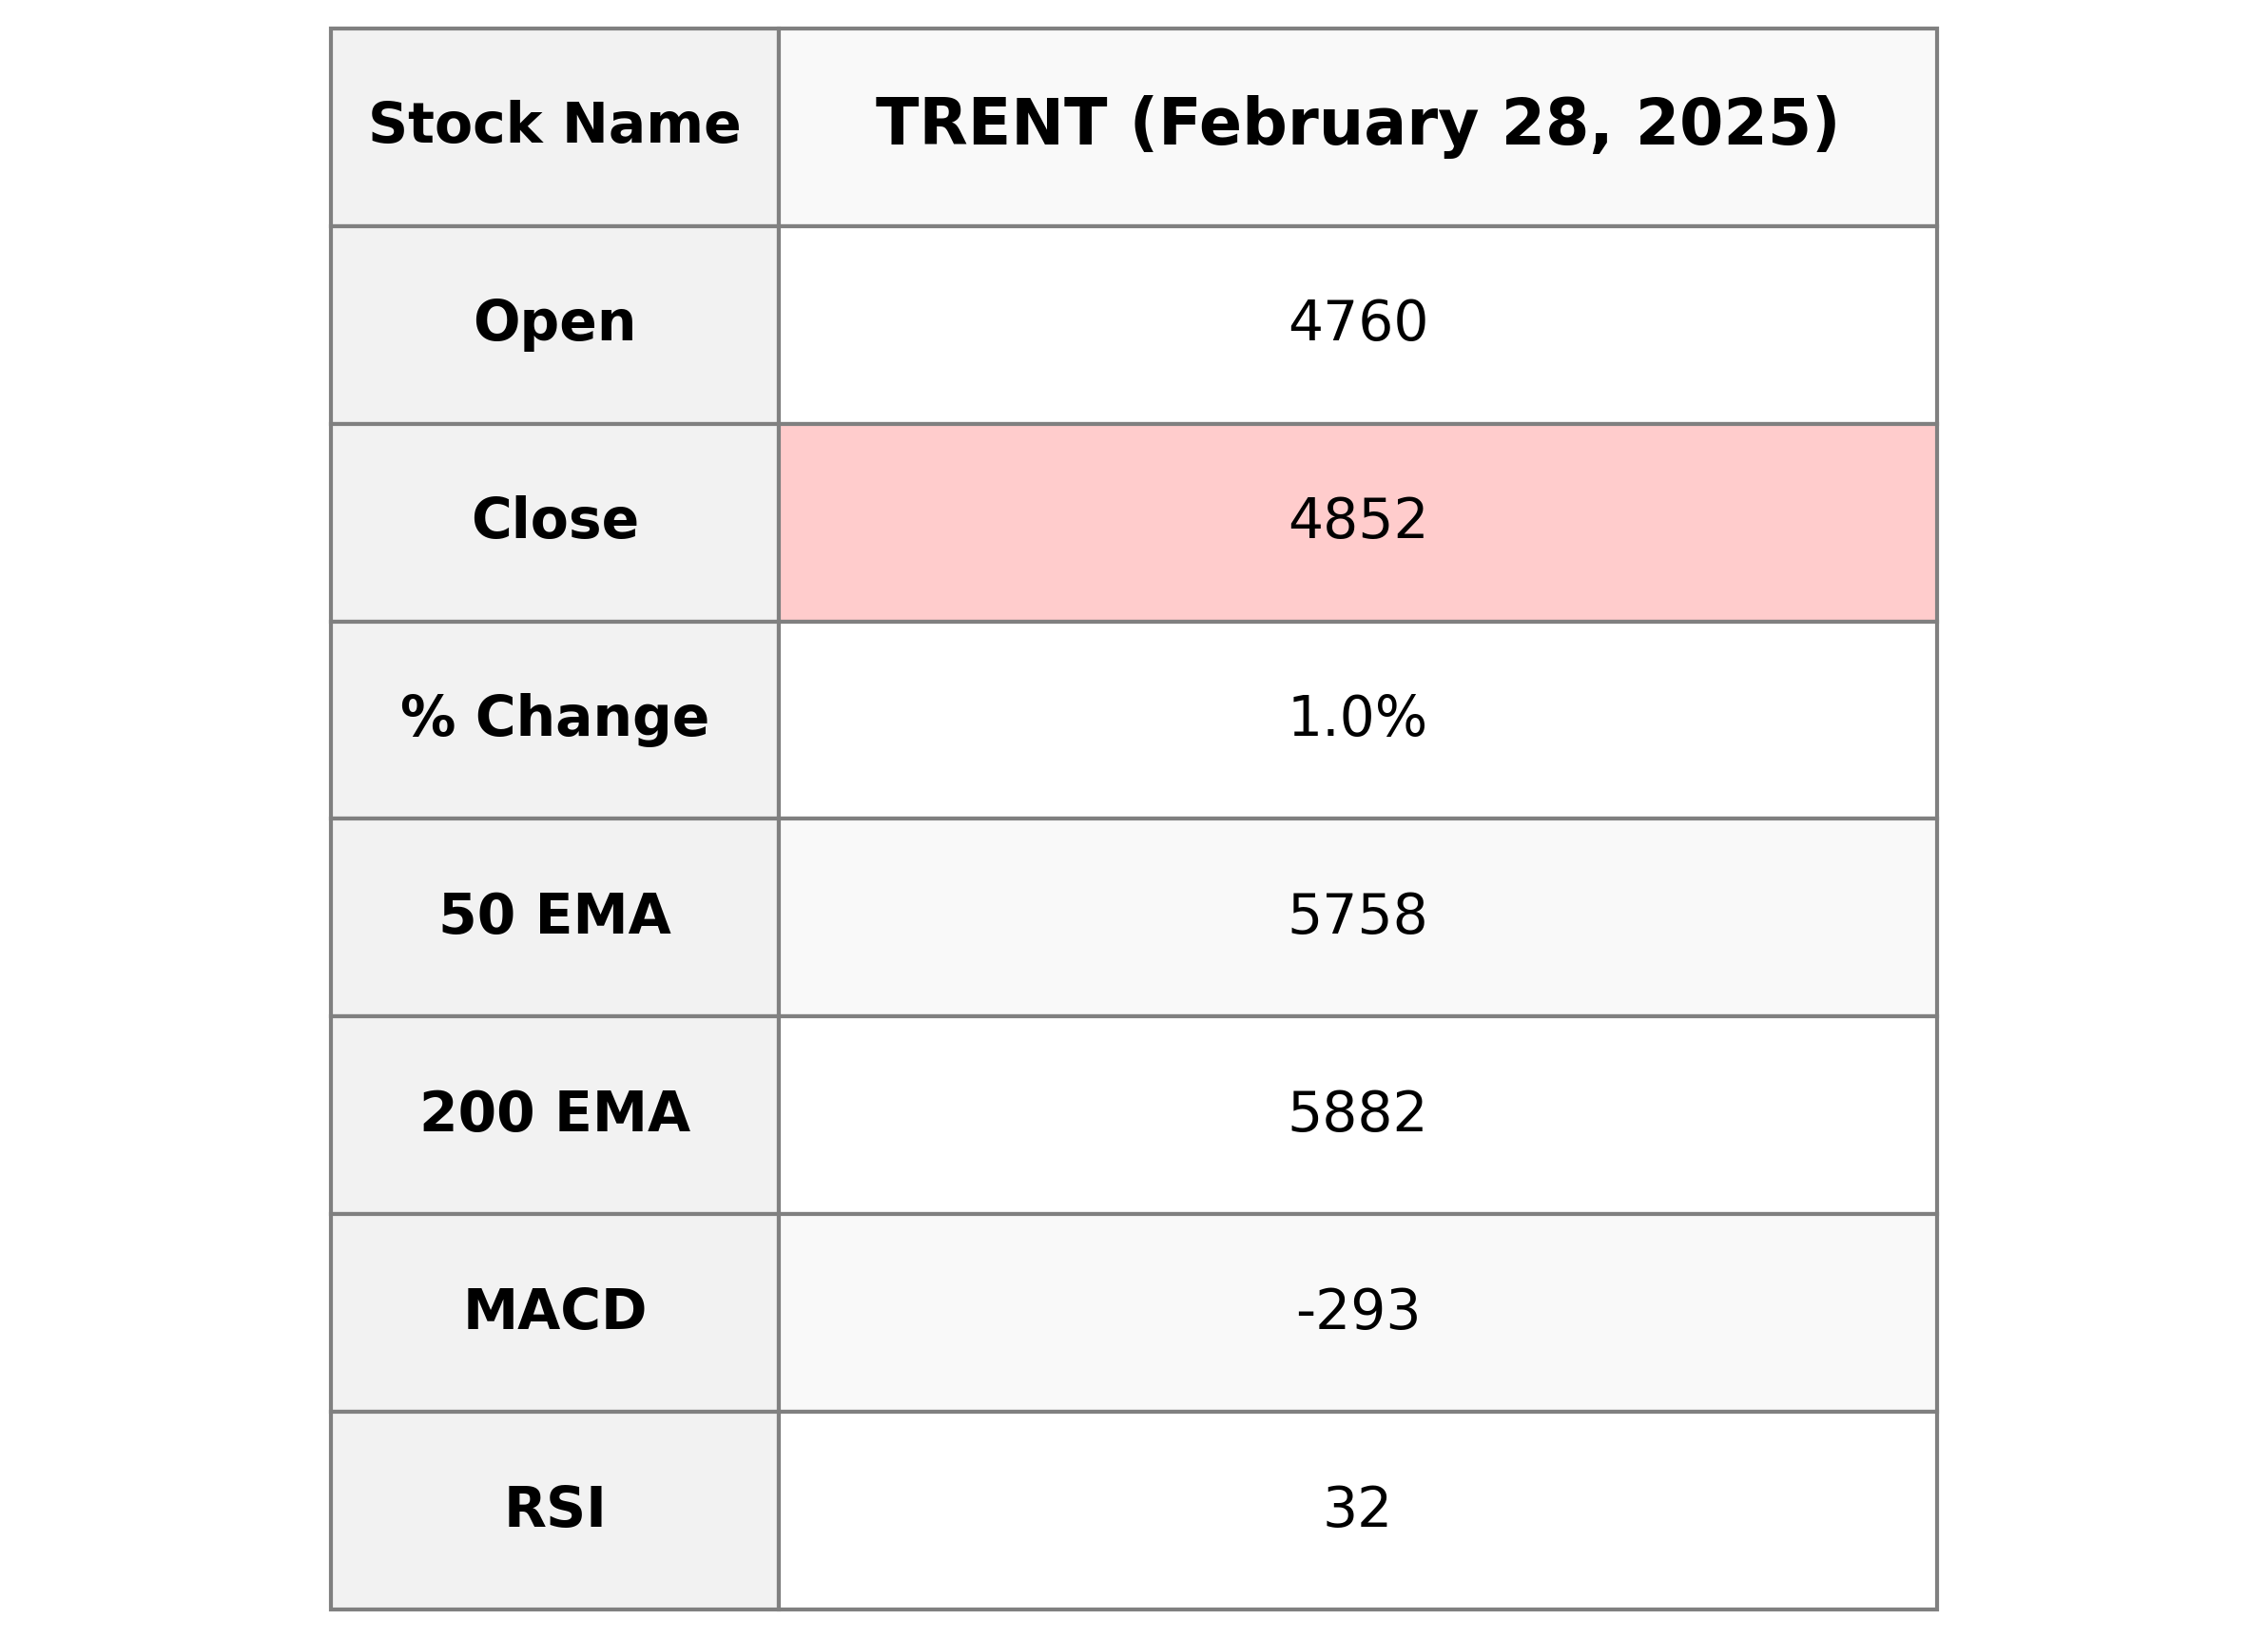
Company Name: Trent Performance Summary: Trent opened at 4760.0 and closed at 4851.55, showing a price increase with a 0.96% change from the previous close of 4805.3. The stock shows a bearish MACD, and RSI suggests it is possibly oversold. The company's market cap is 1,724,662,939,648 INR, operating in the Consumer Cyclical sector, specifically in Apparel Retail in India.

Relationship with Key Moving Averages
Trent's closing price at 4851.55 is below its 50-day EMA of 5758.37 and 200-day EMA of 5882.48, indicating a bearish trend relative to these key moving averages. However, it is closer to its 10-day EMA of 5019.14 and 20-day EMA of 5226.73, suggesting some recent recovery but still under pressure in the medium to long term.
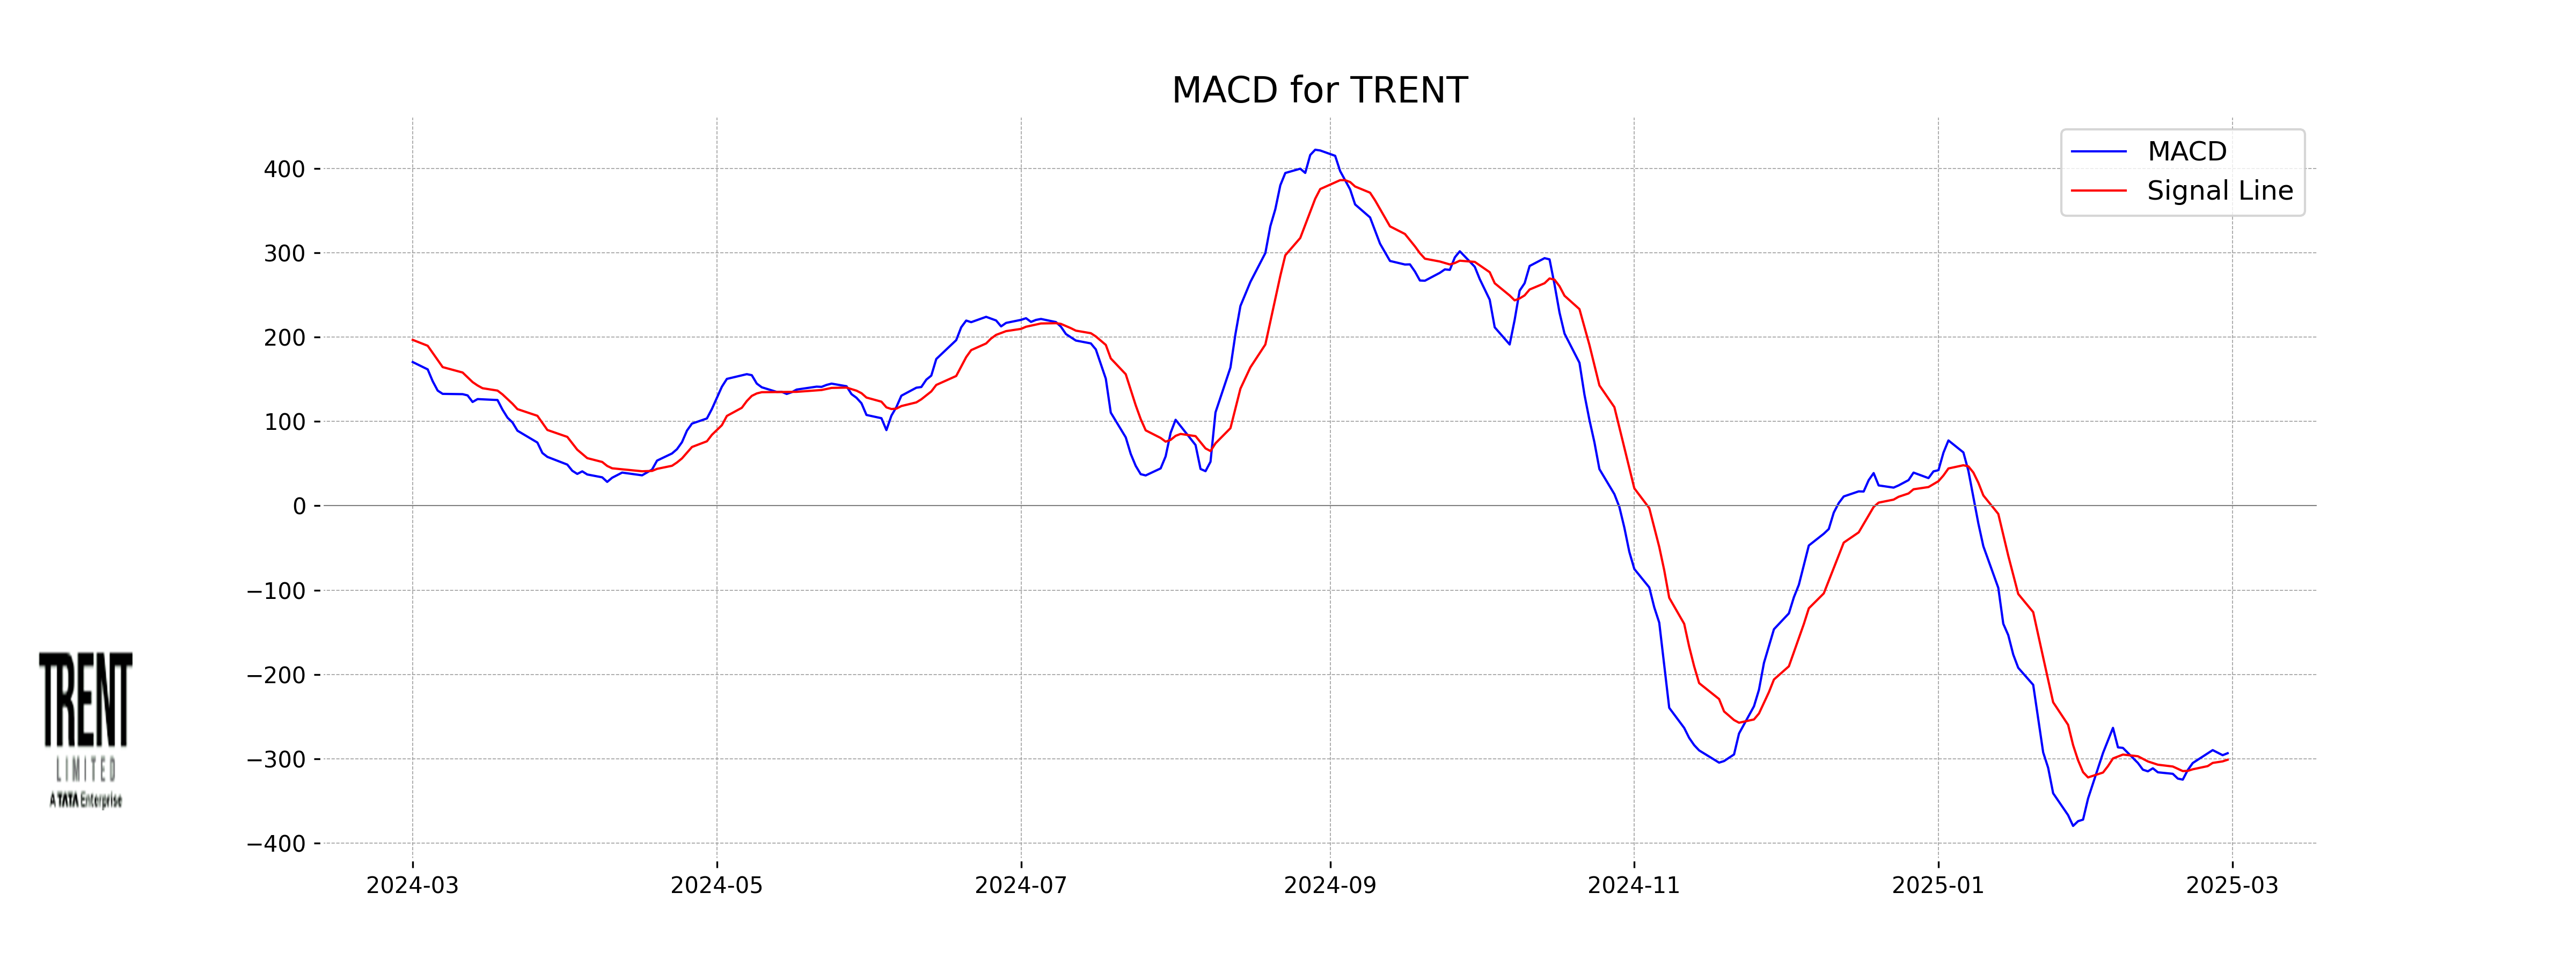
Moving Averages Trend (MACD)
The MACD for Trent is -293.27, which is below its MACD Signal of -301.01, indicating a potential upward momentum as the MACD line is closer to crossing above the signal line. The negative MACD generally reflects a bearish sentiment, but the gap narrowing may suggest a shift towards bullishness.
RSI Analysis
The RSI of Trent is 32.26, indicating that it is approaching an oversold condition. This suggests that the stock may be undervalued at the moment, potentially signaling a buying opportunity.

Up Next
Top 5 Nifty 50 gainers today – February 28, 2025: Biggest stock moves

New Zealand commits USD 20 bn investment in India under FTA in 15 yrs; on lines of EFTA pact

India, New Zealand conclude FTA talks; pact to offer duty-free access, USD 20 bn FDI

FTA with New Zealand to significantly deepen bilateral economic engagement: Govt

Rupee breaches 91-mark against US dollar for first time in intra-day trade

Microsoft commits USD 17.5 billion investment in India: CEO Satya Nadella

More videos

CBI books Anil Ambani's son, Reliance Home Finance Ltd. in Rs 228 crore bank fraud case

RBI raises FY26 GDP growth projection to 7.3 pc

RBI trims policy interest rate by 25bps to 5.25pc, loans to get cheaper

Rupee slumps to all-time low of 90.25 against US dollar in intra-day trade

Reliance completes merger of Star Television Productions with Jiostar

India to lead emerging market growth with 7pc GDP rise in 2025: Moody’s

Nifty hits record high after 14 months; Sensex nears all-time peak

Reliance stops Russian oil use at its only-for-export refinery to comply with EU sanctions

ED attaches fresh assets worth over Rs 1,400 cr in case against Anil Ambani's Reliance Group

India signs one-year deal to import 2.2 million tonnes of LPG from US