


Highlights
- Nifty 50 index showcased a mixed trend
- Select stocks displayed significant upward movement
- Market favored certain outperformers, suggesting strategic buying
Latest news

GIPMC Strengthens Certification Credibility Through Industry-Aligned Learning Frameworks

Sahara Star: Mumbai's Most Iconic Address for MICE and Wedding Celebrations

Paytm Foundation launches second 'Wisdom on Wheels' mobile learning bus to expand digital and computer education across Odisha

Mount Litera Zee School, Kalaburagi Achieves 100 Percent Result in First CBSE Class X Batch

Vedanta's claim of being highest bidder 'false narrative', RP tells NCLAT in Jaypee Associates insolvency case

"Finest actor of our generation": Namit Malhotra lauds Ranbir Kapoor's performance in 'Ramayana'

Priyadarshani Group of Schools announce 100% success in class 10th CBSE board results across its Pune campuses

Intertek Strengthens Solar Assurance Leadership with Purchase of Mitsui Chemicals Solar Laboratory Assets in India
Top 5 Nifty 50 gainers today – February 6, 2025: Biggest stock moves


In this article, we will explore the technical indicators of some of the high-performing stocks on the Indian stock market, including ADANIPORTS, CIPLA, DRREDDY, INFY, and TATACONSUM.
By looking at these stocks through the lens of key technical factors, we aim to better understand their price movements, trends, and potential future performance.

Analysis for Adani Ports - February 06, 2025

Adani Ports opened at 1155.60 and closed at 1164.05, showing a positive change of 1.72% with a volume of 6,263,198. Although its 50-day EMA of 1170.91 lags behind the closing, the stock's RSI is at 56.37, indicating moderate momentum. The company falls under the Industrials sector, specializing in Marine Shipping, and holds a market cap of approximately 2,514 billion INR.
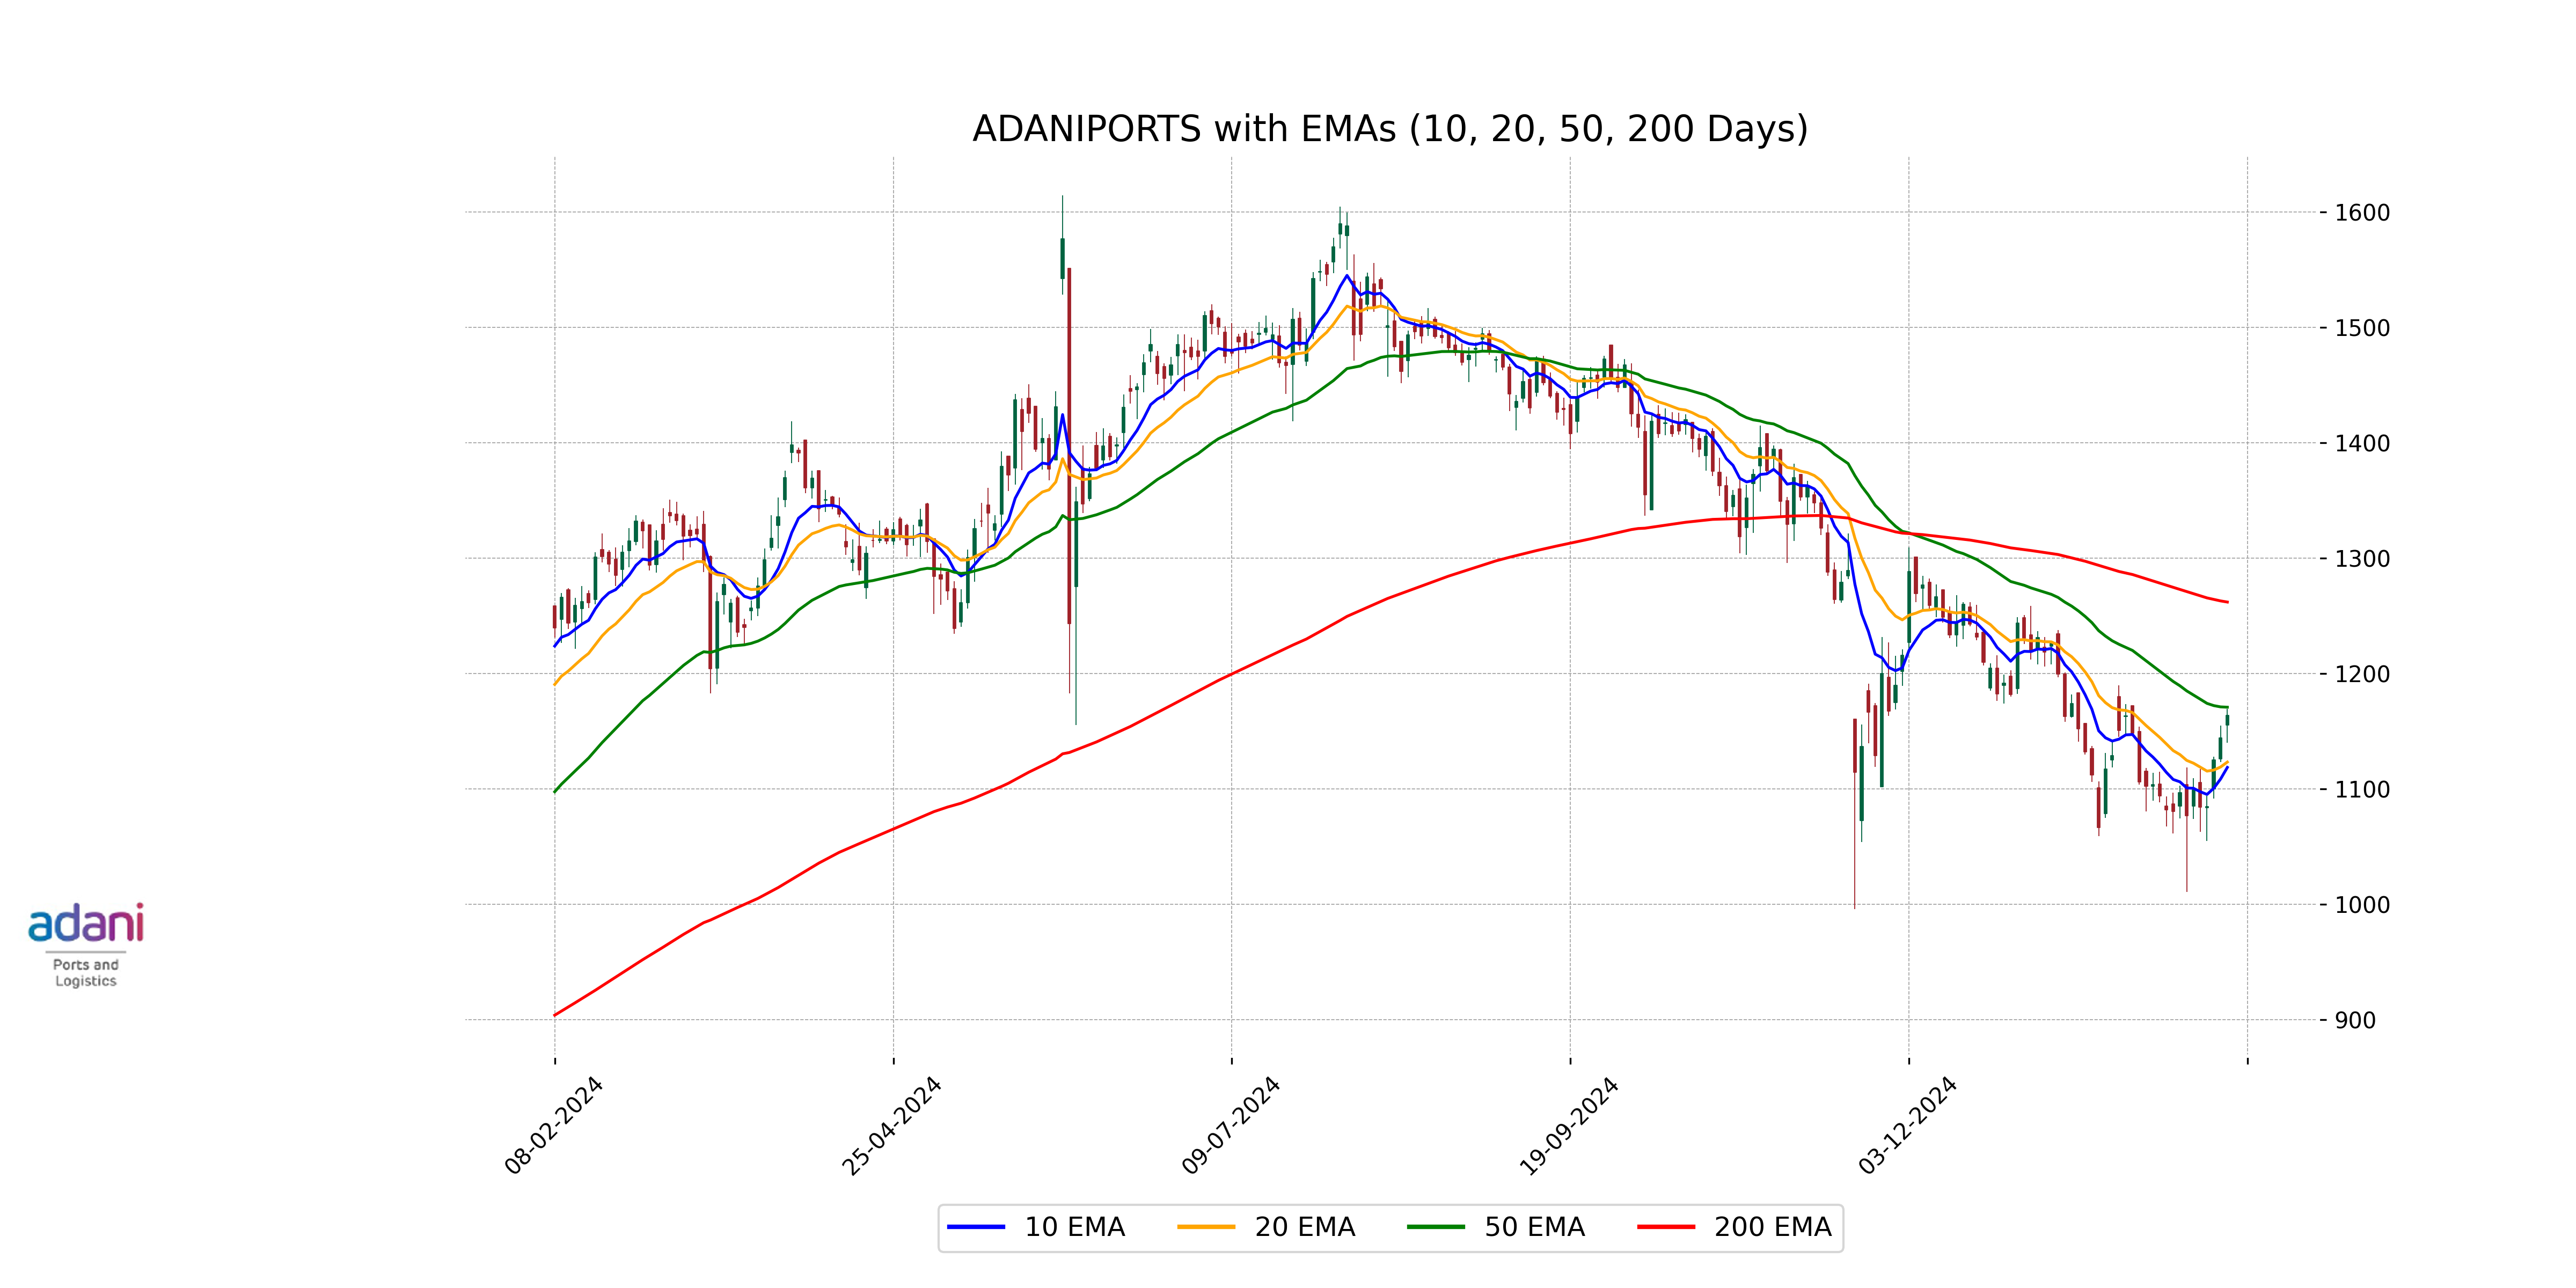
Relationship with Key Moving Averages
Adani Ports' current closing price of 1164.05 is below its 50-day EMA of 1170.91 and significantly below its 200-day EMA of 1262.07, indicating a short-term downtrend. However, its 10-day EMA at 1118.72 and 20-day EMA at 1123.36 are both lower than the current price, suggesting some recent upward momentum.
Moving Averages Trend (MACD)
The MACD value for Adani Ports is -13.69, which is above the MACD Signal value of -24.50. This indicates a potential bullish crossover, suggesting that the stock might experience some upward momentum. However, it is important to consider other technical indicators and market conditions for a comprehensive analysis.

RSI Analysis
The Relative Strength Index (RSI) for Adani Ports is 56.37, indicating a neutral position. Generally, an RSI above 70 suggests overbought conditions, while an RSI below 30 suggests oversold conditions. With an RSI of 56.37, Adani Ports is neither overbought nor oversold, which may imply a stable trend without strong buying or selling pressure.

Analysis for Cipla - February 06, 2025

Cipla opened at 1443.95 and closed at 1471.5, reflecting a positive change of 2.42%, or 34.70 points, with a trading volume of 2,918,327 shares. The 50-day EMA is slightly below the closing price, indicating recent strength, while the company has a PE ratio of 23.82 and operates in the Healthcare sector, specifically in the Drug Manufacturers - General industry in India.

Relationship with Key Moving Averages
Cipla's close price of 1471.5 is above its 50-day EMA of 1470.18 and below its 200-day EMA of 1477.69, suggesting some recent upward momentum but still within a longer-term downward range. The stock's 10-day EMA at 1445.74 and 20-day EMA at 1448.86 indicate that its recent price is also above the short-term trend, showing a positive sentiment.
Moving Averages Trend (MACD)
The MACD value for Cipla is -7.25, while the MACD Signal is -11.85. Since the MACD line is above the signal line, this indicates a potential bullish trend.

RSI Analysis
Cipla's RSI is 53.65, indicating that the stock is in a neutral position. This suggests neither overbought nor oversold conditions, implying potential stability in its current trend. Further monitoring is advised to determine future movements.

Analysis for Dr Reddys Labs - February 06, 2025

Dr Reddy's Laboratories showed a slight positive movement with a close at 1236.65, reflecting a 0.74% increase from its previous close. The stock's trading volume was 2,990,425, and its market cap stood at 1,030,614,220,800. The RSI indicates a relatively neutral position at 43.41, suggesting neither overbought nor oversold conditions.

Relationship with Key Moving Averages
Dr Reddy's Labs closed at 1236.65, which is below its 50-day EMA of 1276.51 and 200-day EMA of 1262.76, indicating a potential bearish trend. However, it is slightly above its 10-day EMA of 1228.43, showing a short-term positive momentum.
Moving Averages Trend (MACD)
Dr Reddys Labs shows a bearish MACD signal as the MACD value (-27.32) is below the MACD Signal line (-25.00). This indicates a potential downtrend in the short term.

RSI Analysis
Dr Reddys Labs has an RSI of 43.41, which suggests that the stock is neither overbought nor oversold. Typically, an RSI below 30 indicates oversold conditions, while above 70 indicates overbought conditions. The current RSI suggests a neutral position in the market.

Analysis for Infosys - February 06, 2025

**Infosys** has shown a positive performance with the stock closing at 1915.65, gaining approximately 0.98% from the previous closing. The stock's movement is supported by moderate volumes and a positive RSI of 55.02, indicating a potential uptrend. Moreover, Infosys maintains a strong market position with a market cap of 7.93 trillion INR and operates within the Technology sector, particularly in Information Technology Services.

Relationship with Key Moving Averages
The closing price of Infosys is 1915.65, which is above the 50-day EMA of 1889.04 and the 20-day EMA of 1882.43, as well as above the 10-day EMA of 1881.90, indicating a positive trend in the short term. However, it remains significantly higher than the 200-day EMA of 1787.45, suggesting a strong longer-term bullish trend.
Moving Averages Trend (MACD)
According to the MACD analysis for Infosys, the MACD value is -4.59, which is above the MACD Signal value of -11.93. This suggests potential bullish momentum. However, the values remain in negative territory, indicating that the stock could still be under bearish pressure in a broader context.

RSI Analysis
The RSI for Infosys is 55.02, indicating a neutral position. An RSI value between 30 and 70 suggests that the stock is neither overbought nor oversold. Current market conditions show balanced momentum.

Analysis for Tata Consumer - February 06, 2025

Tata Consumer's stock performance shows a positive daily change, closing at 1023.35, which is an increase from the previous close of 1015.30, marking a percentage change of 0.79%. The trading volume stood at 1,172,408 shares. The 50 EMA is 978.99, while the 200 EMA is 1032.25, indicating the stock is trading above its medium-term trend. Additionally, the RSI is moderately high at 59.94, suggesting healthy momentum. The company operates in the Consumer Defensive sector, specifically in the Packaged Foods industry within India.

Relationship with Key Moving Averages
Tata Consumer's current stock price of 1023.35 is above the 50 EMA of 978.99 and below the 200 EMA of 1032.26, indicating short-term bullish momentum within a longer-term bearish trend. The price also remains above the 10 and 20 EMAs, suggesting near-term strength.
Moving Averages Trend (MACD)
Tata Consumer's MACD is currently showing a value of 21.74, which is above the MACD Signal line at 17.05. This positive divergence suggests a bullish momentum, indicating that the stock might continue to rise in the near term if this trend persists.

RSI Analysis
The RSI (Relative Strength Index) for Tata Consumer is currently at 59.94, which suggests that the stock is in a neutral zone, approaching overbought levels. Typically, an RSI above 70 indicates overbought conditions, while below 30 indicates oversold conditions. Therefore, the RSI suggests that the stock is neither overbought nor oversold, but closer to the upper range.

Up Next
Top 5 Nifty 50 gainers today – February 6, 2025: Biggest stock moves

Centre plans to borrow Rs 8.20 lakh cr from market in first half of FY27

Reliance denies buying Iranian oil amid US sanctions waiver

Premium petrol price up Rs 2, industrial diesel up Rs 22; no change in normal petrol, diesel rates

India's GDP expected to register over 8 pc growth in Sep-Dec: Report

Govt announces seven measures to help boost exports

More videos

RBI keeps interest rates on hold after US trade deal boosts outlook

RBI proposes to compensate customers up to Rs 25,000 loss due to fraud

RBI raises GDP growth projection of Q1, Q2 of FY27

RBI pauses rate cuts, retains interest rate at 5.25 pc

Rupee jumps 122 paise to close at 90.27 against US dollar on India-US trade deal

Stock markets cheer India-US trade deal: Sensex, Nifty surge 2.5 pc

UPI transactions hit record high of Rs 230 lakh crore in 2025-26 till Dec: Govt

Explained: India-US trade deal, tariffs and trade benefits

Trade deal with US adds momentum to India's growth ambition: Industry leaders

Rupee jumps 119 paise to 90.30 against the US dollar on India-US trade deal