


Highlights
Latest news

Indian student shot dead near University of Toronto campus

Another Hindu man lynched in Bangladesh over alleged extortion, government denies communal angle

US launches Christmas Day strikes on IS targets in Nigeria

Nitin Gadkari reveals how he met Hamas chief Ismail Haniyeh hours before assassination in Tehran

BNP acting chairman Tarique Rahman returns to Dhaka after 17 years in exile

India revamps tax regime in 2025, new I-T Act to take effect from April 1

BNP's acting chief Tarique Rahman set to return to Bangladesh after 17-year exile

Navi Mumbai International Airport starts commercial flight operations
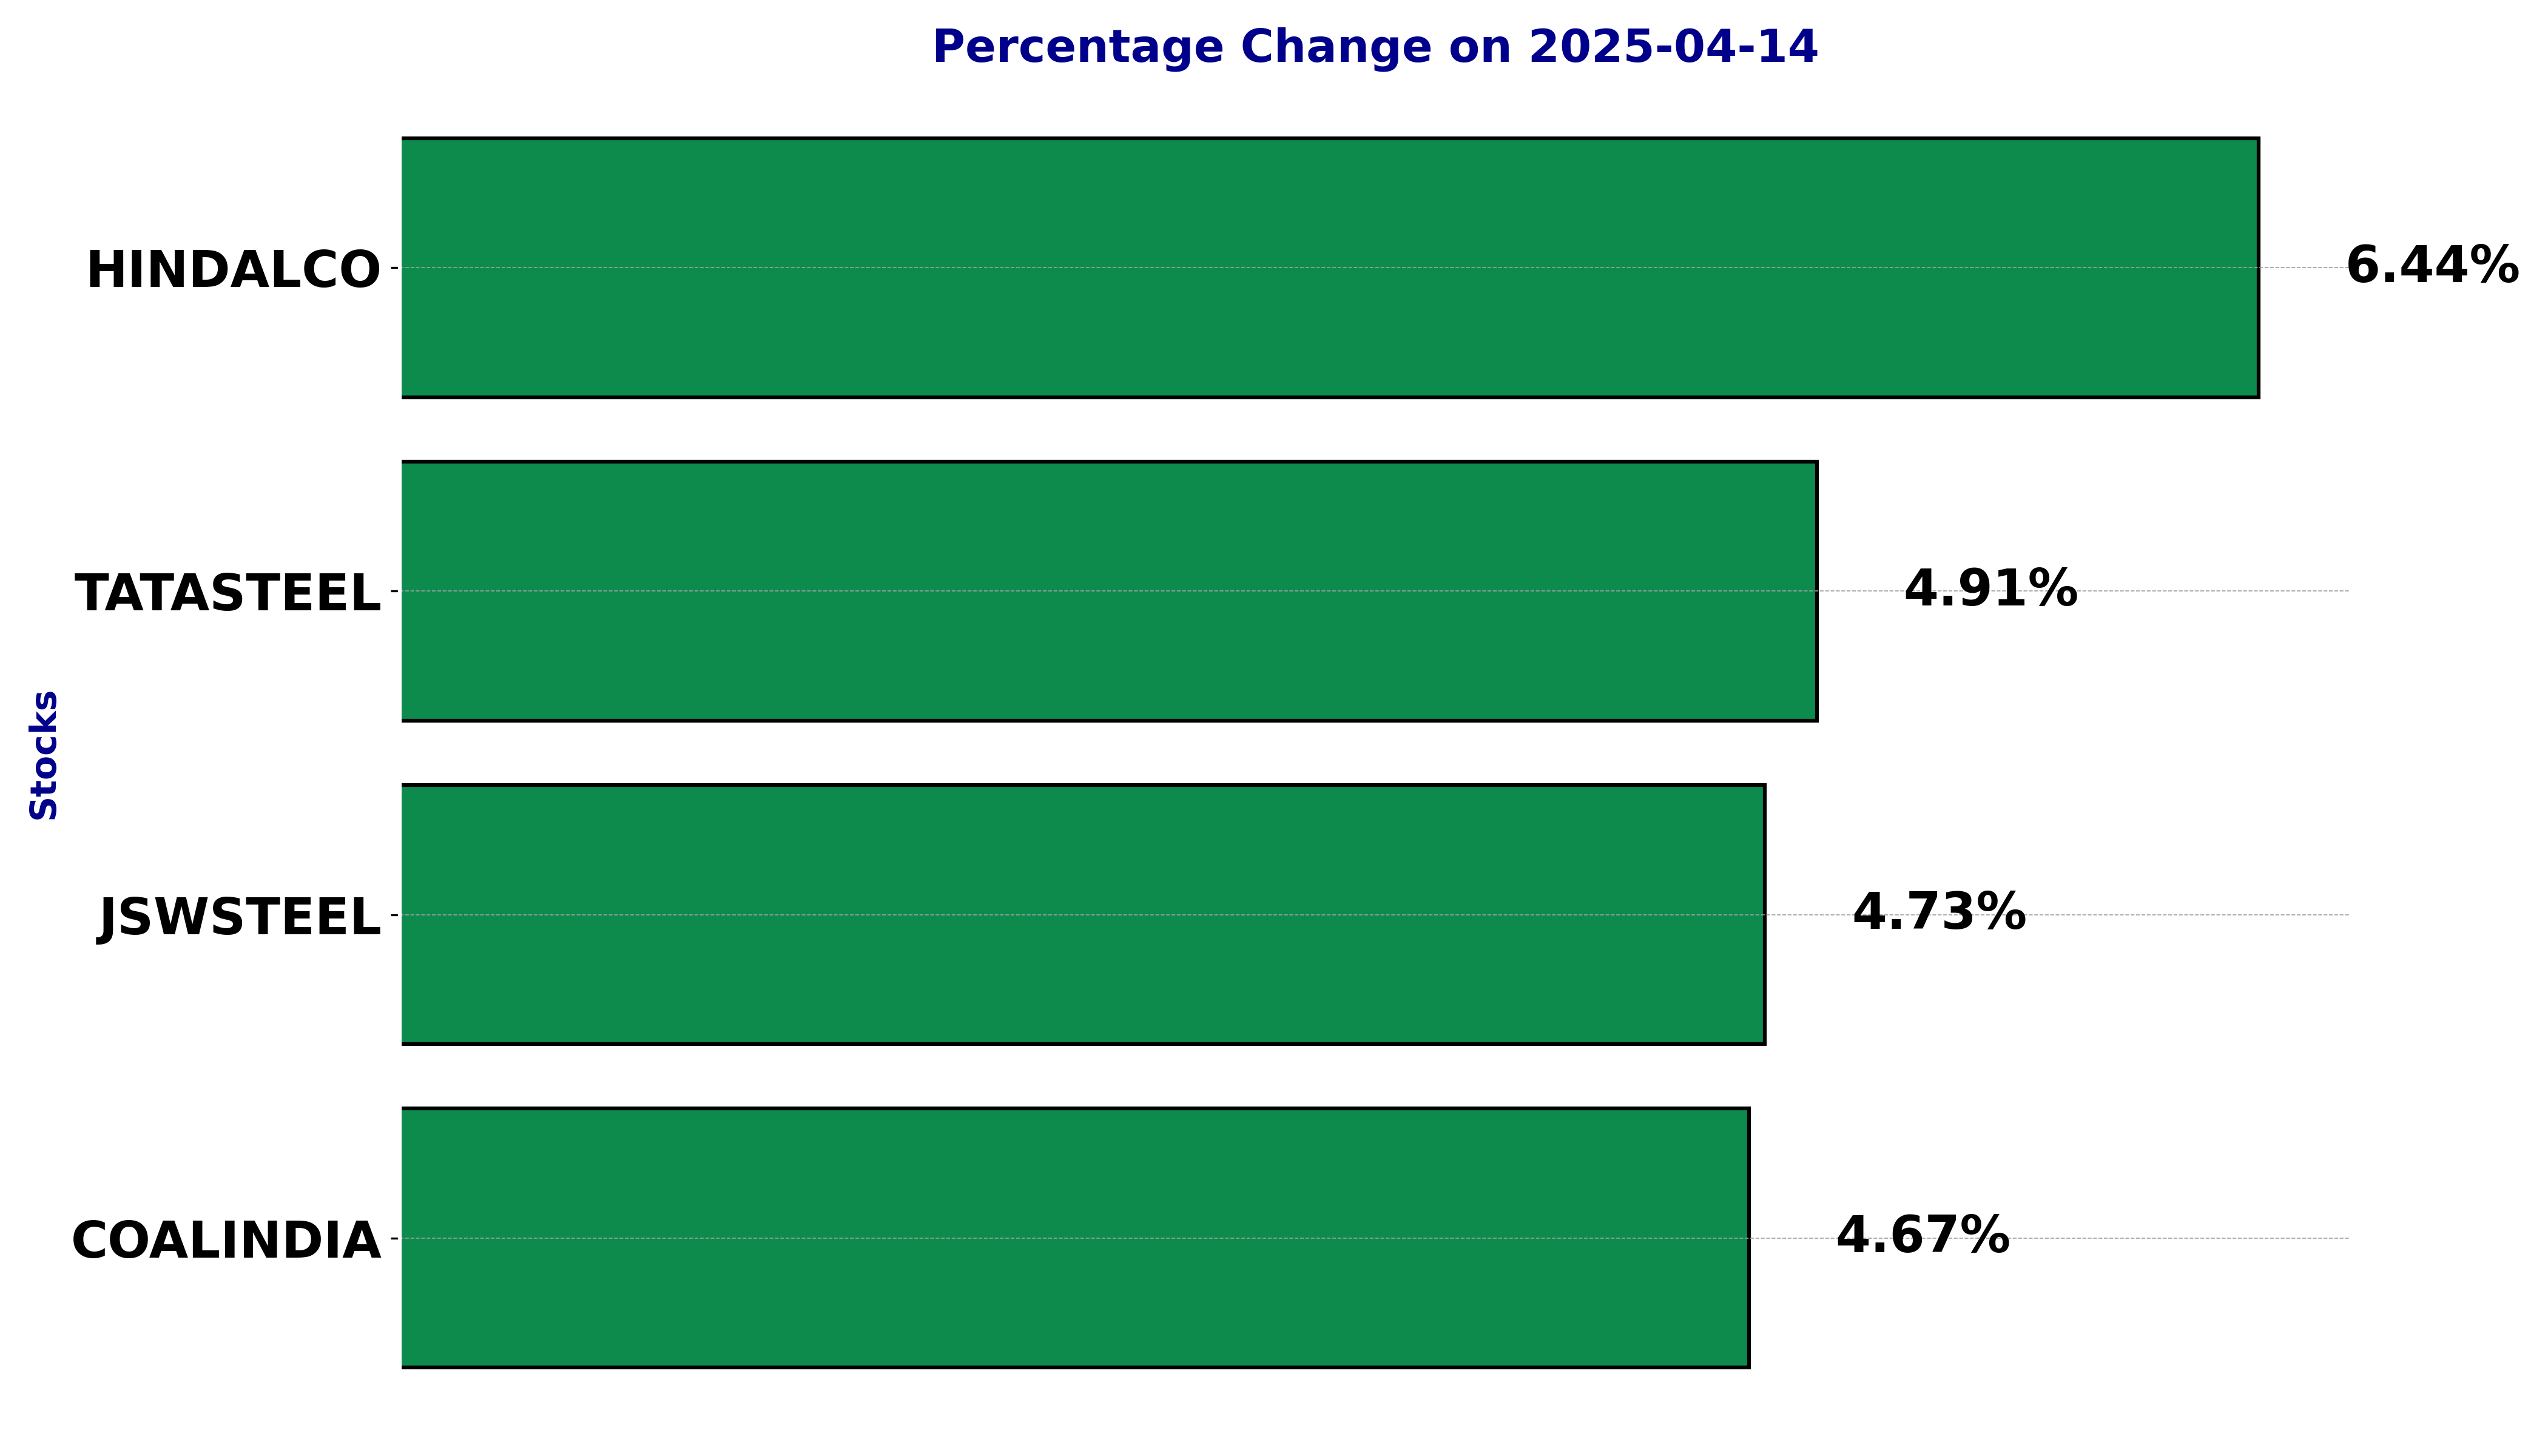
NSE Nifty 50 Top gainers: What are the 5 Biggest Stock gainers Today April 14, 2025


In this article, we will explore the technical indicators of some of the high-performing stocks on the Indian stock market, including COALINDIA, HINDALCO, JSWSTEEL, and TATASTEEL.
By looking at these stocks through the lens of key technical factors, we aim to better understand their price movements, trends, and potential future performance.
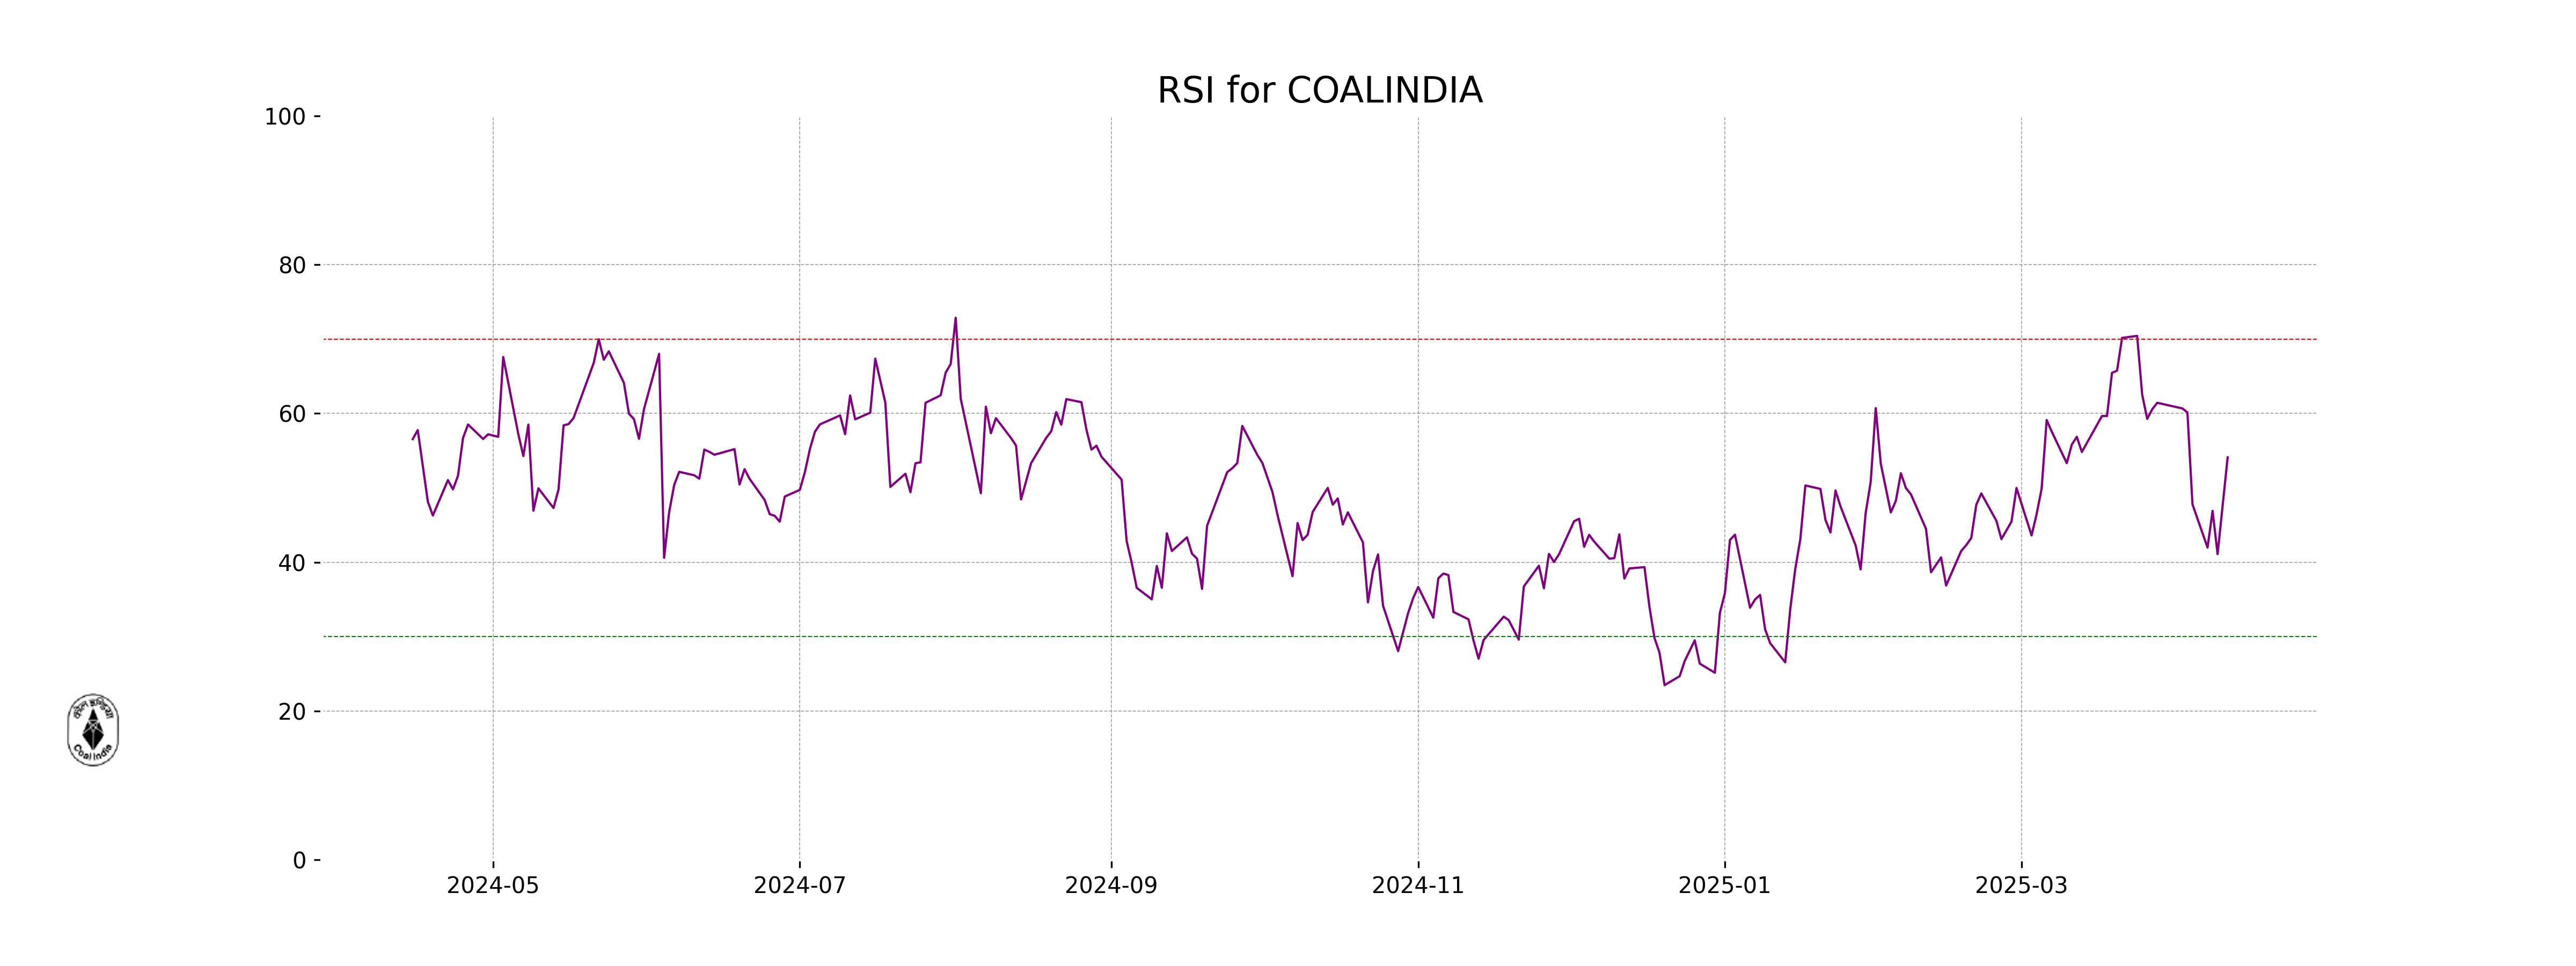
Analysis for Coal India - April 14, 2025
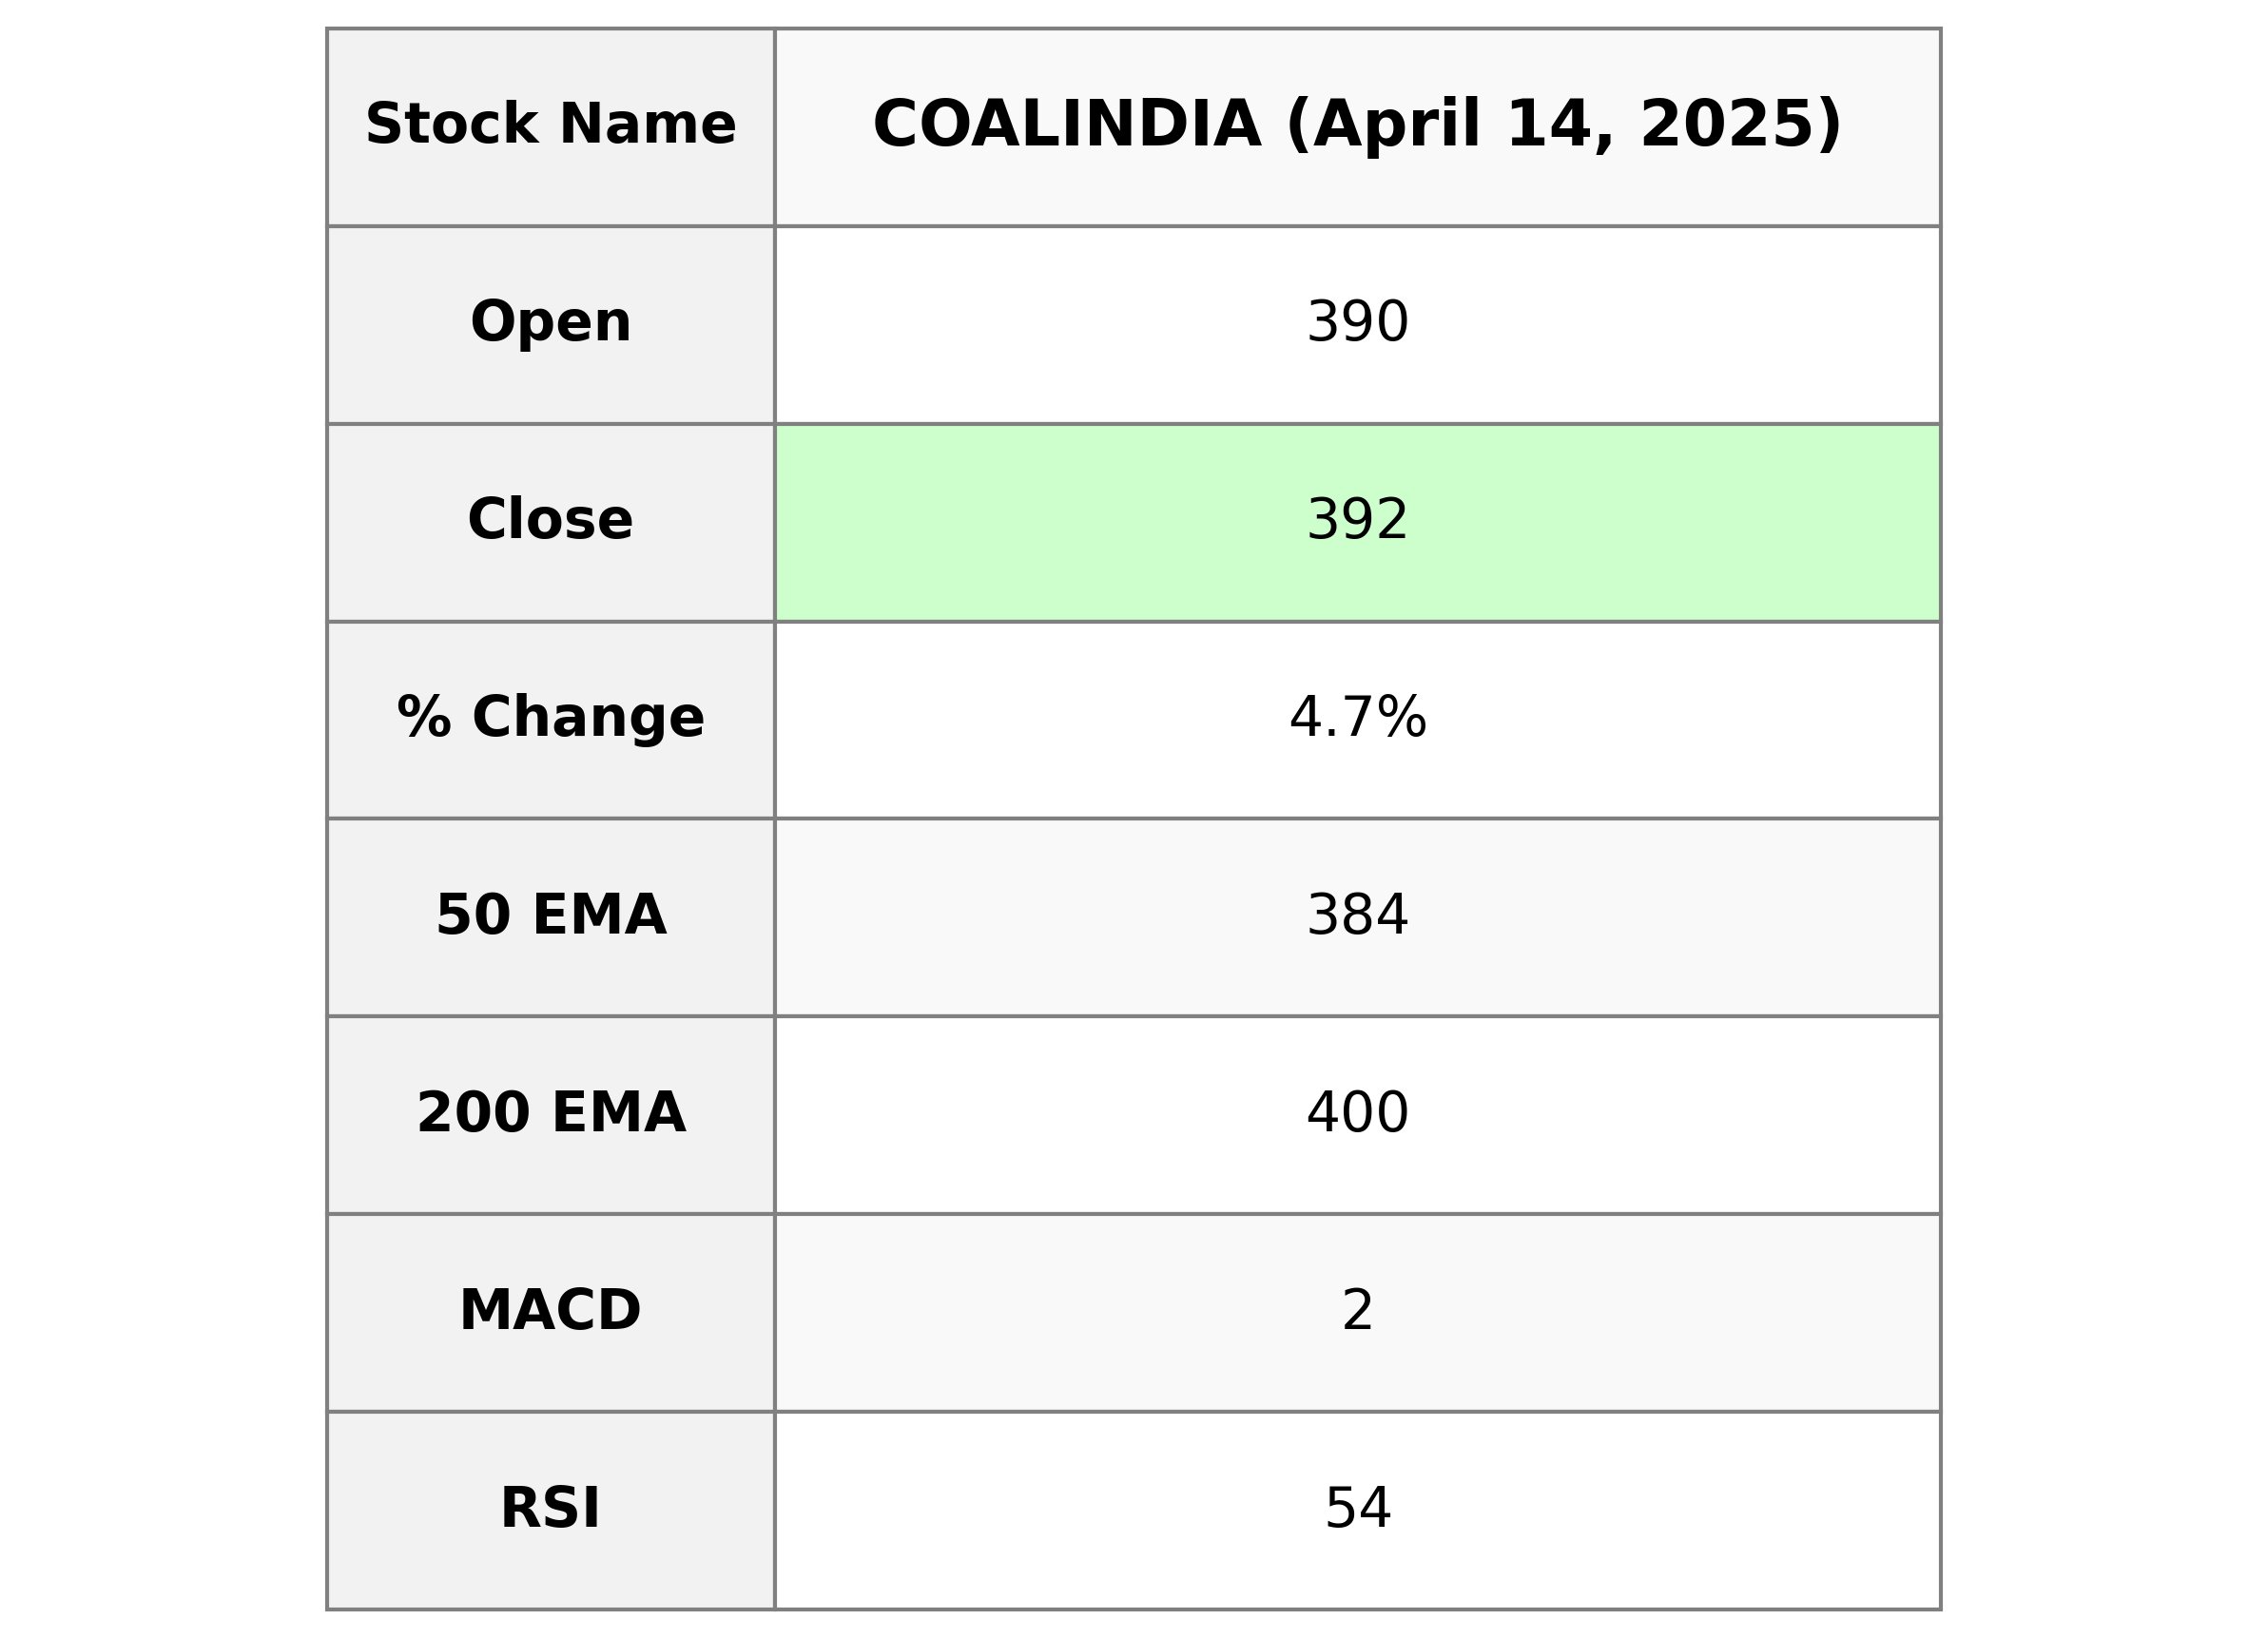
Coal India showcased a solid performance with a closing price of 392.10, up by 4.67%, representing a 17.5 point increase from its previous close. The stock's RSI is at 54.09, indicating neutral momentum, while the MACD suggests a potential bullish trend. With a market cap of over 2.41 trillion, this energy sector giant continues to outperform despite its PE ratio of 7.03.
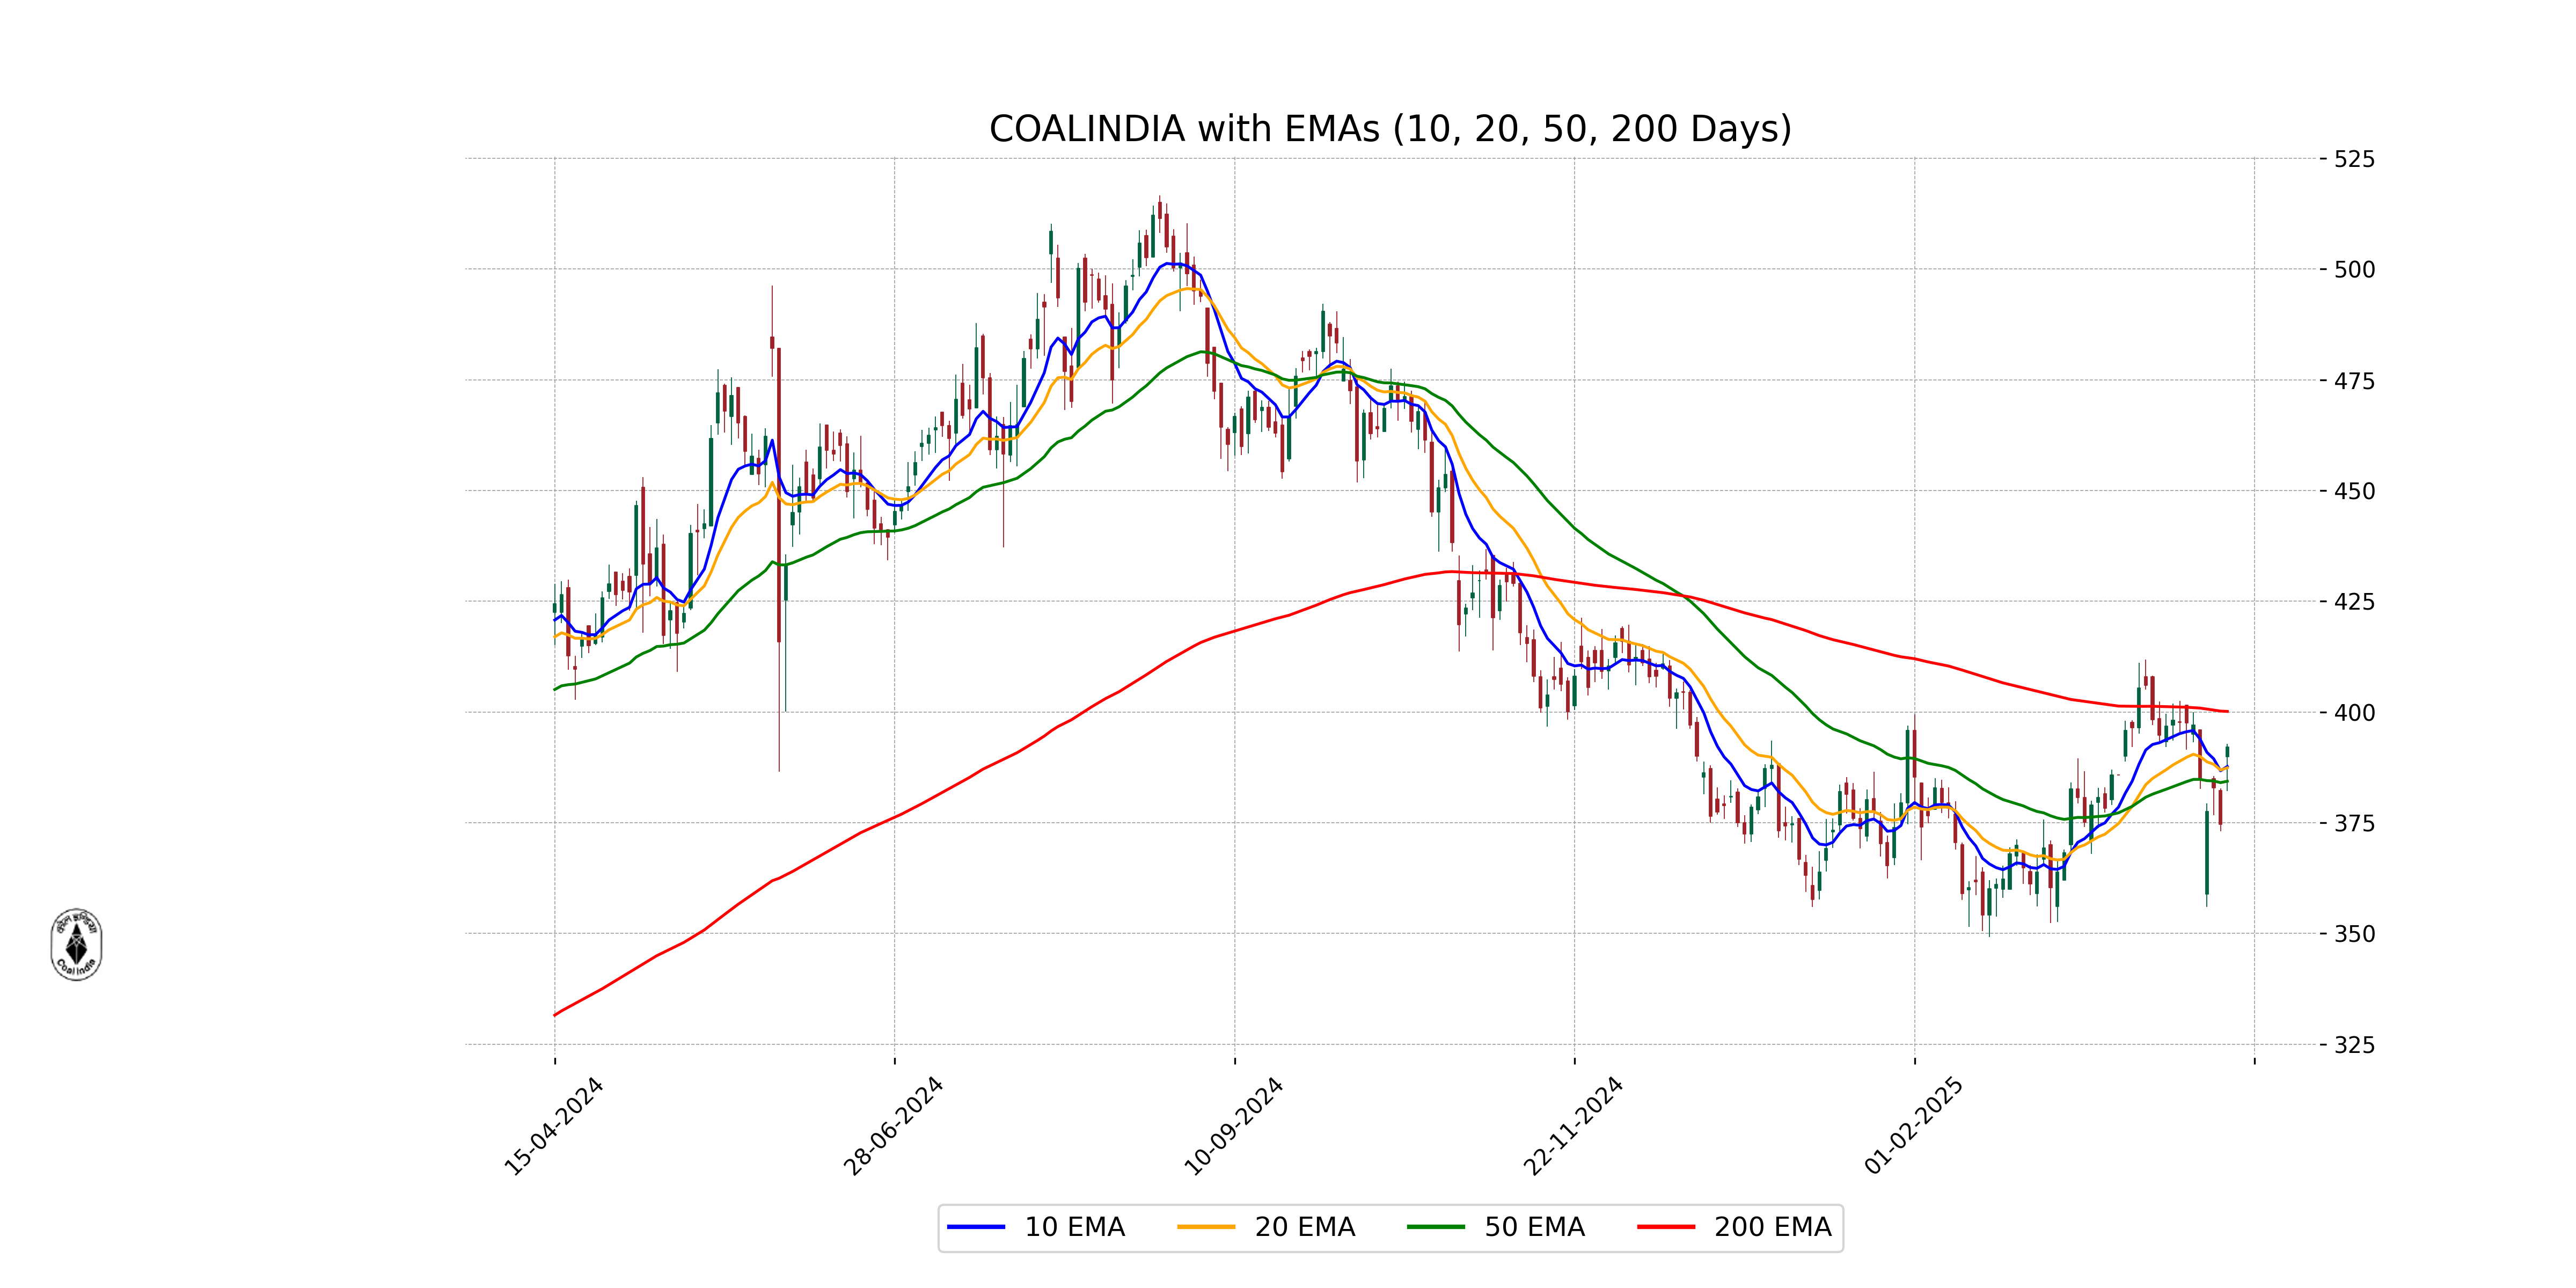
Relationship with Key Moving Averages
Coal India's current stock price is above both the 10-day EMA (387.71) and the 20-day EMA (387.40), suggesting positive short-term momentum. However, it remains below the 200-day EMA (400.13), indicating that it still may be in a longer-term downtrend despite recent gains.
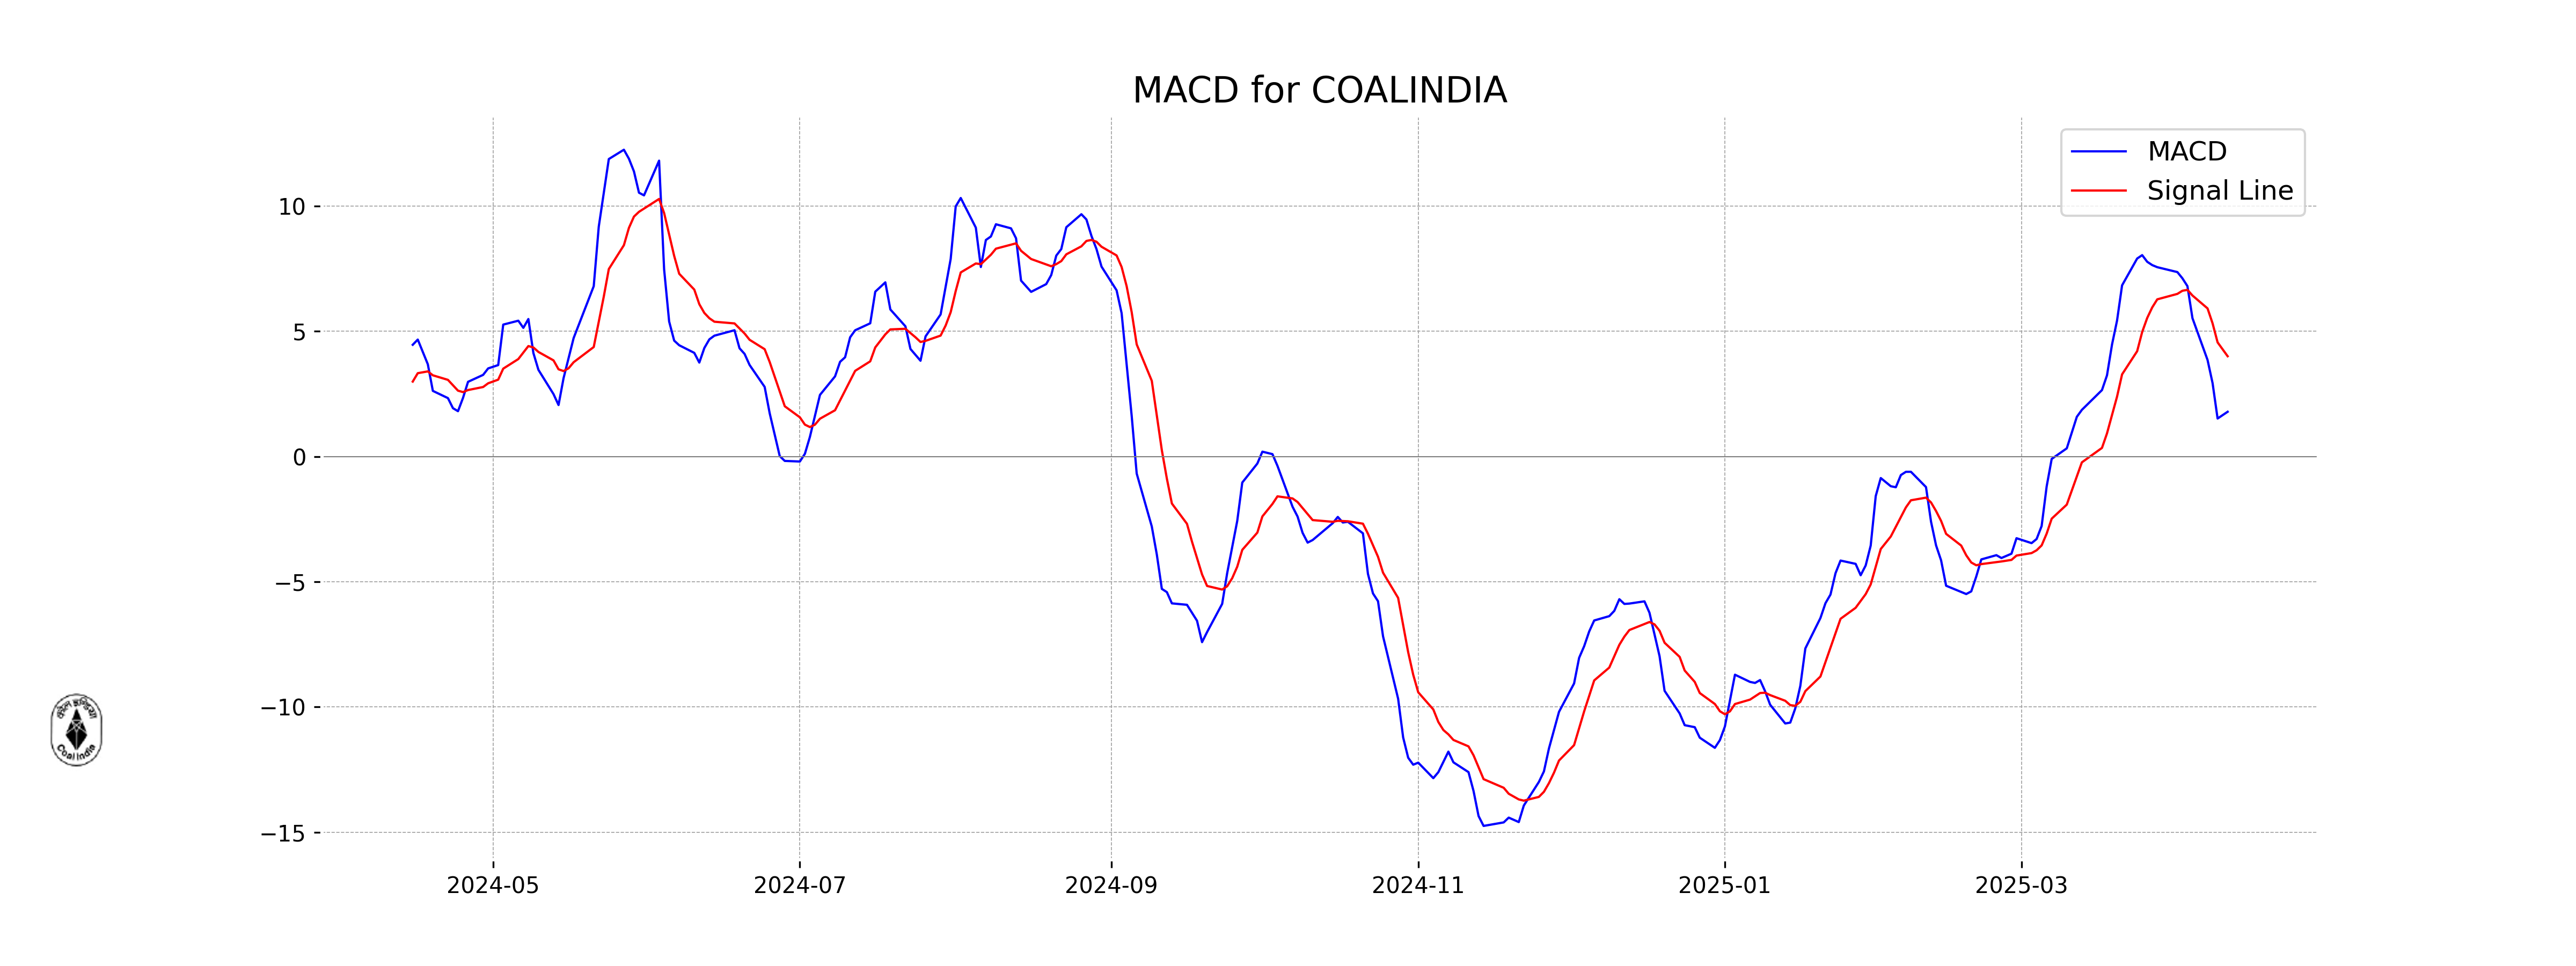
Moving Averages Trend (MACD)
Coal India's MACD value of 1.78 is below its MACD Signal of 4.00, indicating a potential bearish momentum. This suggests that the stock may experience selling pressure unless the MACD value crosses above the signal line, which would suggest a shift to positive momentum.
RSI Analysis
The RSI for Coal India is 54.09, which indicates a neutral position. Typically, an RSI below 30 suggests that a stock is oversold, while above 70 indicates it is overbought. In this case, the RSI near the middle range suggests no strong momentum in either buying or selling.
Analysis for HINDALCO - April 14, 2025

Performance Review for Hindalco Industries Ltd: Hindalco posted a solid performance with a notable percentage change of approximately 6.44%, closing at 600.30 from a previous close of 564. The significant volume of 12.56 million indicates strong market activity, despite the RSI suggesting it's in a somewhat oversold territory. The company's PE ratio of 9.64 suggests it's relatively undervalued compared to sector peers within the Basic Materials sector, specifically in Aluminum.
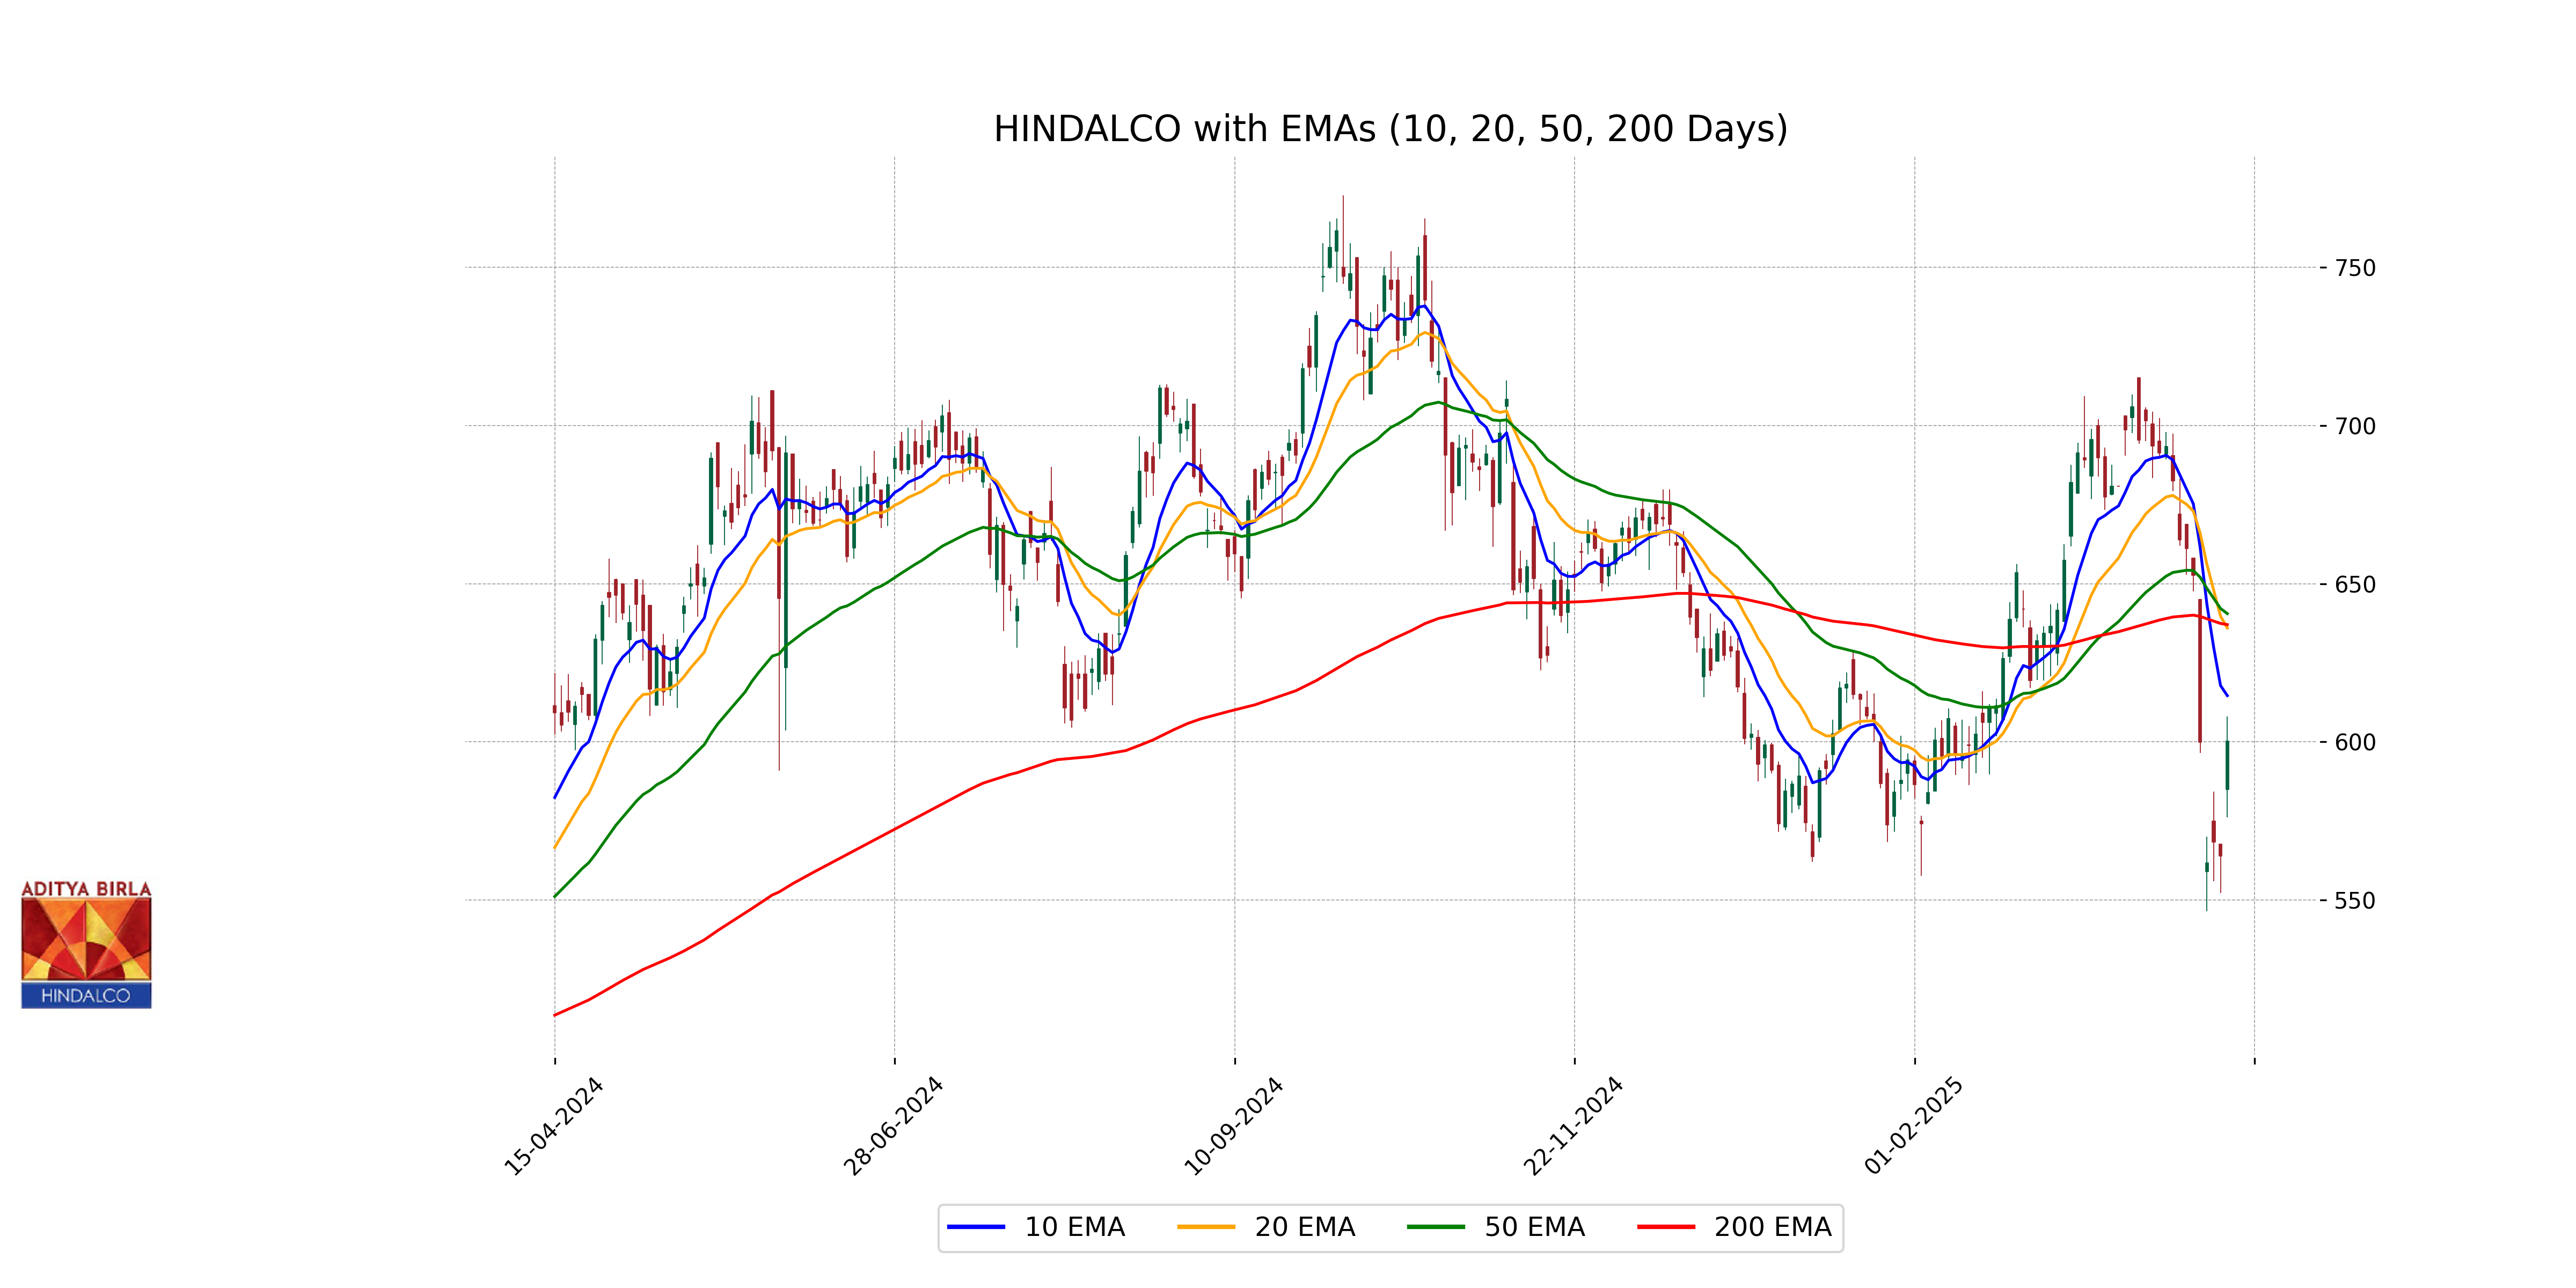
Relationship with Key Moving Averages
The stock price of Hindalco is presently trading below its 10-day, 20-day, 50-day, and 200-day EMA values, indicating a bearish trend. The current price of 600.30 is lower than all the mentioned EMAs, suggesting that the stock might encounter resistance around these average levels.
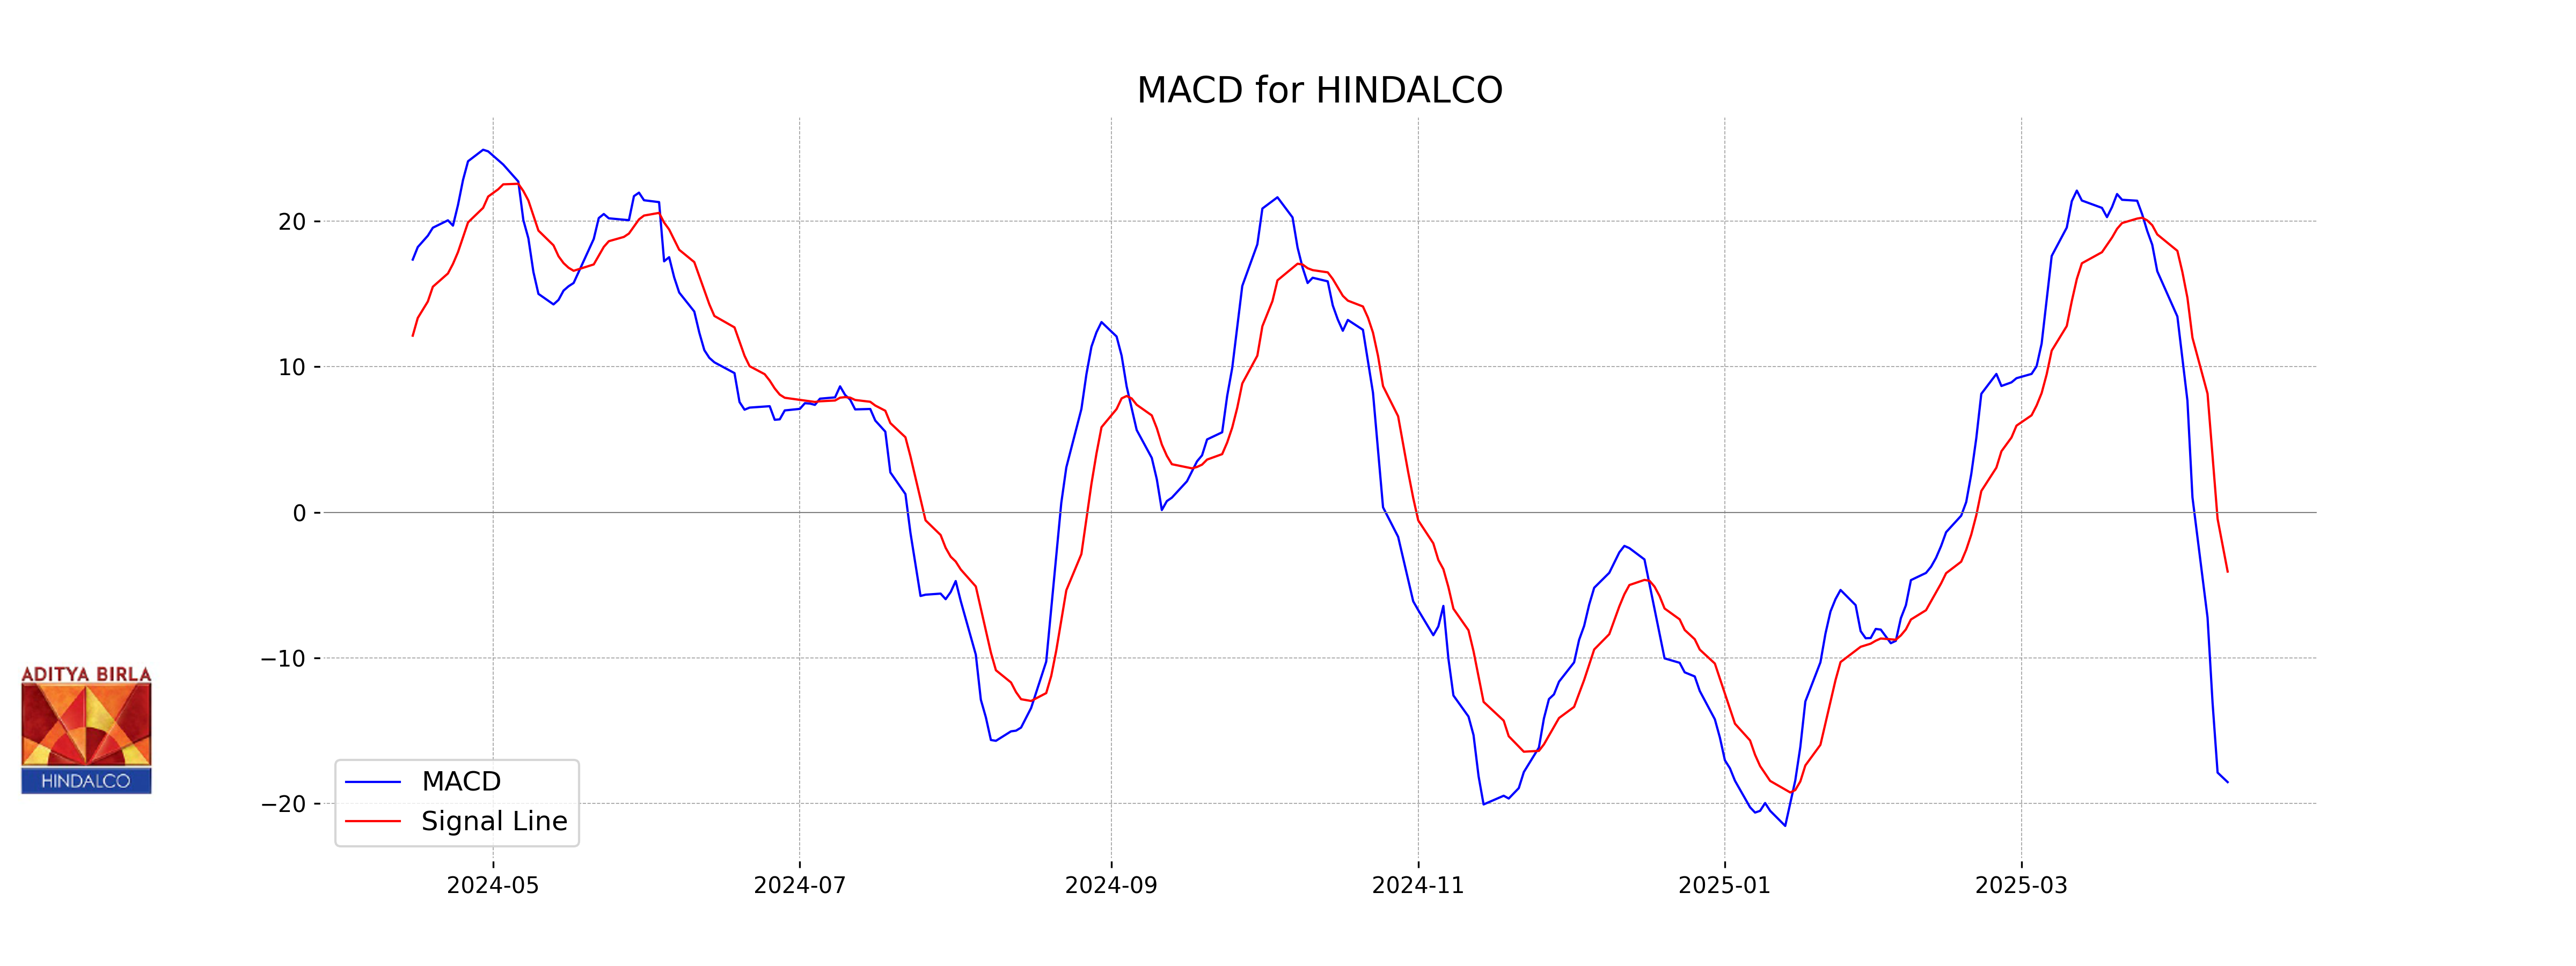
Moving Averages Trend (MACD)
Hindalco's MACD is currently at -18.53, which is below its MACD Signal of -4.07, indicating a potential bearish trend. This suggests that the momentum is negative, and the stock may continue to face selling pressure. The RSI, at 39.07, supports the bearish outlook as it indicates a slightly oversold condition, but not extremely so.
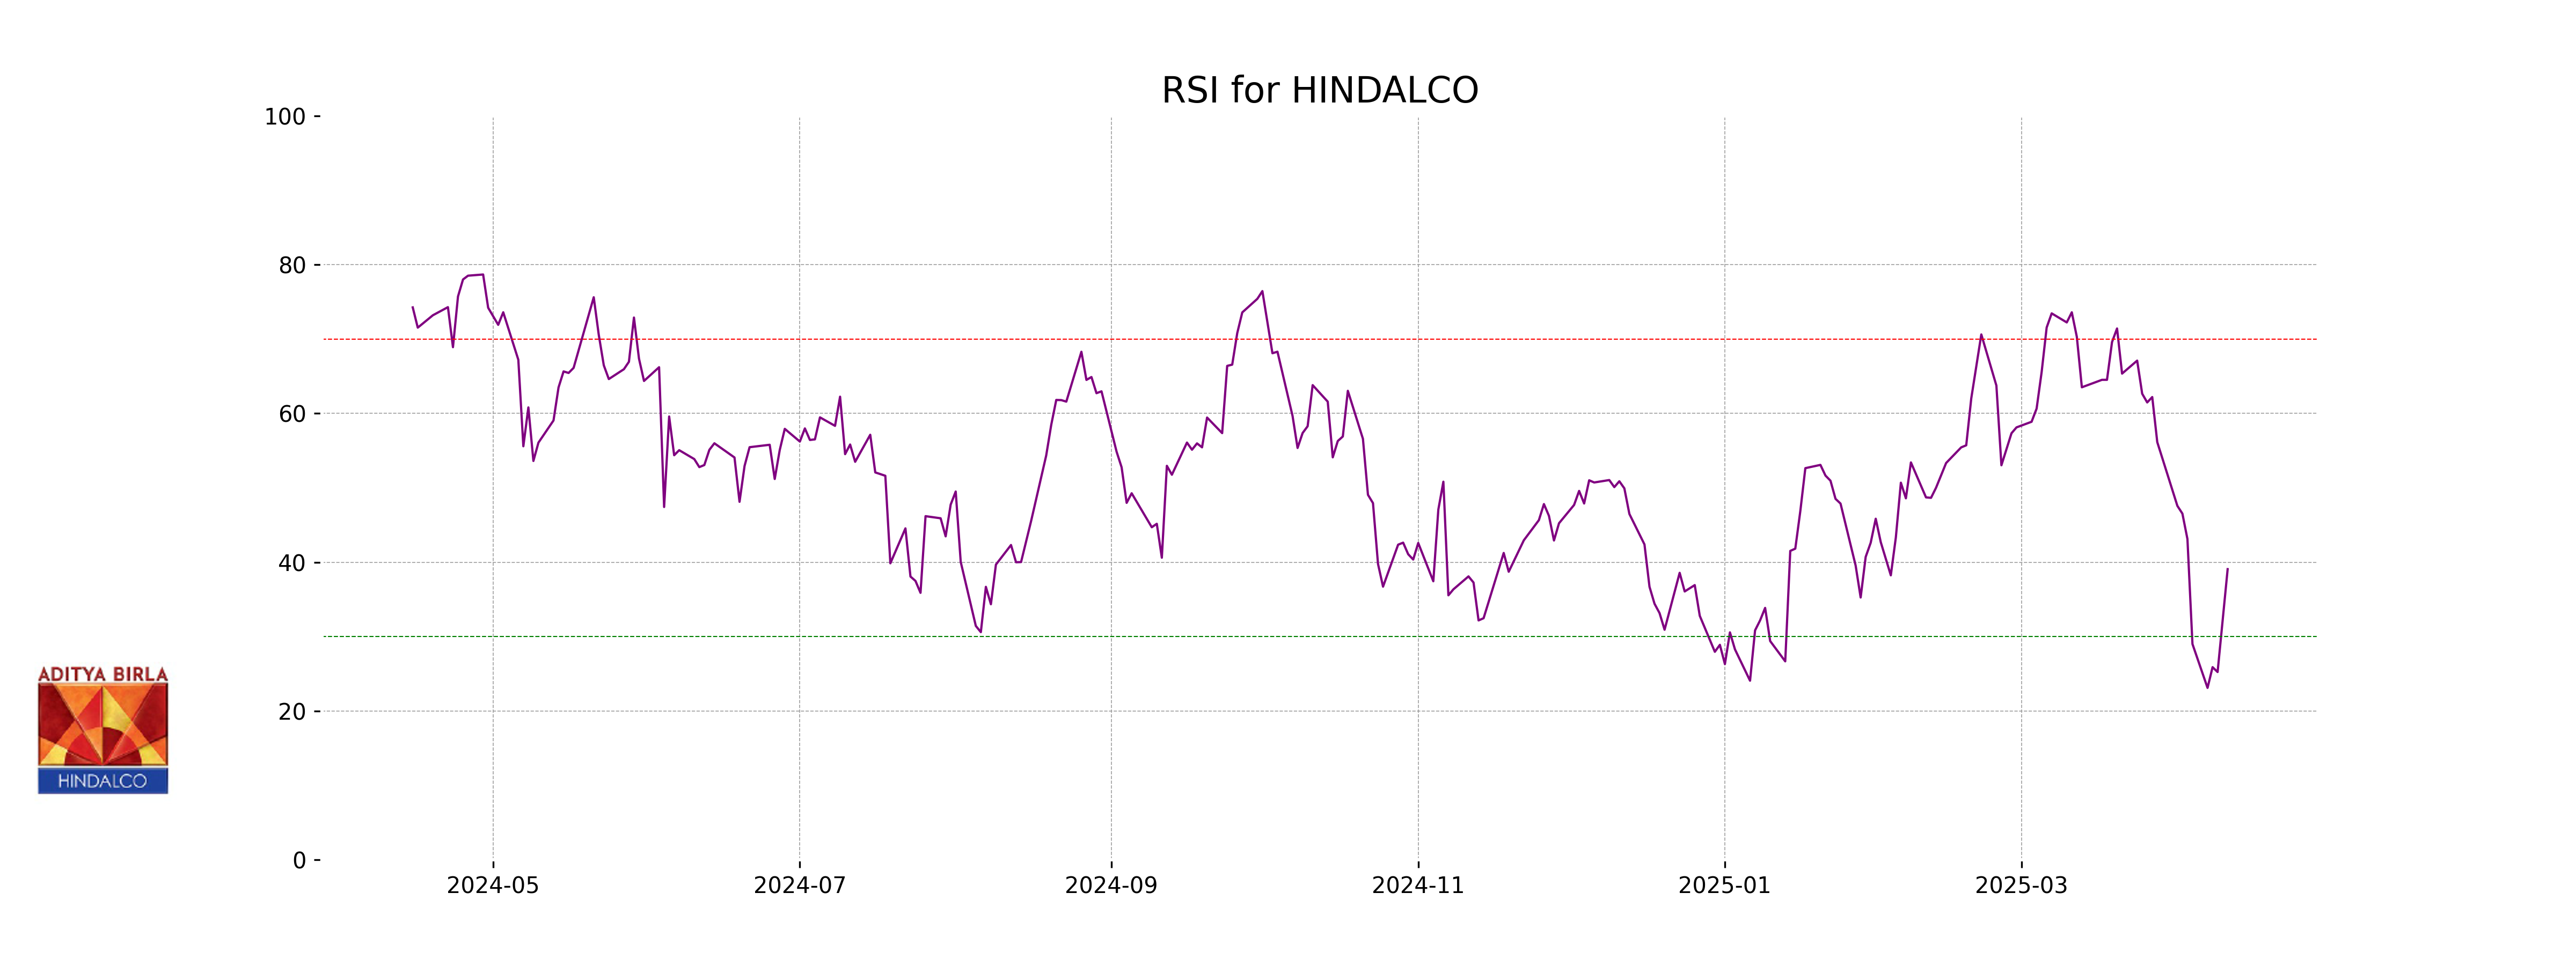
RSI Analysis
The RSI analysis for Hindalco indicates a reading of 39.07, suggesting that the stock is in the oversold territory. This could imply potential for a price reversal or an upward trend if buying interest returns. However, it is also important to consider other technical indicators and market conditions for a comprehensive analysis.
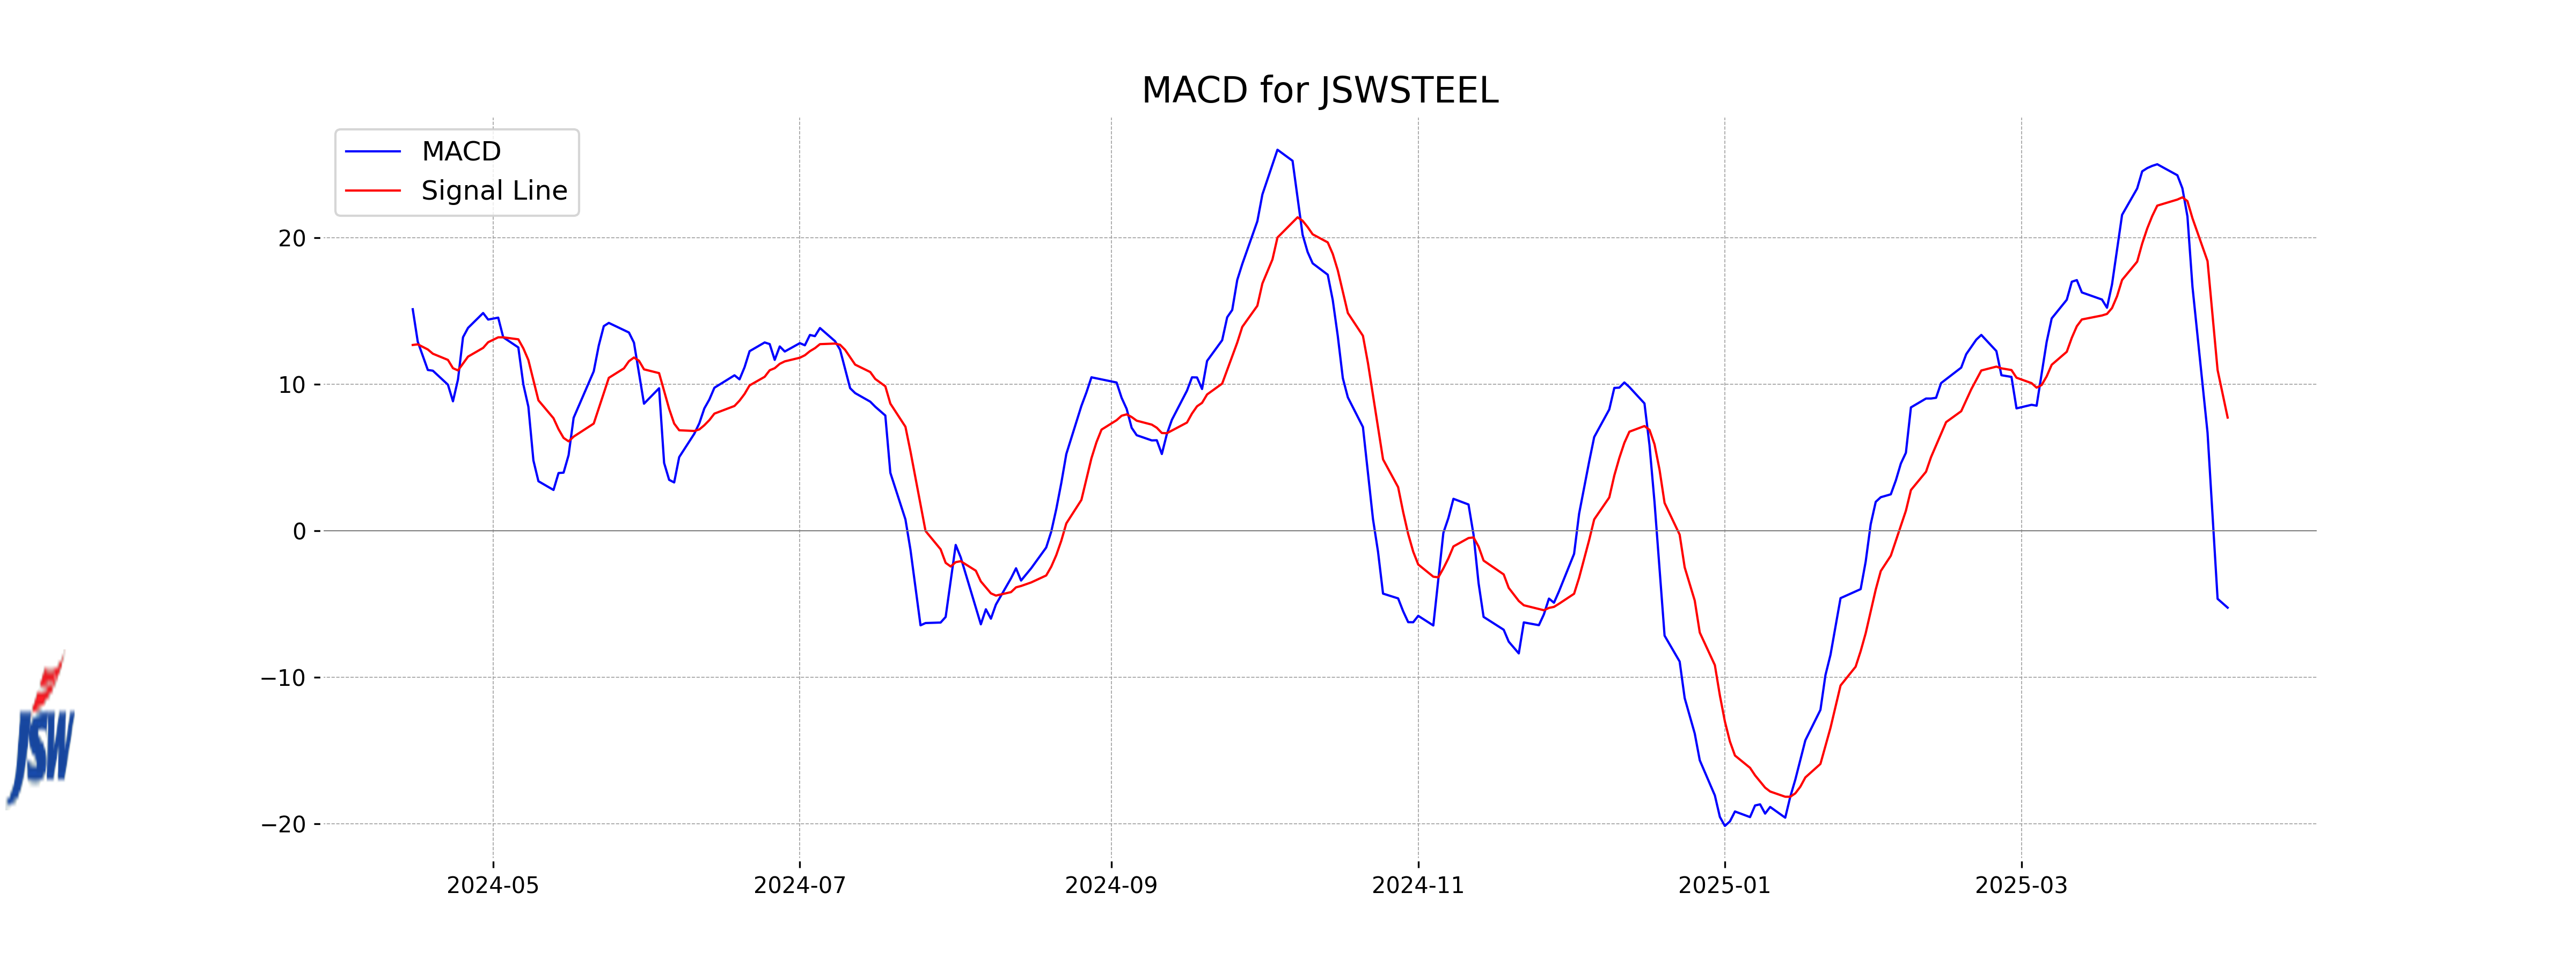
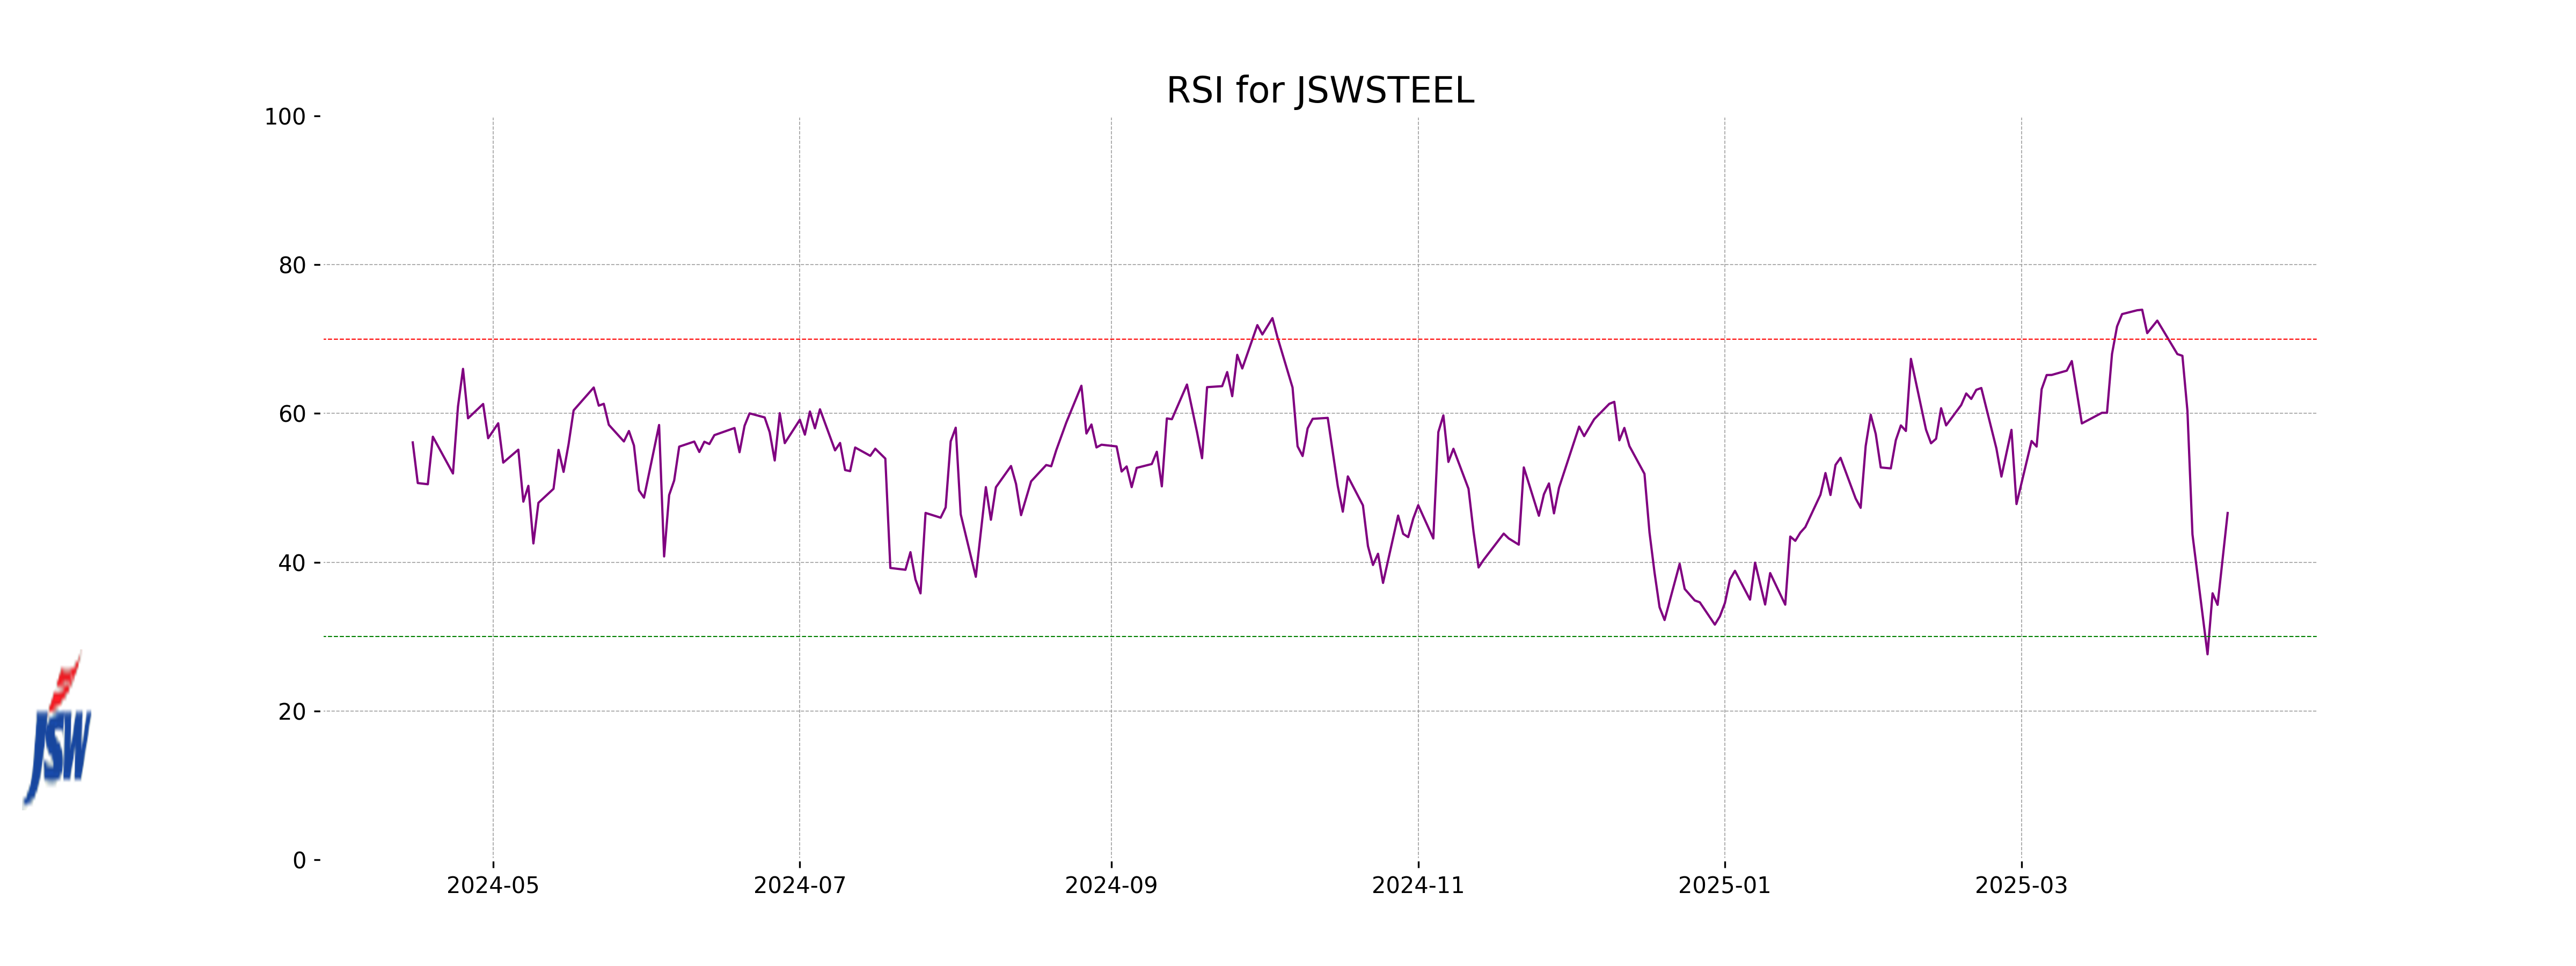
Analysis for JSW Steel - April 14, 2025

JSW Steel opened at 972.45 and closed at 990.25, registering a gain of 4.73% with a points change of 44.70 from the previous close of 945.55. The stock's performance showed a positive momentum, while the RSI was at 46.62, indicating it is not yet overbought. Despite the rise, the MACD indicates bearish sentiment as it remains in the negative.
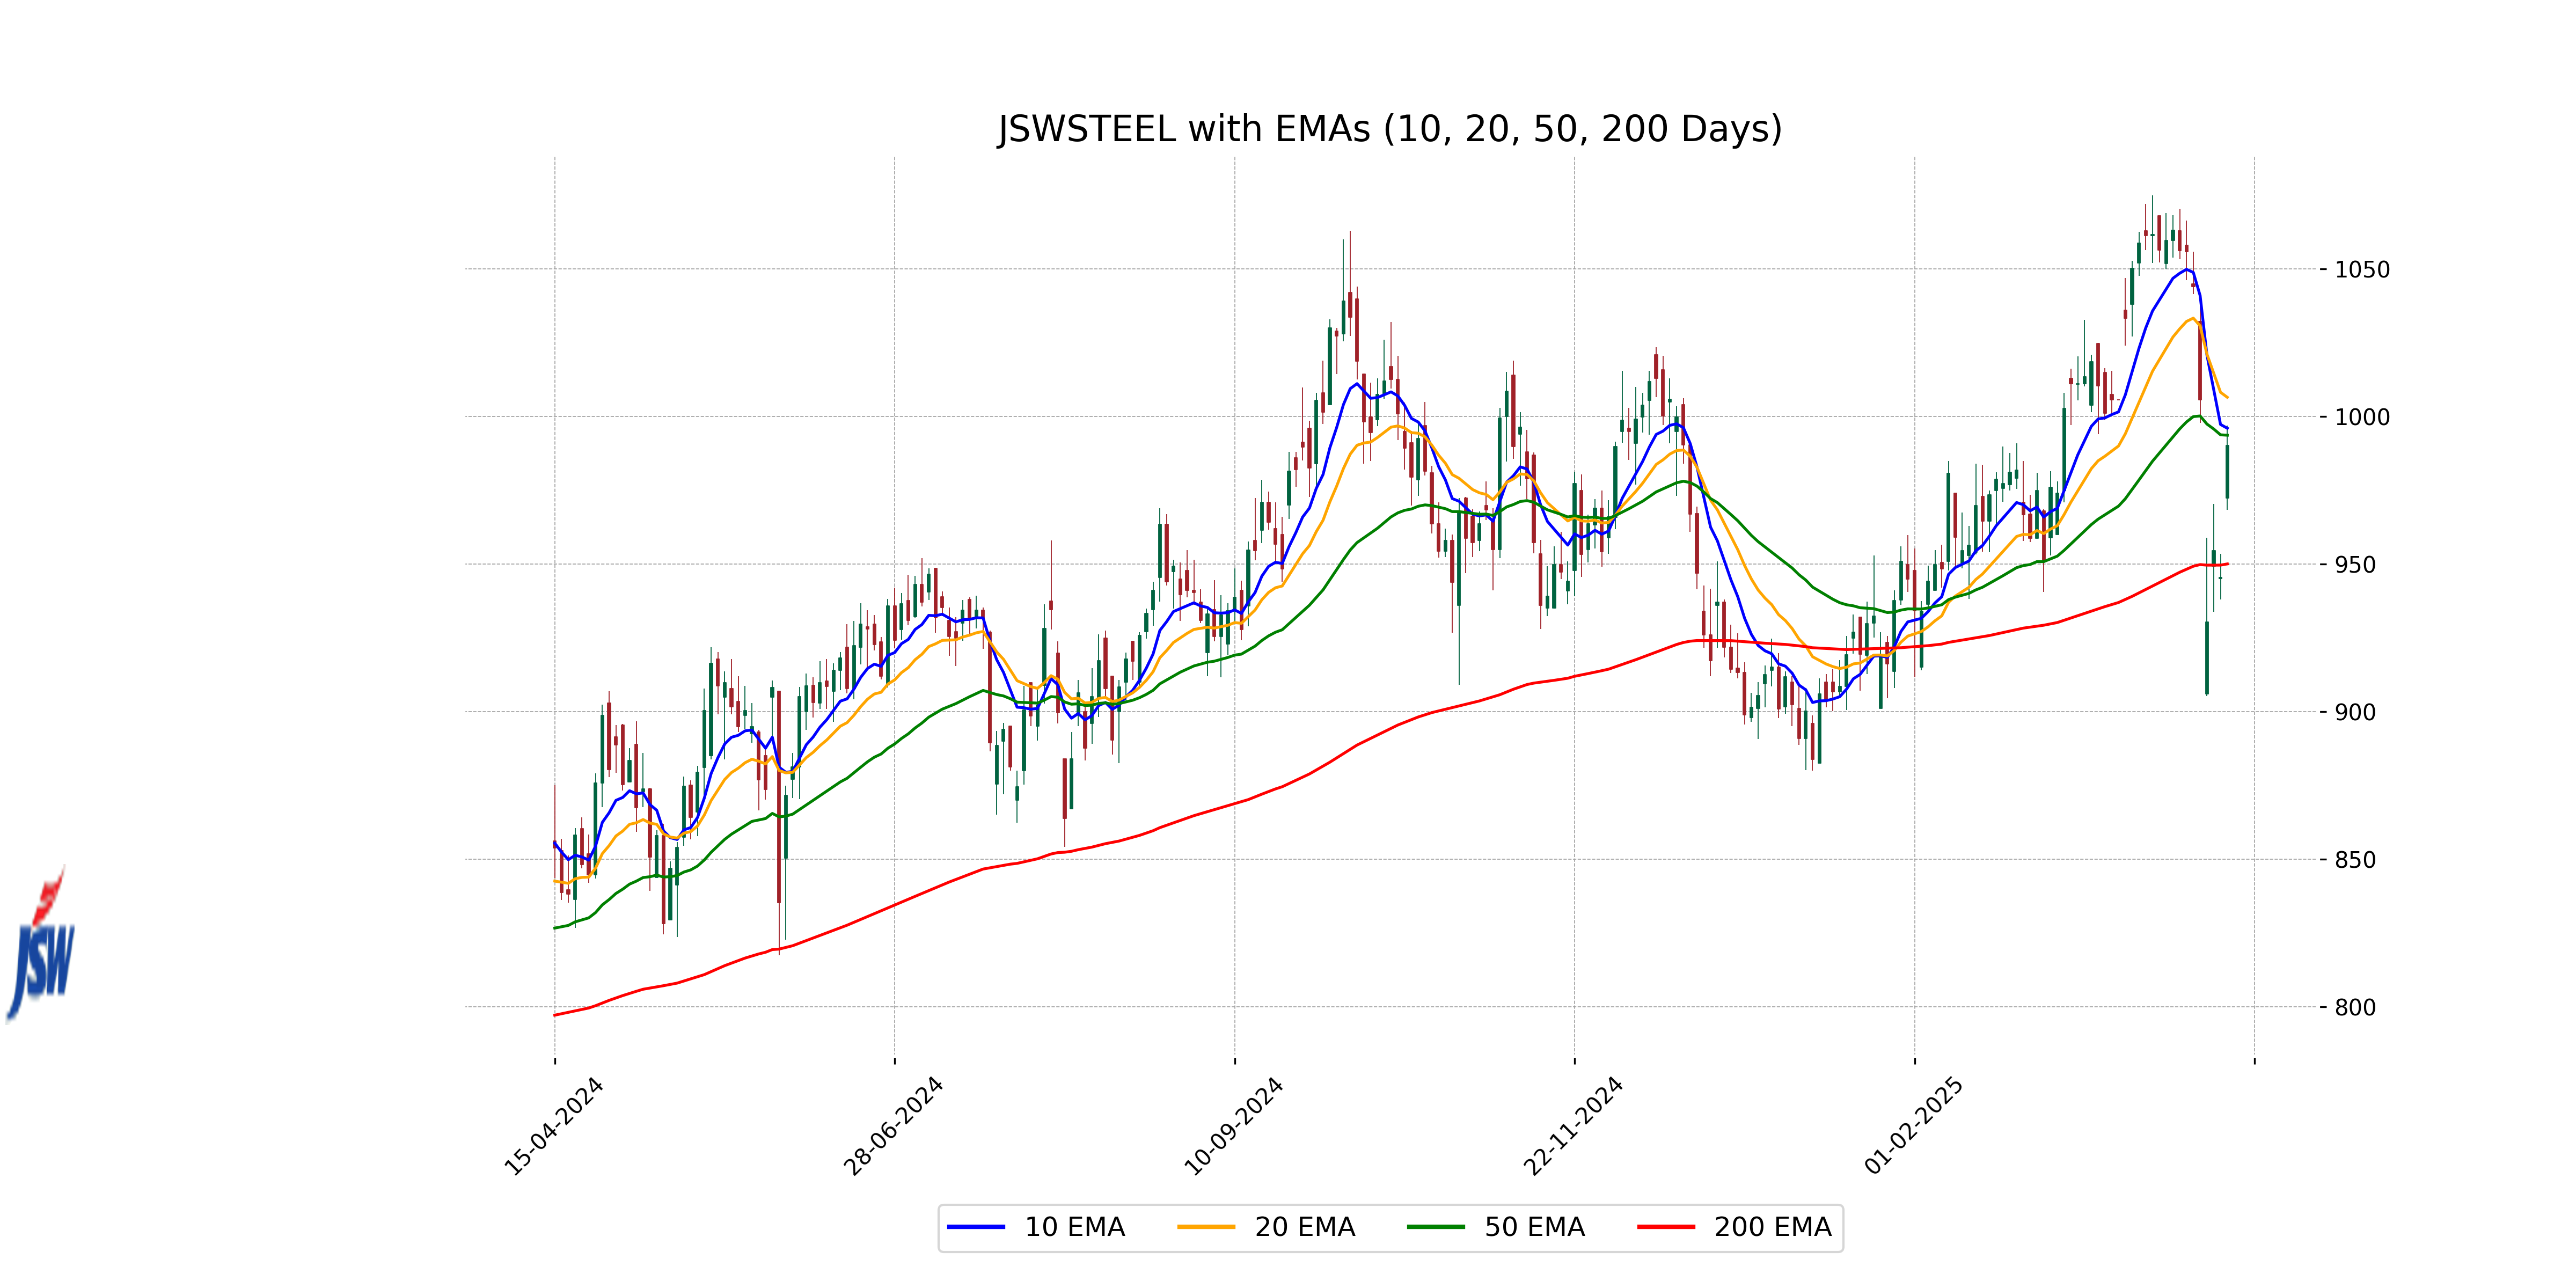
Relationship with Key Moving Averages
JSW Steel's current stock price of 990.25 is below its 10 EMA of 996.03 and the 50 EMA of 993.67, indicating potential bearish sentiment in the short term. However, it remains above the 200 EMA of 950.05, suggesting potential longer-term support.
Moving Averages Trend (MACD)
JSW Steel's MACD is currently at -5.26, which is below the MACD Signal of 7.71. This indicates that the stock may be experiencing bearish momentum in the short term. Traders might look for potential signs of a trend reversal if the MACD starts to converge with the Signal line.
RSI Analysis
RSI Analysis for JSW Steel: The Relative Strength Index (RSI) value of 46.62 indicates that the stock is in the neutral zone, suggesting neither overbought nor oversold conditions. Traders might consider this range as a period of consolidation, with potential for movement in either direction depending on future market conditions.
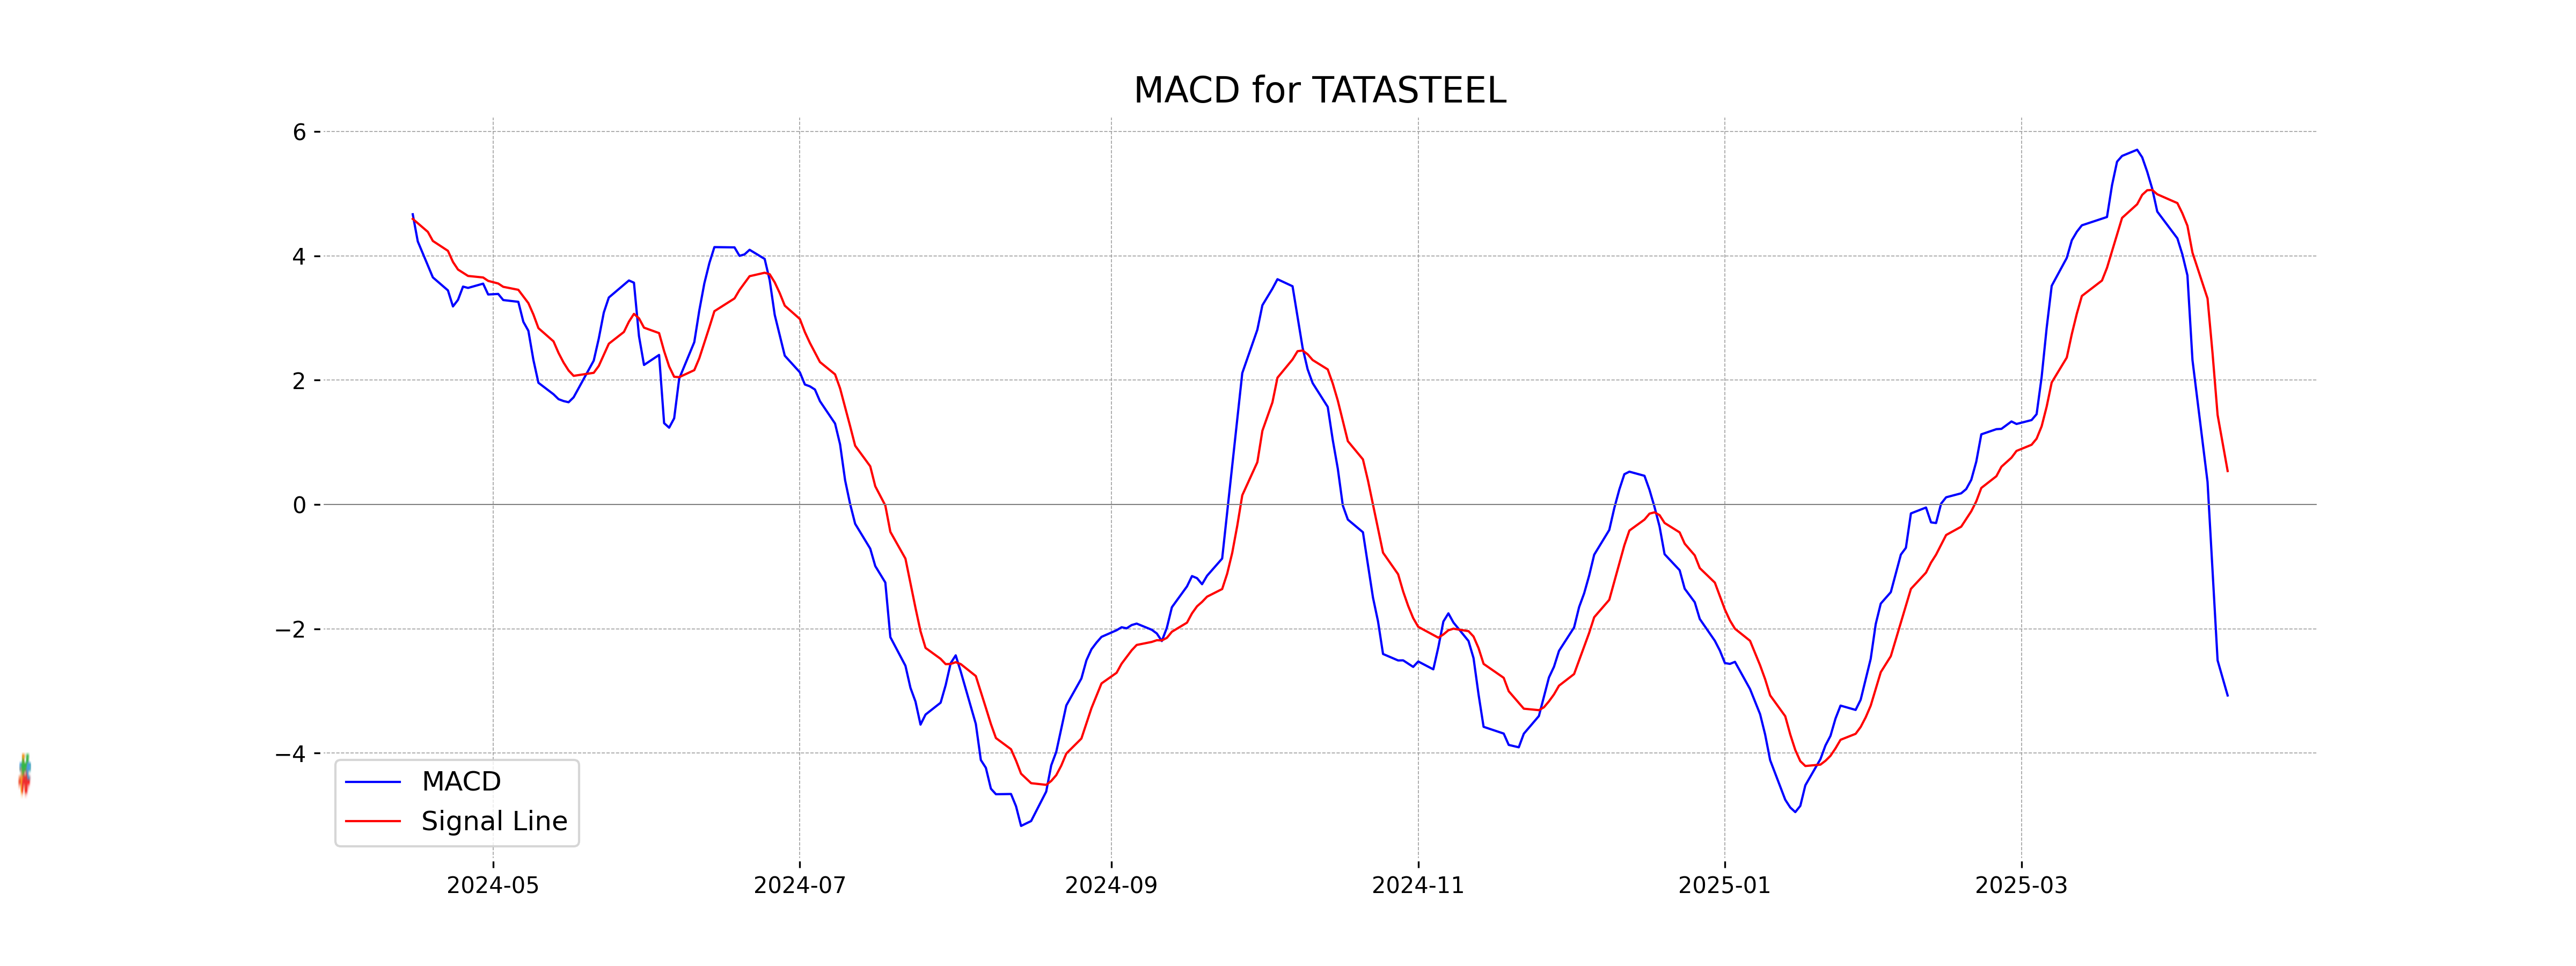
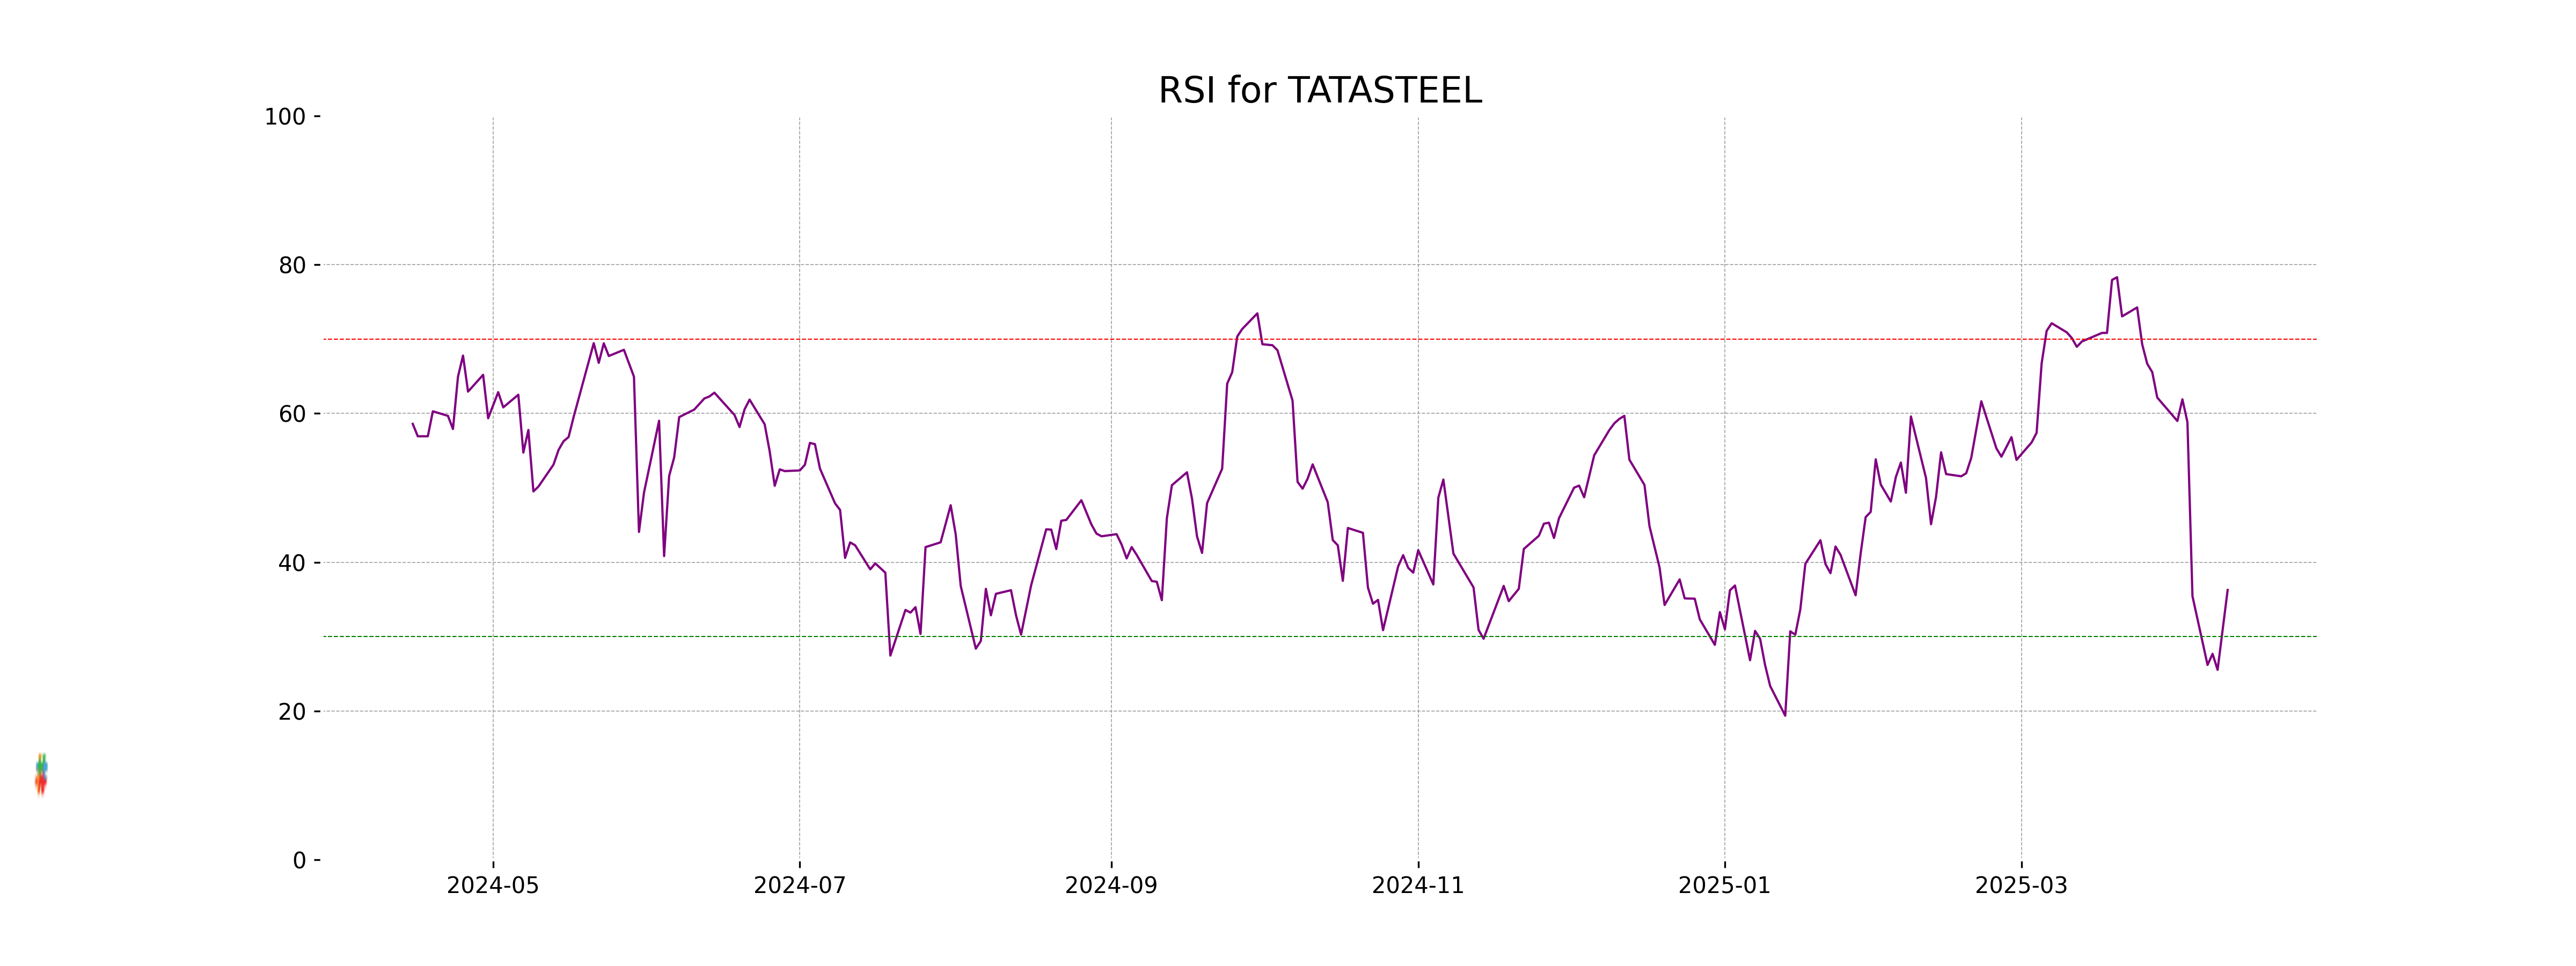
Analysis for Tata Steel - April 14, 2025

Tata Steel Performance: Tata Steel has shown a notable percentage increase of 4.91% with a points change of 6.24, closing at 133.42, following a previous close of 127.18. The volume of shares traded is significant at 73,706,472. However, key indicators such as the EMA values suggest the stock is trading below its major averages, and the RSI is relatively low at 36.27, indicating potential bearish sentiment. With a PE ratio of 60.39 and an EPS of 2.21, the company operates in the Basic Materials sector, specifically in the Steel industry in India.
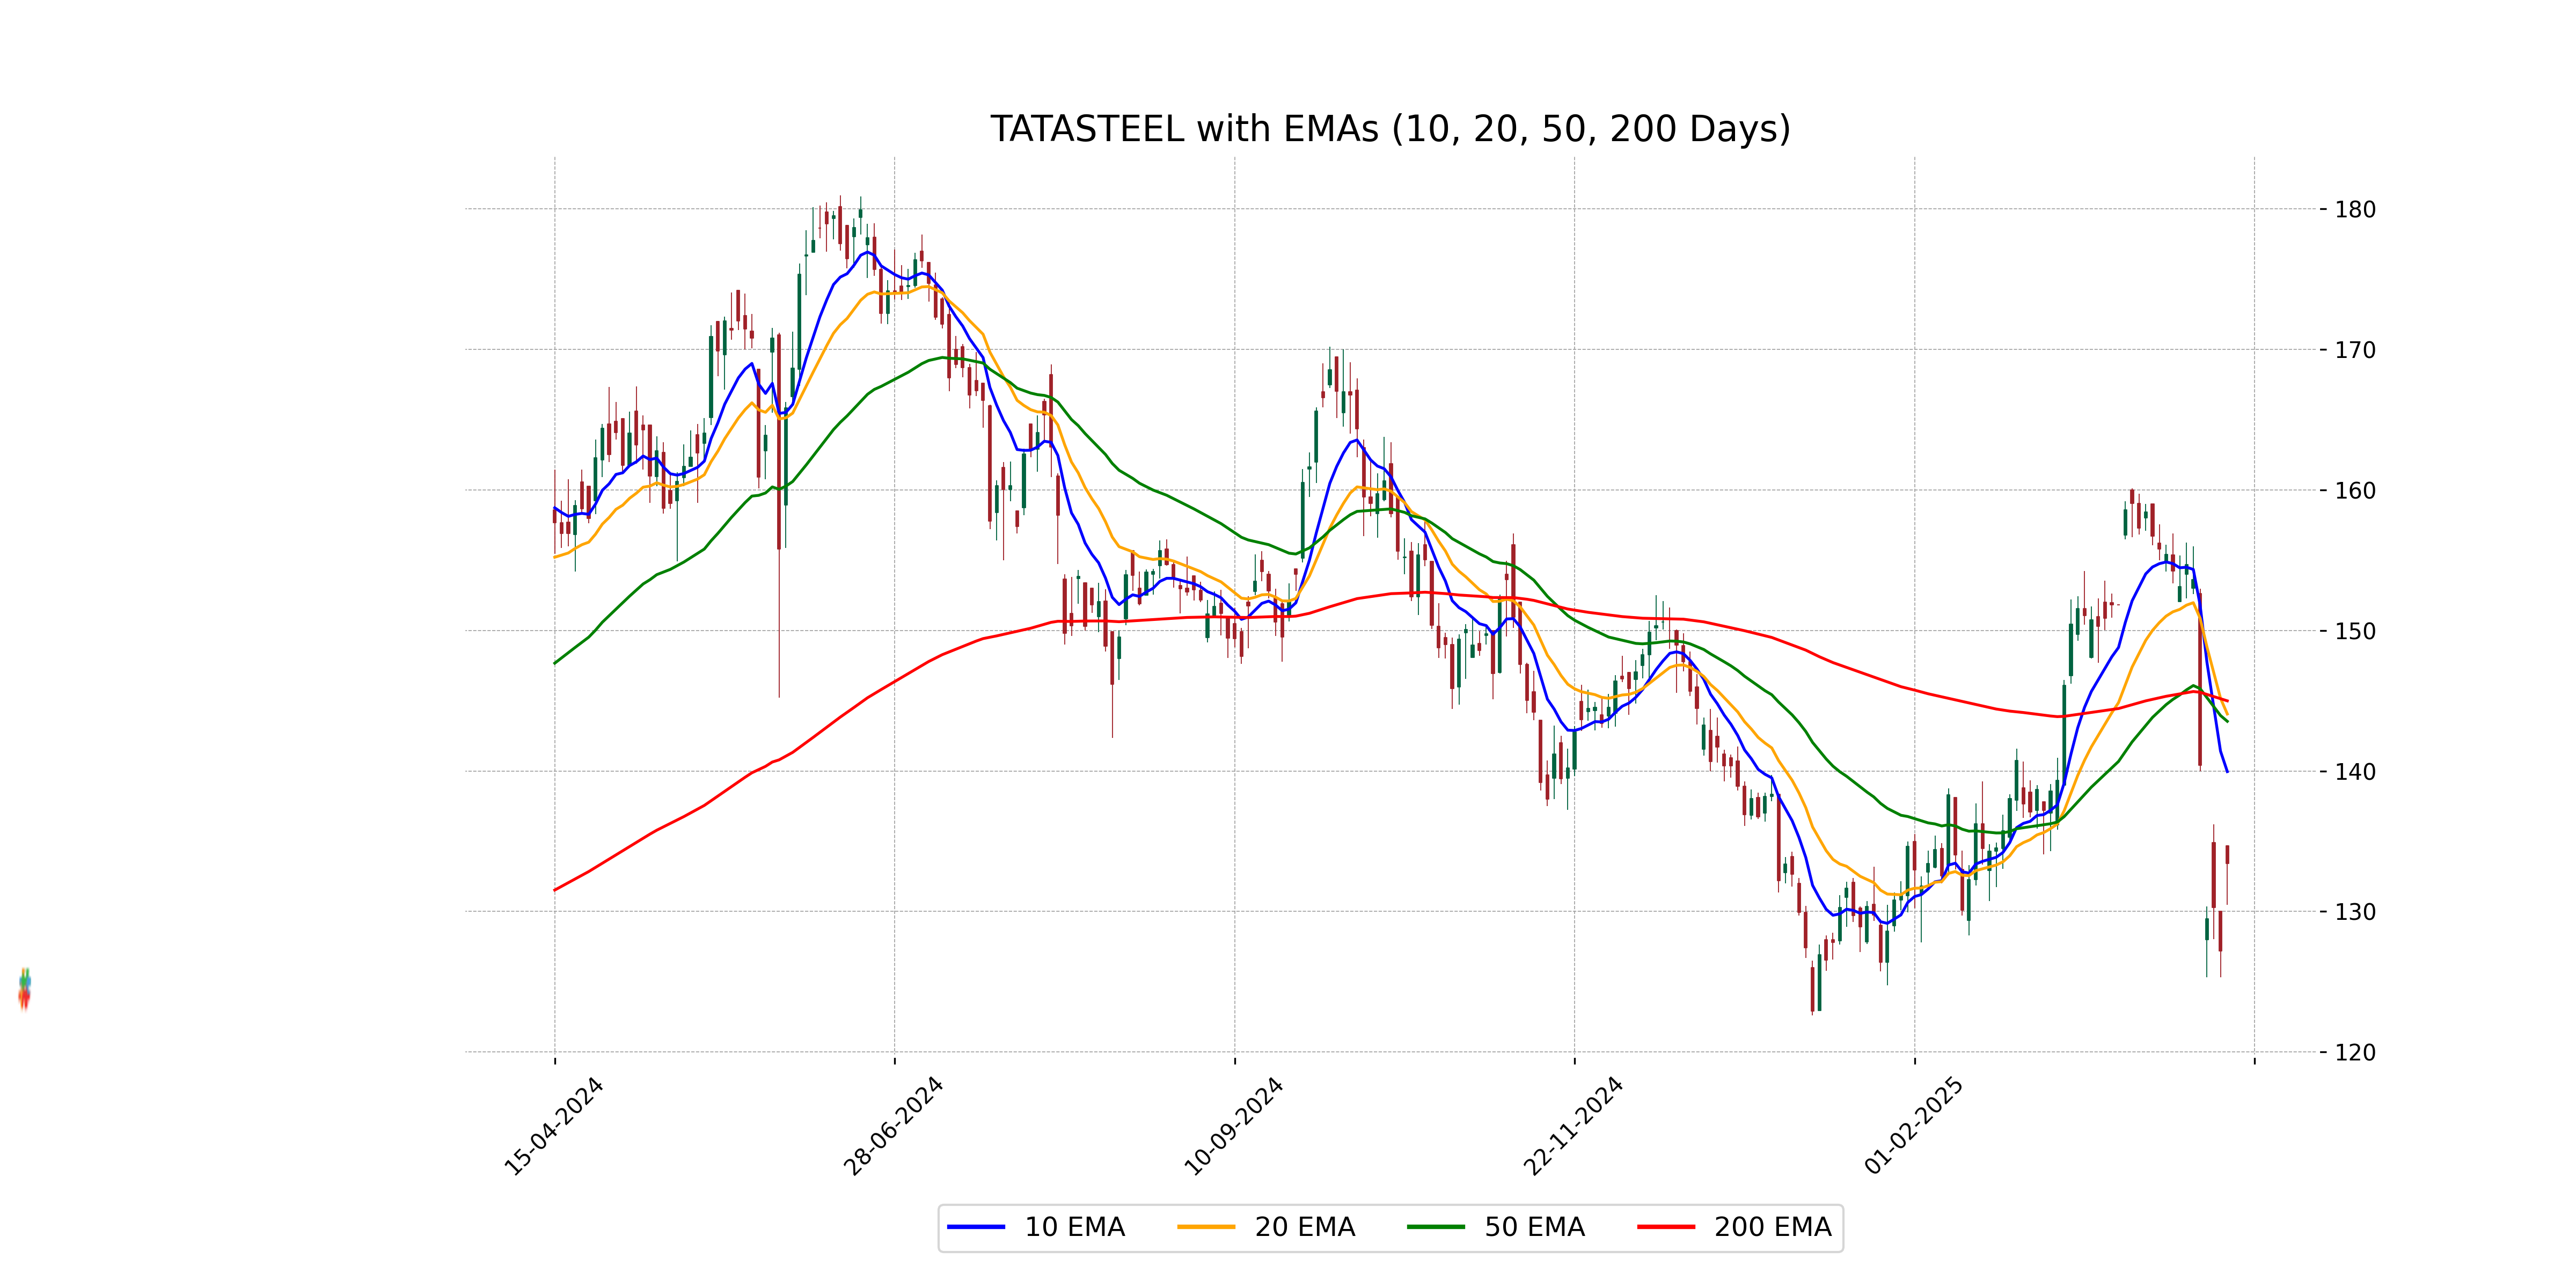
Relationship with Key Moving Averages
Tata Steel's current stock price is below its short-term (10 EMA) and medium-term (50 EMA) moving averages, as well as the long-term (200 EMA) moving average, indicating a potential bearish trend. The RSI value of 36.27 also suggests it is nearing the oversold territory.
Moving Averages Trend (MACD)
MACD Analysis for Tata Steel: The MACD for Tata Steel is -3.073, which indicates a bearish momentum as it is below the MACD Signal line of 0.537. This suggests that the stock might be experiencing downward pressure currently.
RSI Analysis
The RSI of Tata Steel is 36.27, indicating that the stock is approaching the oversold territory, as RSI values below 30 typically signify that a stock may be undervalued. This suggests potential buying interest may emerge if the downtrend continues.
Up Next
NSE Nifty 50 Top gainers: What are the 5 Biggest Stock gainers Today April 14, 2025

New Zealand commits USD 20 bn investment in India under FTA in 15 yrs; on lines of EFTA pact

India, New Zealand conclude FTA talks; pact to offer duty-free access, USD 20 bn FDI

FTA with New Zealand to significantly deepen bilateral economic engagement: Govt

Rupee breaches 91-mark against US dollar for first time in intra-day trade

Microsoft commits USD 17.5 billion investment in India: CEO Satya Nadella

More videos

CBI books Anil Ambani's son, Reliance Home Finance Ltd. in Rs 228 crore bank fraud case

RBI raises FY26 GDP growth projection to 7.3 pc

RBI trims policy interest rate by 25bps to 5.25pc, loans to get cheaper

Rupee slumps to all-time low of 90.25 against US dollar in intra-day trade

Reliance completes merger of Star Television Productions with Jiostar

India to lead emerging market growth with 7pc GDP rise in 2025: Moody’s

Nifty hits record high after 14 months; Sensex nears all-time peak

Reliance stops Russian oil use at its only-for-export refinery to comply with EU sanctions

ED attaches fresh assets worth over Rs 1,400 cr in case against Anil Ambani's Reliance Group

India signs one-year deal to import 2.2 million tonnes of LPG from US