


Highlights
- Nifty Auto gains 1.85% leading sector advance
- Nifty Energy up by 1.30% fueled sector momentum
- Bank Nifty dips by -0.36%, dragging market mood
Latest news

Kenstar Tallde 105 BLDC Cooler Review: The Appliance That Made Delhi Summer Slightly Less Hostile

How much does a ULIP plan really cost? A break-down of all charges

Chandigarh University Biotechnology Scientists Faculty Secure Rs 1.16 Crore Government Grants from ICMR and ANRF for Mustard Yield and Diabetic Kidney Disease Research

Colt DCS appoints Fumi Takei as Vice President and Head of Japan

Skyways Air Services Ltd. and O.P. Jindal Global University Sign MoU to Skill Youth in Logistics, Aligned with Skill India Mission

Global Launch of Abhijat Marathi OTT at the Bharat Pavilion - Cannes Film Festival 2026

Industrial marketplace with its inbuilt Inventory Management Software & Procurement Tool - Raprocure is reimagining manufacturing procurement

Korean district court restricts Samsung union strike scope ahead of planned walkout
Indian stock market sector-wise performance today - May 5, 2025


The stock market on Monday (May 5, 2025) saw varied performances across different sectors and indices, with some displaying notable changes that highlight the dynamism of the current financial environment.
The Nifty Auto index led the pack with an impressive increase of nearly 1.85%, signaling strong investor confidence and positive momentum in the automotive sector.
This notable rise suggests improved market sentiment and potential positive news or developments within the automotive industry that investors found promising.
Following closely was the Nifty Energy index, which recorded an increase of about 1.30%. The gains in this sector may be attributed to fluctuations in energy prices or positive earnings reports from major energy companies. It suggests a broad-based support across the various components of the energy sector.
The Nifty FMCG index also experienced a healthy advance of approximately 1.22%. Fast-moving consumer goods often attract attention when there's anticipation of increased consumer spending, possibly driven by seasonal demands or shifts in consumer preferences.
The Nifty Infrastructure index showed a smaller yet respectable gain of 1.16%, indicating moderate investor optimism and possible future growth prospects in infrastructure investments, perhaps influenced by government policy changes or major infrastructure projects commencing.
Nifty 50, the benchmark index, witnessed a rise of around 0.47%. Its performance reflects the broad market sentiment and is often seen as indicative of the overall economic outlook.
While most sectors enjoyed upward momentum, the Nifty Bank index was the outlier, showing a slight decline of 0.36%.
This decline might be reflective of regional or global financial uncertainties affecting banking operations or concerns over interest rates impacting banking profitability. Interestingly, the Nifty IT index increased marginally by 0.28%.
The tech sector often mirrors global tech trends, and recent gains might point towards robust earnings or new technology adoptions, although investor caution seems apparent.
Meanwhile, Nifty Metal rose modestly by 0.96%. This sector could be reacting to commodity price movements or governmental policy adjustments affecting manufacturing.
The mixed performances across different indices underline the nuanced nature of the market. The day’s trading suggests optimism in sectors tied to consumerism and energy, balanced by hesitance in banking.
The shifts are likely driven by a combination of global economic factors, domestic policy changes, and sector-specific news that together prompt varied investor reactions.

Analysis for Sensex - May 05, 2025

The Sensex opened at 80,661.62 and closed at 80,796.84, marking a percentage change of 0.37% with a points increase of 294.85 from the previous close. The Relative Strength Index (RSI) is at 67.92, indicating a bullish sentiment, and the Moving Average Convergence Divergence (MACD) also shows bullish momentum with a positive difference over its signal line.

Relationship with Key Moving Averages
The closing value of Sensex at 80796.84 is above both the 50-day and 200-day Exponential Moving Averages (EMA) of 77406.11 and 77318.14, indicating a possible upward trend. It is also above the 10-day and 20-day EMAs, signifying short-term bullish momentum.
Moving Averages Trend (MACD)
MACD Analysis for Sensex: The MACD of 1278.13, which is higher than its signal line of 1017.65, indicates a bullish momentum in the Sensex. This suggests that the current trend is likely to continue upwards.

RSI Analysis
The RSI for Sensex is 67.92, which is approaching the overbought territory, typically considered above 70. This suggests that the market may be experiencing upwards momentum, but could also be nearing a point where it might pull back or consolidate.

Analysis for Nifty Auto - May 05, 2025

The Nifty Auto index opened at 22,443.20 and closed at 22,699.20, reflecting a positive change of 1.85% from the previous close of 22,286.50. During the day, it reached a high of 22,732.45 and a low of 22,366.30, with a significant points increase of 412.70. Notably, the RSI is at 65.10, indicating a bullish momentum, while the MACD is considerably above the signal line.
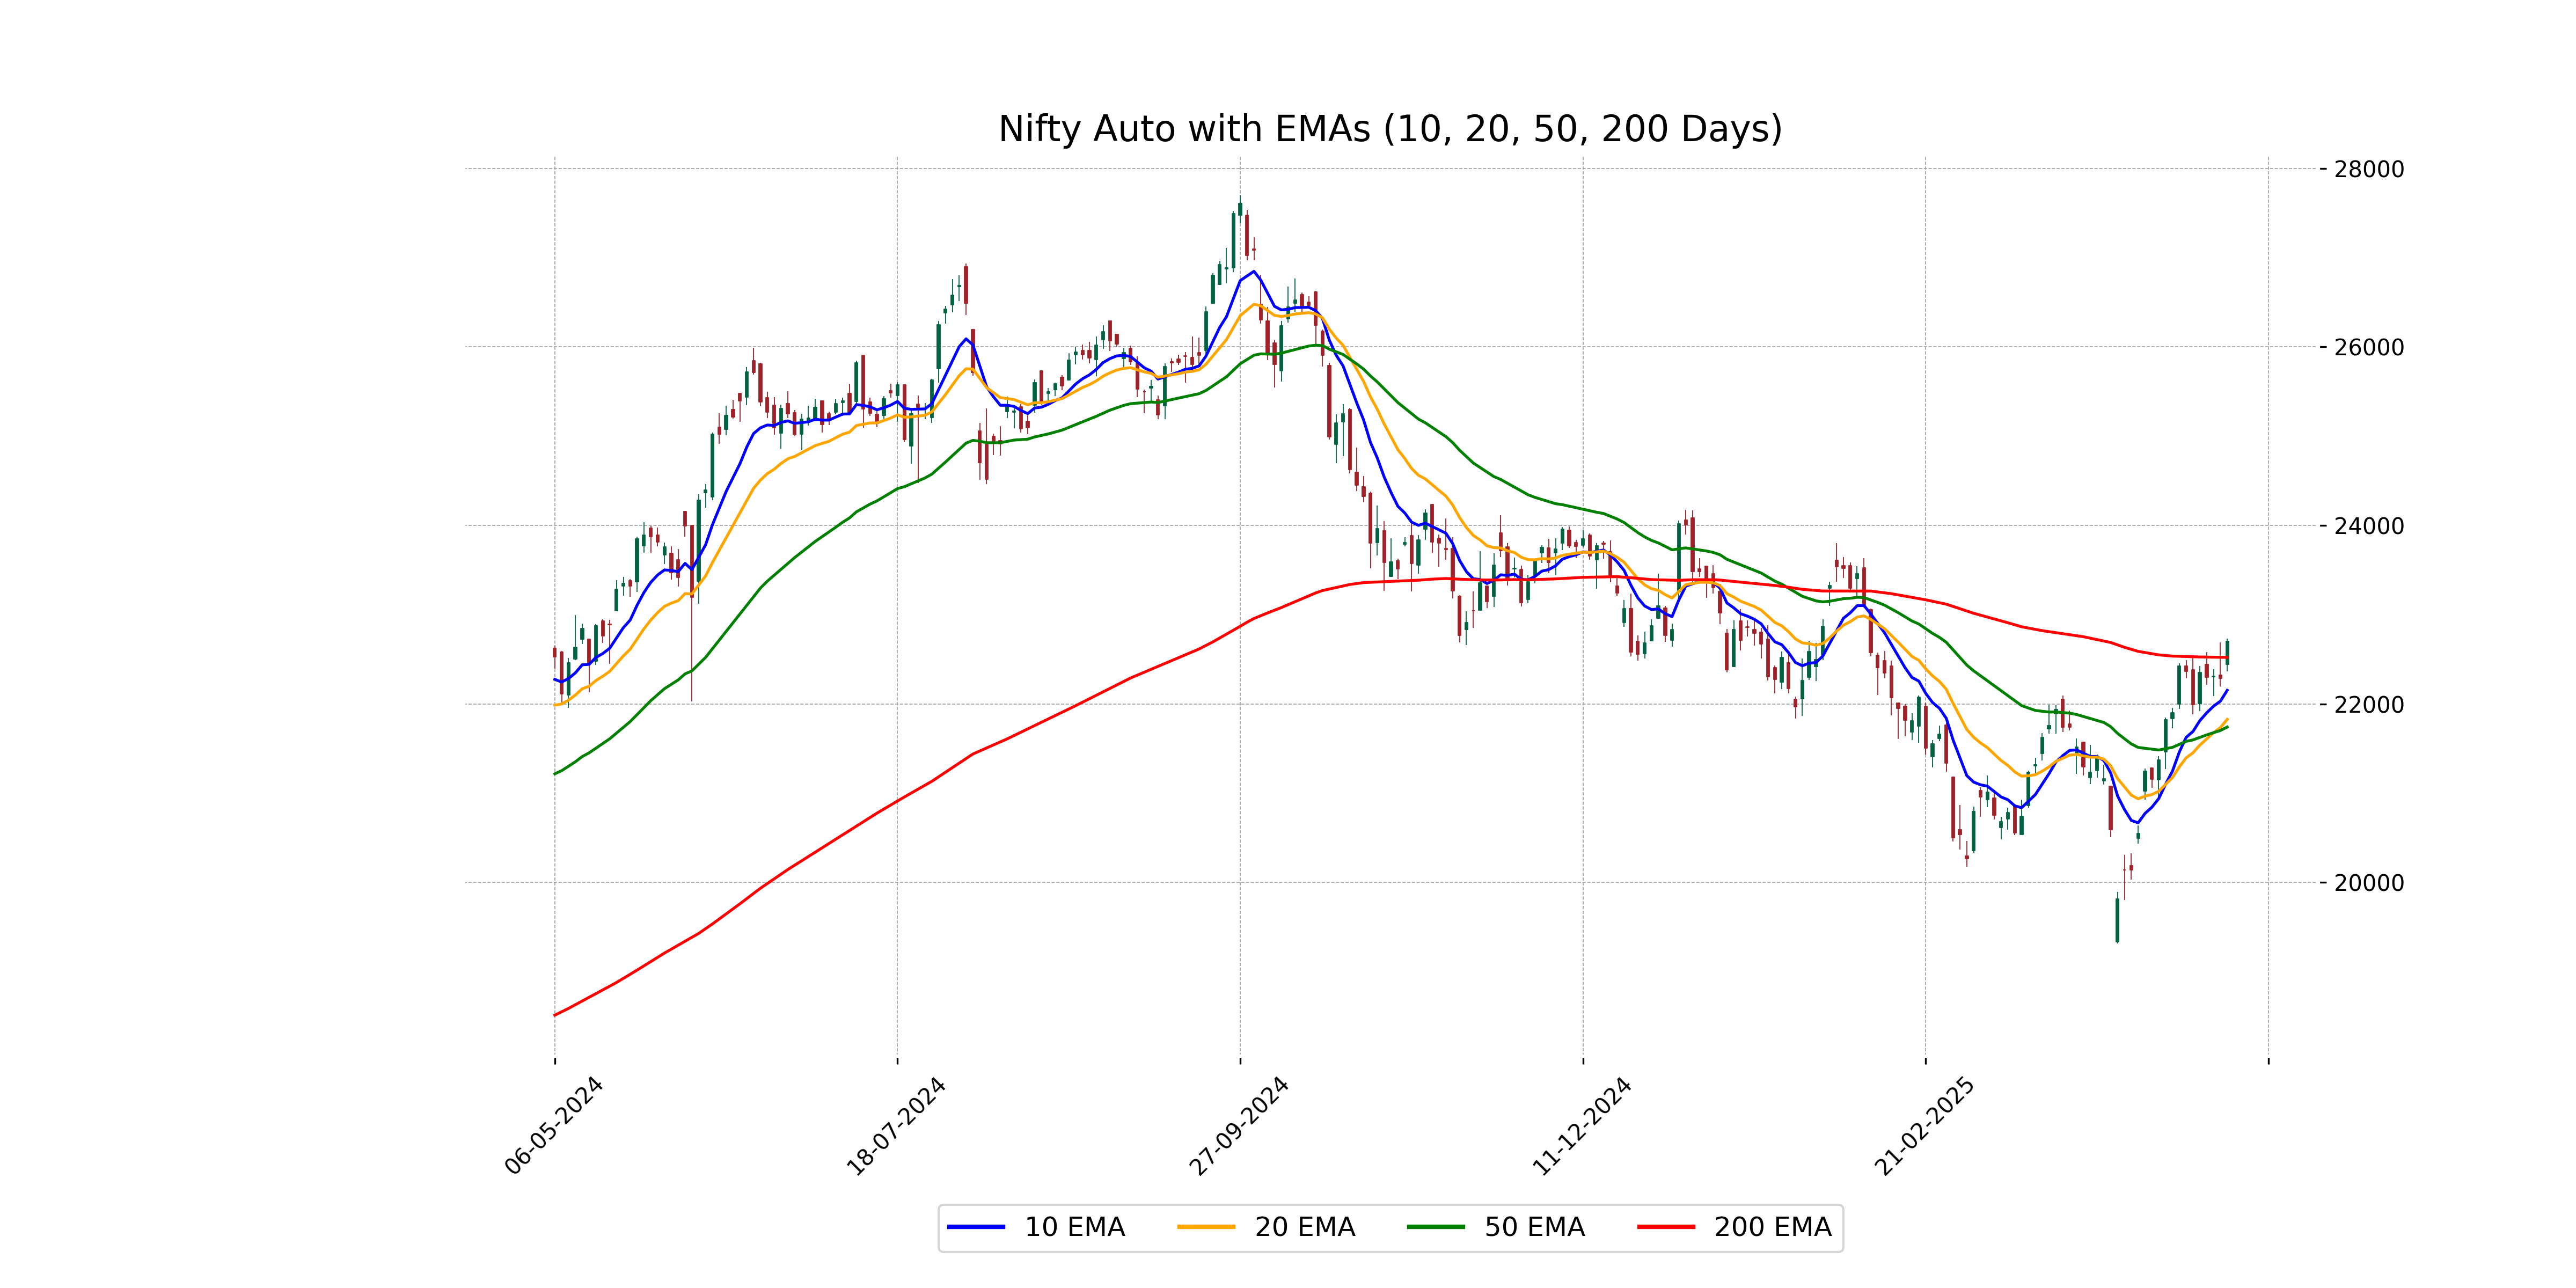
Relationship with Key Moving Averages
The Nifty Auto index closed at 22699.20, which is above its 10-day EMA of 22153.15, indicating a short-term bullish trend. The index is also trading above its 50-day EMA of 21742.10, confirming a strong upward momentum, but slightly below its 200-day EMA of 22521.66, suggesting some long-term resistance.
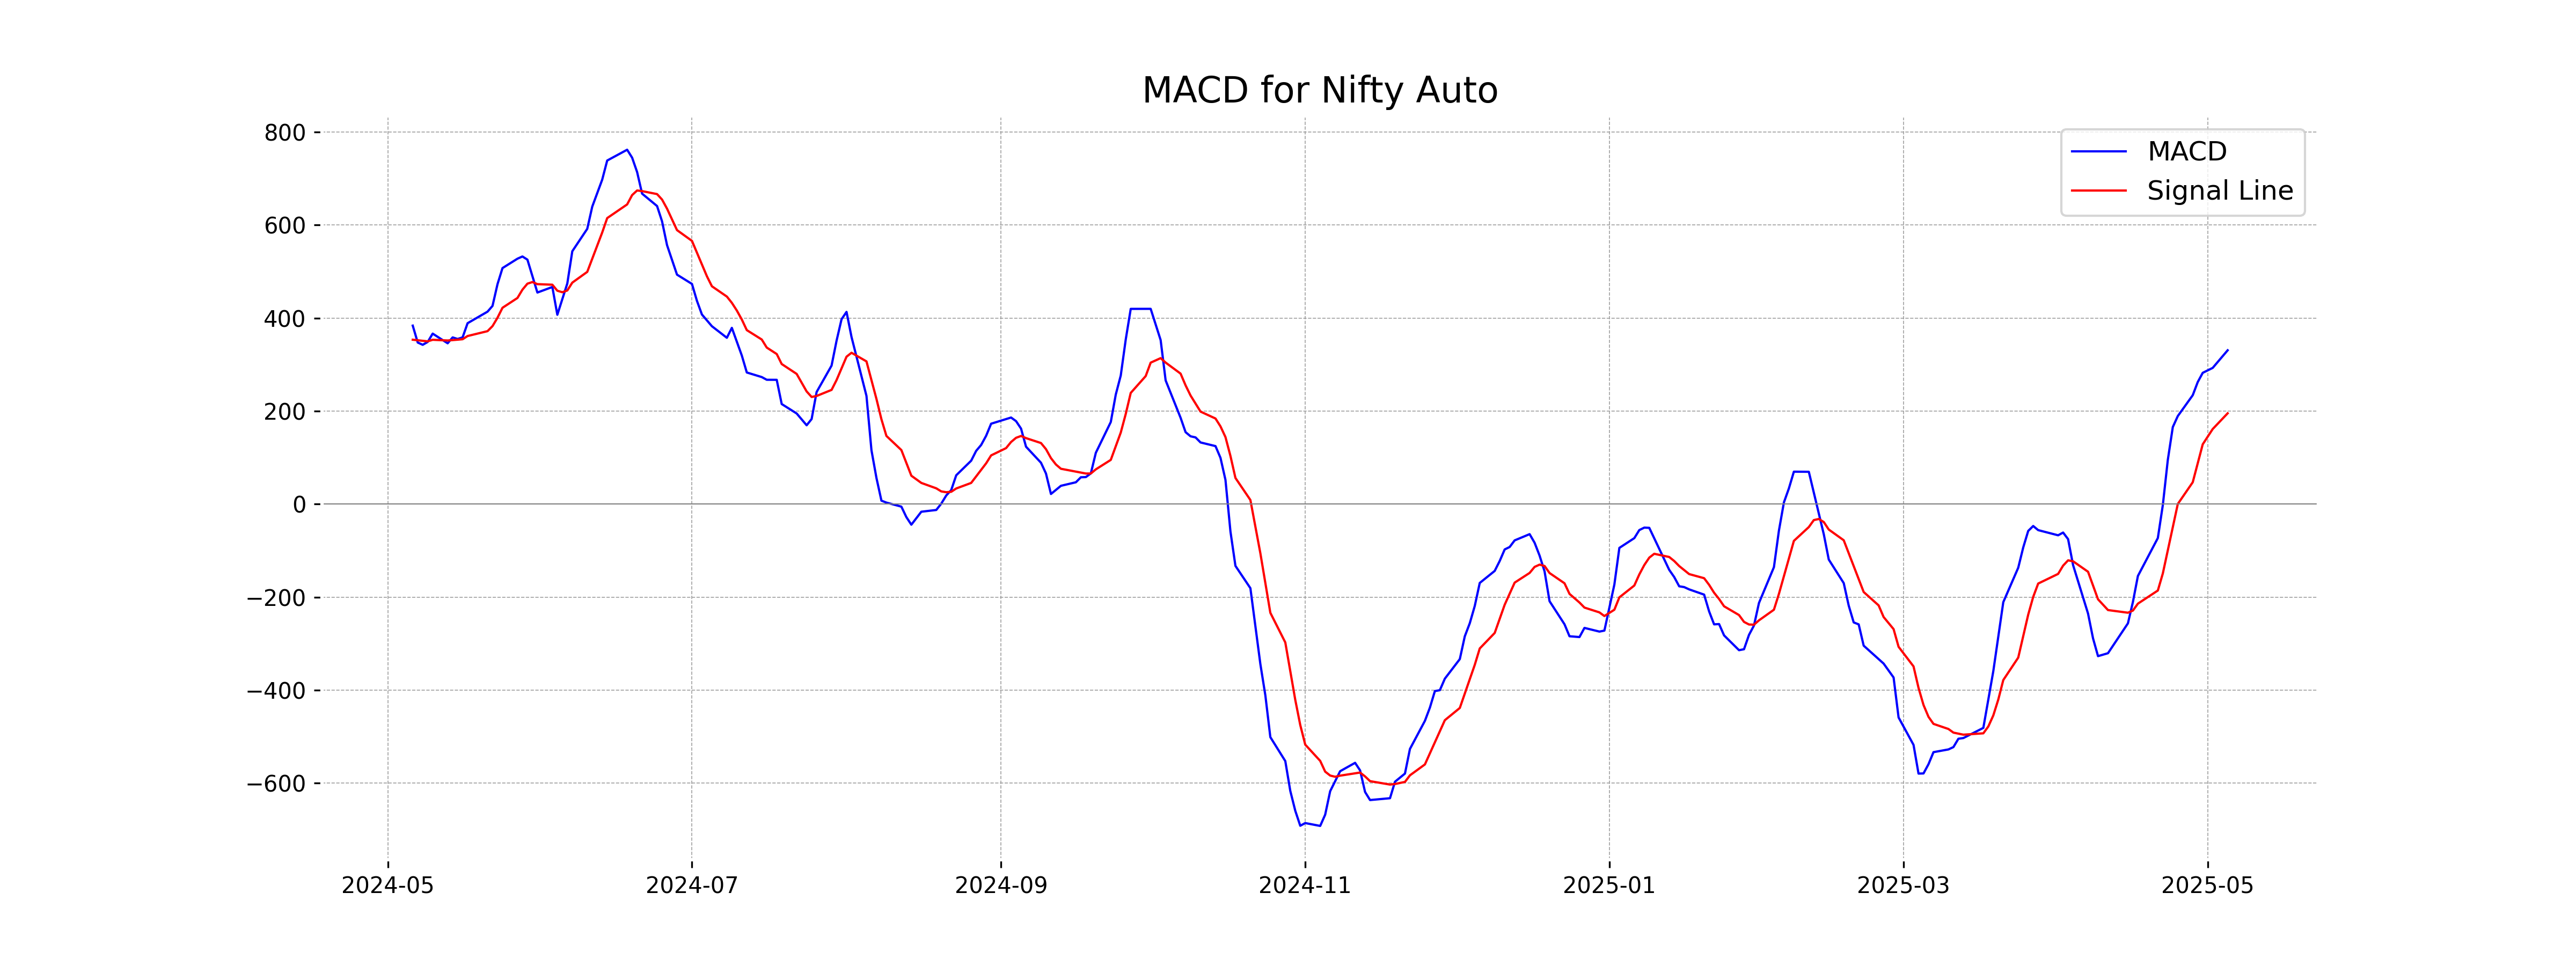
Moving Averages Trend (MACD)
The Nifty Auto index is exhibiting a strong bullish momentum, as indicated by the MACD value of 330.78, which is significantly above its signal line of 195.26. This suggests a positive trend continuation, alongside the 1.85% price increase seen in the day's close.
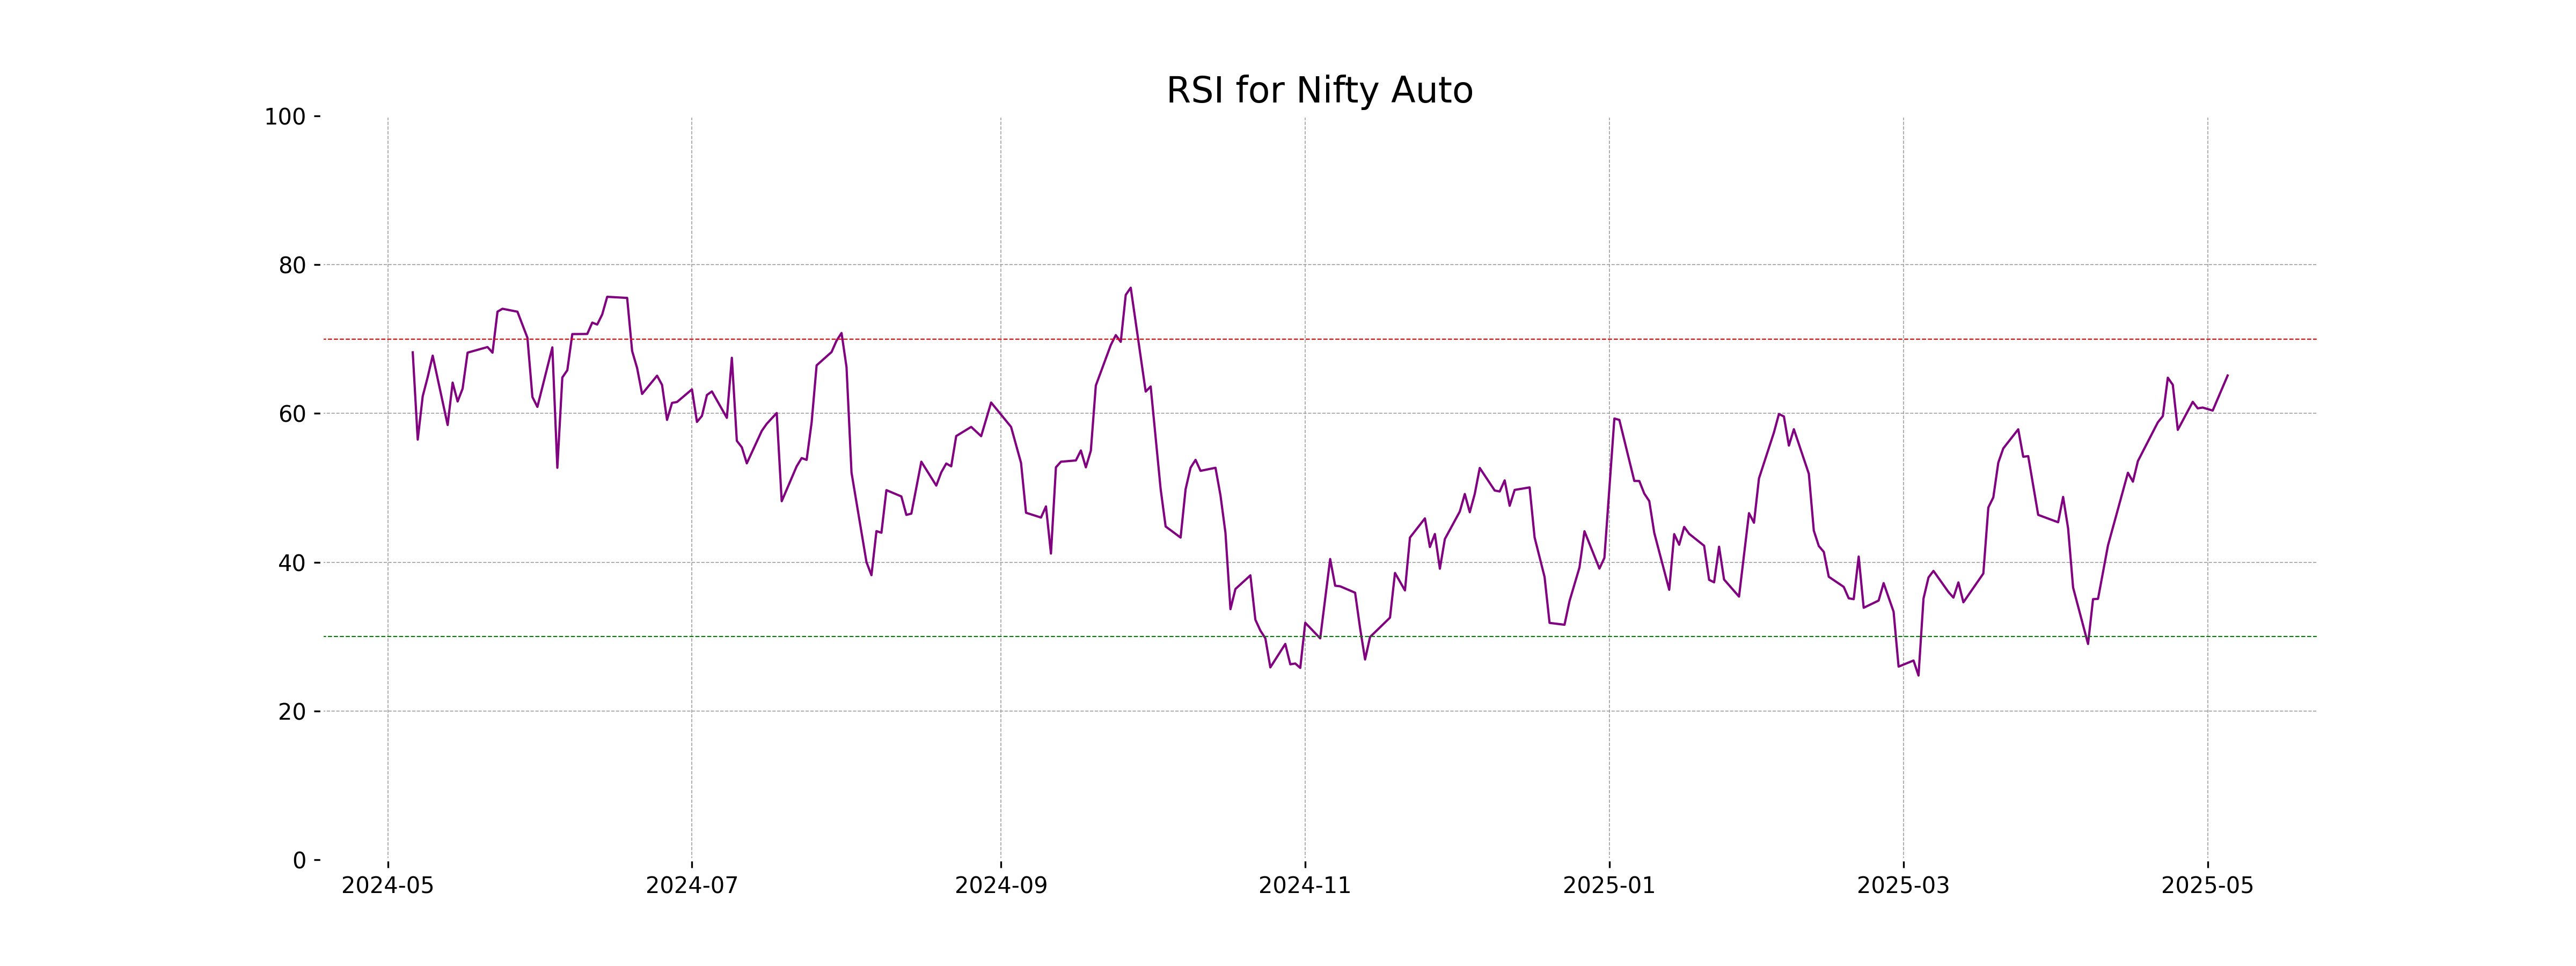
RSI Analysis
Nifty Auto's RSI is at 65.10, indicating that the index is nearing the overbought territory, which is generally considered to be above 70. This suggests that the index has gained strong upward momentum recently, and traders should watch for any signs of a potential reversal or continuation.
Analysis for Nifty Energy - May 05, 2025
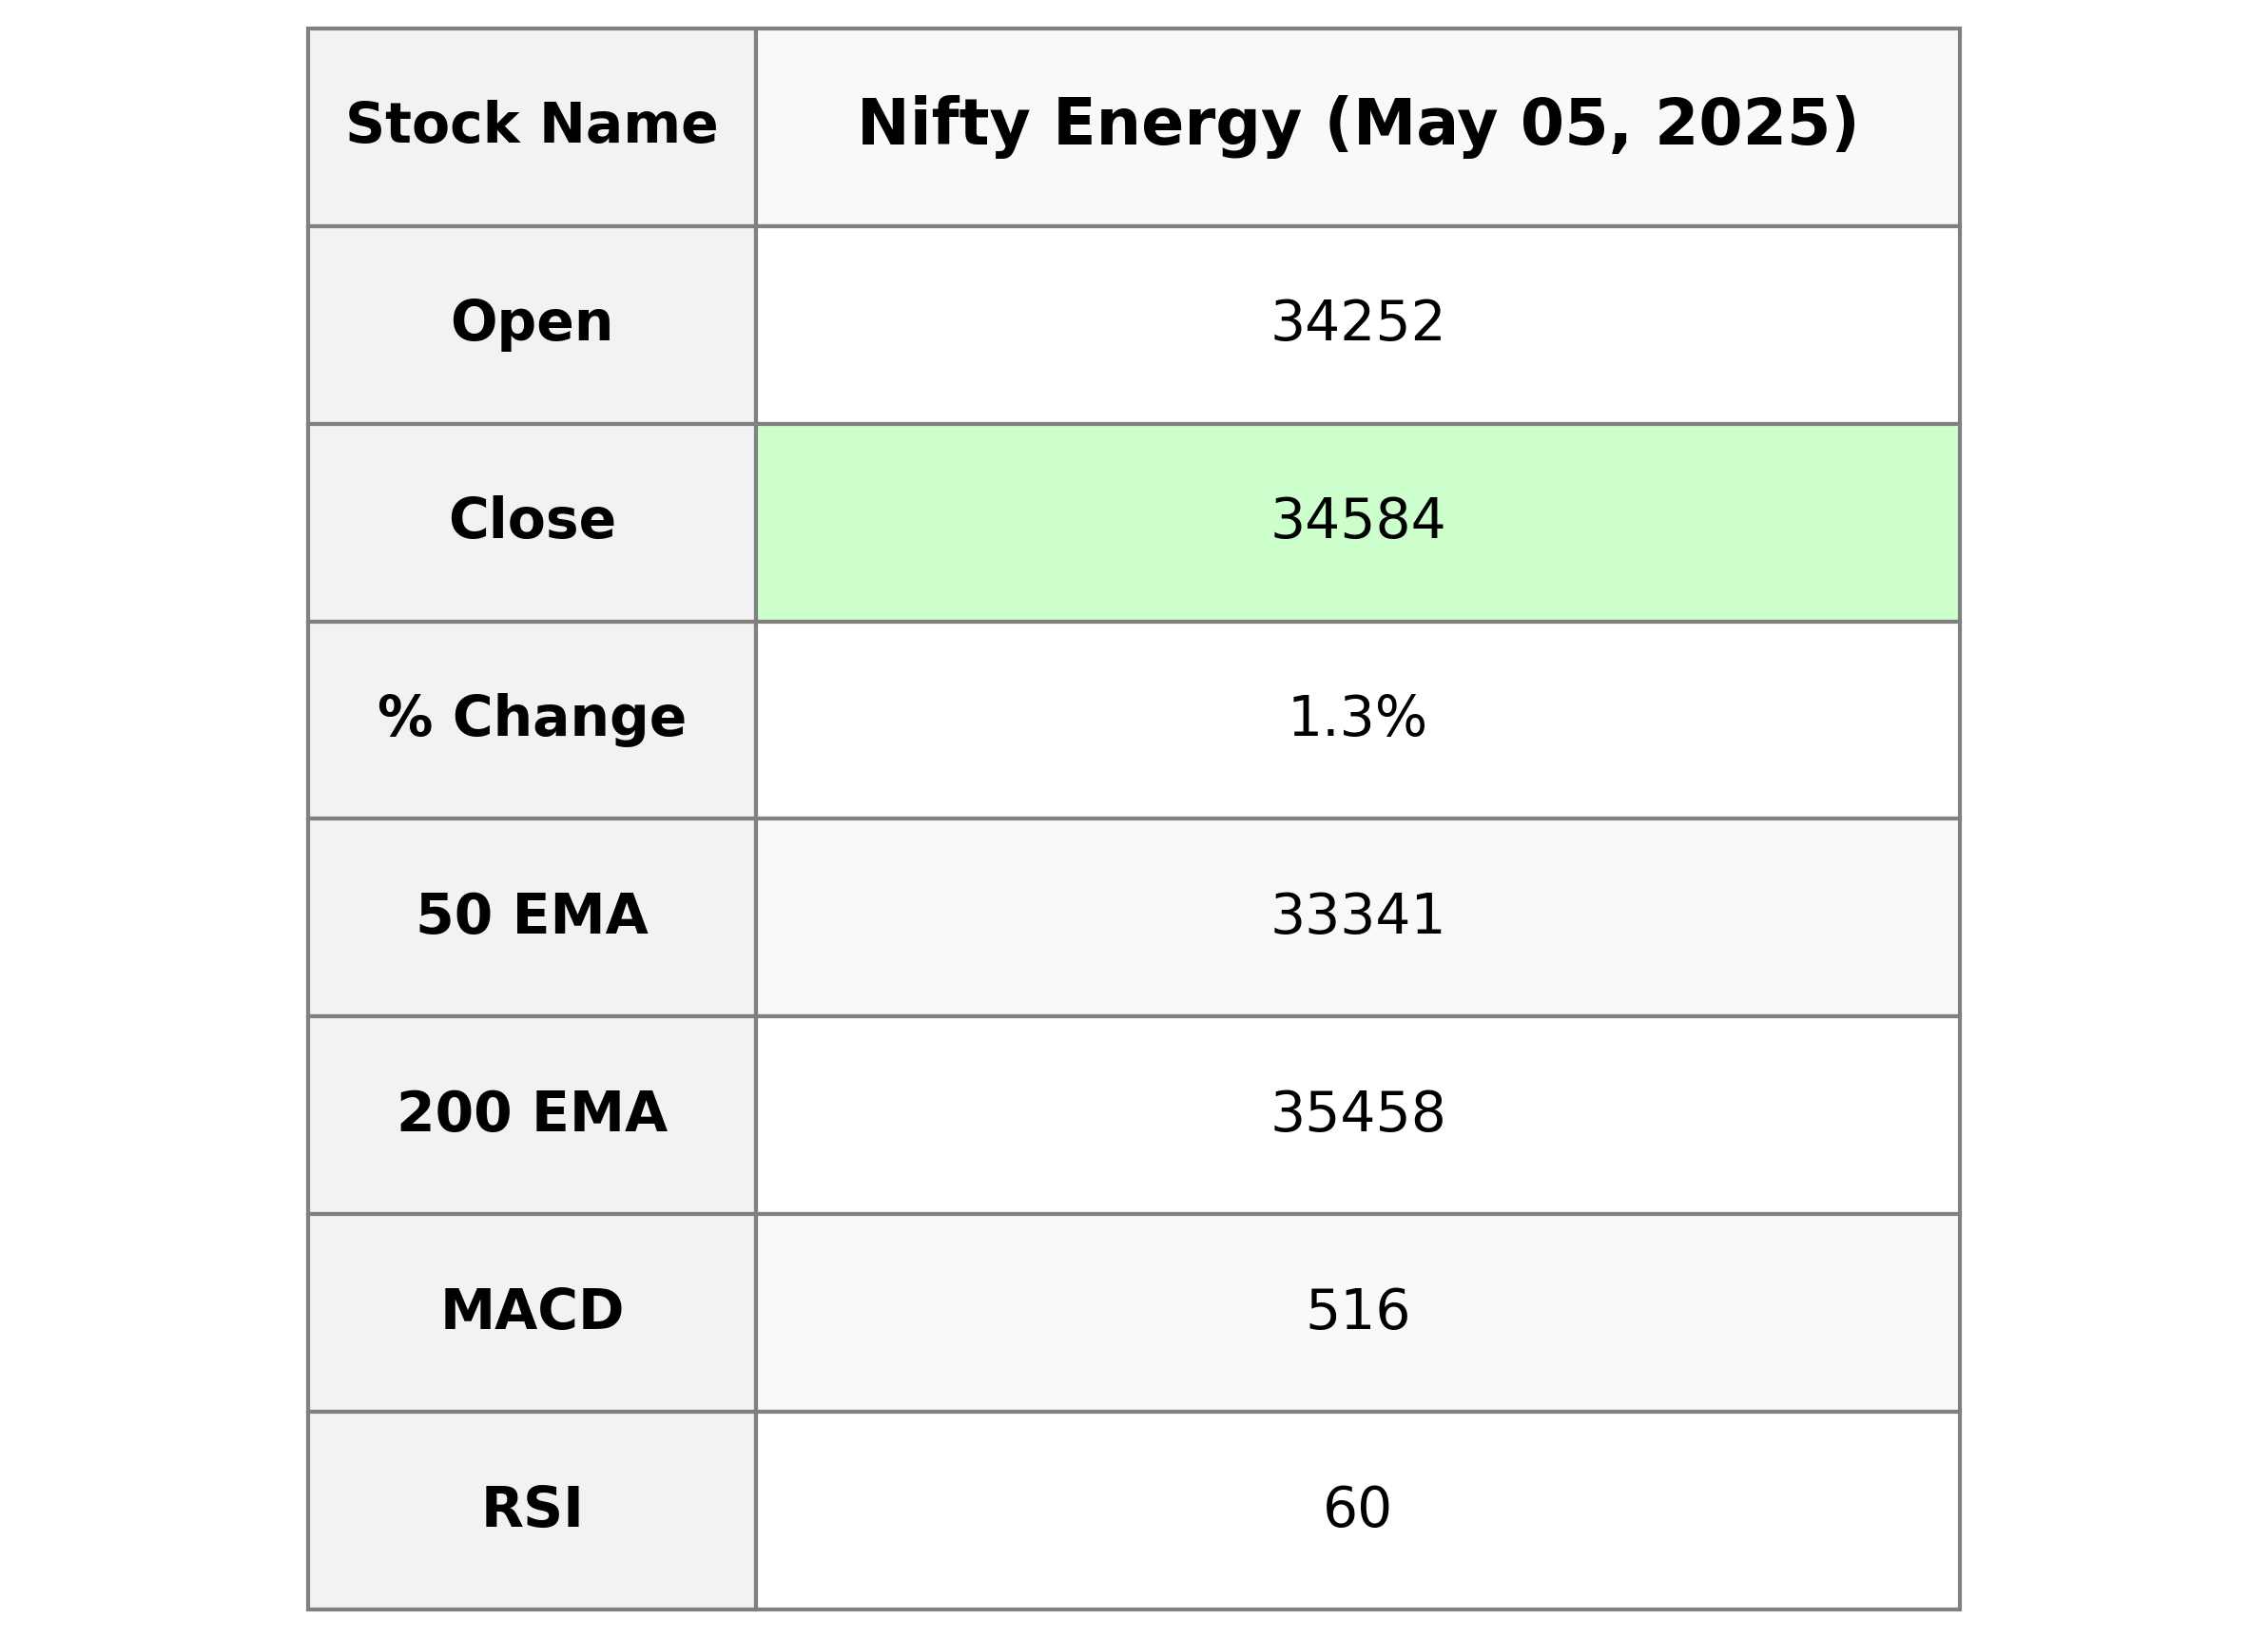
Nifty Energy opened at 34,252.5 and closed at 34,583.6, reflecting a positive change of 1.3% or 444.85 points from the previous close of 34,138.75. The index reached a high of 34,639.4 and a low of 34,106.6 during the session. The 10-day and 20-day EMAs indicate a short-term upward trend, supported by a positive MACD. The RSI of 59.96 suggests a relatively balanced market momentum.

Relationship with Key Moving Averages
The Nifty Energy index closed at 34583.60, which is above the 50-day EMA of 33340.95, the 10-day EMA of 34205.28, and the 20-day EMA of 33798.96. However, it remains below the 200-day EMA of 35457.83, indicating a short-term bullish trend but still under long-term bearish pressure.
Moving Averages Trend (MACD)
Nifty Energy is currently experiencing bullish momentum as indicated by its MACD value of 516.32, which is above the MACD Signal line at 485.94. This suggests potential upward momentum in the stock price.

RSI Analysis
RSI Analysis for Nifty Energy: The RSI of 59.96 suggests that the stock is in a neutral to mildly bullish phase. It indicates that there is room for upward movement before entering overbought territory, generally marked above 70.

Analysis for Nifty FMCG - May 05, 2025

The Nifty FMCG index opened at 56,417.95 and closed at 56,936.20, marking a percentage change of 1.22% from the previous close of 56,252.25. The index showed a strong performance with a points increase of 683.95. Although the RSI is 65.09, indicating a relatively strong momentum, the MACD and MACD Signal indicate a possible convergence.

Relationship with Key Moving Averages
Nifty FMCG closed significantly above its 50 EMA, indicating a strong upward momentum. The closing value is also above the 10 EMA and 20 EMA, suggesting a continued bullish trend. However, it is below the MACD Signal, which might indicate potential caution in the near term.
Moving Averages Trend (MACD)
The MACD for Nifty FMCG is positive at 857.05, indicating a bullish trend. However, since the MACD is below the MACD signal line of 892.06, caution is advised as the momentum could potentially weaken.

RSI Analysis
Nifty FMCG's RSI value is 65.09, indicating the stock is approaching overbought territory, but not yet at critical levels. With the RSI below 70, there's still some room for upward momentum before entering an overbought condition. Traders should monitor closely for any change in trend or signal for potential correction.

Analysis for Nifty Infra - May 05, 2025

Nifty Infra exhibited a positive performance with a closing value of 8896.20, marking a percentage change of 1.16% from the previous close. The index showed strong upward momentum, surpassing both the 50 EMA and 200 EMA, suggesting a bullish trend. The RSI indicates the index is nearing overbought conditions, which may attract cautious investor attention.

Relationship with Key Moving Averages
Nifty Infra closed at 8896.20, above its 50 EMA of 8411.04 and 200 EMA of 8430.19, indicating a bullish trend relative to these averages. Additionally, its position above the 10 EMA of 8722.78 and 20 EMA of 8590.89 suggests short-term bullish momentum.
Moving Averages Trend (MACD)
Based on the given data, Nifty Infra's MACD value is 161.76, which is higher than its MACD Signal value of 139.00. This suggests a bullish trend, indicating positive momentum as the MACD line is above the signal line. The trend could continue if supported by other indicators such as RSI.

RSI Analysis
RSI Analysis: The RSI for Nifty Infra is 67.68, suggesting that the index is nearing overbought territory. Typically, an RSI above 70 is considered overbought, indicating that a price reversal or correction might be imminent. However, with the current value close to this mark, traders should exercise caution and monitor for potential shifts in trend.

Analysis for Nifty IT - May 05, 2025

Nifty IT opened at 36,042.60, reached a high of 36,352.40, and closed at 35,991.25, experiencing a slight increase of 0.28% from the previous close. The index is currently below its 50-day and 200-day exponential moving averages, indicating a potential bearish trend. The RSI of 54.49 suggests a neutral position, with the MACD slightly negative, though improving from its signal line.

Relationship with Key Moving Averages
The Nifty IT index closed below the 50 EMA and 200 EMA, indicating a bearish stance relative to these longer-term trend indicators. However, it is above the 10 EMA and 20 EMA, suggesting some short-term upward momentum. The MACD is negative, but signals a bullish crossover with MACD being higher than the MACD_Signal line.
Moving Averages Trend (MACD)
The MACD value for Nifty IT is -179.99, which is below the MACD Signal value of -588.13. This indicates a bullish crossover, suggesting potential upward momentum, although the MACD values are still negative. This could imply a possible trend reversal if the momentum continues to strengthen.

RSI Analysis
The RSI for Nifty IT is 54.49, which suggests that the index is in a neutral zone. This position indicates no immediate overbought or oversold conditions, granting the potential for both upward and downward movement.

Analysis for Nifty Metal - May 05, 2025

Nifty Metal Performance: The Nifty Metal index opened at 8523.10 and closed at 8600.15, marking a 0.96% increase with an 81.75 points gain. Despite the volatility with a high of 8640.70 and a low of 8505.90, the index maintained an RSI of 49.57, indicating a balanced momentum, while the MACD suggests a potential negative trend with -23.68 below the signal line.

Relationship with Key Moving Averages
Nifty Metal closed at 8600.15, which is below the 50 EMA of 8633.98 and the 200 EMA of 8766.94, indicating potential short-term and long-term bearish sentiment. However, it is slightly above the 10 EMA of 8587.65, suggesting a marginally stronger recent performance.
Moving Averages Trend (MACD)
The MACD for Nifty Metal is -23.68, which is above the MACD Signal line of -35.65. This suggests a potential bullish crossover, indicating a possible shift towards positive momentum. However, given that both values are negative, the overall trend might still be bearish, albeit with signs of improvement.

RSI Analysis
The RSI for Nifty Metal is 49.57, which is close to the neutral 50 level. This suggests that the stock is neither overbought nor oversold, indicating a potential equilibrium in current market sentiment.

Analysis for Nifty Bank - May 05, 2025

Nifty Bank opened at 55,065.80 and closed at 54,919.50, experiencing a decrease of approximately 0.36% or 195.85 points from the previous close. The relative strength index (RSI) is at 65.08, indicating a relatively strong momentum, while the Moving Average Convergence Divergence (MACD) is above its signal line, suggesting potential bullish trends.
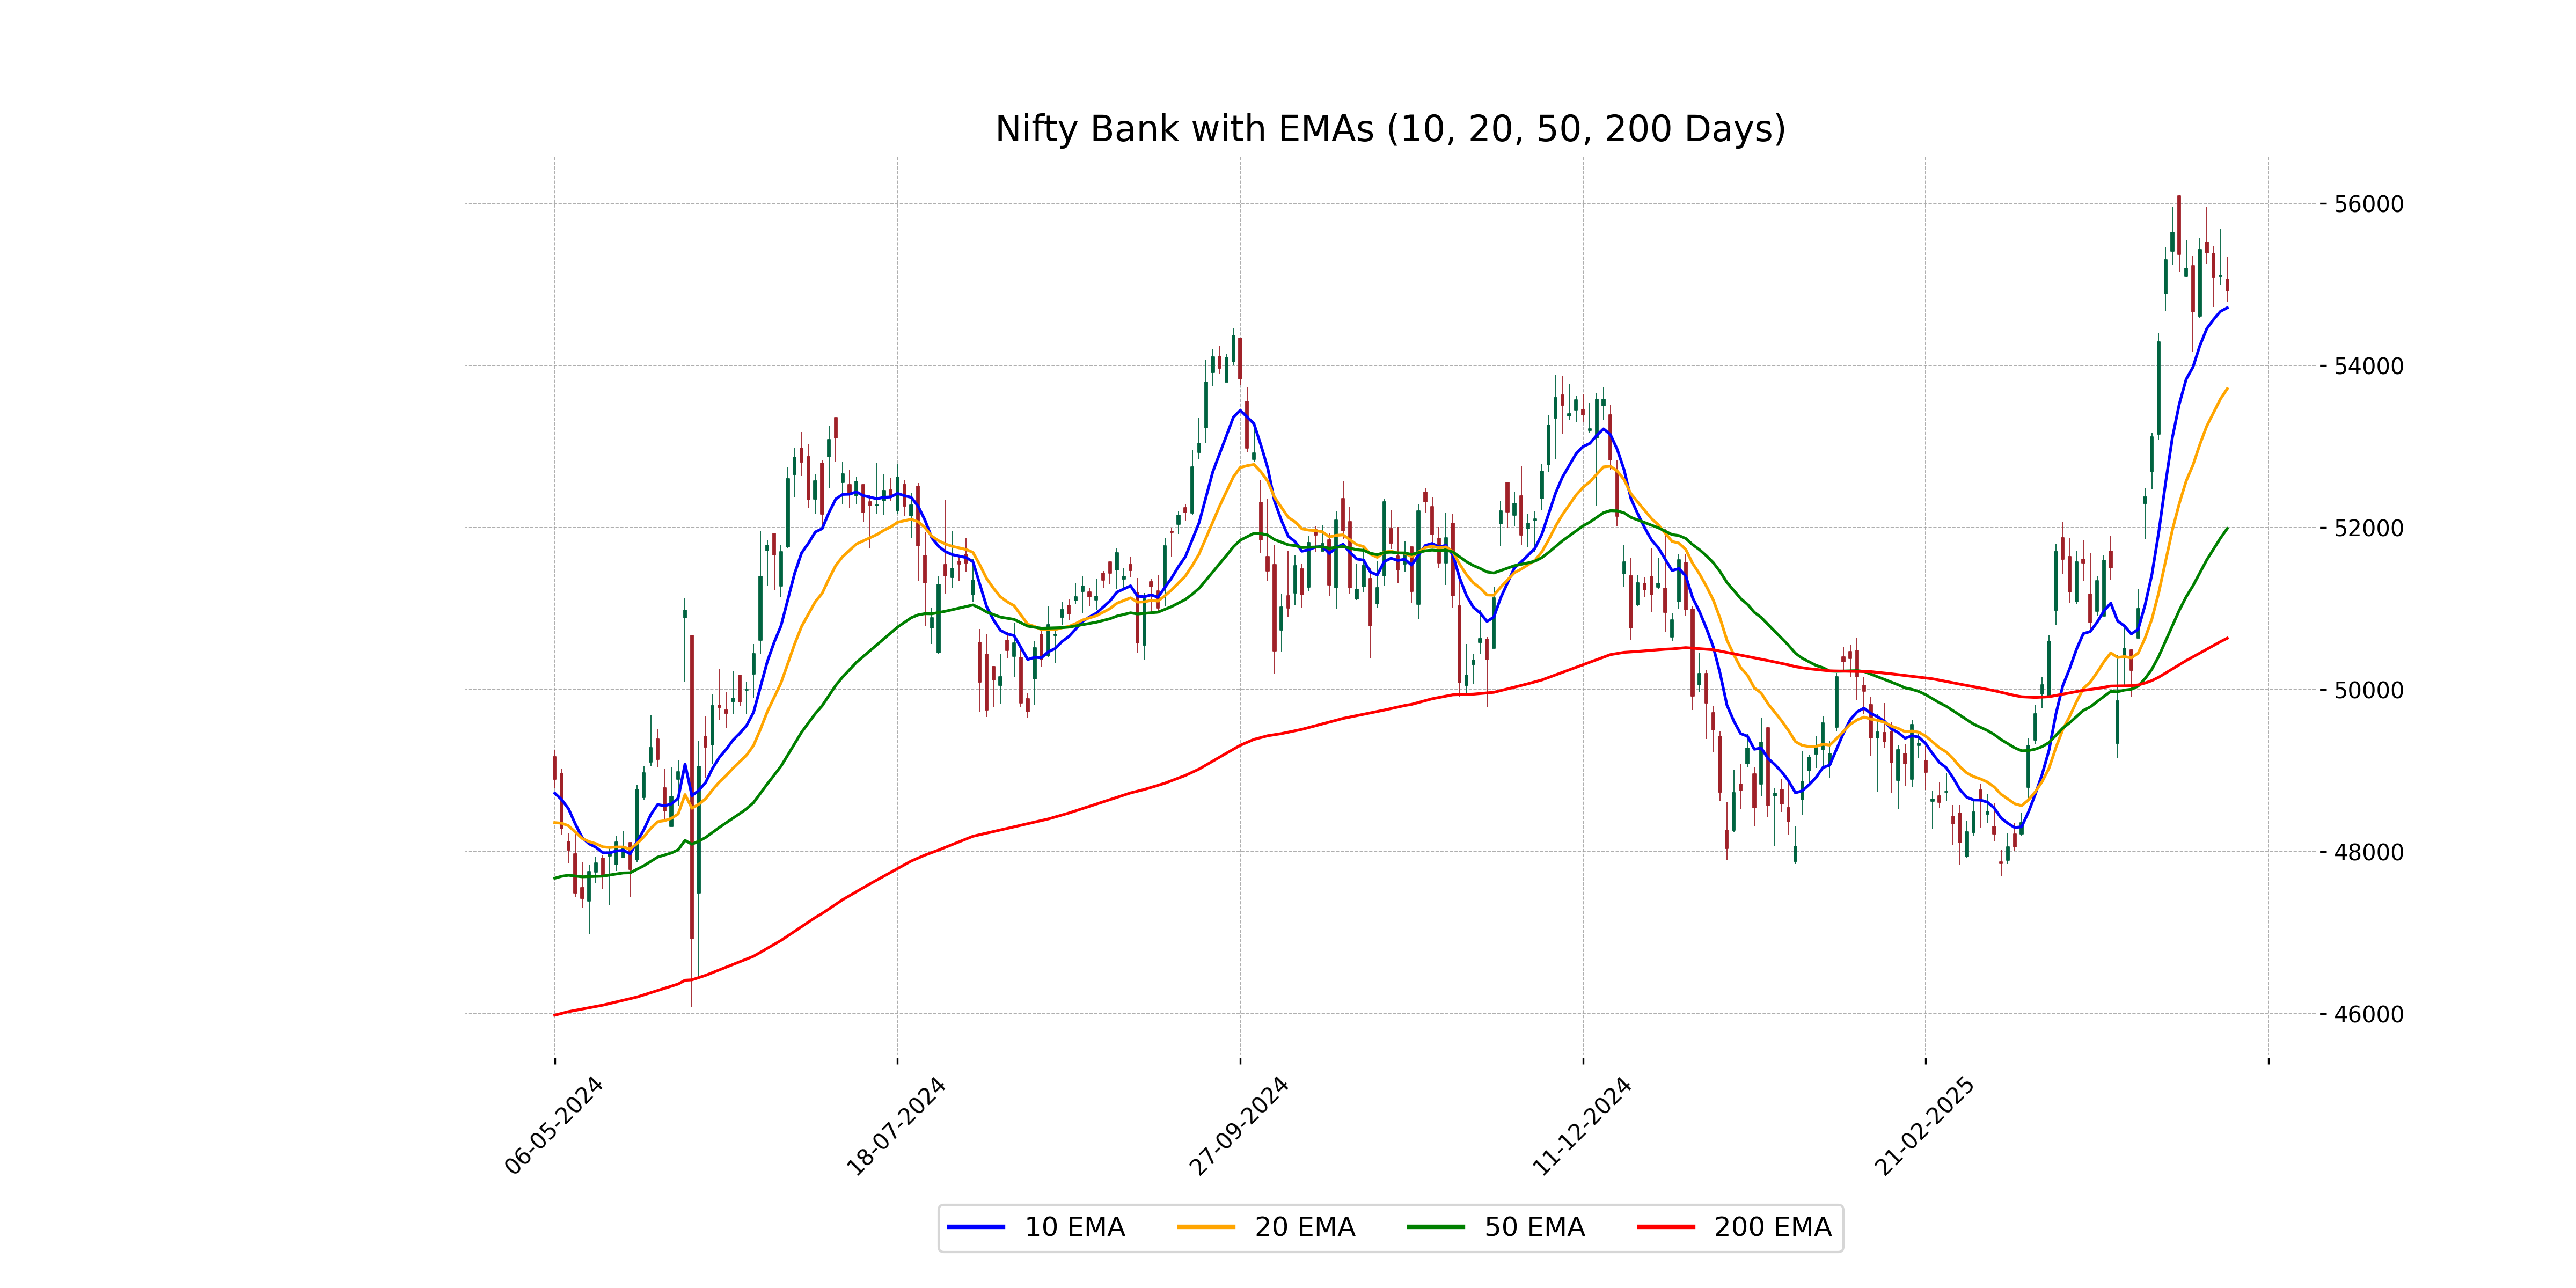
Relationship with Key Moving Averages
The closing price of Nifty Bank at 54,919.5 is above both the 50-period EMA (51,989.14) and the 200-period EMA (50,634.89), indicating a potential uptrend. However, it is very close to the 10-period EMA (at 54,713.99), suggesting potential short-term sideways movement.
Moving Averages Trend (MACD)
Based on the MACD analysis for Nifty Bank, the MACD value of 1309.33 is slightly higher than the MACD Signal of 1286.24, indicating a potential bullish momentum. However, the modest difference suggests that the momentum is not strong and should be monitored closely for any changes in trend.

RSI Analysis
RSI (Relative Strength Index) for Nifty Bank is currently at 65.08, which suggests a relatively strong position as it is nearing the overbought threshold of 70. A reading over 70 might indicate that the asset is overbought or overvalued, potentially signaling a pullback. However, at 65.08, it remains below that critical level, suggesting bullish momentum is in play.

Analysis for Nifty 50 - May 05, 2025

Nifty 50 Performance: On the given trading day, Nifty 50 opened at 24,419.5 and closed at 24,461.15, marking a 0.47% increase from the previous close of 24,346.70. The index reached a high of 24,526.40 and a low of 24,400.65, with a price change of 114.45 points. Technical indicators show the 50-day and 200-day EMAs at 23,481.00 and 23,458.26, with a bullish MACD of 375.40, overriding the signal line. RSI is relatively high at 66.80, indicating potential overbought conditions.

Relationship with Key Moving Averages
The Nifty 50 closed at 24,461.15, which is above its 10-EMA (24,165.21), 20-EMA (23,847.63), 50-EMA (23,481.00), and 200-EMA (23,458.26). This suggests a strong uptrend, as the current price surpasses all the key moving averages.
Moving Averages Trend (MACD)
The MACD for Nifty 50 is at 375.40 with a signal line of 308.66, indicating a bullish trend as the MACD line is above the signal line. Additionally, the positive difference suggests strengthening upward momentum. The RSI at 66.80 also supports a bullish sentiment but is approaching overbought levels.

RSI Analysis
The current RSI for Nifty 50 is 66.80, suggesting that the index is approaching overbought territory, as RSI values above 70 typically indicate overbought conditions. Given this value, traders may start to look for signs of a potential reversal or a slowdown in the upward trend.

Up Next

Indian stock market sector-wise performance today - May 5, 2025

Centre plans to borrow Rs 8.20 lakh cr from market in first half of FY27

Reliance denies buying Iranian oil amid US sanctions waiver

Premium petrol price up Rs 2, industrial diesel up Rs 22; no change in normal petrol, diesel rates

India's GDP expected to register over 8 pc growth in Sep-Dec: Report

Govt announces seven measures to help boost exports

More videos

RBI keeps interest rates on hold after US trade deal boosts outlook

RBI proposes to compensate customers up to Rs 25,000 loss due to fraud

RBI raises GDP growth projection of Q1, Q2 of FY27

RBI pauses rate cuts, retains interest rate at 5.25 pc

Rupee jumps 122 paise to close at 90.27 against US dollar on India-US trade deal

Stock markets cheer India-US trade deal: Sensex, Nifty surge 2.5 pc

UPI transactions hit record high of Rs 230 lakh crore in 2025-26 till Dec: Govt

Explained: India-US trade deal, tariffs and trade benefits

Trade deal with US adds momentum to India's growth ambition: Industry leaders

Rupee jumps 119 paise to 90.30 against the US dollar on India-US trade deal