


Highlights
- Nifty FMCG bucks the trend with a slight 0.22% gain
- Nifty Auto sees significant decline, dropping by 1.22%
- Nifty Metal remains resilient despite a dip of 0.86%
Latest news

These Are Australia's Best Workplaces in Finance and Insurance

Rockwell Automation Singapore Site Named a World Economic Forum Global Lighthouse

The Earthshot Prize and Alana Expand Partnership to India With Design for Change to Empower Young Indian Environmental Changemakers

enParadigm Helps Hospitality Enterprise Save ₹6.5 Crore Through Its AI-Led Hiring Platform

Markets opens on strong note as falling crude, global optimism lift sentiment, Sensex up 400 points, Nifty opens above 24,000

Jacob Elordi, Jon Bernthal, Jenna Ortega among 529 new Academy members eligible to vote for Oscars

India's office market remains cautious despite resilient demand and selective rental gains: Report

Step-by-step guide to apply for a mortgage loan online with minimal documentation
Indian stock market sector-wise performance today - March 10, 2025


The stock market on Monday (March 10, 2025) exhibited mixed performance across various sectors and indices.
The BSE Sensex, one of the premier stock indices in India, saw a slight decline of -0.29%, closing at 74115.17 points. This decline reflects general market sentiments influenced by several factors in global and domestic markets.
Among the sectors, Nifty Auto experienced the most significant drop, plunging by -1.22%. This decrease points towards possible challenges faced by the automotive sector, such as supply chain disruptions or fluctuations in consumer demand.
Following closely was Nifty Energy, which decreased by -1.53%, marking it as the most affected on this day. This steep fall in Nifty Energy may be attributed to volatile global oil prices or shifting government policies impacting energy companies.
Similarly, Nifty Infrastructure and Nifty IT showed negative movements, recording declines of -0.89% and -0.47%, respectively. These sectors could be reacting to broader economic pressures or adjustments in market valuations.
Notably, Nifty IT's decline represents concerns within the technology sector, potentially arising from a slowdown in international contracts or tech investment. Nifty Bank reported a -0.58% decline, reflecting cautious investor sentiment in the banking sector, possibly driven by regulatory changes or macroeconomic uncertainties.
The Nifty 50 itself dropped by -0.41%, which further underscores the overall market's bearish tone. Contrasting these declines, Nifty FMCG demonstrated resilience by rising slightly by 0.22%.
This suggests that consumer goods remained in demand, likely due to stable consumption patterns and investor confidence in fast-moving consumer goods.
In contrast, Nifty Metal showed a robust performance with an increase in market momentum, evidenced by an RSI of 61.49, backing a general positive sentiment towards metal stocks due to strong commodity demand or favorable policy changes.
In summary, the market's performance was a blend of declines with a few bright spots. The energy sector, noticeably affected, could be analyzed for deeper insight into global energy trends and policy impacts.
Investors and analysts might anticipate shifts in these sectors as they track policy developments and economic indicators going forward.

Analysis for Sensex - March 10, 2025

Sensex Performance The Sensex opened at 74,475 and closed at 74,115, experiencing a decline of approximately 217 points, marking a percentage change of -0.29% from the previous close. The RSI stands at 38.45, indicating a bearish trend, with the MACD also suggesting downward momentum. The lack of volume data and EMA values below the current trend further support the observed decline.

Relationship with Key Moving Averages
The close value of Sensex is 74,115.17, which is below its 50-day EMA of 76,283.23 and 200-day EMA of 77,322.20, but slightly below its 10-day EMA of 74,241.66. This indicates a short-term bearish trend relative to these moving averages.
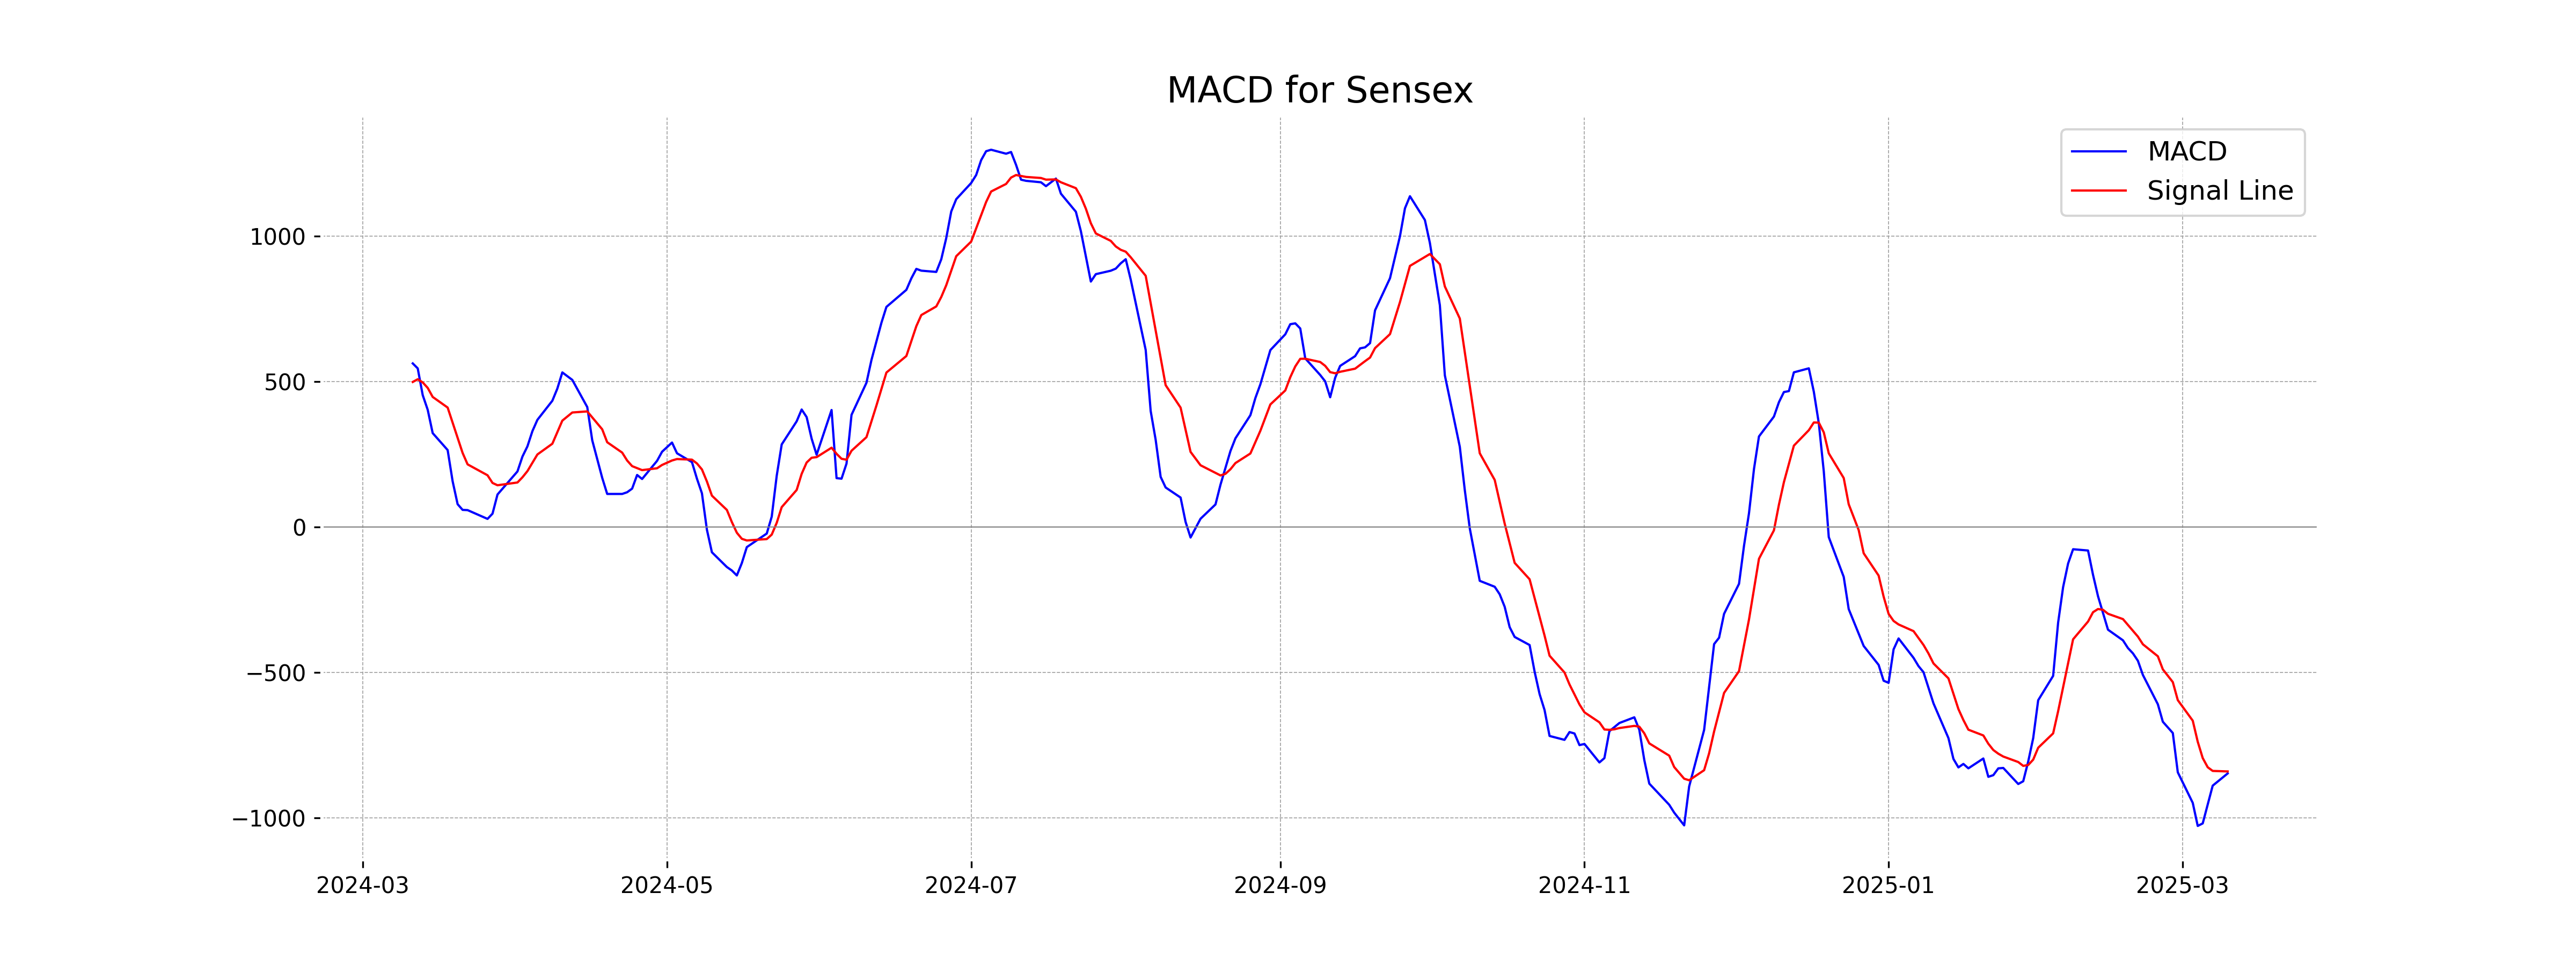
Moving Averages Trend (MACD)
Sensex MACD Analysis: The MACD value for Sensex is currently -846.81, which is below the signal line of -839.85. This indicates a potential bearish trend, suggesting that momentum may be shifting towards continued downward movement.
RSI Analysis
The RSI of Sensex is 38.45, which indicates that the market is approaching an oversold condition. Typically, an RSI below 30 is considered oversold, suggesting potential buying opportunities as the market may be set for a reversal or consolidation. Keep in mind that RSI is just one of many indicators and should be used in conjunction with other analysis methods.

Analysis for Nifty Auto - March 10, 2025

Nifty Auto opened at 20,946.40, reaching a high of 21,023.95 and a low of 20,706.30, before closing at 20,752.80. The index witnessed a decrease with a percent change of -1.22% and a points drop of 256.90 from the previous close of 21,009.70. The RSI stands at 36, indicating a weak momentum, with the MACD showing a bearish divergence.

Relationship with Key Moving Averages
Nifty Auto closed at 20752.80, which is below its 50 EMA (22205.69) and 200 EMA (22947.44), indicating a bearish trend. It is also below the 10 EMA (21019.89) and 20 EMA (21438.75), suggesting short-term weakness.
Moving Averages Trend (MACD)
MACD Analysis for Nifty Auto: The MACD value for Nifty Auto is -527.65, which is below the signal line of -483.71. This suggests a bearish momentum, indicating a potential downtrend continuation.

RSI Analysis
The RSI value for Nifty Auto is 35.99, which indicates that the index is approaching the oversold territory. Typically, an RSI below 30 is considered oversold, suggesting that the index is nearing a potential reversal point, but it's important to consider other indicators as well for a comprehensive analysis.

Analysis for Nifty Energy - March 10, 2025

The Nifty Energy index opened at 31,788.45 and closed at 31,302.20, experiencing a decline of 1.53%, corresponding to a points change of -486.25. The RSI stands at 46.40, indicating a weaker momentum, while the MACD of -477.37 suggests bearish sentiment. The index is trading below its 50-day EMA of 32,804.57 and its 200-day EMA of 36,321.04, reinforcing a downward trend.

Relationship with Key Moving Averages
The Nifty Energy index closed at 31,302.20, which is below its 50-day EMA of 32,804.57 and significantly below its 200-day EMA of 36,321.04, indicating a bearish trend. However, the close is slightly above its 10-day EMA of 31,154.29 and aligns closely with the 20-day EMA of 31,397.01, suggesting short-term support.
Moving Averages Trend (MACD)
The Nifty Energy index shows a MACD of -477.37, indicating a bearish momentum as the MACD line is below the signal line. This suggests that the index is currently in a downtrend, as confirmed by the negative points change and a low RSI of 46.4.

RSI Analysis
The Relative Strength Index (RSI) for Nifty Energy is 46.40, which places it below the neutral 50 level. This suggests that the index is currently neither overbought nor oversold, indicating a potential consolidation phase or marginal bearish sentiment.

Analysis for Nifty FMCG - March 10, 2025

Nifty FMCG showed a slight positive change with a 0.22% increase, closing at 52006.40 compared to the previous close of 51891.80. The 10-day EMA at 51810.41 suggests a recent upward trend, though it remains below the 50-day EMA of 54215.06 and the 200-day EMA of 56740.22, indicating longer-term weaknesses. The RSI stands at 40.06, which is on the lower side, suggesting weaker momentum, while the negative MACD value reflects potential bearish trends.

Relationship with Key Moving Averages
Nifty FMCG closed at 52,006.40, which is below its 50 EMA of 54,215.06 and 200 EMA of 56,740.22, indicating a bearish trend in the longer term. However, it is slightly above its 10 EMA of 51,810.41, suggesting short-term bullishness.
Moving Averages Trend (MACD)
The MACD for Nifty FMCG is -979.55, and the MACD Signal is -1079.23. The MACD line being higher than the signal line suggests a potential bullish signal, although both values are in the negative territory, indicating possible continued weakness in the short term.

RSI Analysis
The RSI for Nifty FMCG is 40.06, which indicates that it is currently in the lower range of the scale. This suggests that the index is approaching oversold territory, though it has not yet reached the typical oversold threshold of 30. Investors might monitor for potential buying opportunities if the RSI drops further.

Analysis for Nifty Infra - March 10, 2025

The Nifty Infra index opened at 8002.40 and closed at 7929.55, marking a percentage change of -0.89%, indicating a decline. The RSI of 46.23 suggests the index is nearing the oversold territory, while the MACD value of -87.04 is above the MACD Signal line, hinting at a potential bullish signal. The index currently trades below its 50-day and 200-day EMAs, suggesting a bearish trend in the medium to long term.

Relationship with Key Moving Averages
The Nifty Infra closed below its 50 EMA and 200 EMA, indicating a bearish trend. However, it closed above the 10 EMA and 20 EMA, suggesting some short-term support.
Moving Averages Trend (MACD)
The MACD value for Nifty Infra is -87.04, which is above the MACD Signal of -111.15, suggesting a potential bullish crossover. However, both values are negative, indicating that the trend might still be bearish. It is essential to consider other factors and market conditions for a more comprehensive analysis.

RSI Analysis
RSI Analysis for Nifty Infra: The RSI (Relative Strength Index) for Nifty Infra is at 46.23, indicating a neutral momentum in the market. It is below the 50 mark, suggesting that the index is neither overbought nor oversold, but there might be a slight bearish tendency.

Analysis for Nifty IT - March 10, 2025

Nifty IT opened at 37,791.60 and closed slightly lower at 37,644.40, reflecting a decline with a points change of -176.05 from the previous close. The Relative Strength Index (RSI) stands at 29.25, indicating potential oversold conditions. The negative MACD value further suggests bearish momentum.

Relationship with Key Moving Averages
The Nifty IT index closed at 37,644.40, below its 50-day EMA of 41,047.80 and the 200-day EMA of 40,501.13, indicating a bearish trend. The current close is also beneath the 10-day EMA of 38,386.55 and the 20-day EMA of 39,424.95, suggesting short-term weakness.
Moving Averages Trend (MACD)
The MACD for Nifty IT is -1290.33, which is below the MACD Signal line at -1148.43. This indicates a bearish momentum as the MACD is trending downward. The negative MACD values suggest that the market trend is weak, confirming selling pressure on the index.

RSI Analysis
The RSI of Nifty IT is at 29.25, which indicates that it is in the oversold territory. This suggests that the index may be experiencing a temporary dip, and there could be a potential for a price reversal or an upward correction soon.

Analysis for Nifty Metal - March 10, 2025
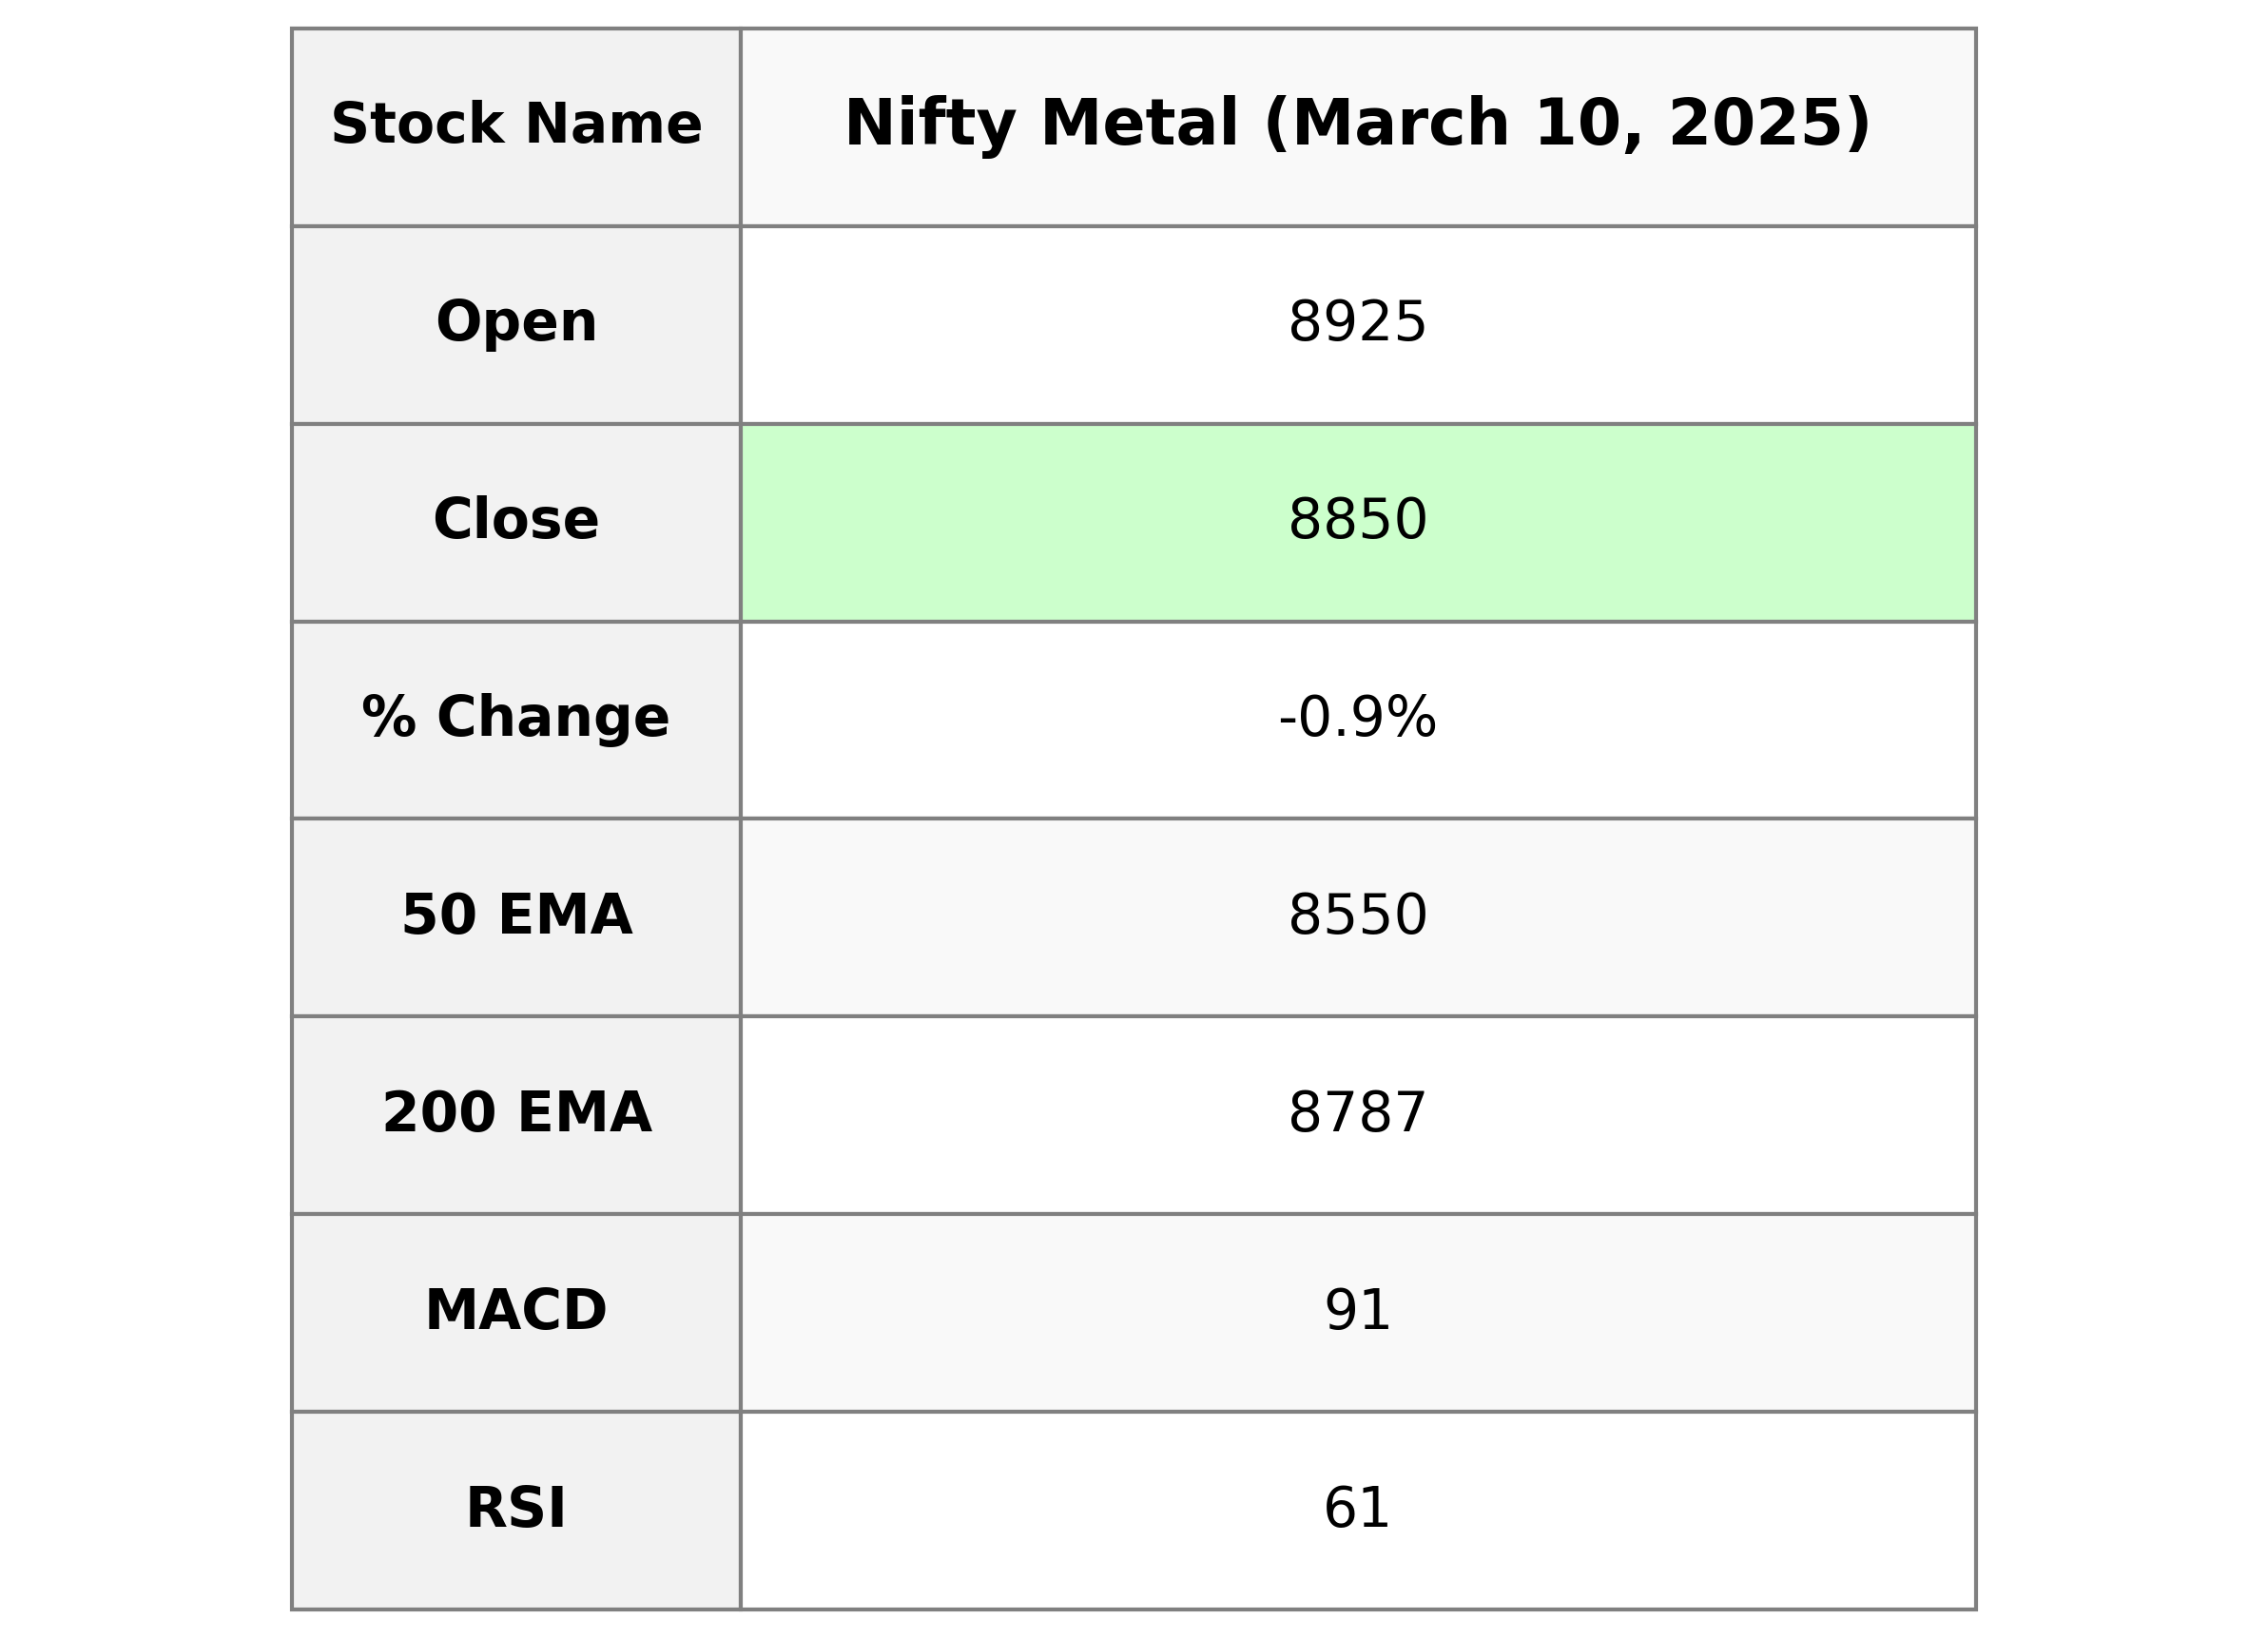
Nifty Metal Performance: The Nifty Metal index opened at 8924.65, reached a high of 9042.80, and closed at 8850.30, marking a decrease of 76.60 points or -0.86% from the previous close of 8926.90. Despite the decline, the index's 50-day EMA of 8550.06 suggests a still bullish sentiment, with an RSI of 61.49 and a positive MACD compared to its signal, indicating potential upward momentum.

Relationship with Key Moving Averages
The Nifty Metal closed at 8850.30, which is above its 10 EMA of 8621.18 and 20 EMA of 8516.02, indicating a short-term upward momentum. However, it is slightly above the 200 EMA of 8786.91 and near its 50 EMA of 8550.06, suggesting consolidation around medium to long-term averages.
Moving Averages Trend (MACD)
Based on the MACD analysis for Nifty Metal, the MACD value of 90.51 is significantly above the MACD Signal of 17.89, which suggests a strong bullish momentum. This indicates a potential upward movement in the stock price, as the MACD line is currently above the signal line.

RSI Analysis
Based on the provided data, Nifty Metal's RSI (Relative Strength Index) is 61.49. An RSI above 70 generally indicates that a stock is overbought, while an RSI below 30 suggests it is oversold. With a value of 61.49, Nifty Metal is in the neutral zone, suggesting no immediate overbought or oversold conditions.

Analysis for Nifty Bank - March 10, 2025

Nifty Bank opened at 48,312 and saw a high of 48,599.15 and a low of 48,124.65, closing the day at 48,216.80. The index experienced a decline of 0.58% from the previous close, resulting in a points change of -280.70. Technical indicators show a relatively low RSI of 39.17 and a negative MACD, suggesting bearish momentum.

Relationship with Key Moving Averages
Nifty Bank closed at 48,216.80, which is below its 10 EMA (48,539.33), 20 EMA (48,798.23), 50 EMA (49,445.82), and 200 EMA (49,978.11). This indicates a short-term bearish sentiment as the current price is beneath these key moving averages.
Moving Averages Trend (MACD)
Based on the data, the MACD value for Nifty Bank at -337.58 is lower than the MACD Signal at -306.05, indicating a bearish signal. This suggests potential downward momentum in the short-term trend.

RSI Analysis
Nifty Bank's RSI is 39.17, indicating that it is approaching the oversold territory, which generally lies below 30. This suggests potentially weakening price momentum and the possibility of a price reversal or a consolidation period.

Analysis for Nifty 50 - March 10, 2025

Nifty 50 opened at 22,521.85 and closed slightly lower at 22,460.30, marking a 0.41% decline with a points change of -92.20. The RSI indicates a bearish sentiment, standing at 39.52, while the MACD also reflects bearish conditions with a negative value of -247.11, suggesting caution for investors.
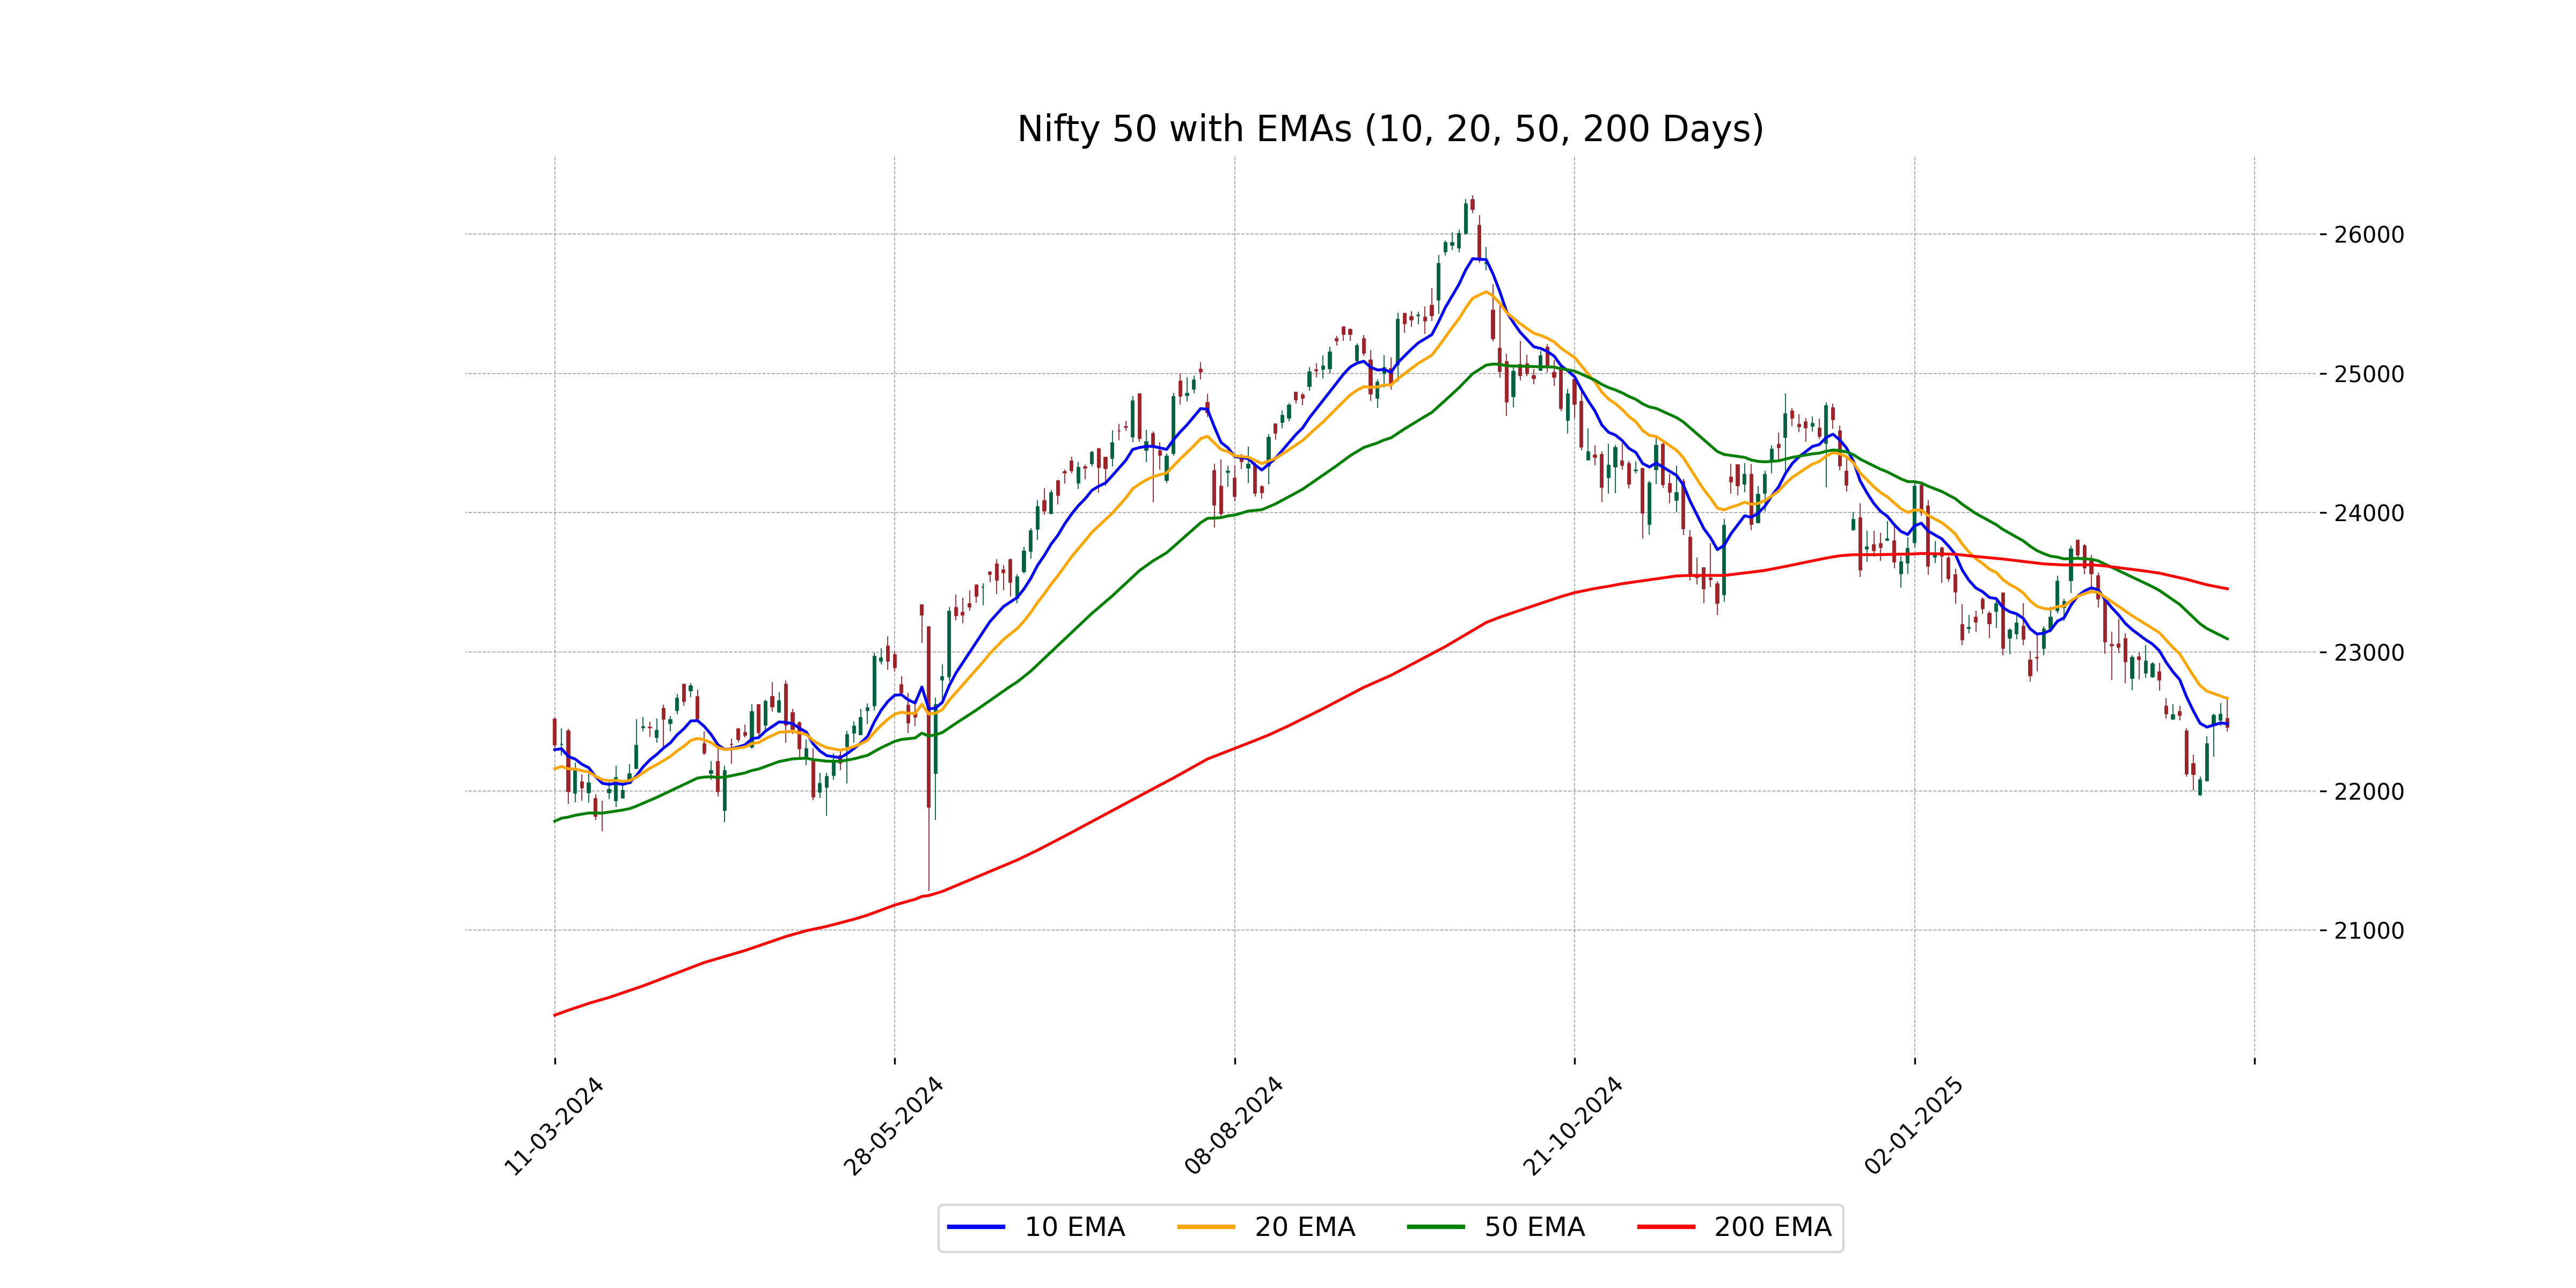
Relationship with Key Moving Averages
The Nifty 50 closed below its 10-day, 20-day, 50-day, and 200-day EMAs, indicating a bearish trend. The current close of 22460.30 is below the 10 EMA of 22483.59, 20 EMA of 22665.12, 50 EMA of 23093.47, and 200 EMA of 23452.73, suggesting downward momentum.
Moving Averages Trend (MACD)
Nifty 50 MACD Analysis: The MACD for Nifty 50 is -247.11, with the MACD Signal at -253.38. This suggests a bearish momentum as the MACD line is above the signal line, indicating potential downward pressure on the stock.

RSI Analysis
The Relative Strength Index (RSI) for Nifty 50 stands at 39.52, which suggests that the index is approaching the oversold territory. This could indicate potential buying opportunities, as values below 30 typically suggest an oversold condition. However, at 39.52, it is still above the standard oversold threshold.

Up Next
Indian stock market sector-wise performance today - March 10, 2025

Honda Activa 6G: Everything You Need to Know Before Buying

How much does a ULIP plan really cost? A break-down of all charges

Centre plans to borrow Rs 8.20 lakh cr from market in first half of FY27

Reliance denies buying Iranian oil amid US sanctions waiver

Premium petrol price up Rs 2, industrial diesel up Rs 22; no change in normal petrol, diesel rates

More videos

India's GDP expected to register over 8 pc growth in Sep-Dec: Report

Govt announces seven measures to help boost exports

RBI keeps interest rates on hold after US trade deal boosts outlook

RBI proposes to compensate customers up to Rs 25,000 loss due to fraud

RBI raises GDP growth projection of Q1, Q2 of FY27

RBI pauses rate cuts, retains interest rate at 5.25 pc

Rupee jumps 122 paise to close at 90.27 against US dollar on India-US trade deal

Stock markets cheer India-US trade deal: Sensex, Nifty surge 2.5 pc

UPI transactions hit record high of Rs 230 lakh crore in 2025-26 till Dec: Govt

Explained: India-US trade deal, tariffs and trade benefits