


Highlights
- BSE Sensex slightly declines with -0.01% change
- Nifty IT drops significantly with -0.85% change
- Nifty Metal gains momentum with a +0.43% change
Latest news

Oppo Reno 16 Series To Feature AI Snap Key, IP69K Protection, and Stunning New Design

Sensex moves in unison with rising FII flows and stronger Rupee: Bank of Baroda report

Journeys N Tales Elevates Bespoke Luxury Travel with Curated Global Experiences for Discerning Indian Travelers

"A great achievement for us": Carnatic vocalist duo Ranjani and Gayatri celebrate Padma Shri honour

Krunal Pandya Launches Phoenix Shopping League 2026 at Phoenix Citadel; EOSS Turns into a Season of Rewards, Entertainment and Celebration

New Data Shows Big Tech Lock-In Is Limiting Consumer Choice

Samsung's HBM4 sales cross USD 1 billion milestone within four months

Supreme Court on Company Law - Compendium of Cases Third Edition - Another Landmark Publication by Aseem Chawla, Senior Advocate
Indian stock market sector-wise performance today - March 07, 2025


The stock market on Friday (March 7, 2025) observed a mixed bag of performances across various sectors and indices today, with certain sectors showcasing noteworthy fluctuations.
Starting with Sensex, which forms the backbone of the market sentiment, there was a slight decrease of 0.01%. While this change might not be significant in terms of numbers, it reflects the cautious optimism that currently characterizes the market's outlook, especially amidst global economic uncertainties.
Meanwhile, the Nifty Auto index turned out to be one of the bright spots, posting a modest gain of 0.24%. This uptick can likely be attributed to improving consumer sentiments and a rebound in demand, especially as festive seasons approach in various parts of the country.
Energy, captured by the Nifty Energy index, also saw favorable movement with a gain of 0.18%. This change could point to the stabilizing of oil prices and the steadying of energy supplies, factors crucial for sustaining momentum in the energy sector.
The Nifty FMCG index showed minimal change, barely registering an increase of 0.003%. Despite its usually resilient nature, the sector's performance appears subdued, possibly due to evolving consumer spending patterns and rising input costs.
Nifty Infrastructure displayed a positive trajectory, gaining 0.27%. This rise could be linked to ongoing government initiatives and infrastructural investments which continue to promise growth potential.
An area of concern lies in the performance of Nifty IT, which suffered a decline of 0.85%. The technology sector, usually a star performer, seems to be facing headwinds.
This drop may be attributed to profit booking and some caution due to fluctuating international market trends and evolving tech regulations. Conversely, Nifty Metal stood out with a commendable increase of 0.43%.
This rise might be fueled by increased demand for raw materials and a positive outlook on infrastructure projects, both domestically and globally. The Nifty Bank index fell by 0.27%, indicating a volatile day for financial institutions.
This reduction might reflect the tight credit conditions and concerns around interest rates affecting the broader economic climate. Finally, the broader Nifty index managed to inch upward by 0.03%.
Although modest, this growth hints at the market’s tentative steps towards stability amidst diverse pressures.
Overall, the performances today highlight the varied scenarios faced by different sectors. While some indices are soaring on renewed demand and policy shifts, others are grappling with uncertainties and external macroeconomic factors, painting a complex yet intriguing portrait of the current market landscape.

Analysis for Sensex - March 07, 2025

Sensex Performance: The Sensex opened at 74,347.14 and closed slightly lower at 74,332.58, indicating a marginal decline in performance with a change of -0.01%. The RSI value of 40.07 suggests a bearish momentum, while the MACD indicates a negative trend, further supported by a lower MACD signal. The volume recorded was zero, which may reflect low trading activity for the day.

Relationship with Key Moving Averages
The current close of Sensex at 74332.58 is below its 50 EMA (76371.72), 200 EMA (77354.19), and also its 20 EMA (74957.62), indicating a bearish trend in the longer term and short term. However, the close price is above the 10 EMA (74269.76), which might suggest a slight upward momentum in the very short term.
Moving Averages Trend (MACD)
The MACD for Sensex is -888.78, below the Signal line at -838.11, indicating a bearish momentum. The negative MACD value suggests that the short-term trend is weaker than the long-term trend, reflecting potential continued downward movement in the index. The Relative Strength Index (RSI) at 40.07 also supports this bearish sentiment, suggesting the index is nearing oversold territory.

RSI Analysis
RSI Analysis for Sensex: The Relative Strength Index (RSI) for the Sensex is currently at 40.07. This indicates that the index is nearing the oversold region, as RSI values below 30 typically suggest oversold conditions. A reading of 40.07 suggests that while the index isn't significantly oversold yet, it's displaying weaker momentum.

Analysis for Nifty Auto - March 07, 2025

Nifty Auto Performance Nifty Auto opened at 20925.75 and closed at 21009.70, showing a slight increase with a 0.24% change. The RSI of 38.83 indicates weakness in the momentum, while the MACD value of -533.54 suggests bearish sentiment as it remains below the MACD Signal.

Relationship with Key Moving Averages
The closing price of Nifty Auto is 21009.70, which is below its 50-day EMA of 22264.99 and its 200-day EMA of 22969.38, indicating a short-term bearish trend. Additionally, it is also below the 10-day and 20-day EMAs, at 21079.25 and 21510.95, respectively, further suggesting short-term weakness.
Moving Averages Trend (MACD)
The MACD for Nifty Auto is -533.54, which is below the MACD Signal line of -472.72, suggesting a bearish trend. This indicates potential downward momentum in the Nifty Auto sector.

RSI Analysis
The RSI of Nifty Auto is 38.83, indicating that the index is approaching the oversold territory. A reading below 30 typically suggests an oversold condition, so it's important to monitor for potential reversals or continued downward trends.

Analysis for Nifty Energy - March 07, 2025

Nifty Energy opened at 31,723.35, reaching a high of 32,075.60 and a low of 31,599.00, closing at 31,788.45. It experienced a slight increase from the previous close with a percentage change of 0.18% and a points change of 58.60. The RSI is around 50.62, indicating a neutral momentum, and the MACD suggests bearish sentiment due to its negative value of -529.01.

Relationship with Key Moving Averages
The Nifty Energy closed at 31,788.45, which is below its 50 EMA of 32,865.89 and 200 EMA of 36,371.40, indicating a bearish trend compared to these longer-term moving averages. However, it is above the 10 EMA of 31,121.42 and 20 EMA of 31,406.99, suggesting short-term bullish momentum.
Moving Averages Trend (MACD)
The MACD for Nifty Energy is at -529.01, which is above the MACD Signal of -722.84. This indicates a potential bullish crossover, suggesting that the momentum may be shifting towards a positive direction. However, as both values are negative, it still points to a generally bearish trend overall.

RSI Analysis
RSI Analysis for Nifty Energy: The Relative Strength Index (RSI) for Nifty Energy is 50.62, indicating a neutral market condition. This value suggests that the index is neither overbought nor oversold, and traders may not expect significant directional bias based on RSI alone.

Analysis for Nifty FMCG - March 07, 2025

Nifty FMCG had a marginal change with a closing value of 51891.80, showing a slight increase from the previous close. The index's performance reflects low volatility as indicated by a negligible percent change of 0.0029%. Notably, the RSI value of 38.72 suggests there might be some overselling in the market.
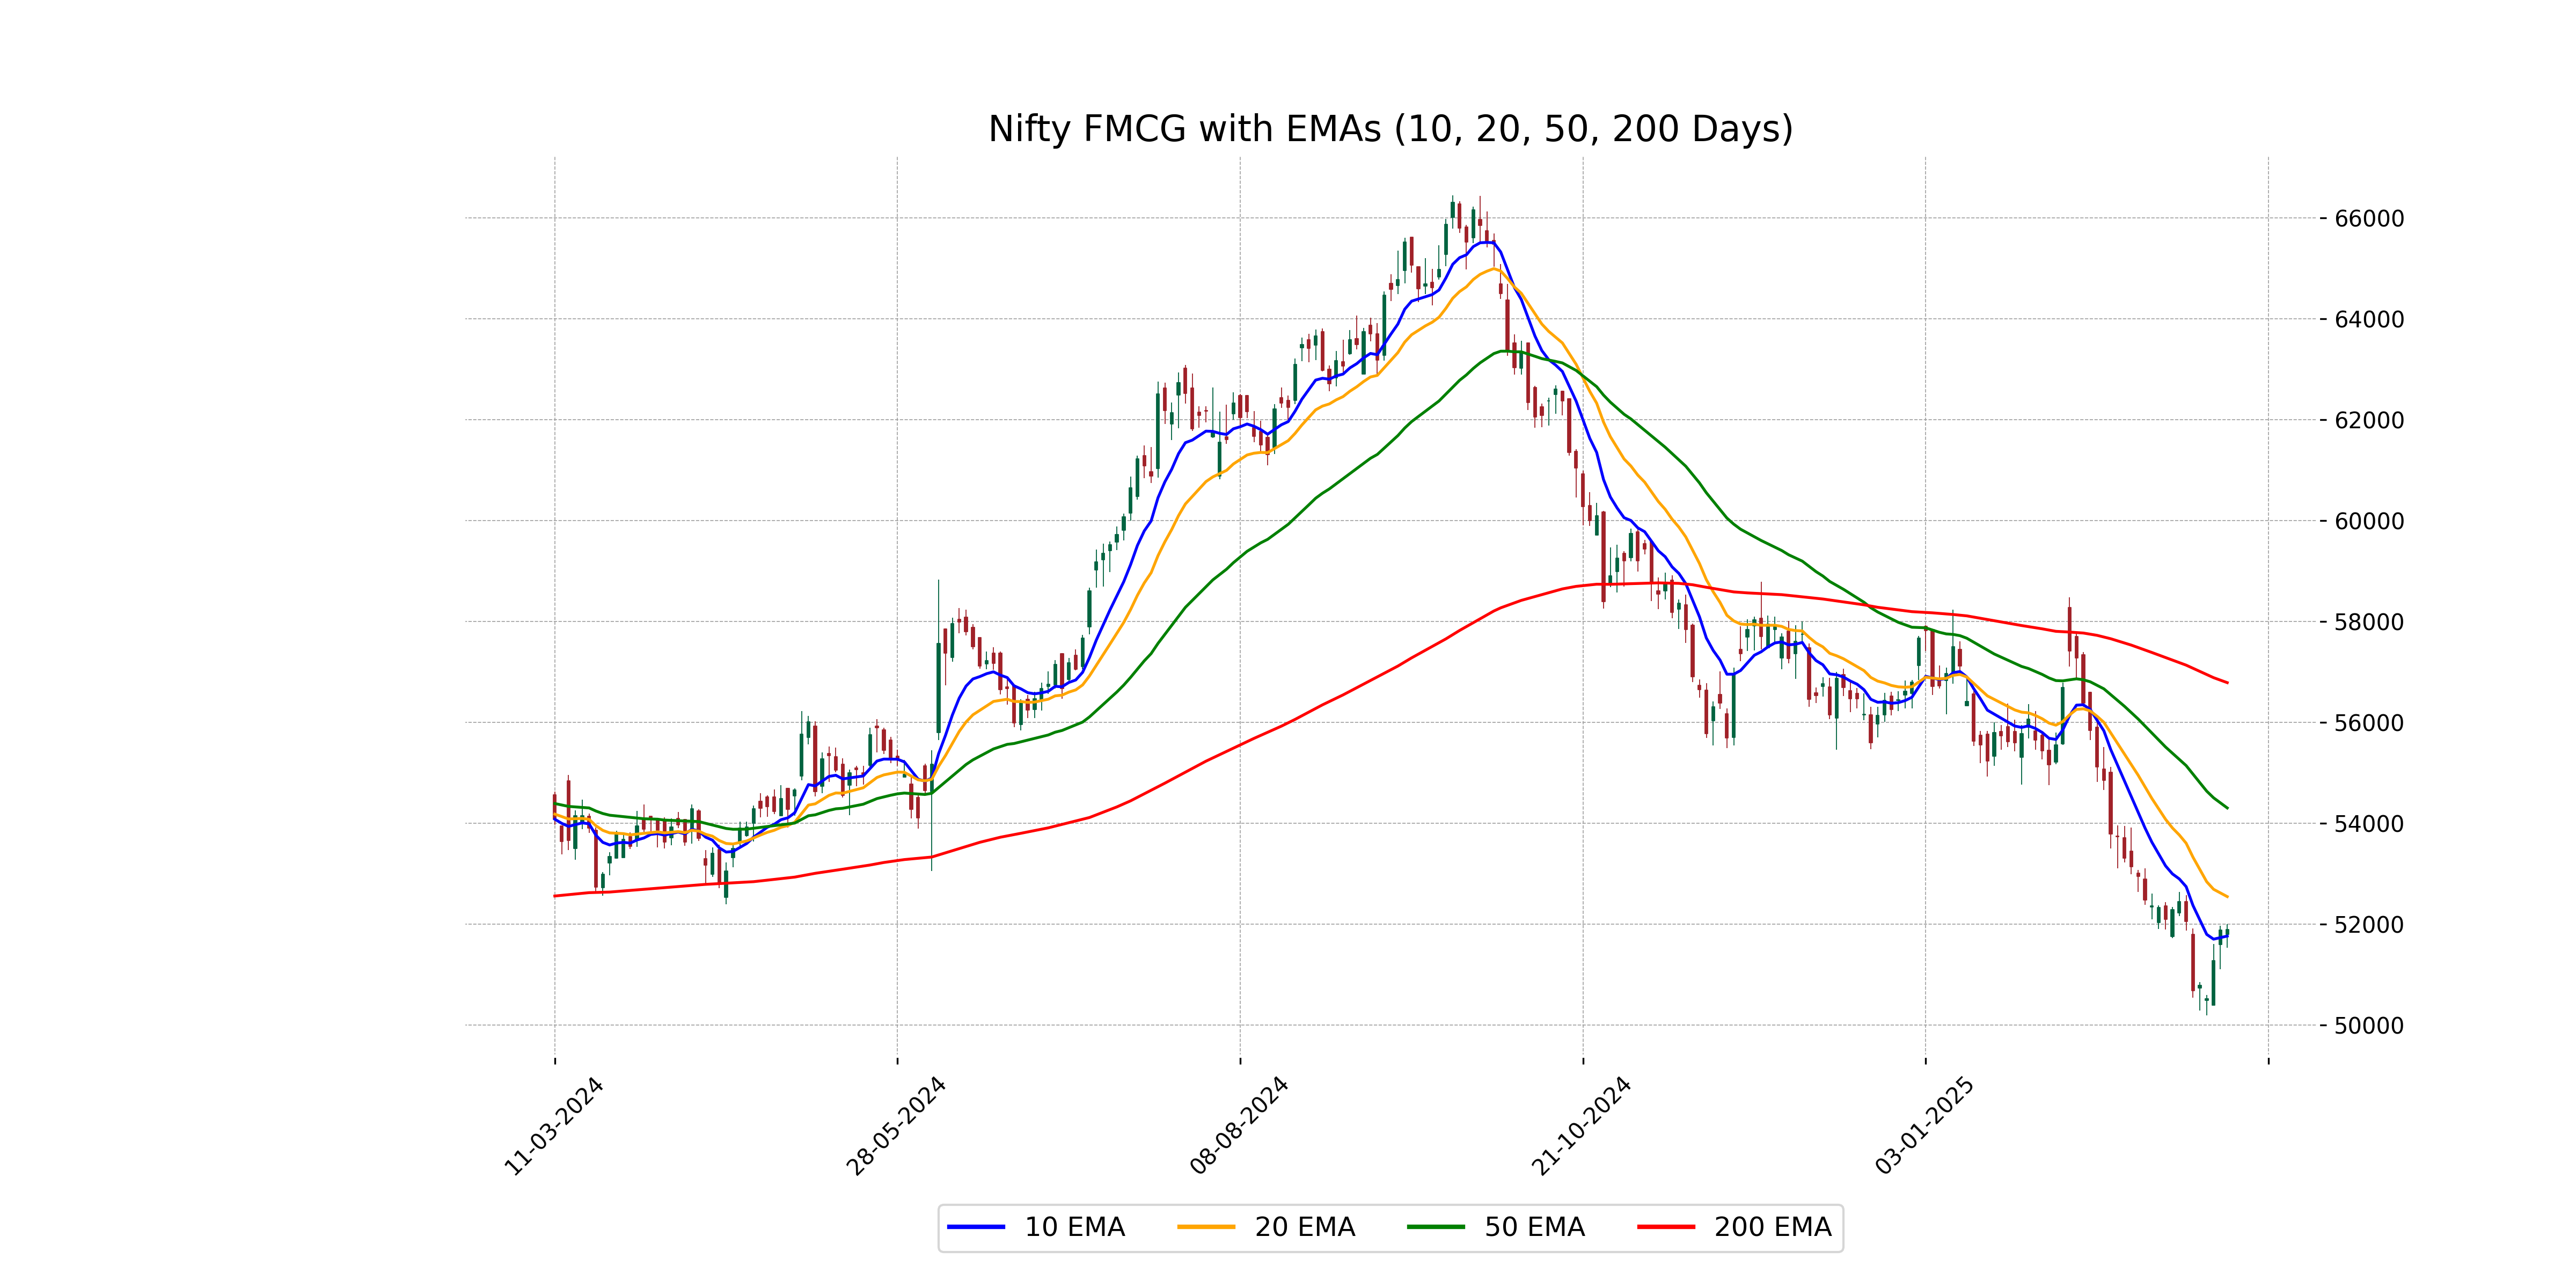
Relationship with Key Moving Averages
Nifty FMCG is currently trading below its 50 EMA of 54305.21 and 200 EMA of 56787.62, indicating a bearish trend in the short to long term. However, the close is slightly above its 10 EMA of 51766.85, suggesting some short-term positive momentum.
Moving Averages Trend (MACD)
The Nifty FMCG index is currently experiencing a bearish momentum as indicated by the negative MACD value of -1065.93. However, the fact that the MACD is slightly above the MACD Signal line suggests a potential early sign of bullish divergence. Further monitoring of the trend is recommended for confirmation.

RSI Analysis
Nifty FMCG has an RSI of 38.72, indicating that the index is in a relatively undervalued condition, potentially signaling a buying opportunity. Typically, an RSI below 30 is considered oversold, while an RSI above 70 indicates overbought conditions.

Analysis for Nifty Infra - March 07, 2025

Nifty Infra opened at 7989.40, reaching a high of 8050.95 and closing at 8000.85, resulting in a 0.27% increase from the previous close of 7979.55. The sector's RSI stands at 49.89, indicating a neutral momentum, while the MACD shows a bearish trend with a value of -96.66. The volume for the day was negligible.

Relationship with Key Moving Averages
The closing price of Nifty Infra at 8000.85 is below both the 50 EMA at 8159.52 and the 200 EMA at 8430.85, indicating a bearish trend over the medium to long term. However, it is above the 10 EMA at 7890.07 and the 20 EMA at 7951.61, suggesting short-term bullish momentum.
Moving Averages Trend (MACD)
The MACD for Nifty Infra is -96.66 and the MACD Signal is -117.18, suggesting a bullish crossover may occur soon if the MACD continues to rise above the signal line. Currently, the trend is still bearish as the MACD is below the signal line, but it's showing signs of potential reversal.

RSI Analysis
RSI Analysis for Nifty Infra The Relative Strength Index (RSI) for Nifty Infra is 49.89, which indicates a neutral position. An RSI close to 50 suggests that the index is neither overbought nor oversold, pointing towards a balanced momentum in the current market conditions.

Analysis for Nifty IT - March 07, 2025

### Nifty IT Performance Nifty IT opened at 38028.15 and closed at 37820.45, marking a decline from its previous close of 38145.30, with a percentage change of -0.85% and a points decrease of 324.85. The RSI is at 30.13, indicating a potentially oversold condition, while the MACD is at -1294.81, suggesting bearish momentum.

Relationship with Key Moving Averages
The close price of Nifty IT at 37,820.45 is below its 50 EMA (41,186.72), 20 EMA (39,612.38), and 10 EMA (38,551.48), indicating a potential bearish trend. Additionally, the MACD is negative, further suggesting downward momentum.
Moving Averages Trend (MACD)
The current MACD value for Nifty IT is -1294.81, with a MACD Signal of -1112.96. This indicates that the MACD line is below the signal line, suggesting a potential ongoing bearish trend. With the RSI at 30.13, the index may also be approaching oversold conditions.

RSI Analysis
Based on the provided data, the Nifty IT has an RSI of 30.13. This suggests that the index is approaching oversold conditions, as an RSI below 30 typically indicates that an asset might be undervalued and potentially due for a corrective bounce. Traders often interpret a low RSI as a potential buying opportunity.

Analysis for Nifty Metal - March 07, 2025

Nifty Metal opened at 8870.30 and closed at 8926.90, showing a positive performance with a point change of 38.25 and a percentage change of 0.43%. The index reached a high of 8978.05 and a low of 8853.25, indicating upward momentum as supported by the RSI of 64.47 and a positive MACD.

Relationship with Key Moving Averages
The closing price of Nifty Metal is above its 50 EMA, 10 EMA, and 200 EMA, indicating a potential uptrend. The 50 EMA and 10 EMA are also higher than the 20 EMA, supporting the bullish sentiment. Additionally, the MACD is positive and above the MACD Signal, further suggesting upward momentum in the price.
Moving Averages Trend (MACD)
The MACD for Nifty Metal is significantly positive at 71.10, indicating strong bullish momentum, as it is well above the MACD signal line, which is slightly negative. This suggests a strong upward trend in the stock index.

RSI Analysis
RSI Analysis for Nifty Metal: The Relative Strength Index (RSI) for Nifty Metal is 64.47, indicating it is approaching overbought territory. A typical overbought level is considered to be above 70, so while it is not yet overbought, it should be monitored for potential trend reversals.

Analysis for Nifty Bank - March 07, 2025

Nifty Bank opened at 48463.80, reached a high of 48709.05, and closed at 48497.5, resulting in a decrease of around 0.27% or -130.20 points. The 50-day EMA and 200-day EMA suggest the index is below its average long-term trends. The RSI is at 42.41, indicating bearish momentum, while the MACD is negative at -325.89, reflecting a downward trend compared to its signal line.

Relationship with Key Moving Averages
The current price of Nifty Bank is below its 50-day and 200-day exponential moving averages (EMAs), indicating a longer-term bearish trend. It is also slightly below its 10-day and 20-day EMAs, suggesting recent bearish momentum. Overall, the relationship with key moving averages suggests a bearish outlook for Nifty Bank at this time.
Moving Averages Trend (MACD)
Nifty Bank's MACD value is -325.89, which is below the MACD Signal line at -298.17. This indicates a bearish momentum as the MACD is in negative territory and has crossed below the signal line.

RSI Analysis
RSI Analysis for Nifty Bank: The Relative Strength Index (RSI) is 42.41, which is below the neutral 50 level, indicating that the market may be experiencing bearish momentum. An RSI below 30 would typically suggest oversold conditions, but at 42.41, Nifty Bank is not in that territory yet.

Analysis for Nifty 50 - March 07, 2025

The Nifty 50 opened at 22508.65, reaching a high of 22633.80 and a low of 22464.75 before closing at 22552.5. It saw a marginal increase in value, with a percentage change of 0.0346% compared to the previous close of 22544.70. The RSI indicator is at 41.86, showing a neutral momentum, while the MACD suggests bearish sentiment with a negative value of -260.97.

Relationship with Key Moving Averages
The current close for Nifty 50 is 22,552.5, which is below its 50-day EMA of 23,119.32 and 200-day EMA of 23,462.63, indicating a bearish trend. However, it is slightly above the 10-day EMA of 22,488.77, but below the 20-day EMA of 22,686.68, suggesting potential short-term stability.
Moving Averages Trend (MACD)
The Nifty 50's MACD is at -260.97, which is below the MACD Signal of -254.94, indicating a bearish trend. This suggests the index may experience downward momentum unless there is a reversal in trend.

RSI Analysis
RSI Analysis for Nifty 50: The Relative Strength Index (RSI) for Nifty 50 is 41.86, indicating that the market is approaching the oversold territory but isn't there yet. An RSI below 30 typically signals an oversold condition, suggesting potential buying opportunities, while an RSI above 70 may indicate an overbought scenario.

Up Next
Indian stock market sector-wise performance today - March 07, 2025

Honda Activa 6G: Everything You Need to Know Before Buying

How much does a ULIP plan really cost? A break-down of all charges

Centre plans to borrow Rs 8.20 lakh cr from market in first half of FY27

Reliance denies buying Iranian oil amid US sanctions waiver

Premium petrol price up Rs 2, industrial diesel up Rs 22; no change in normal petrol, diesel rates

More videos

India's GDP expected to register over 8 pc growth in Sep-Dec: Report

Govt announces seven measures to help boost exports

RBI keeps interest rates on hold after US trade deal boosts outlook

RBI proposes to compensate customers up to Rs 25,000 loss due to fraud

RBI raises GDP growth projection of Q1, Q2 of FY27

RBI pauses rate cuts, retains interest rate at 5.25 pc

Rupee jumps 122 paise to close at 90.27 against US dollar on India-US trade deal

Stock markets cheer India-US trade deal: Sensex, Nifty surge 2.5 pc

UPI transactions hit record high of Rs 230 lakh crore in 2025-26 till Dec: Govt

Explained: India-US trade deal, tariffs and trade benefits