


Highlights
- BSE Sensex and most indices witnessed declines today
- Nifty Auto saw a minor dip at -0.25%, while Nifty FMCG fell -0.49%
- Steepest drop was in Nifty Energy at -1.07%
Latest news

Samsung Galaxy Z Fold 8, Fold 8 Ultra & Z Flip 8: A More Mature Foldable Family

Dell Launches New Alienware 16X Aurora, 16 Area-51 and 18 Area-51 Gaming Laptops in India

Samsung Takes on Premium Home Audio With New Music Studio Series

The End of OxygenOS: OnePlus Confirms Shift to Oppo's ColorOS

Fujifilm Instax Mini Evo Cinema Review: A Hybrid Camera That Prints Memories Differently

iQOO Teases Z11 Lite With AI Tools, Military-Grade Durability and a 6500mAh Battery

Editorji Launches Hook Global, Its International Digital News Brand

Samsung's Bespoke AI ACs Focus on Humidity, Hygiene and Smarter Cooling
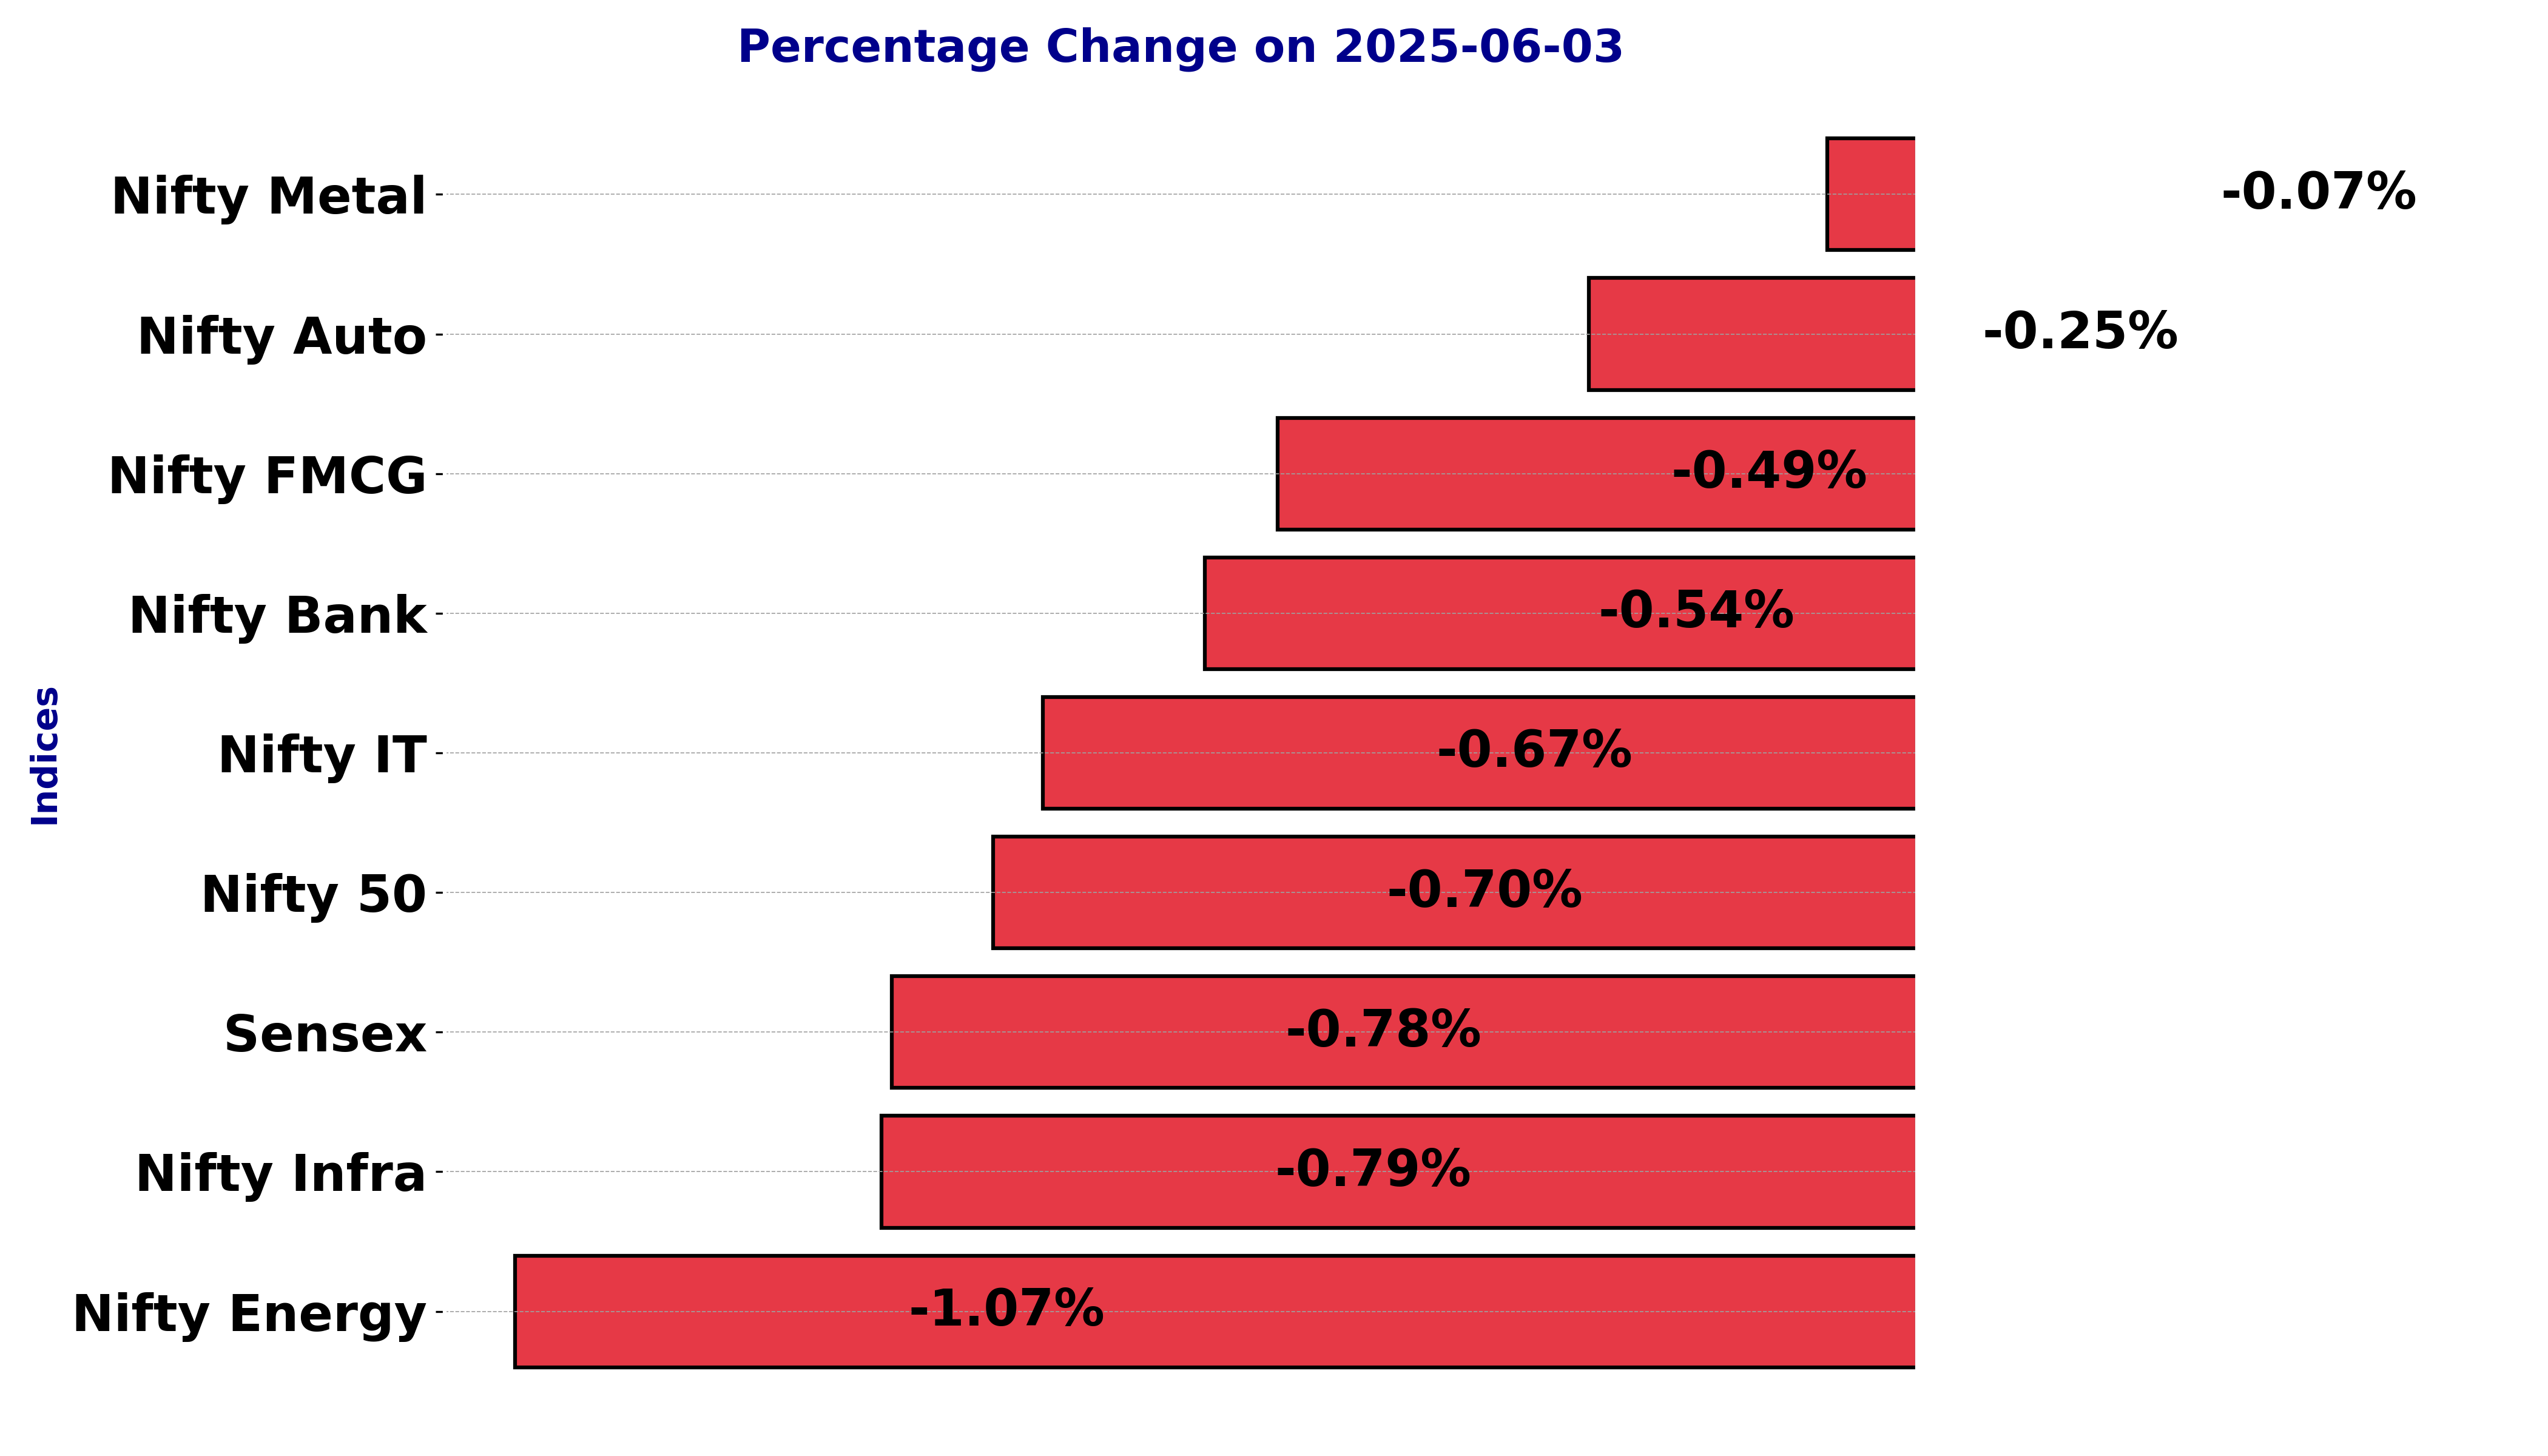
Indian stock market sector-wise performance today - June 03, 2025


The stock market on Tuesday (June 3, 2025) experienced a day of declines, with several notable indices exhibiting significant percentage changes.
Leading the downturn was the BSE Sensex, which saw a decrement of 0.78%, reflecting a fall in major stocks that compose this benchmark index.
Among the sectors, the Nifty Energy was notably affected, closing with a decline of 1.07%, the largest drop among the tracked indices. This downturn in the energy sector might be attributed to adjustments in commodity prices or regulatory changes affecting the energy sector specifically, leading to reduced investor confidence.
On the other hand, the Nifty FMCG also saw a decrease, falling by 0.49%. Consumer goods sectors often react to shifts in consumer confidence or incremental changes in commodity prices, which could have influenced its performance negatively in this session.
The Nifty Bank index decreased by 0.54%, indicating a modest pullback in banking stocks, possibly due to investor concerns about interest rates or macroeconomic factors impacting the financial sector.
Nifty IT followed suit with a decline of 0.67%, as technology stocks responded to broader tech market trends and investor sentiment changes, which might have been influenced by international market movements.
Meanwhile, the Nifty Auto index only slightly decreased by 0.25%, showcasing relative resilience compared to other sectors, which might have been bolstered by positive developments or announcements within the automobile industry.
The Nifty Metal index was almost stable, with a minor decrease of 0.07%, indicating stability as commodities often respond to market supply-demand but seem unaffected by broader market declines on that day.
In summary, the declines across these indices highlight a challenging trading session with energy stocks leading the losses.
Potential reasons for the sharp movement in the energy sector could involve external market pressures or significant changes within domestic policies influencing energy consumption and production.
The overall market sentiment was cautious, as reflected by the downward movement across major indices.
Analysis for Sensex - June 03, 2025

Sensex Performance Summary: The Sensex opened at 81492.5 and closed at 80737.5, recording a decline with a percentage change of -0.78% and a points change of -636.24 from the previous close of 81373.75. The Relative Strength Index (RSI) is at 50.14, indicating a neutral momentum, while the Moving Average Convergence Divergence (MACD) is slightly below the signal line, suggesting a bearish trend.
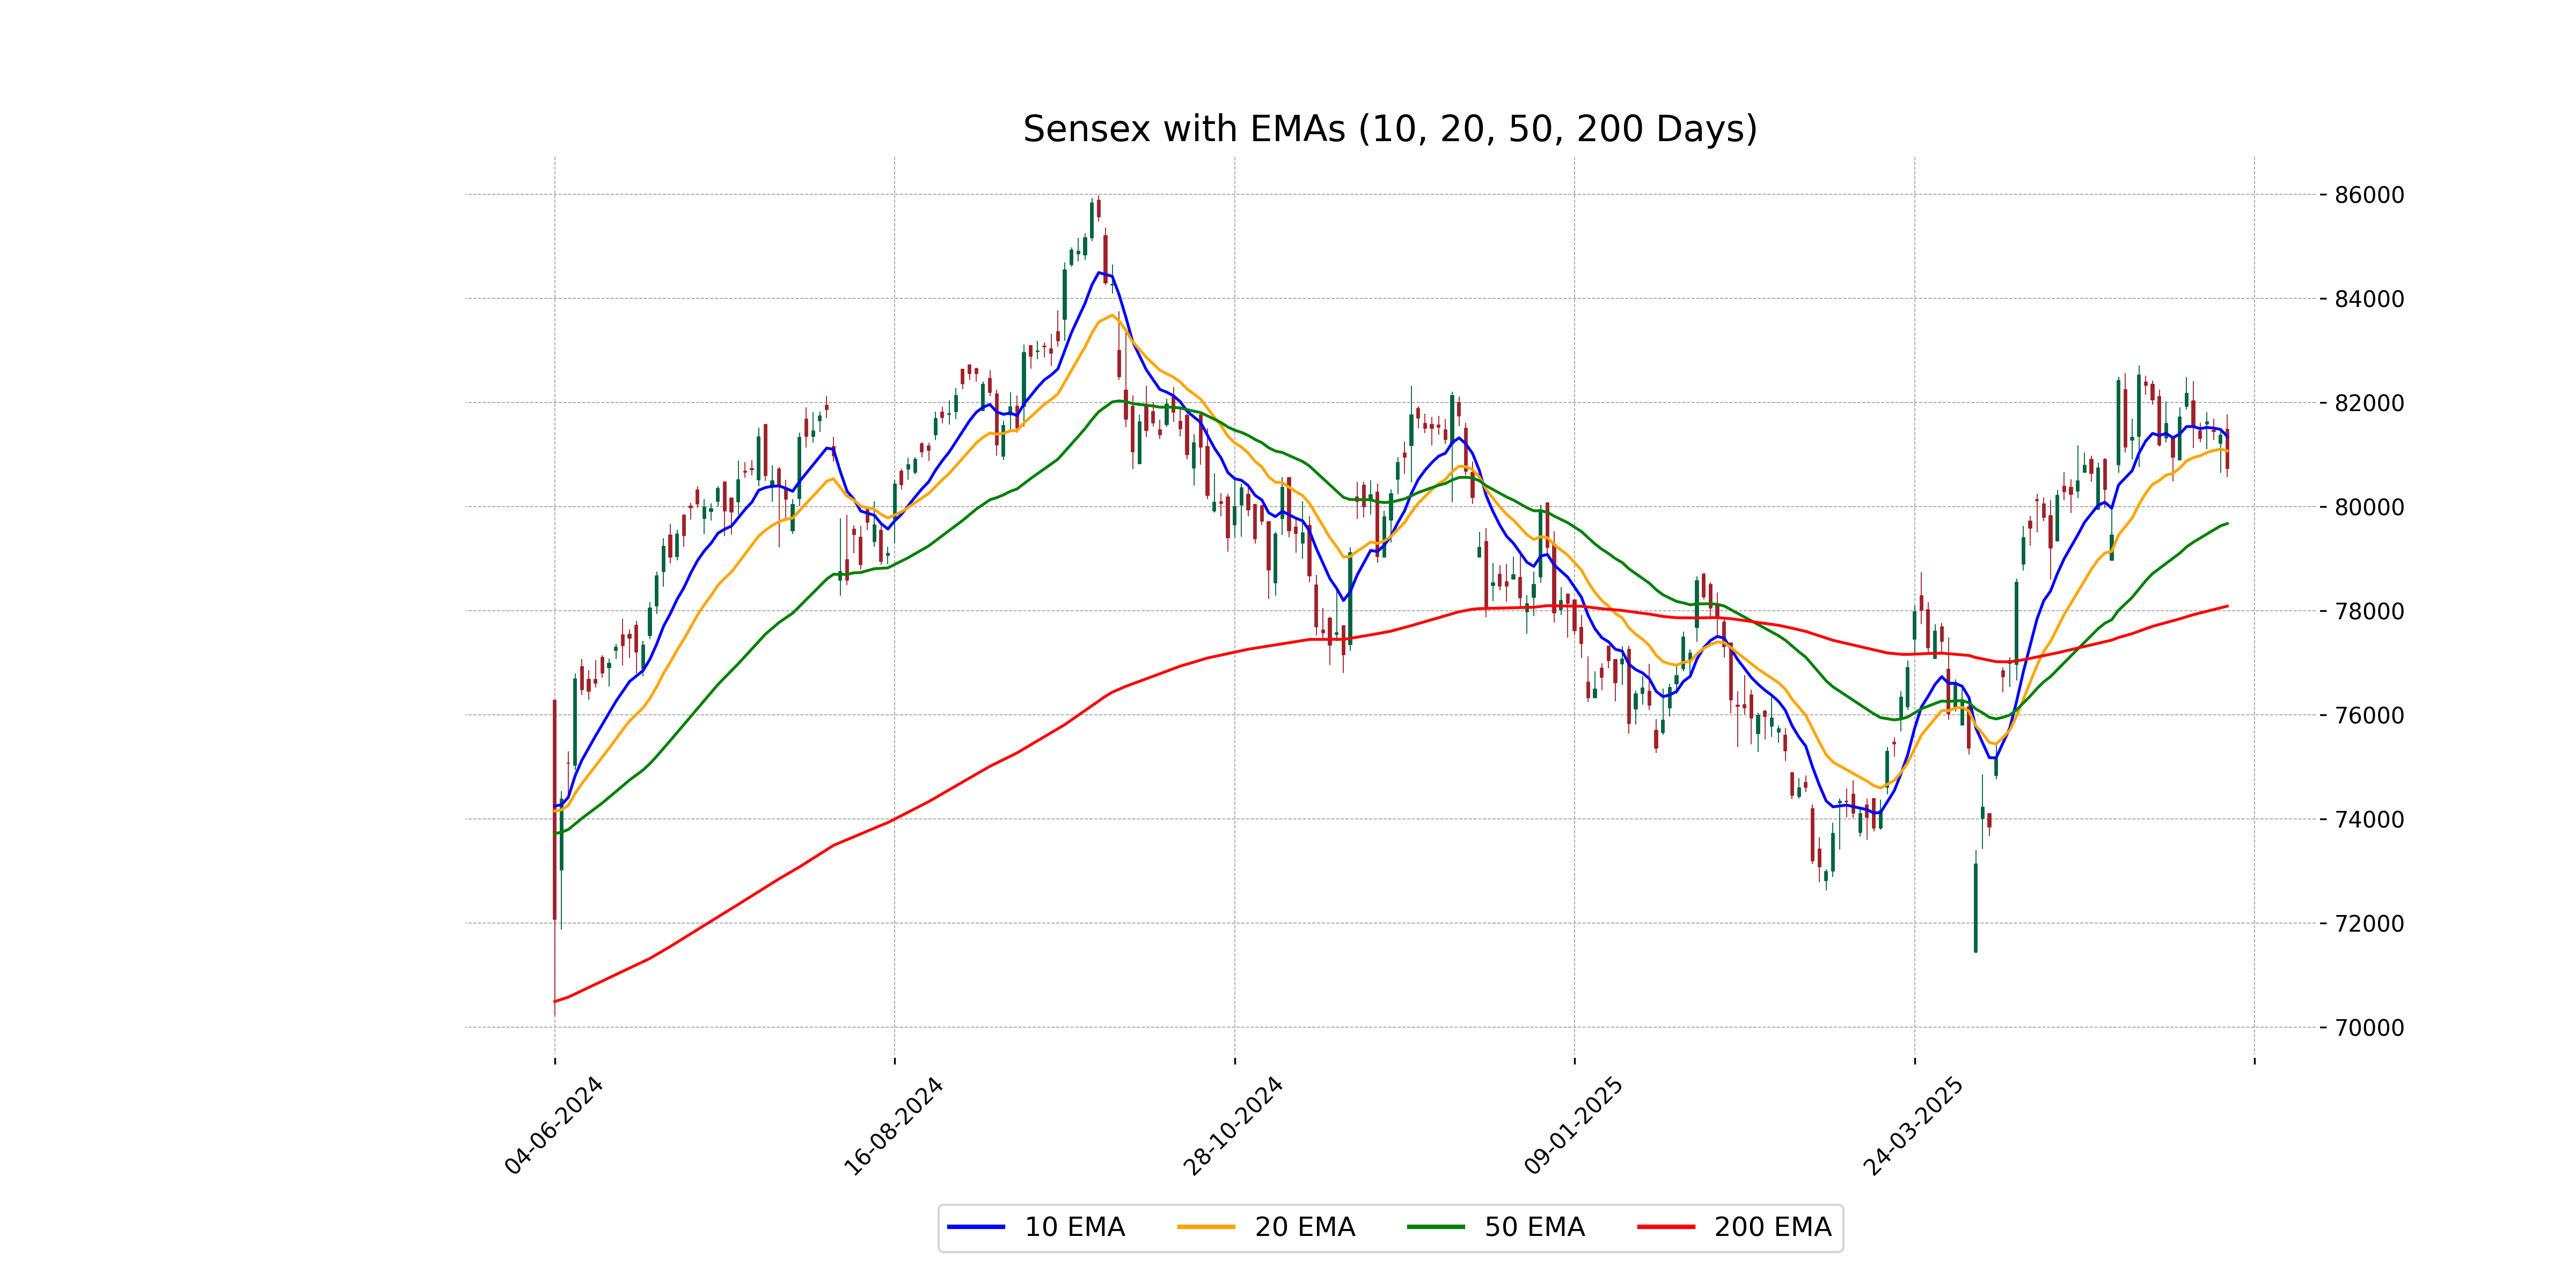
Relationship with Key Moving Averages
Sensex closed below its 10 and 20 EMA, indicating a potential short-term bearish trend, as the closing price of 80,737.51 is lower than both averages of 81,349.96 and 81,073.16, respectively. However, it remains above the 50 and 200 EMA values of 79,676.97 and 78,091.50, suggesting a longer-term upward trend.
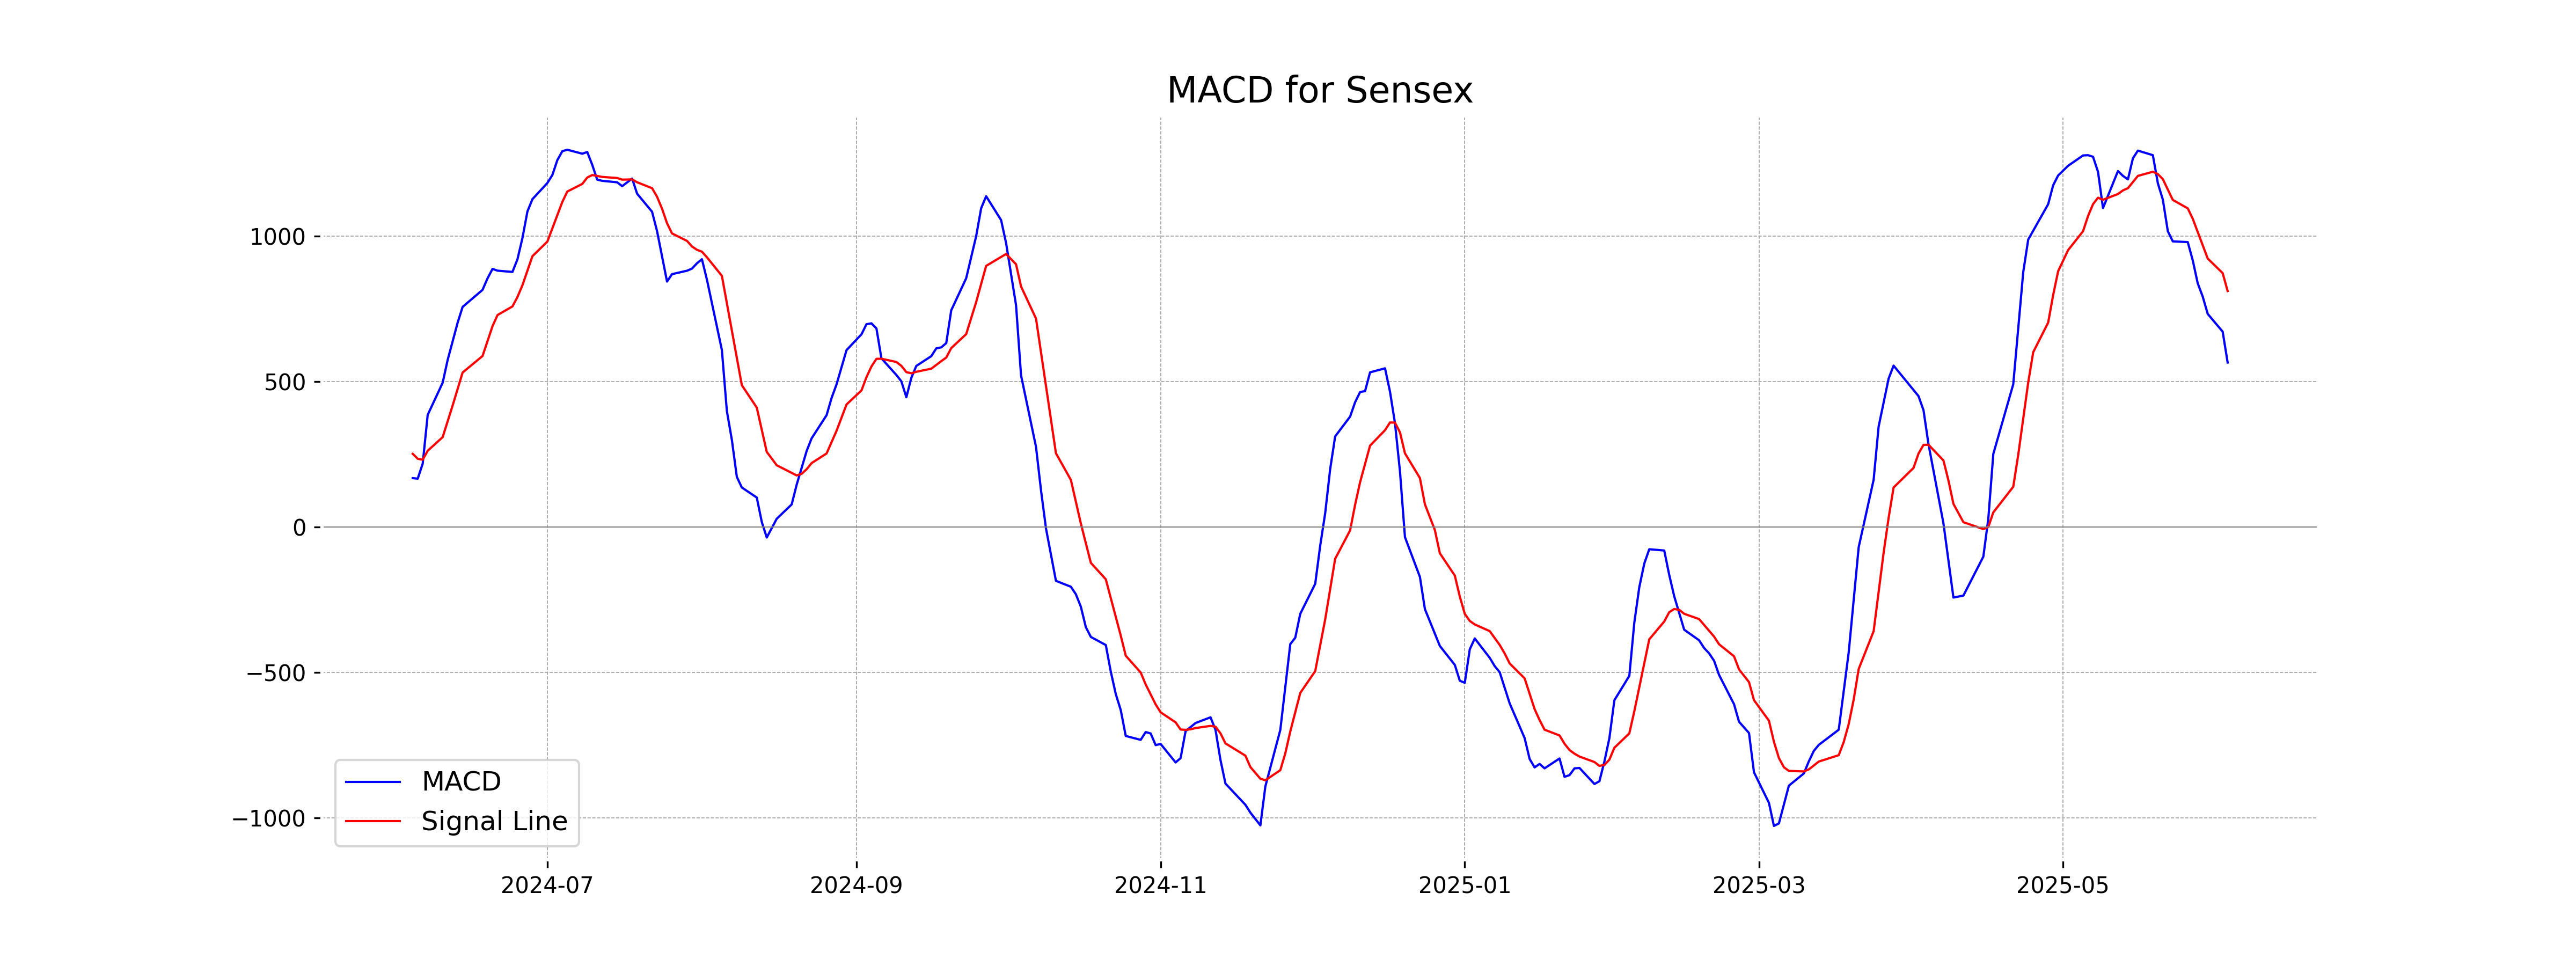
Moving Averages Trend (MACD)
MACD Analysis for Sensex: The MACD line for Sensex is currently at 566.00, which is below the MACD Signal line at 811.96. This indicates a potential bearish trend as the momentum may be shifting downward. Investors should monitor for any further divergence or convergence between the MACD and Signal lines for future trend indications.
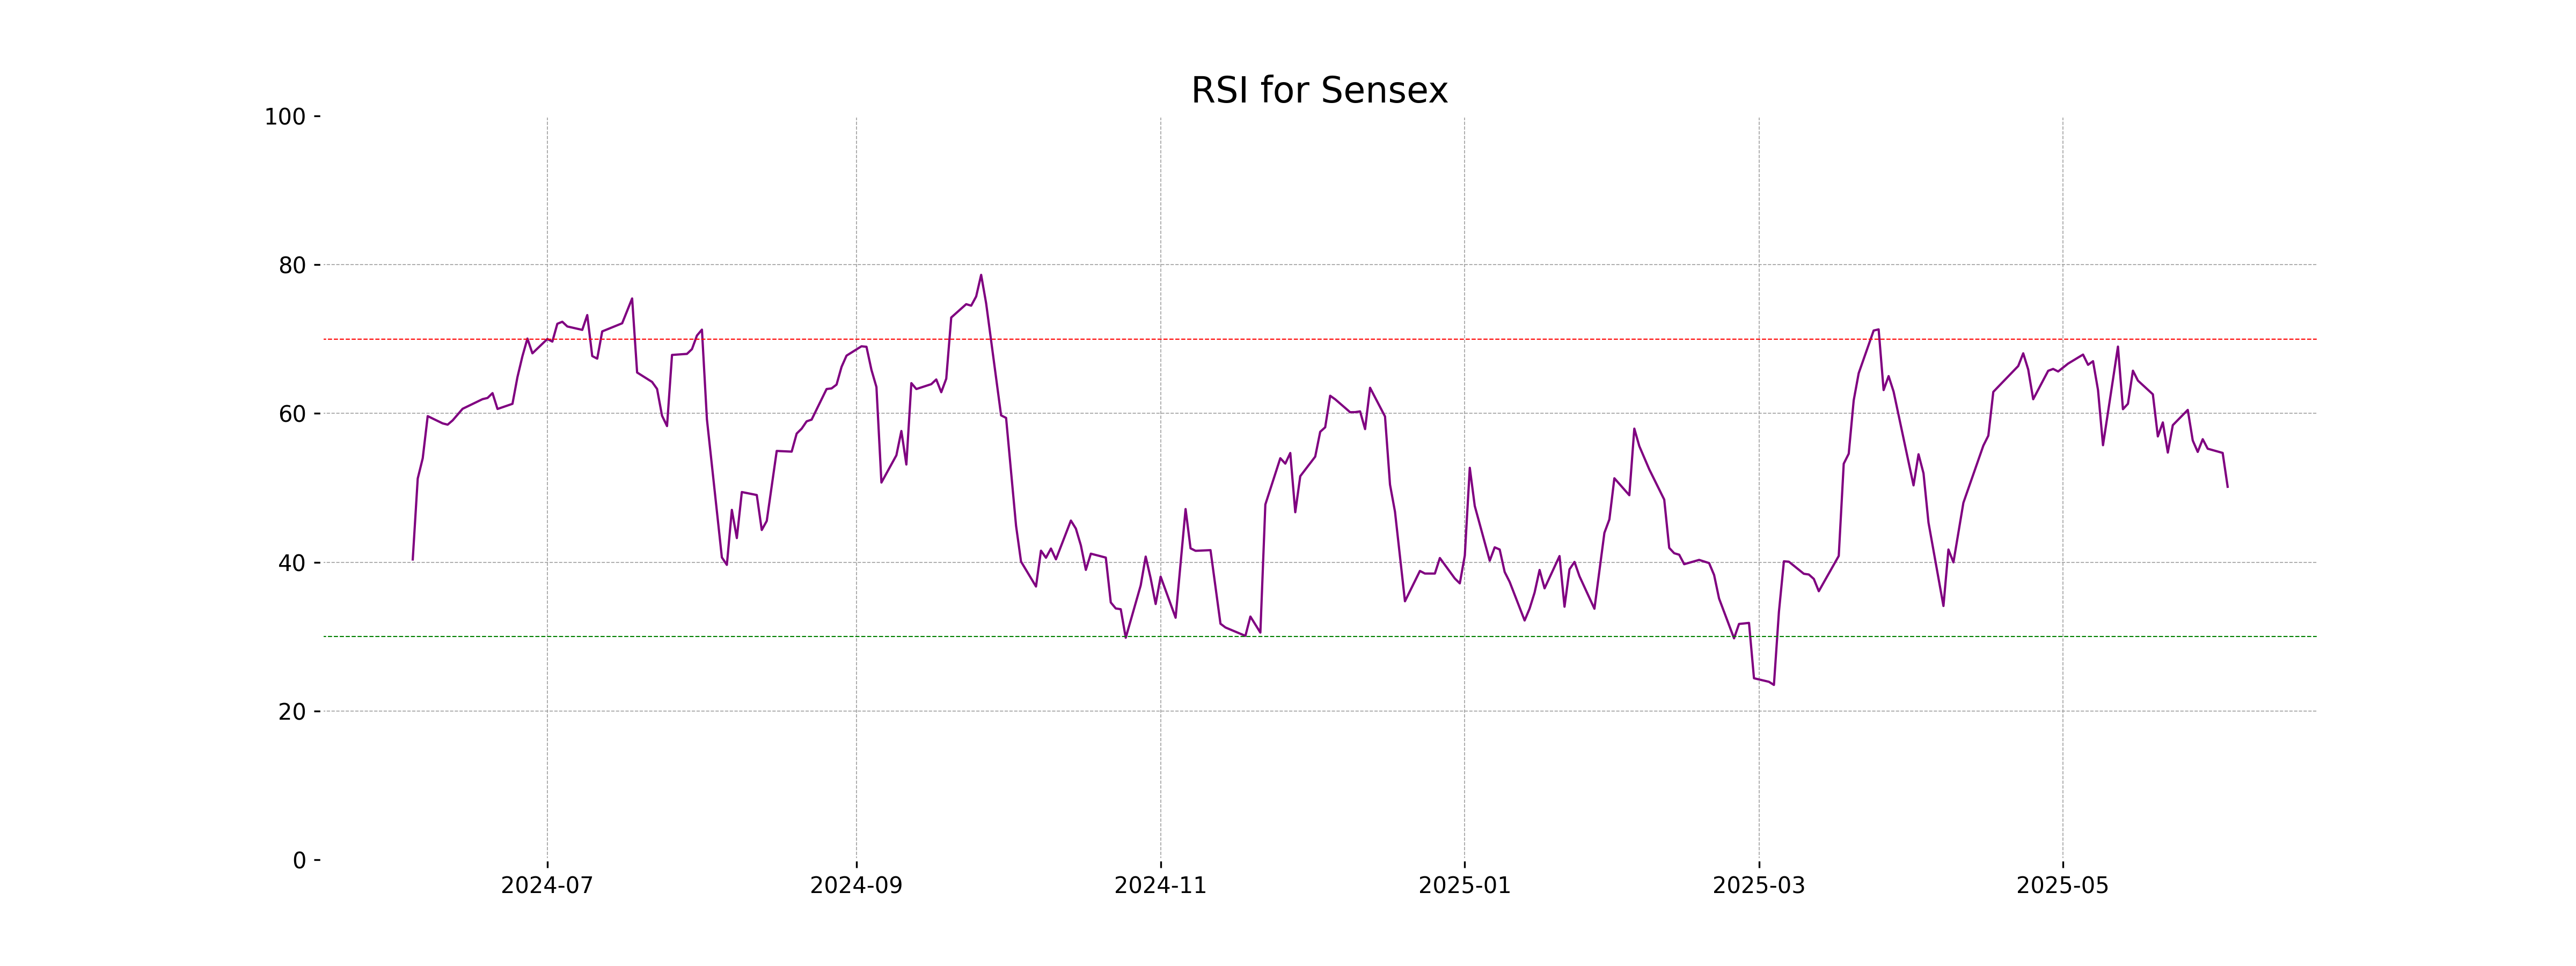
RSI Analysis
RSI Analysis for Sensex: The Relative Strength Index (RSI) is at 50.14, indicating a neutral market sentiment. This suggests neither overbought nor oversold conditions, implying potential stability or indecision in the current market dynamics.
Analysis for Nifty Auto - June 03, 2025
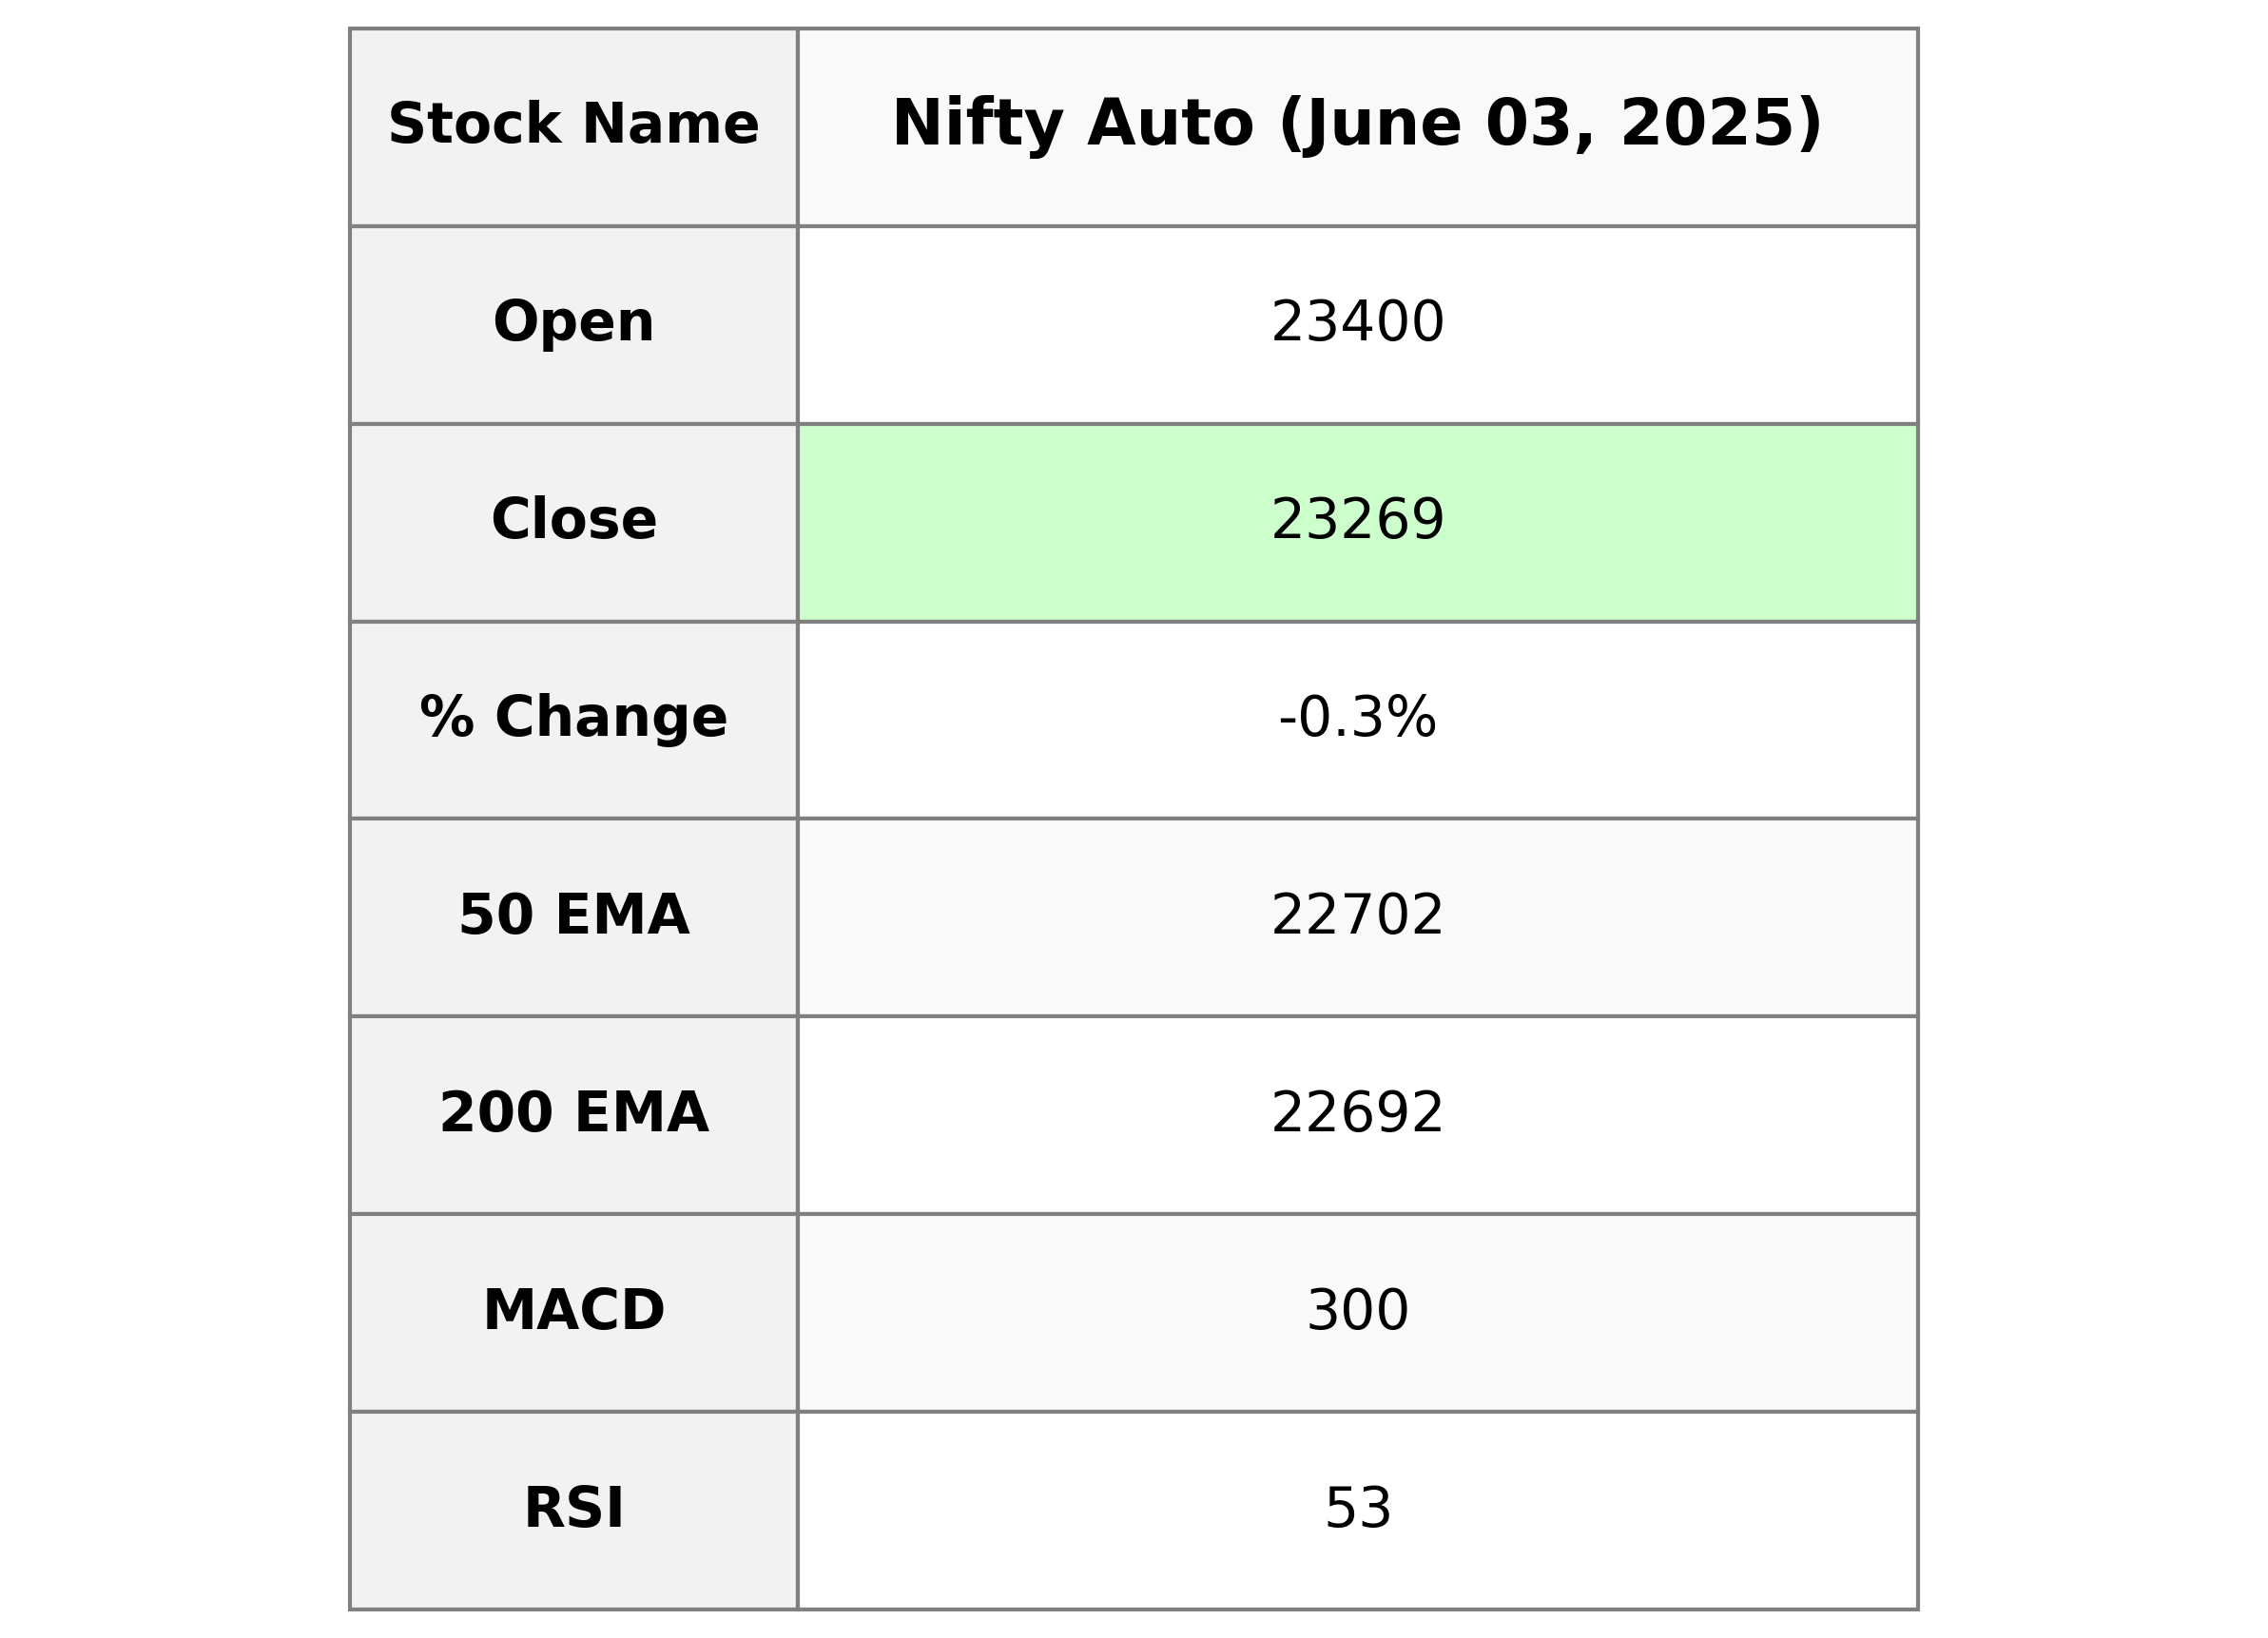
Nifty Auto opened at 23,399.80 and closed at 23,268.70, showing a decrease of 0.25% or 58.35 points compared to the previous close. The RSI is at 53.46, indicating a neutral momentum. The MACD is below its signal line, suggesting potential bearish momentum in the short term.
Relationship with Key Moving Averages
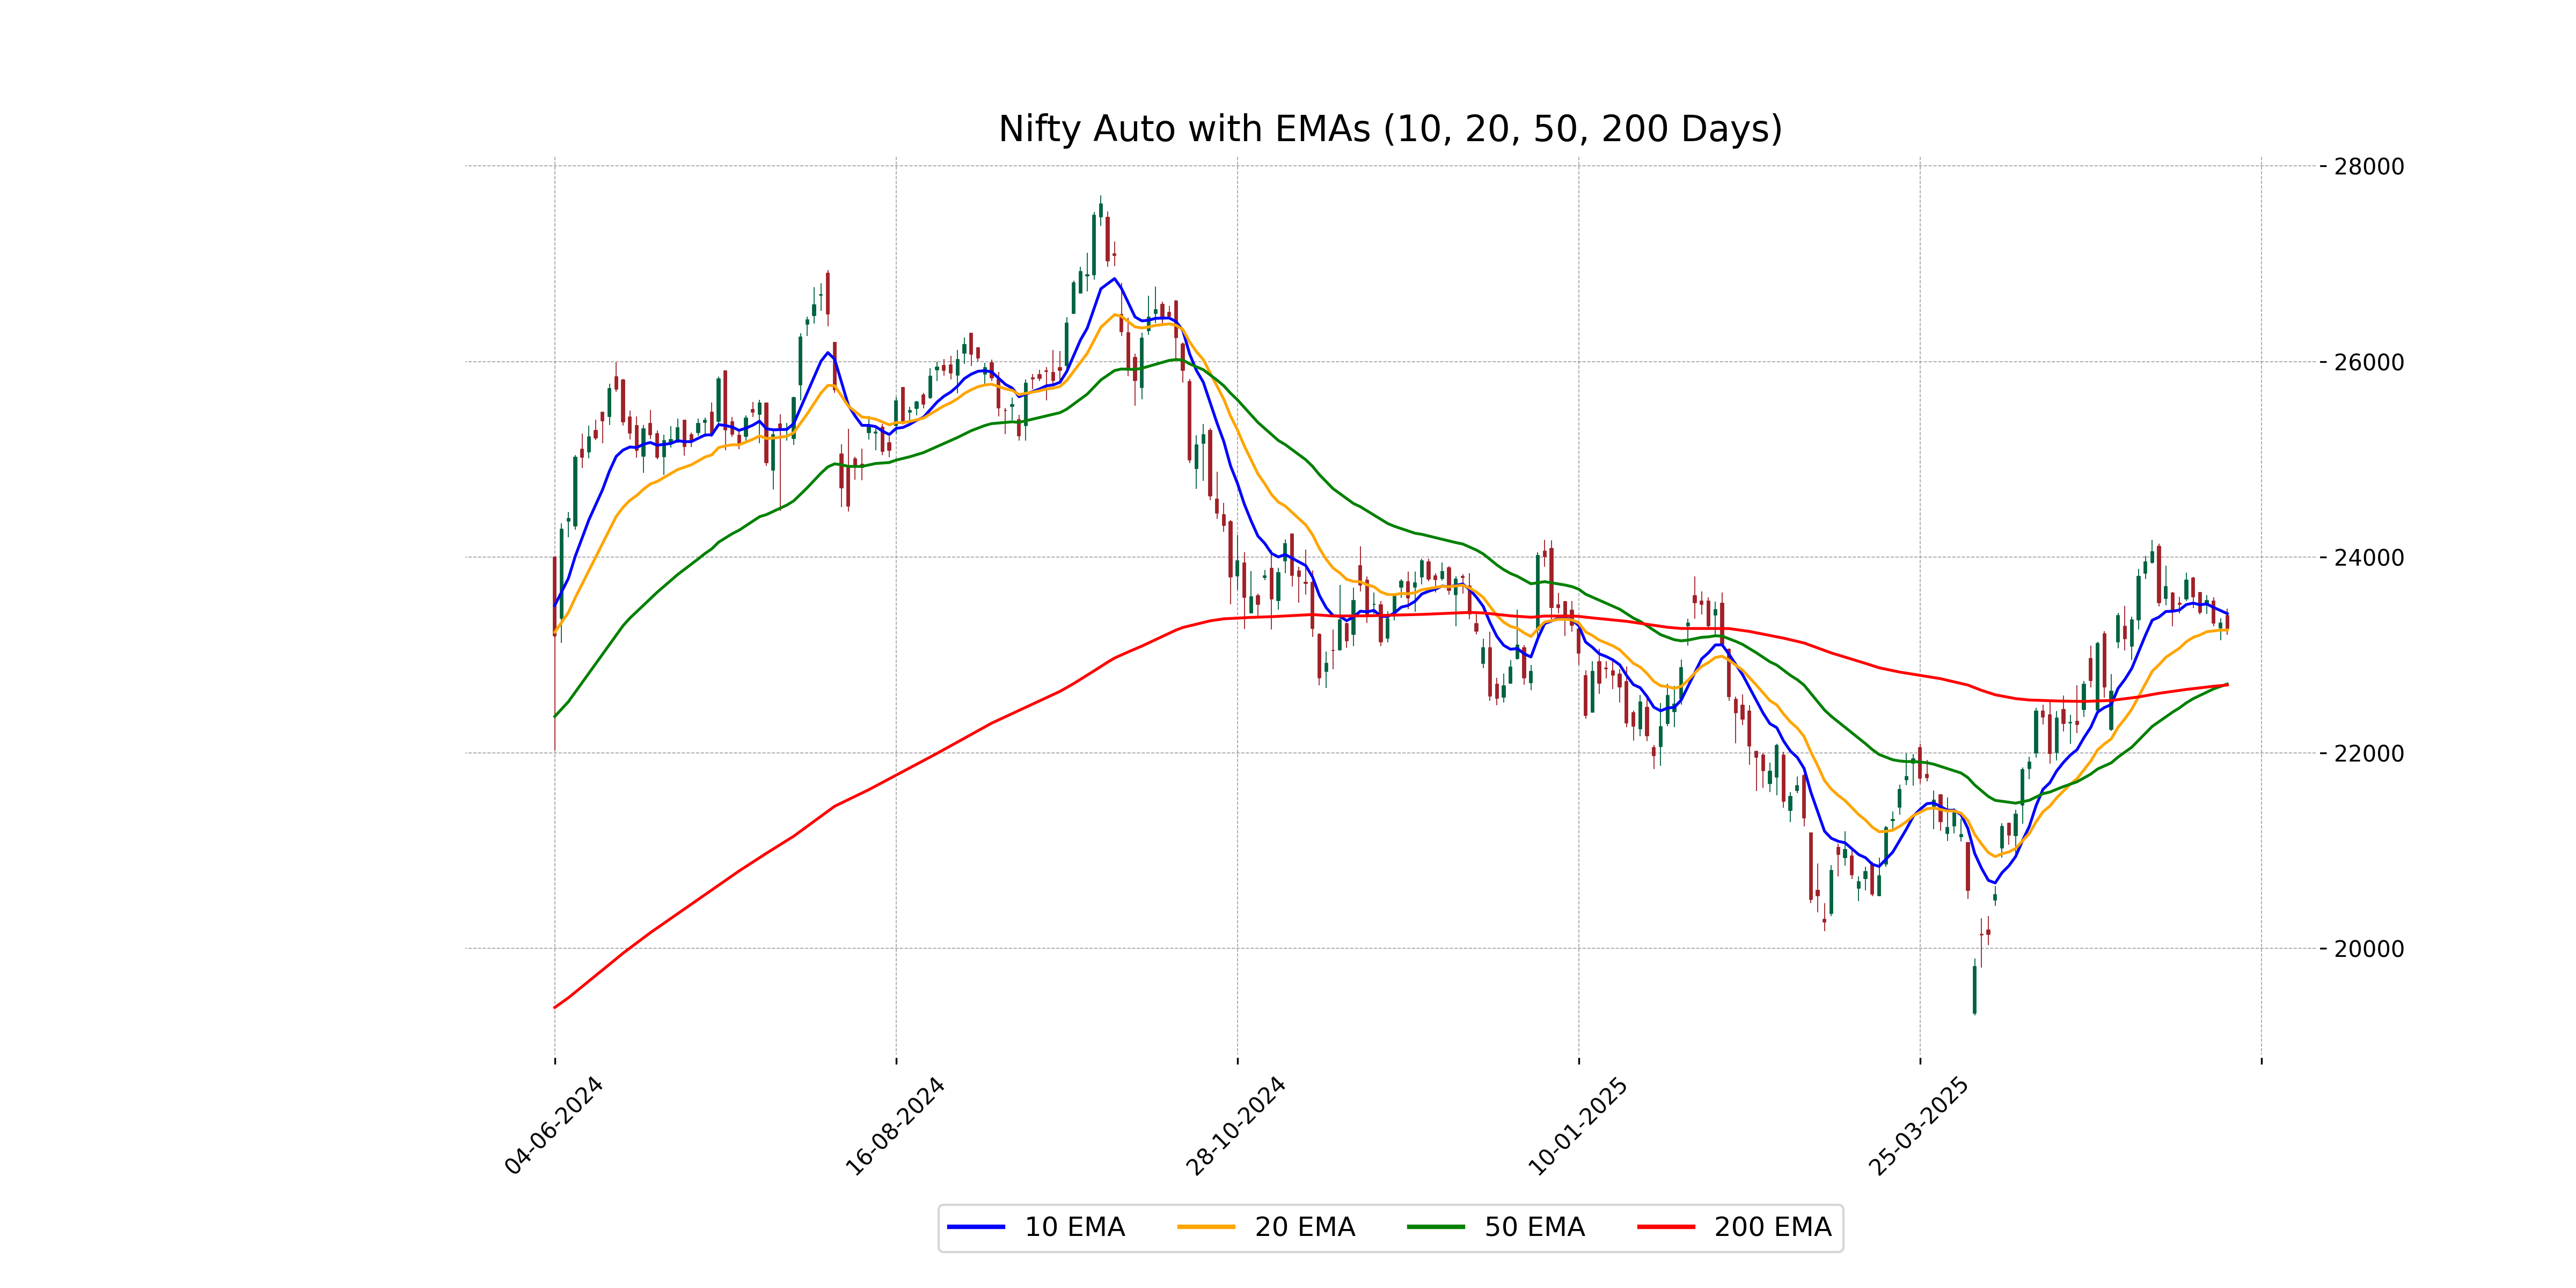
Nifty Auto closed at 23,268.70, below its 10-day EMA of 23,422.19, indicating short-term bearishness, but it remains above both its 50-day (22,701.98) and 200-day (22,691.68) EMAs, suggesting long-term bullish trends. The MACD is at 300.06 below its signal line of 409.24, further supporting a short-term negative outlook.
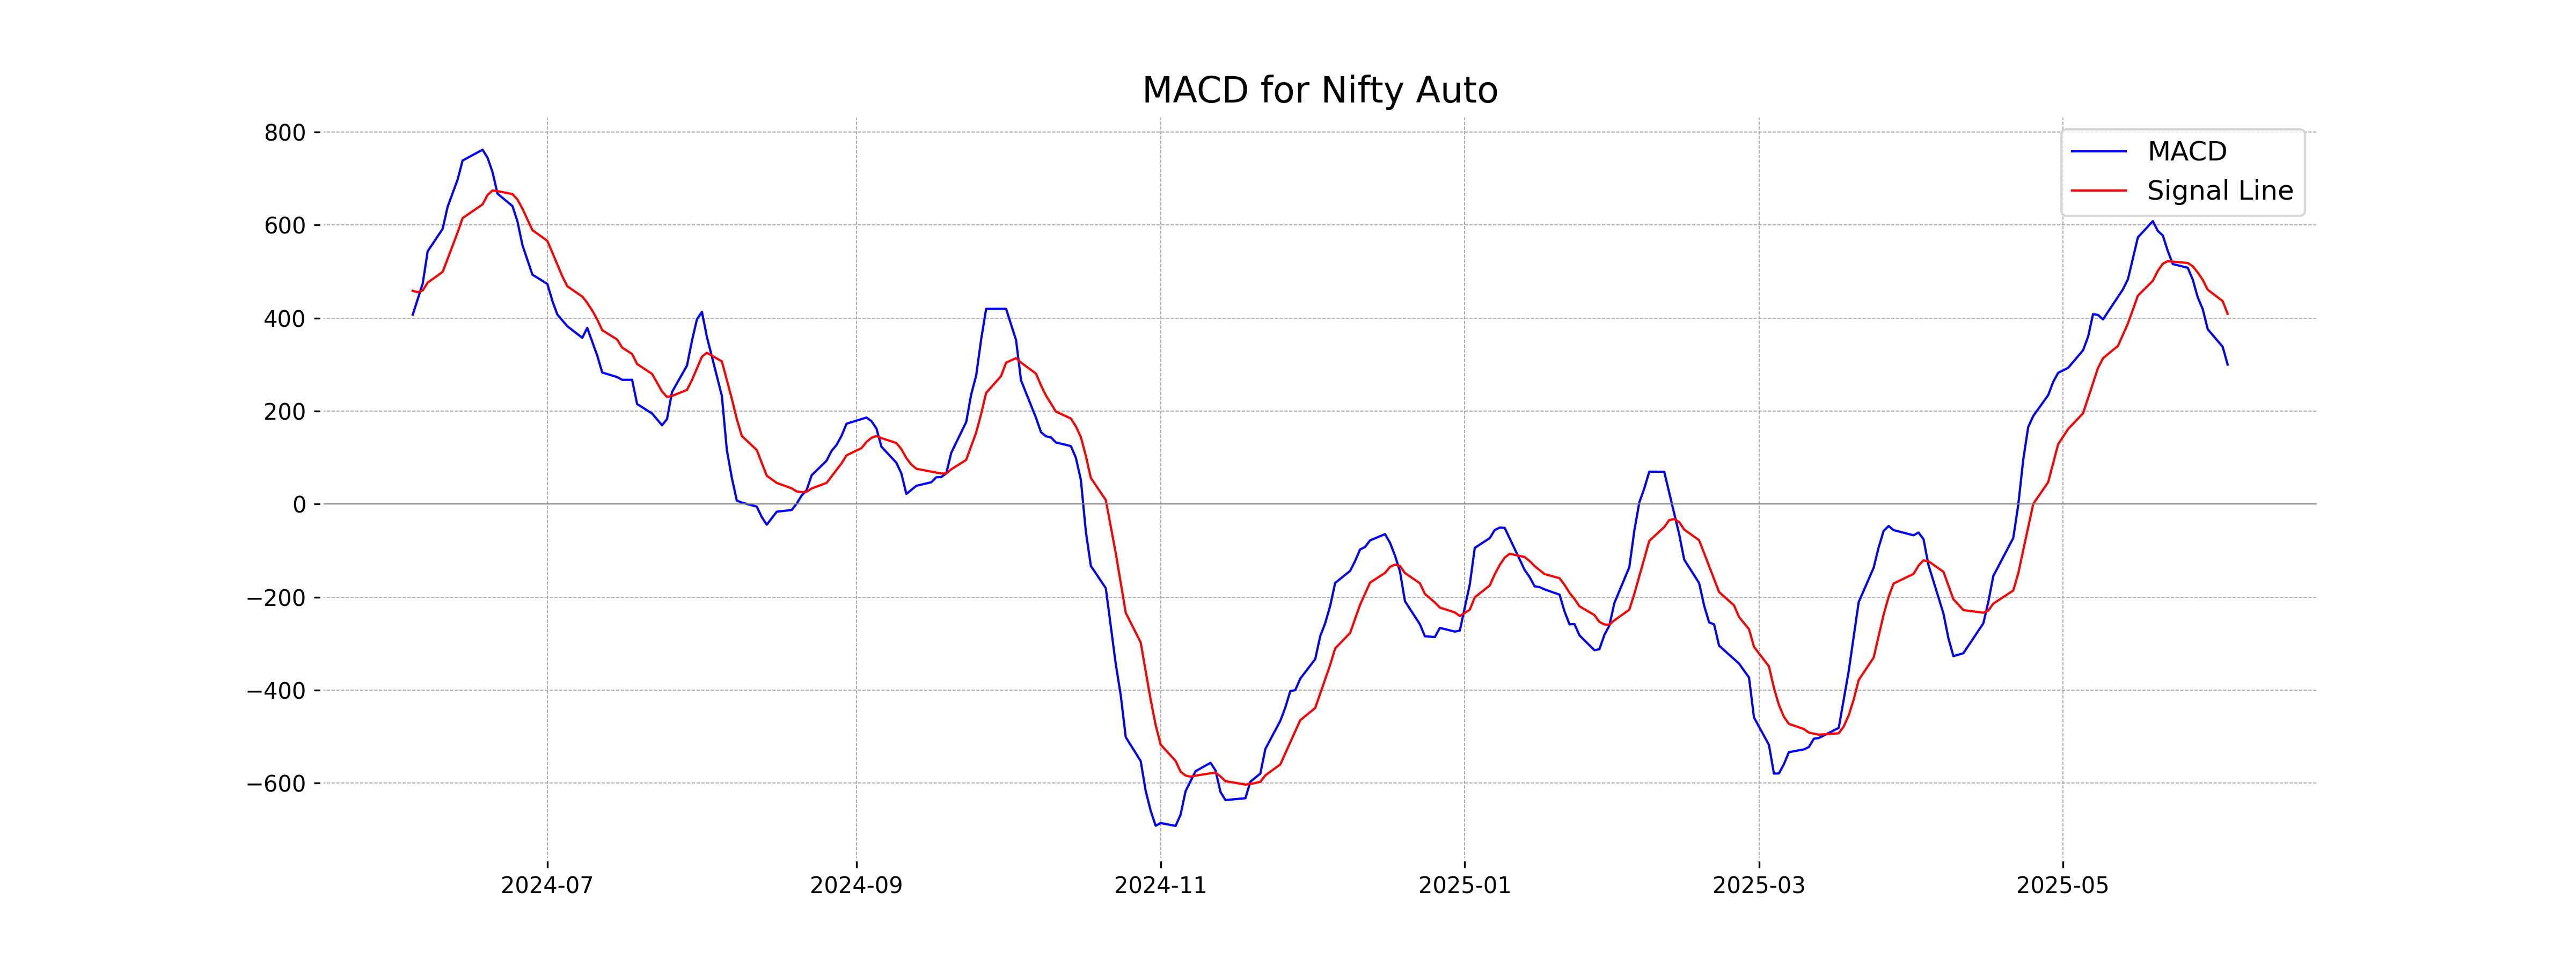
Moving Averages Trend (MACD)
The MACD value for Nifty Auto is 300.06, while the MACD Signal value is 409.24, indicating a bearish signal as the MACD is below the signal line. This suggests that the current momentum may be negative.
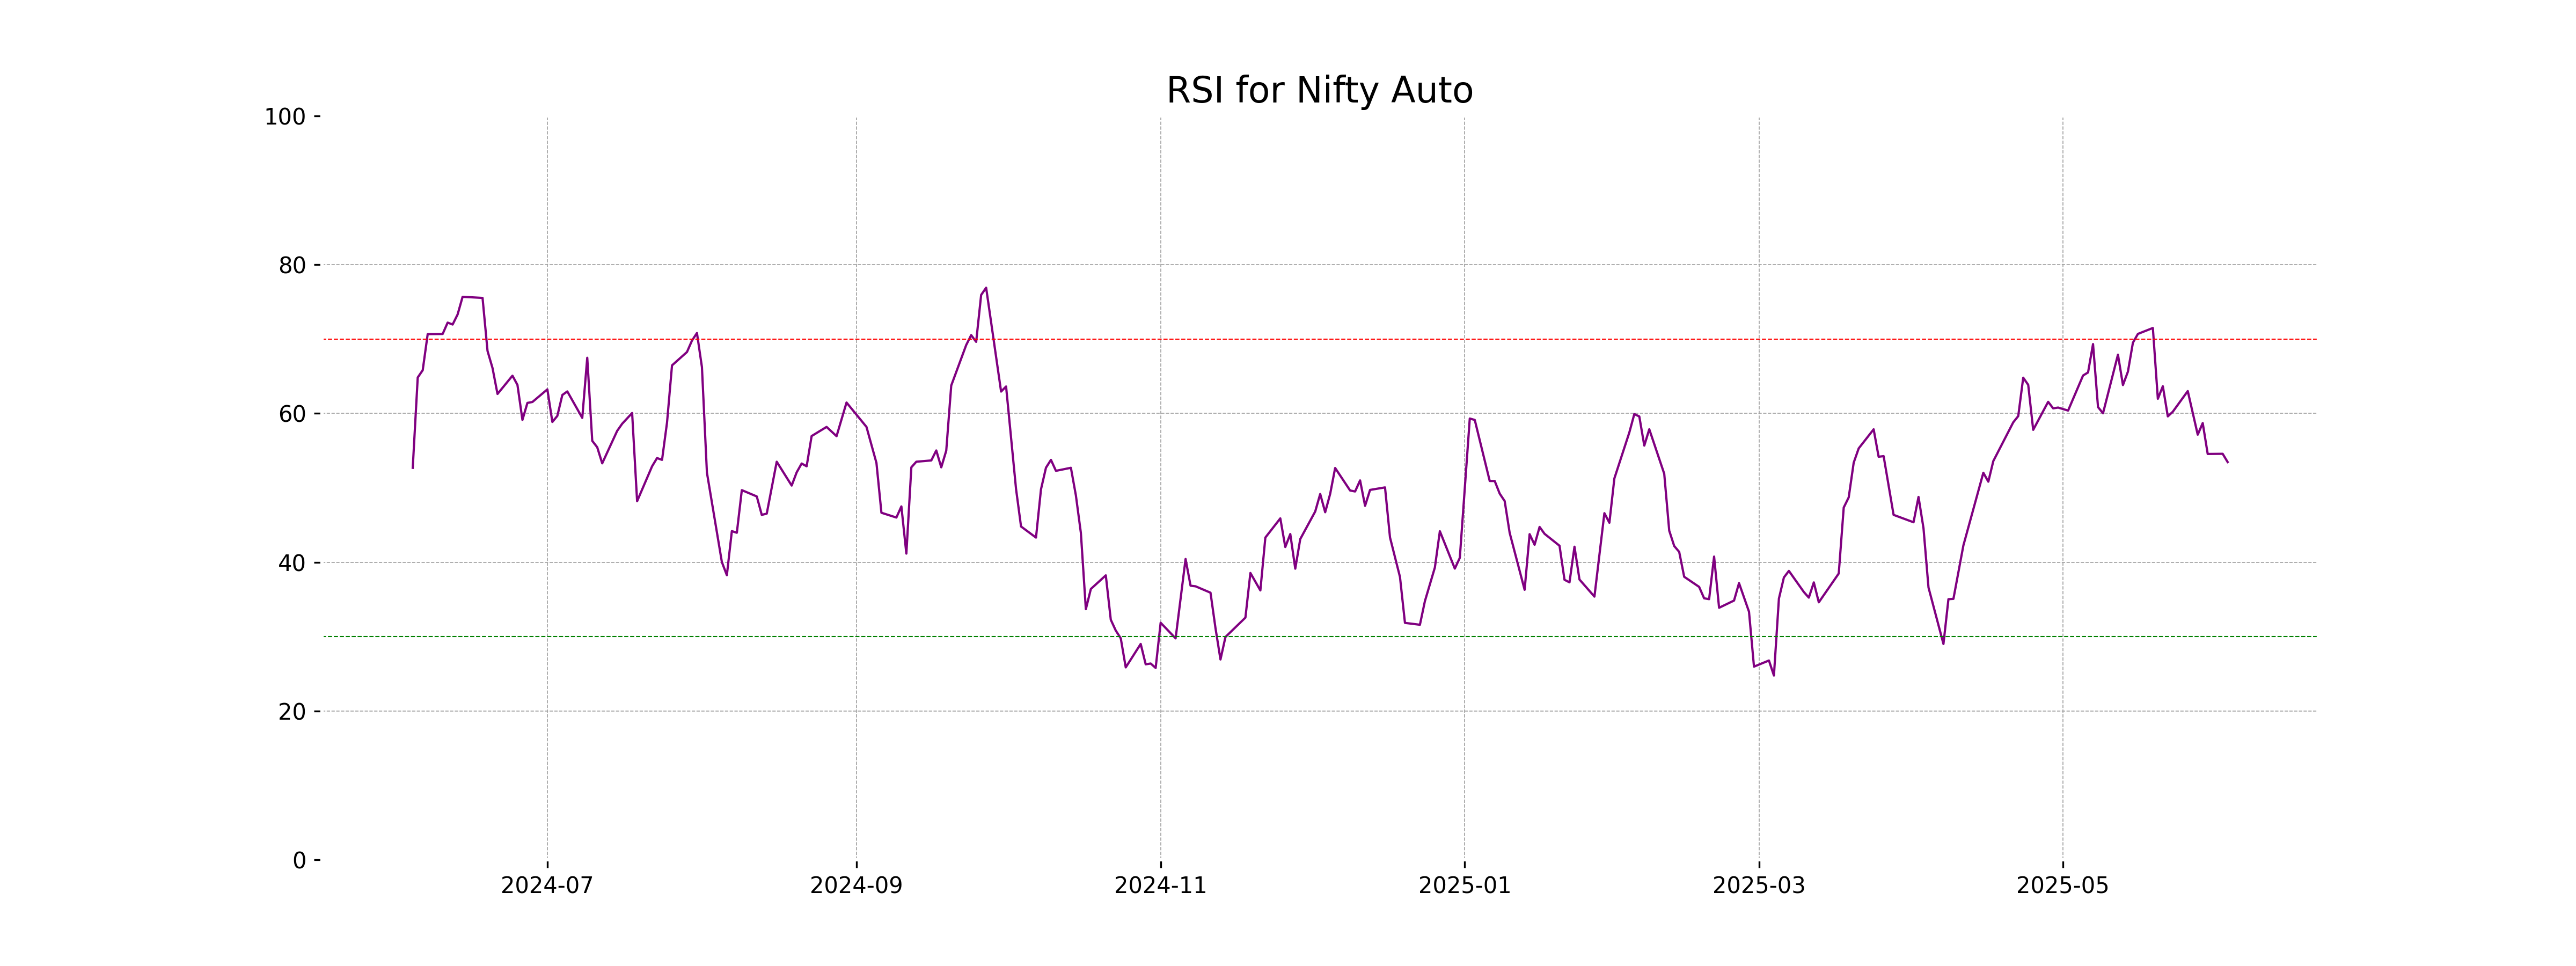
RSI Analysis
The Relative Strength Index (RSI) for Nifty Auto is 53.46, which suggests a neutral market momentum. An RSI value between 30 and 70 generally indicates that the stock is neither overbought nor oversold, implying balanced buying and selling pressures.
Analysis for Nifty Energy - June 03, 2025
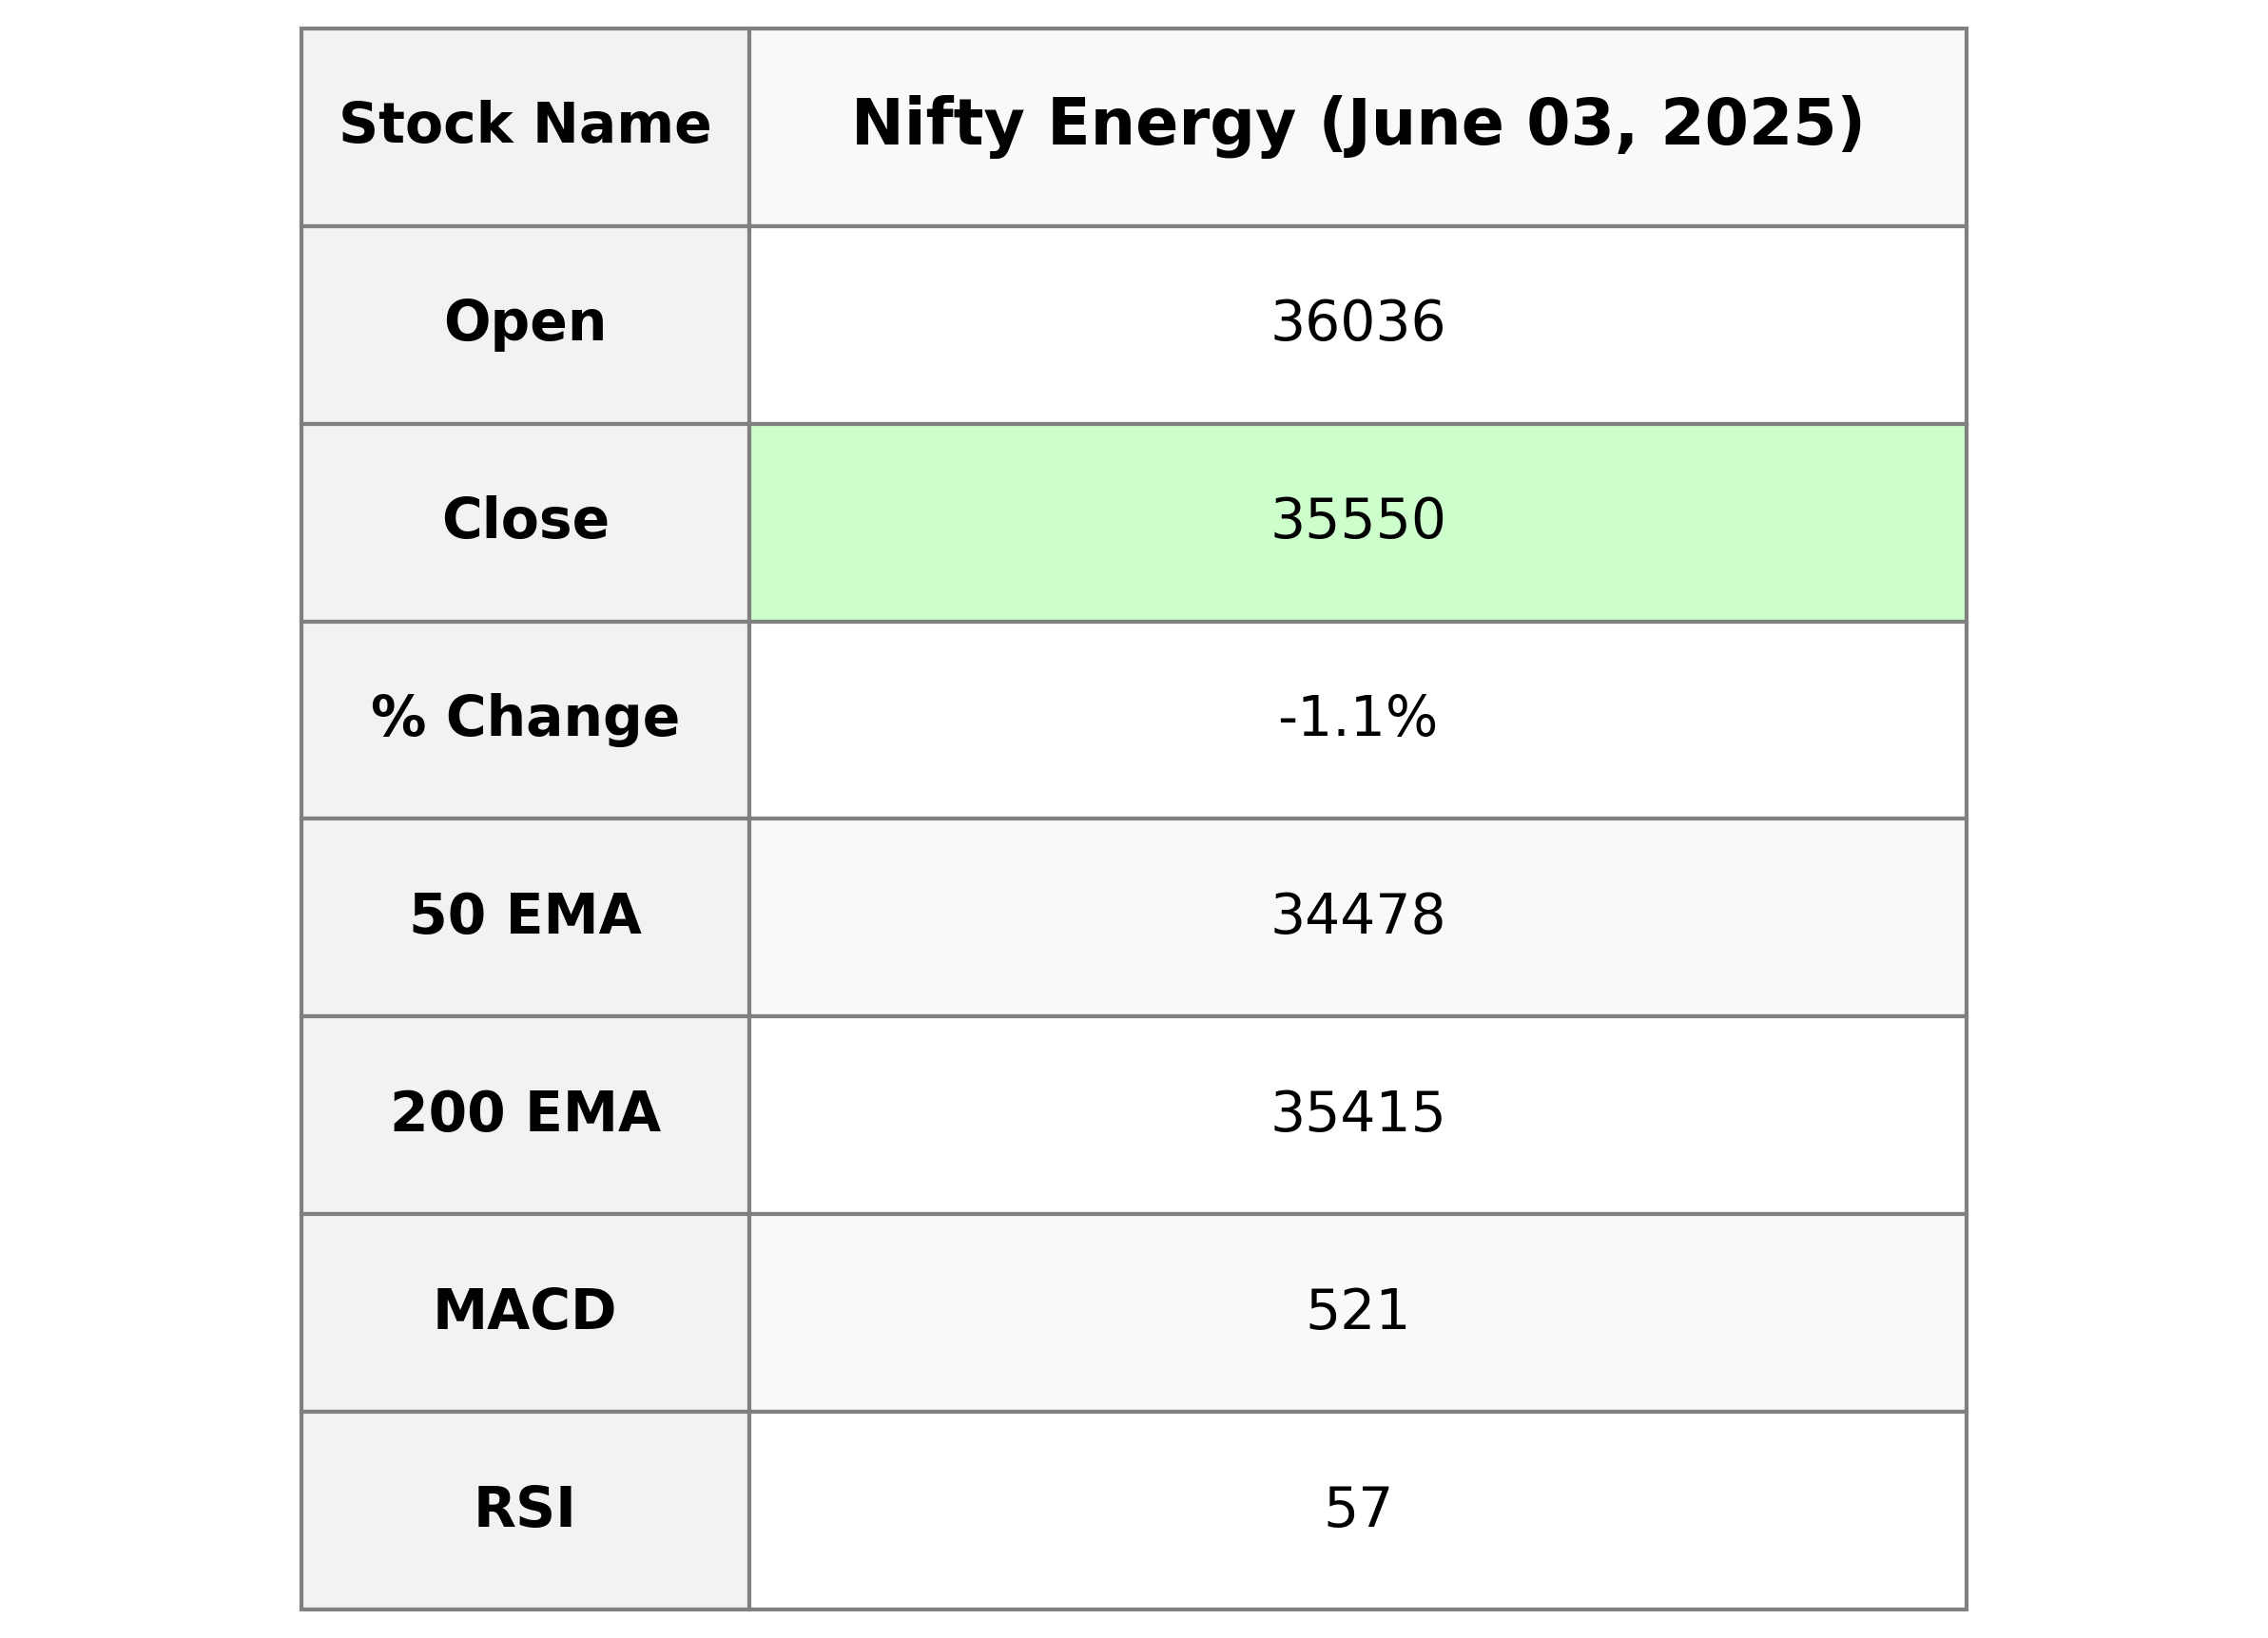
Nifty Energy opened at 36036.15 and closed at 35549.60, showing a decline compared to the previous close of 35933.80. The percentage change was -1.07%, with a points change of -384.20. The relative strength index (RSI) is at 56.85, indicating a relatively balanced momentum. The moving average convergence divergence (MACD) is positive at 521.22, though the signal line at 561.53 suggests a bearish crossover.
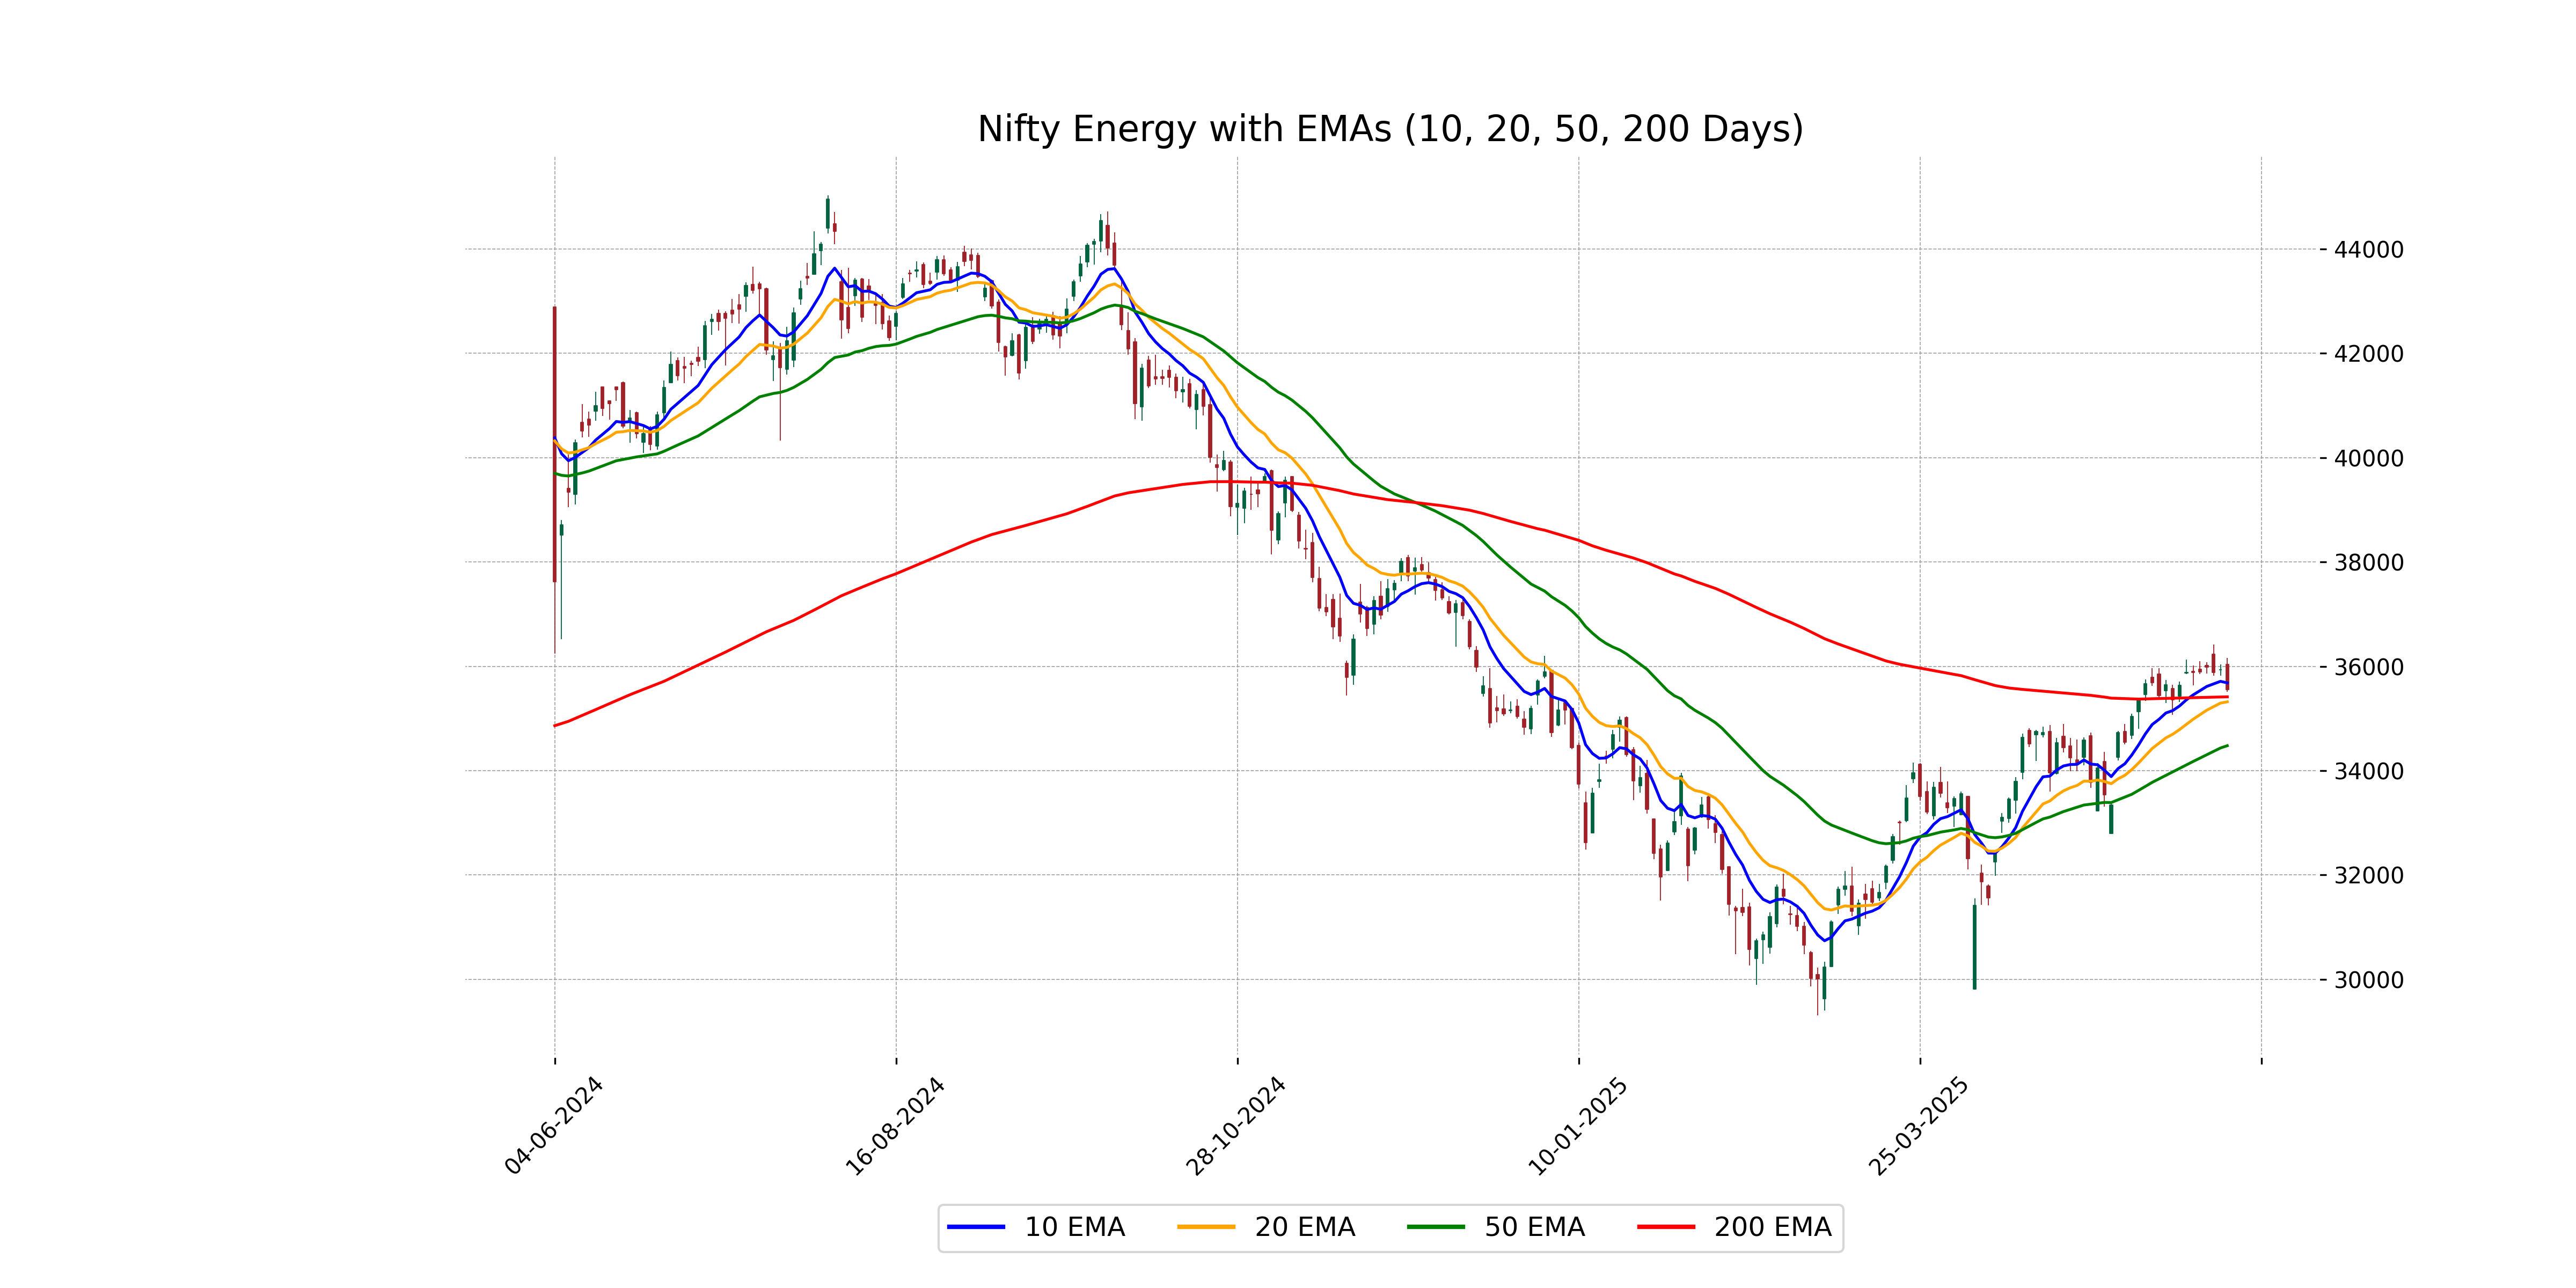
Relationship with Key Moving Averages
Nifty Energy closed at 35,549.60, below its 10 EMA of 35,682.25 but slightly above its 200 EMA of 35,415.02, indicating a short-term bearish sentiment compared to its recent average. The close is significantly higher than the 50 EMA of 34,477.86, suggesting a stronger longer-term trend.
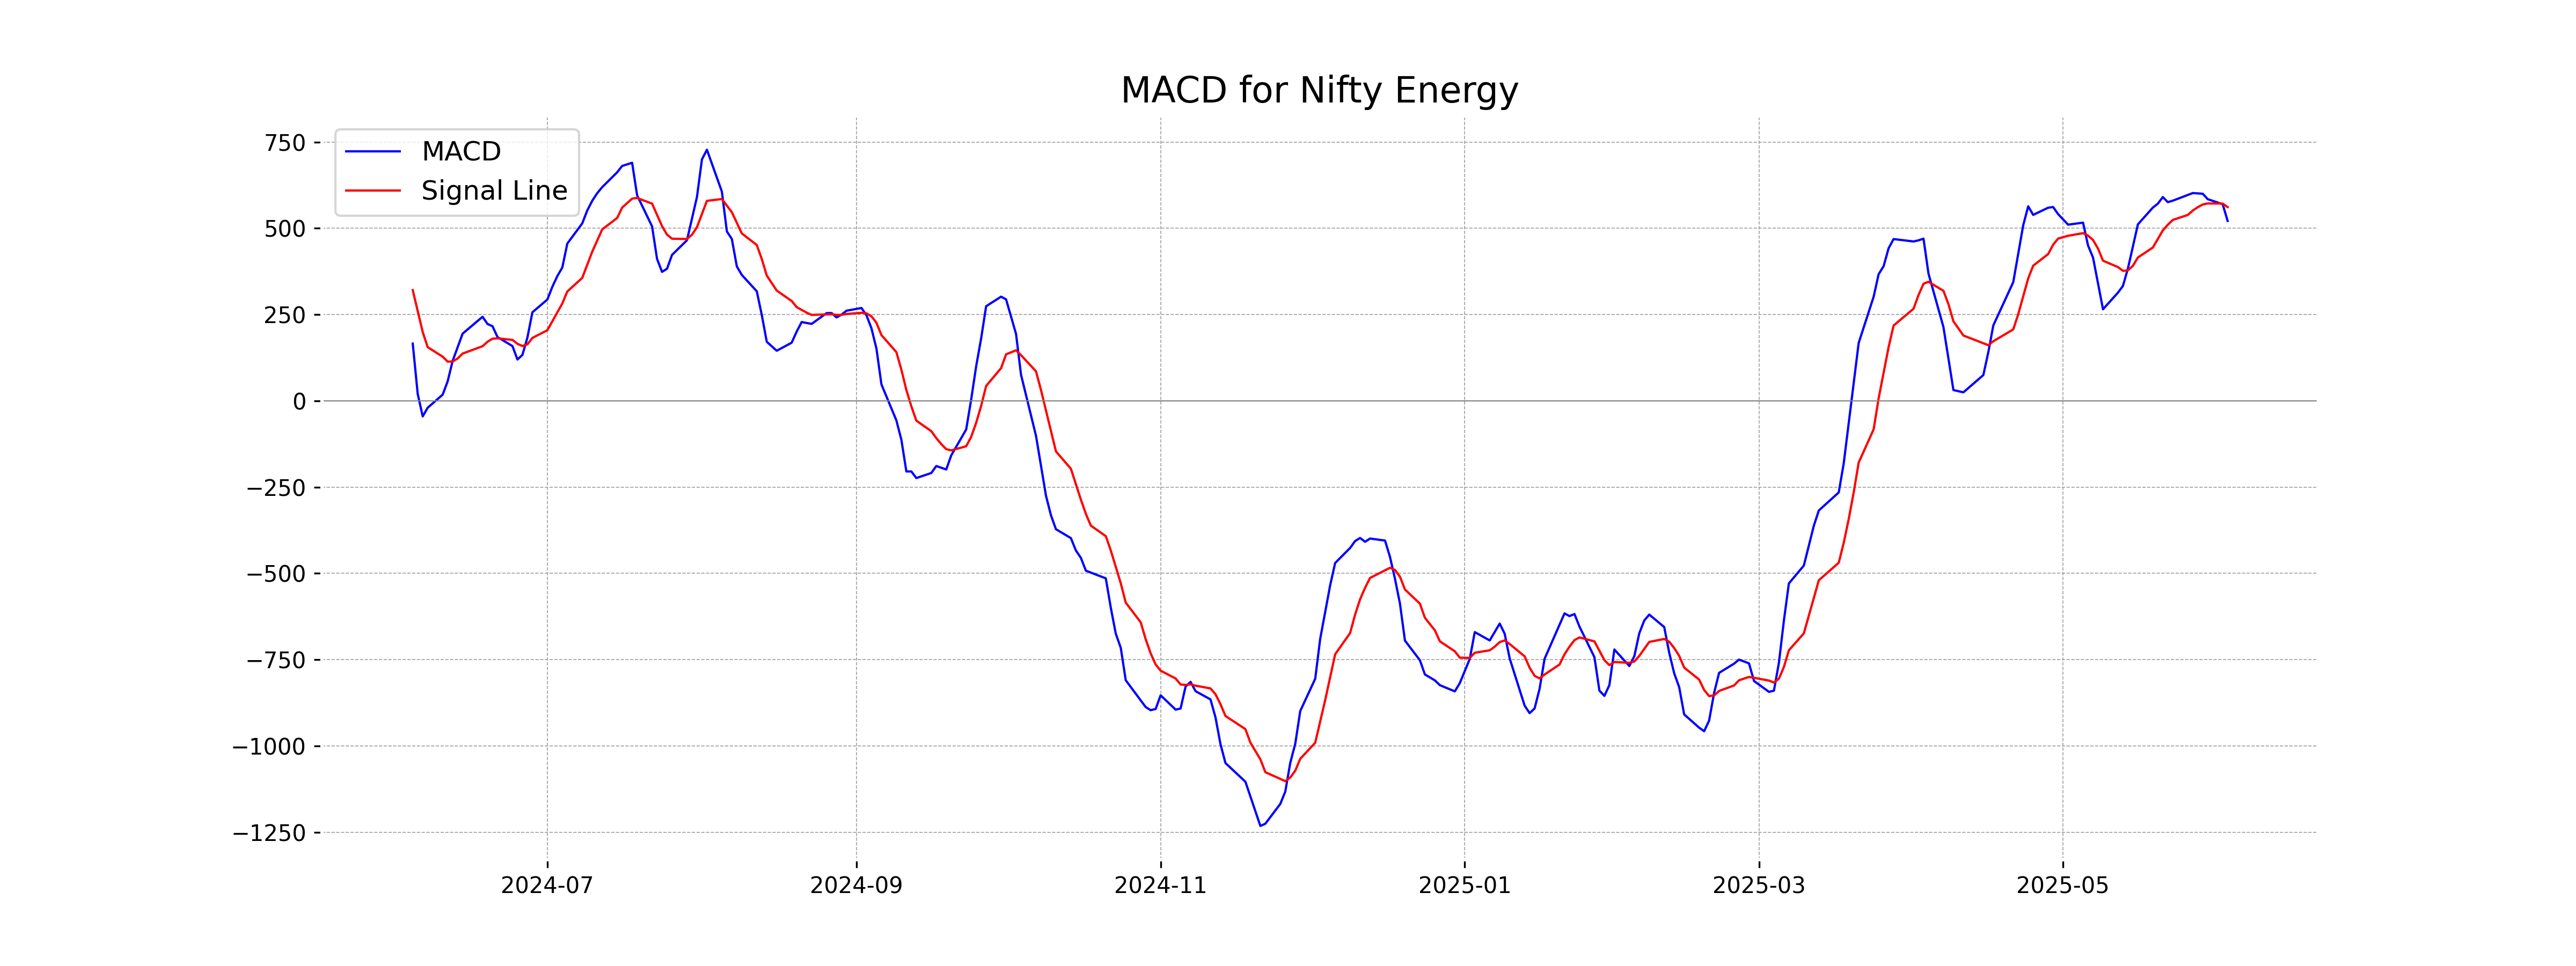
Moving Averages Trend (MACD)
Based on the MACD analysis for Nifty Energy, the MACD line is currently at 521.22, which is below the MACD Signal line at 561.53. This suggests a bearish momentum, indicating a potential for downward movement in the short term. The divergence points to weakening strength in the current price trend.
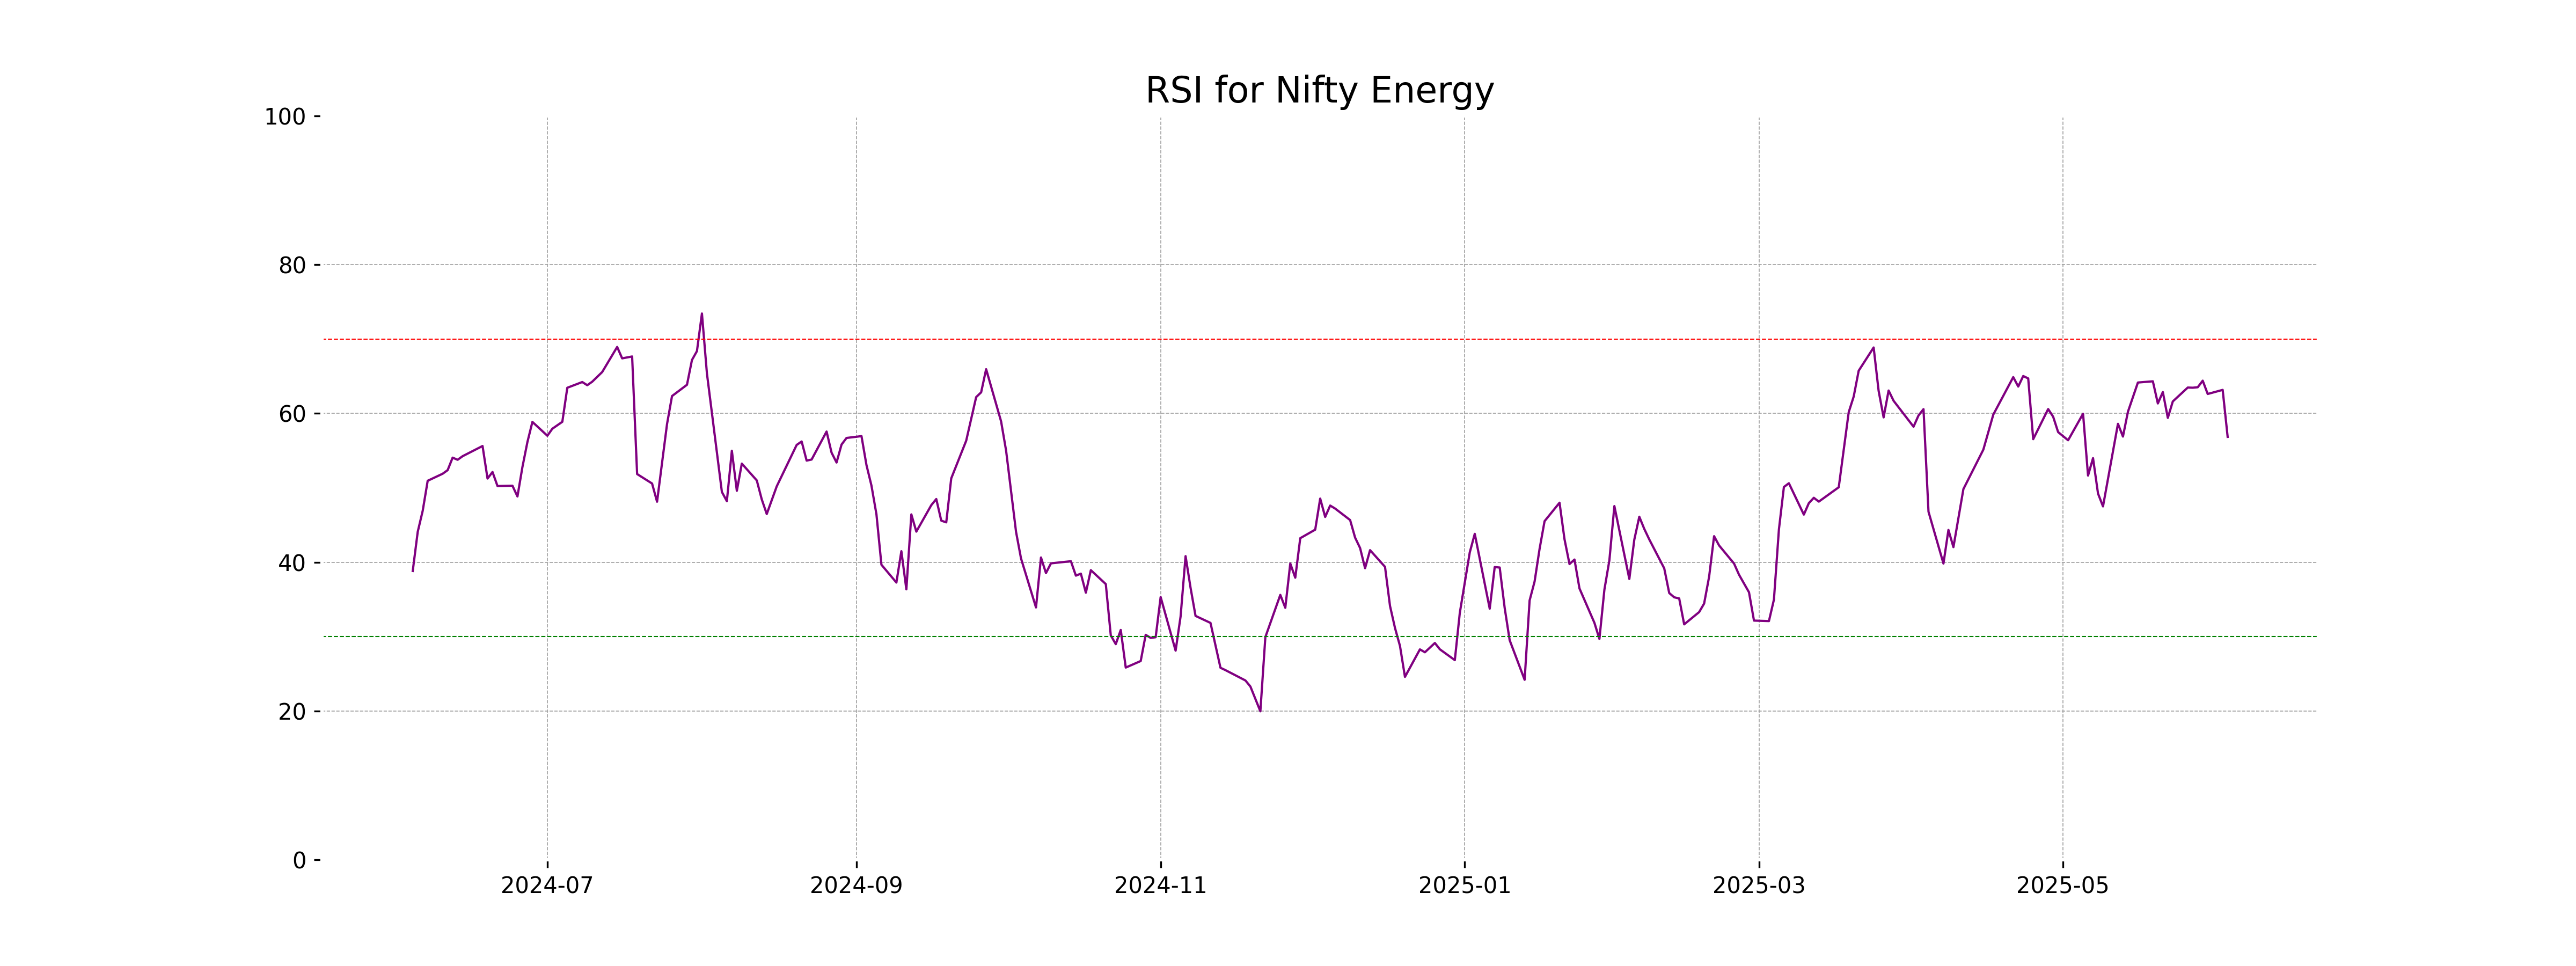
RSI Analysis
The RSI value for Nifty Energy is 56.85, which suggests that the stock is in a neutral zone and not currently overbought or oversold. It indicates a balanced trading scenario, where no strong momentum is observed towards either buying or selling.
Analysis for Nifty FMCG - June 03, 2025
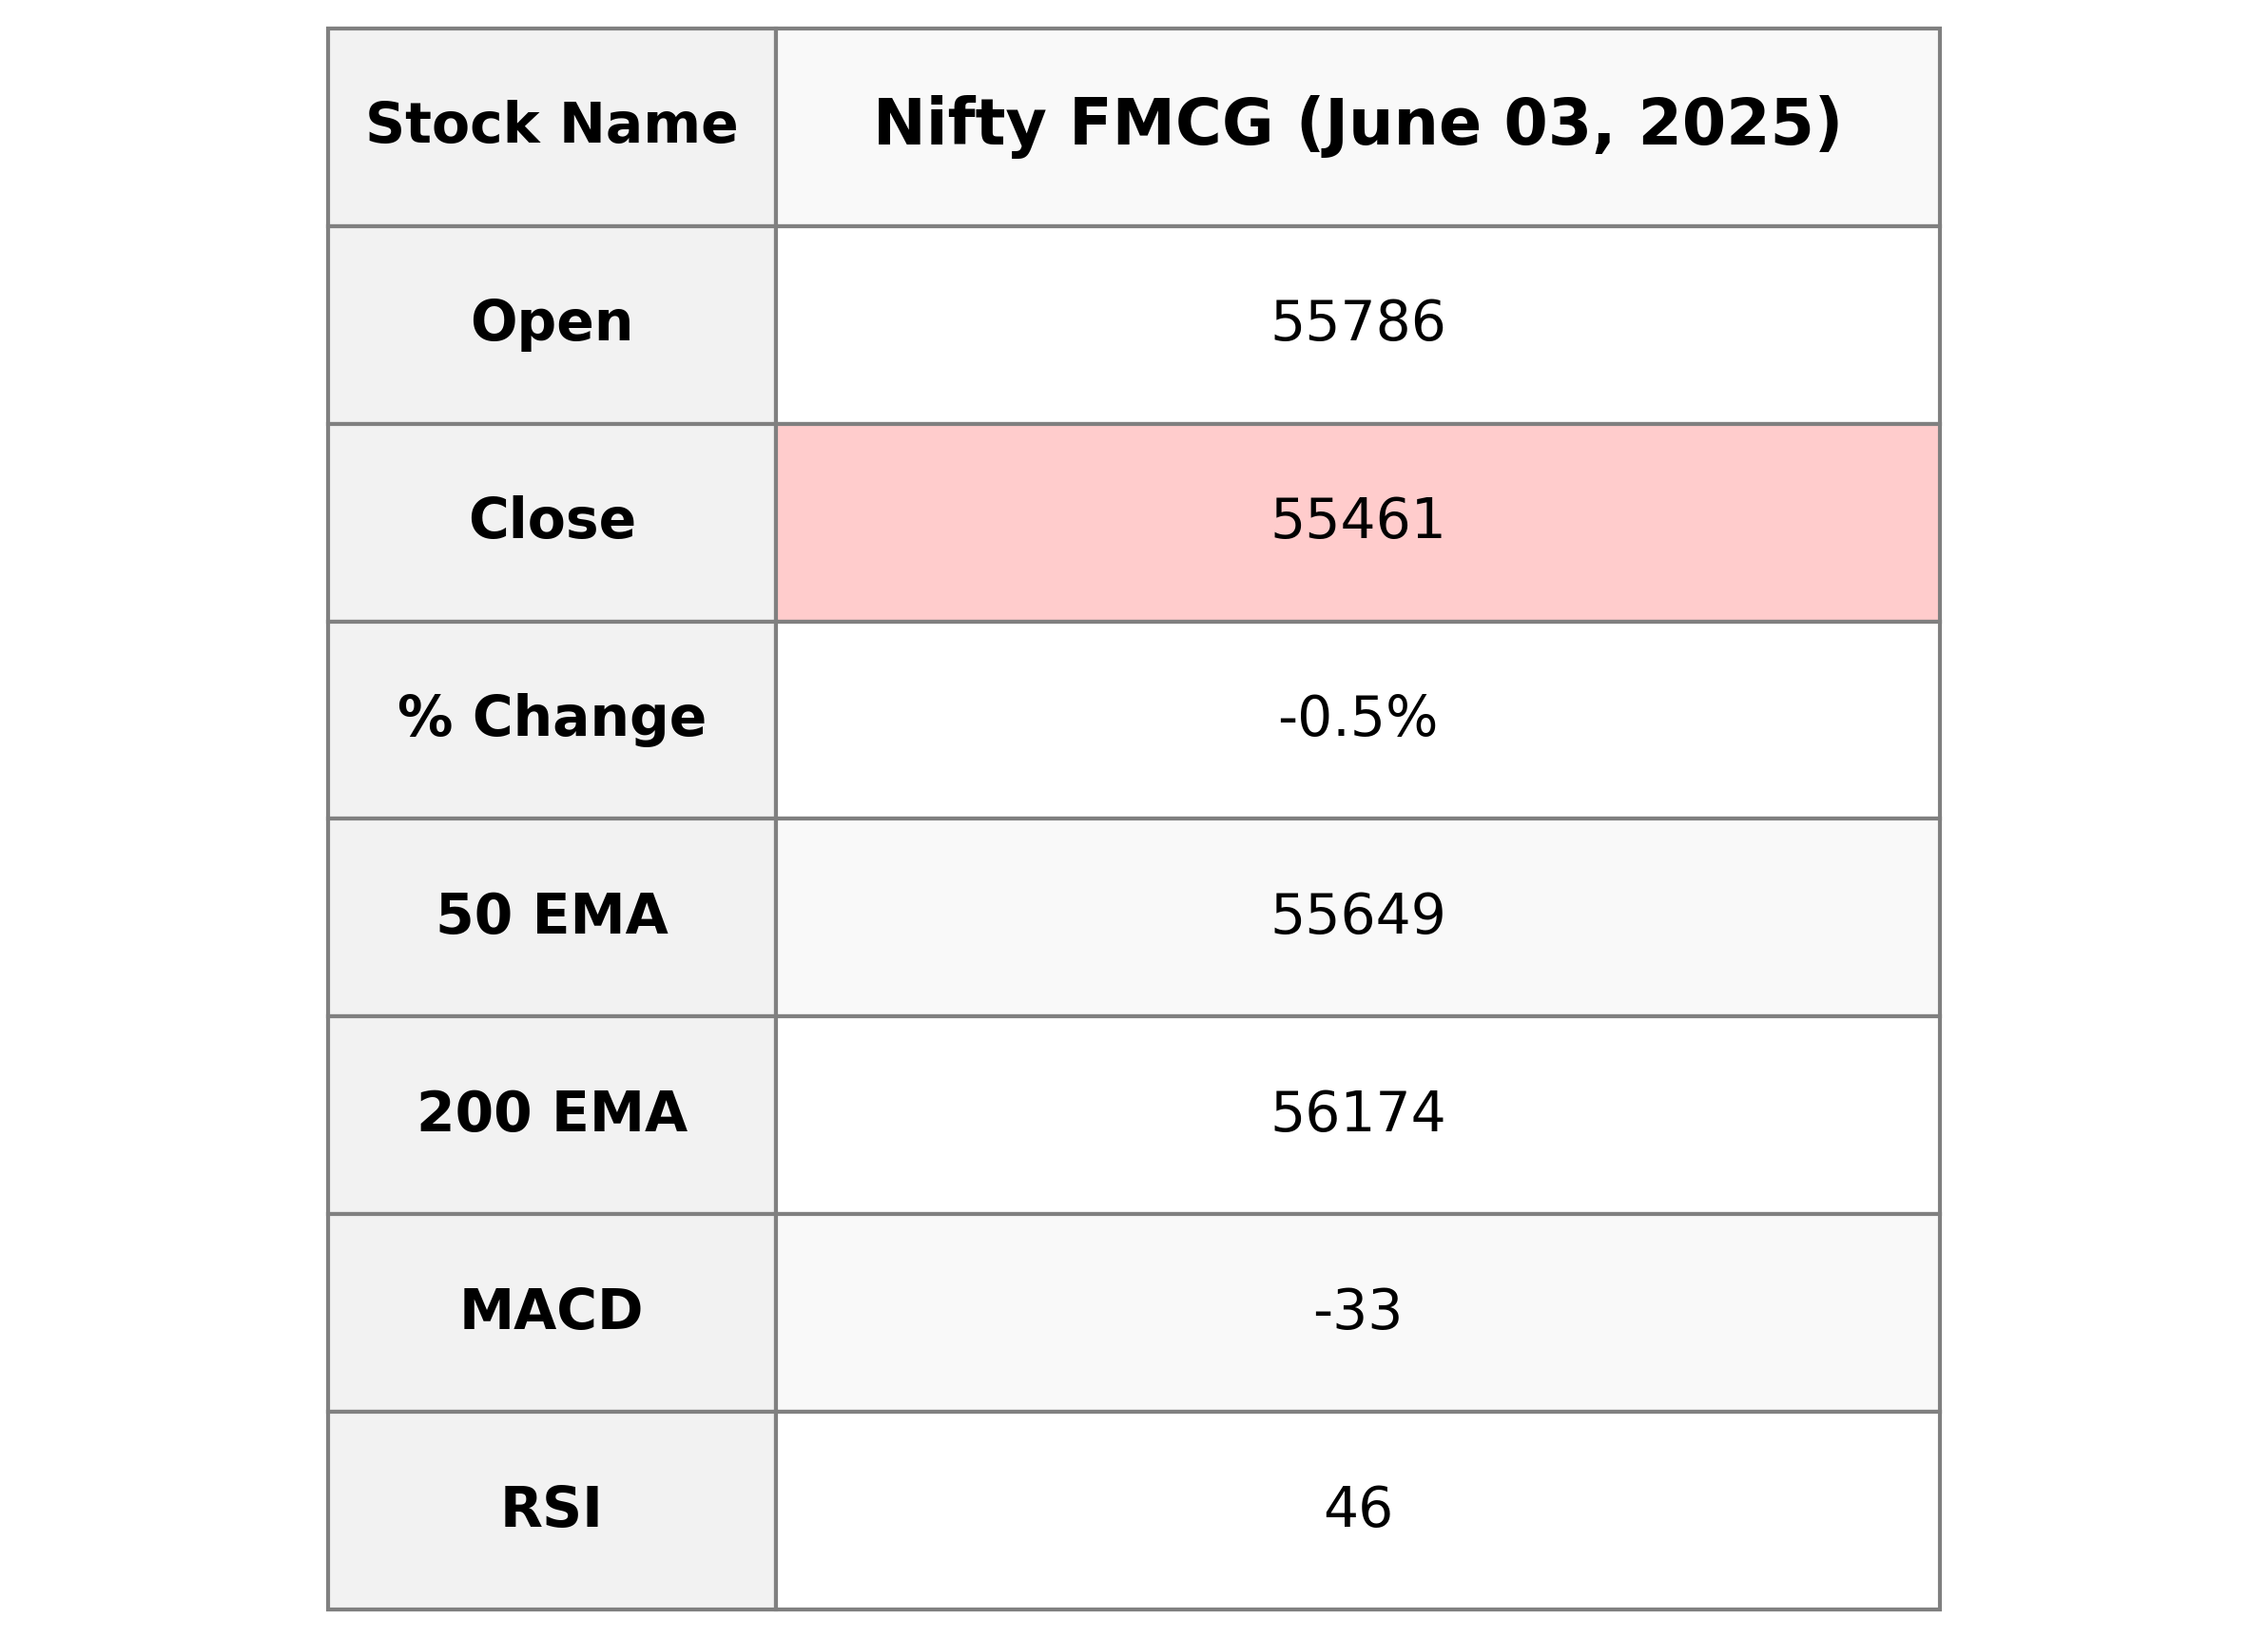
Nifty FMCG opened at 55,785.70 and closed at 55,460.80, showing a decline with a points change of -271.75. The percentage change was -0.49%, and the RSI indicates a slightly bearish trend at 45.57. The MACD is negative at -32.75, suggesting downward momentum.
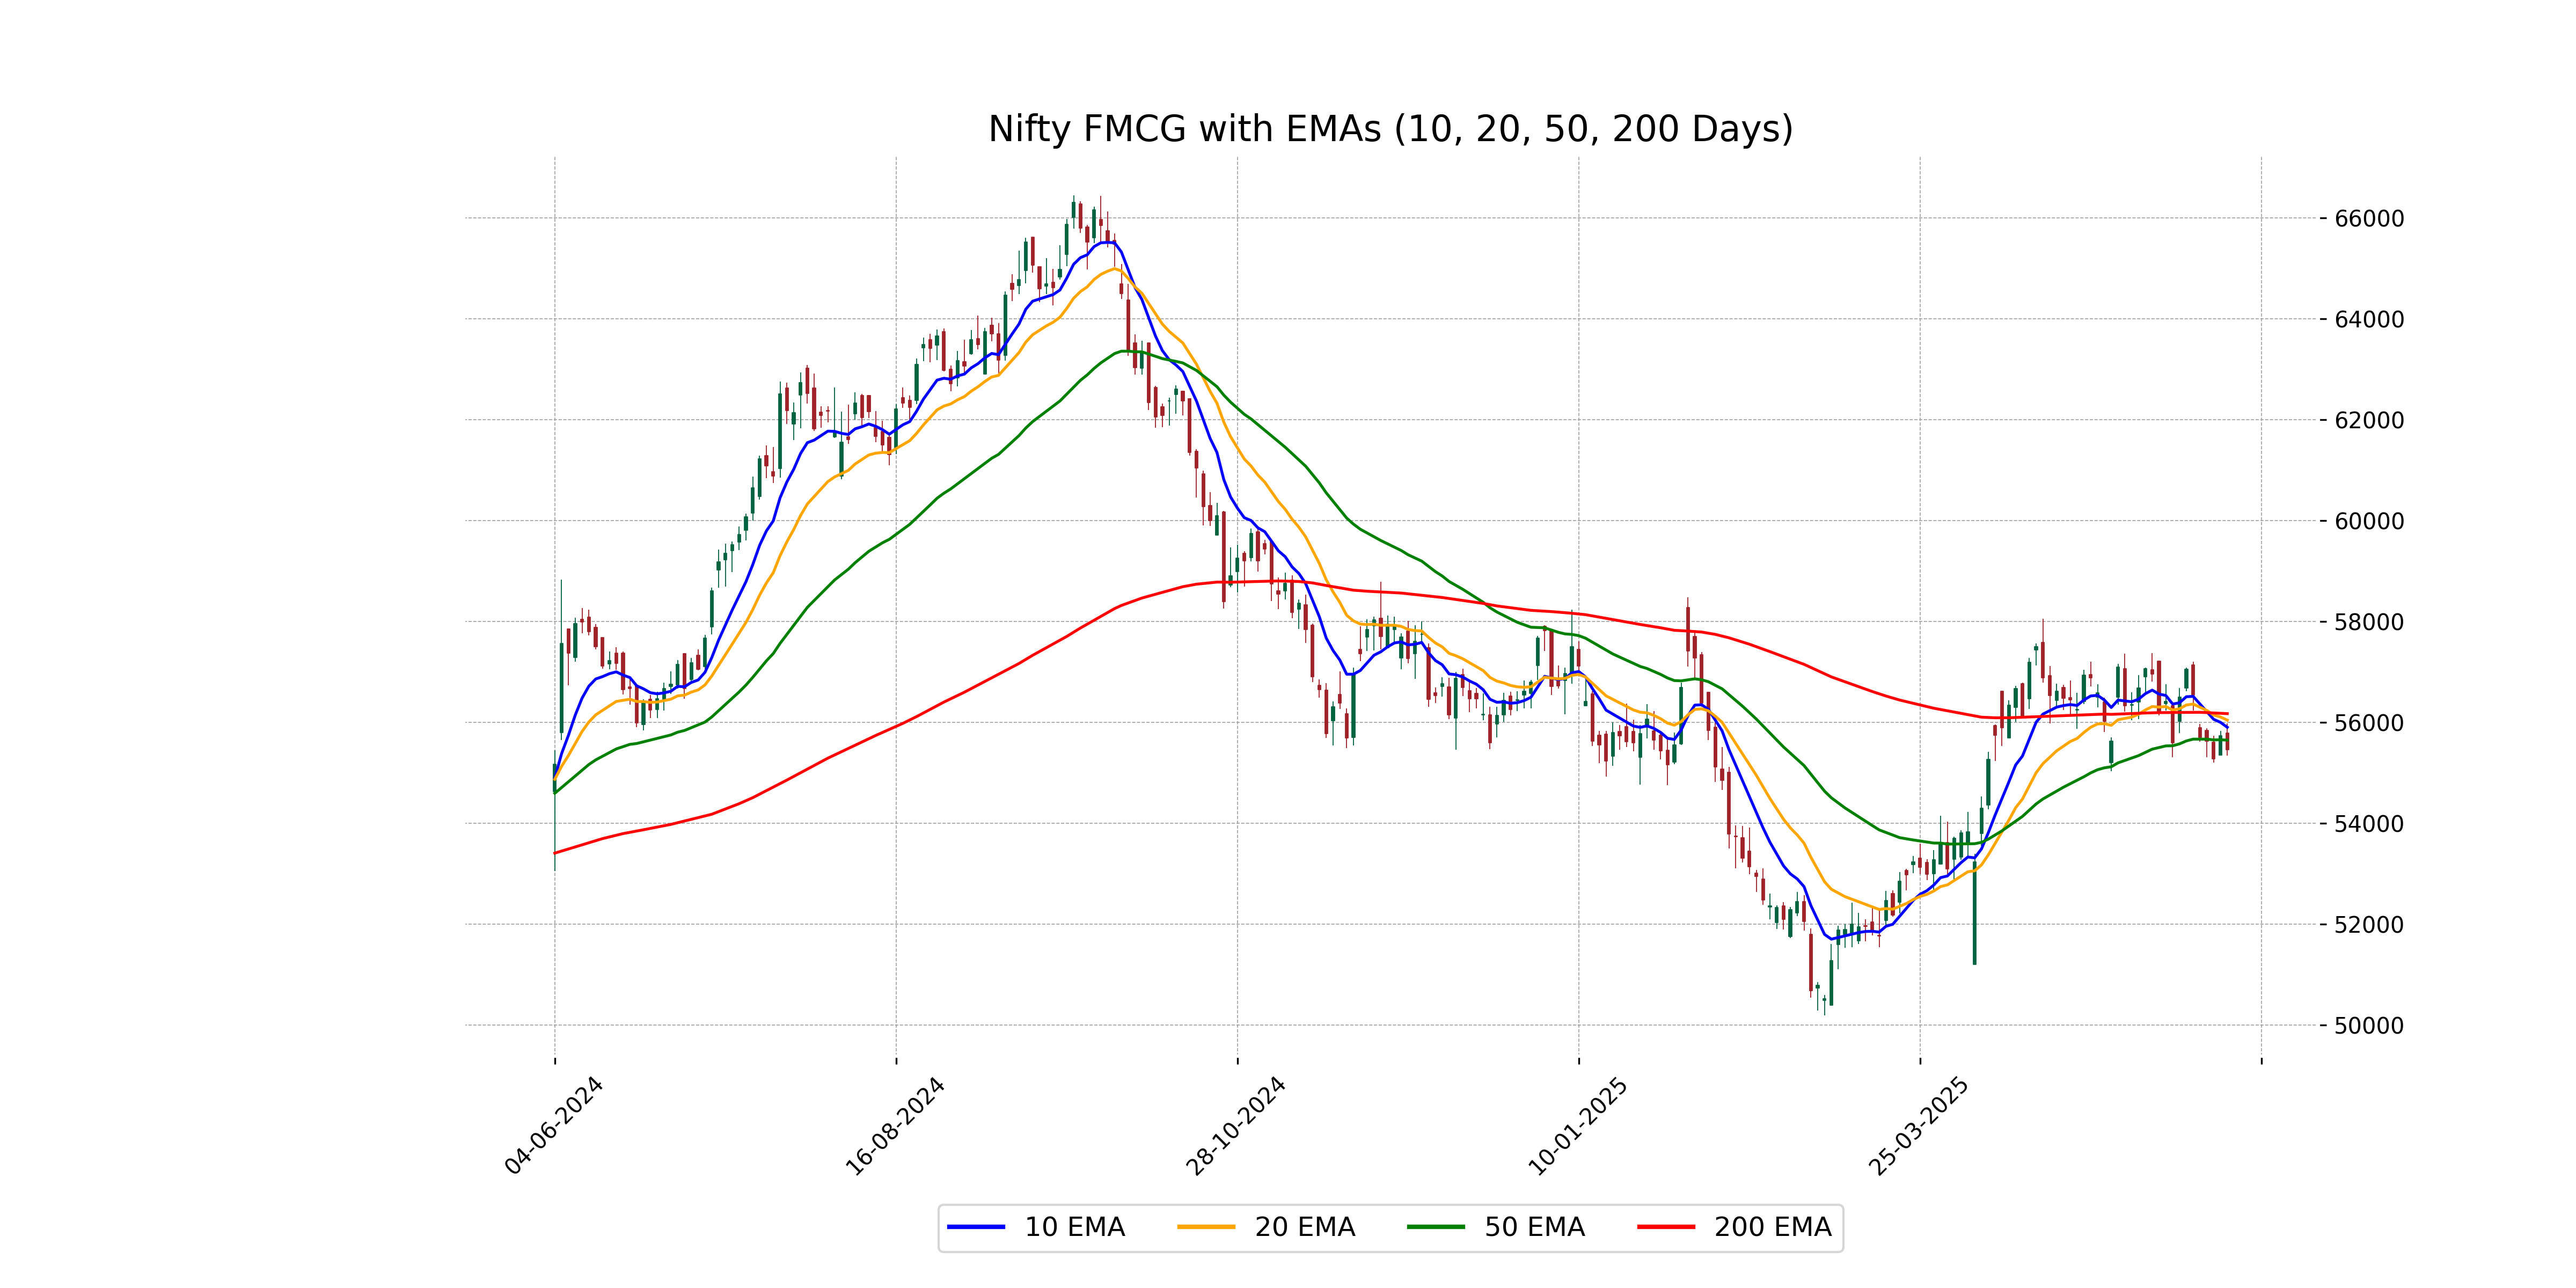
Relationship with Key Moving Averages
The Nifty FMCG index closed below both its 50-day EMA (55648.77) and 200-day EMA (56173.94), indicating a bearish trend in the near term. The index also closed below its 10-day EMA (55903.19) and 20-day EMA (56045.36), further suggesting downward momentum.
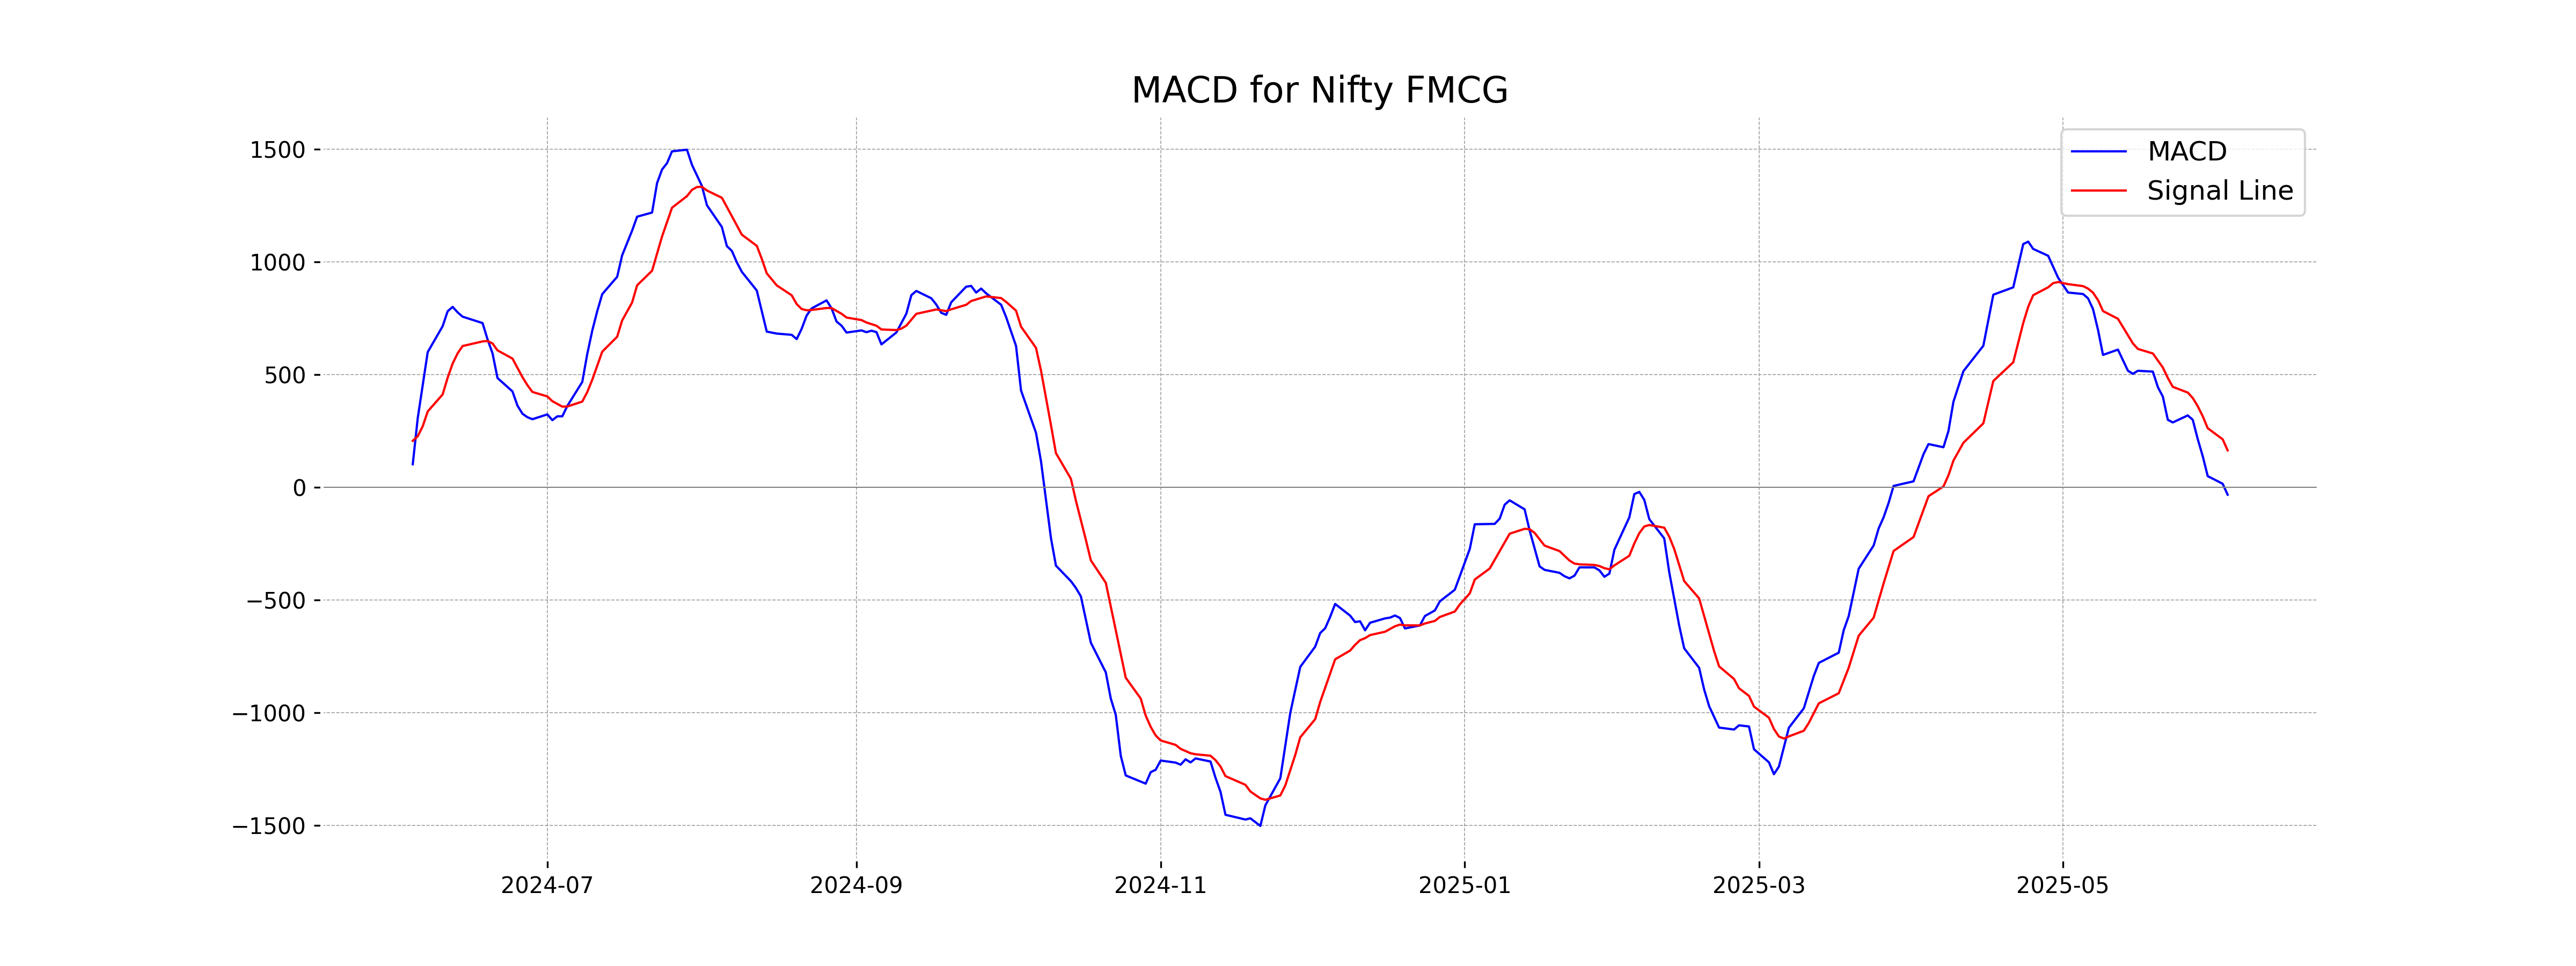
Moving Averages Trend (MACD)
The MACD for Nifty FMCG is currently at -32.75, indicating a bearish momentum as it is below the signal line at 163.78. This suggests that the recent trend is more likely to be downward.
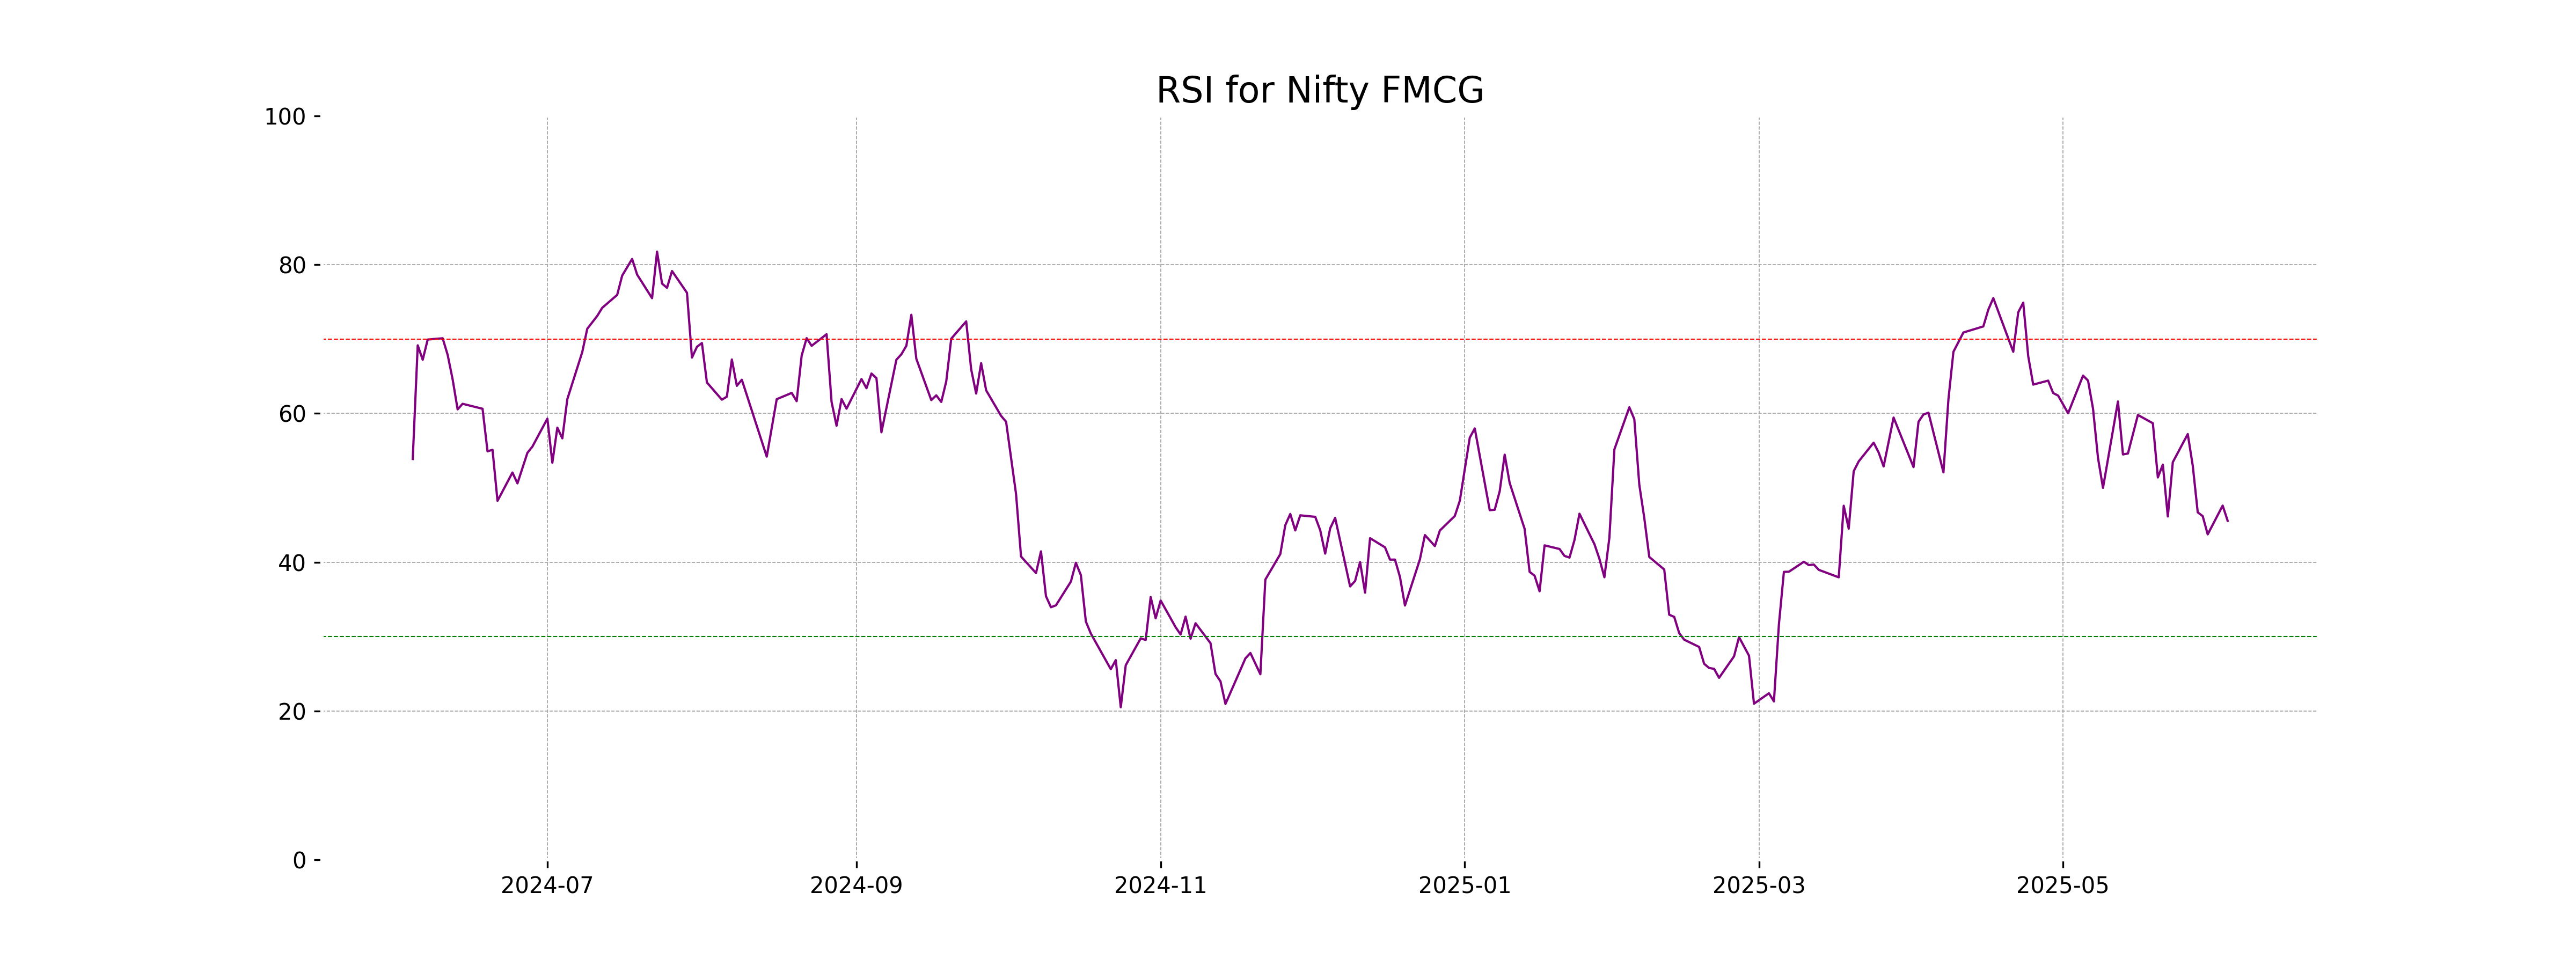
RSI Analysis
Based on the data provided, the Relative Strength Index (RSI) for Nifty FMCG is at 45.57, which suggests that the stock is currently in a neutral zone and neither overbought nor oversold. An RSI value below 30 typically indicates that a stock may be undervalued, while a value above 70 may indicate it is overvalued.
Analysis for Nifty Infra - June 03, 2025
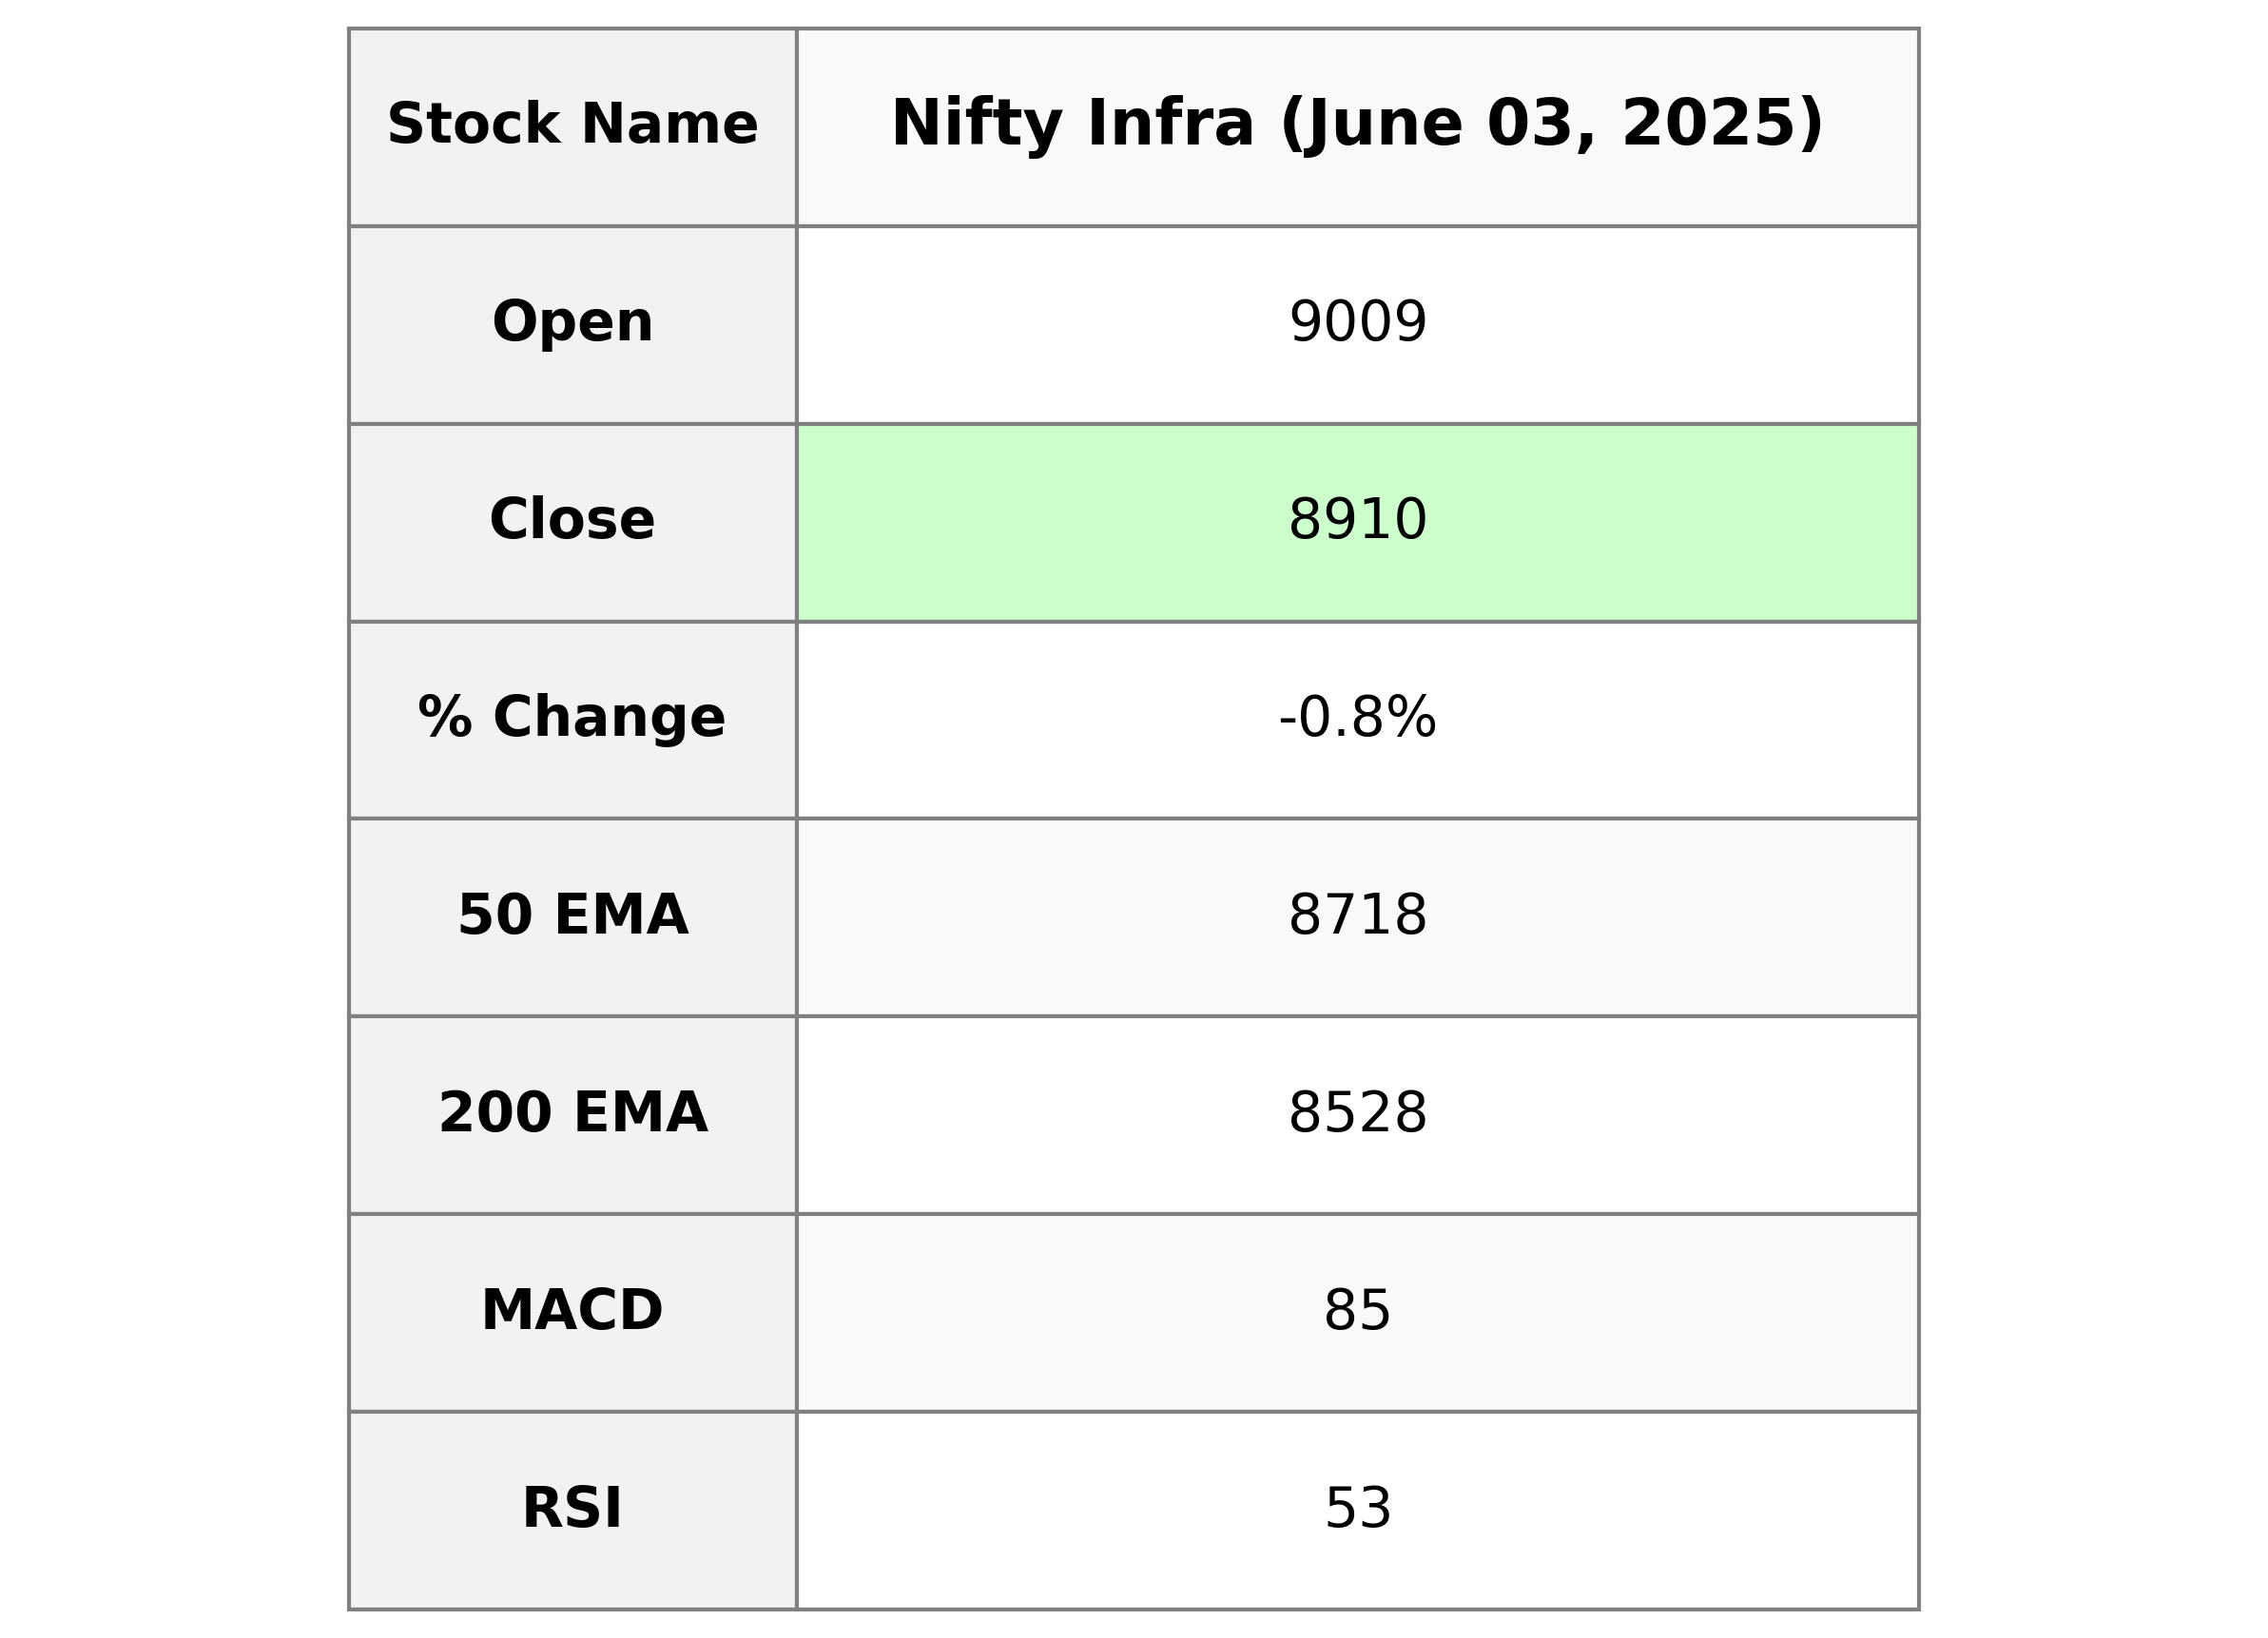
Nifty Infra Performance: The Nifty Infra index opened at 9008.90 and closed at 8910.25, showing a decrease of 0.79% from the previous close of 8981.15, with a points change of -70.90. The relative strength index (RSI) of 52.67 indicates a neutral momentum, while the MACD is below its signal, suggesting a weakening trend.
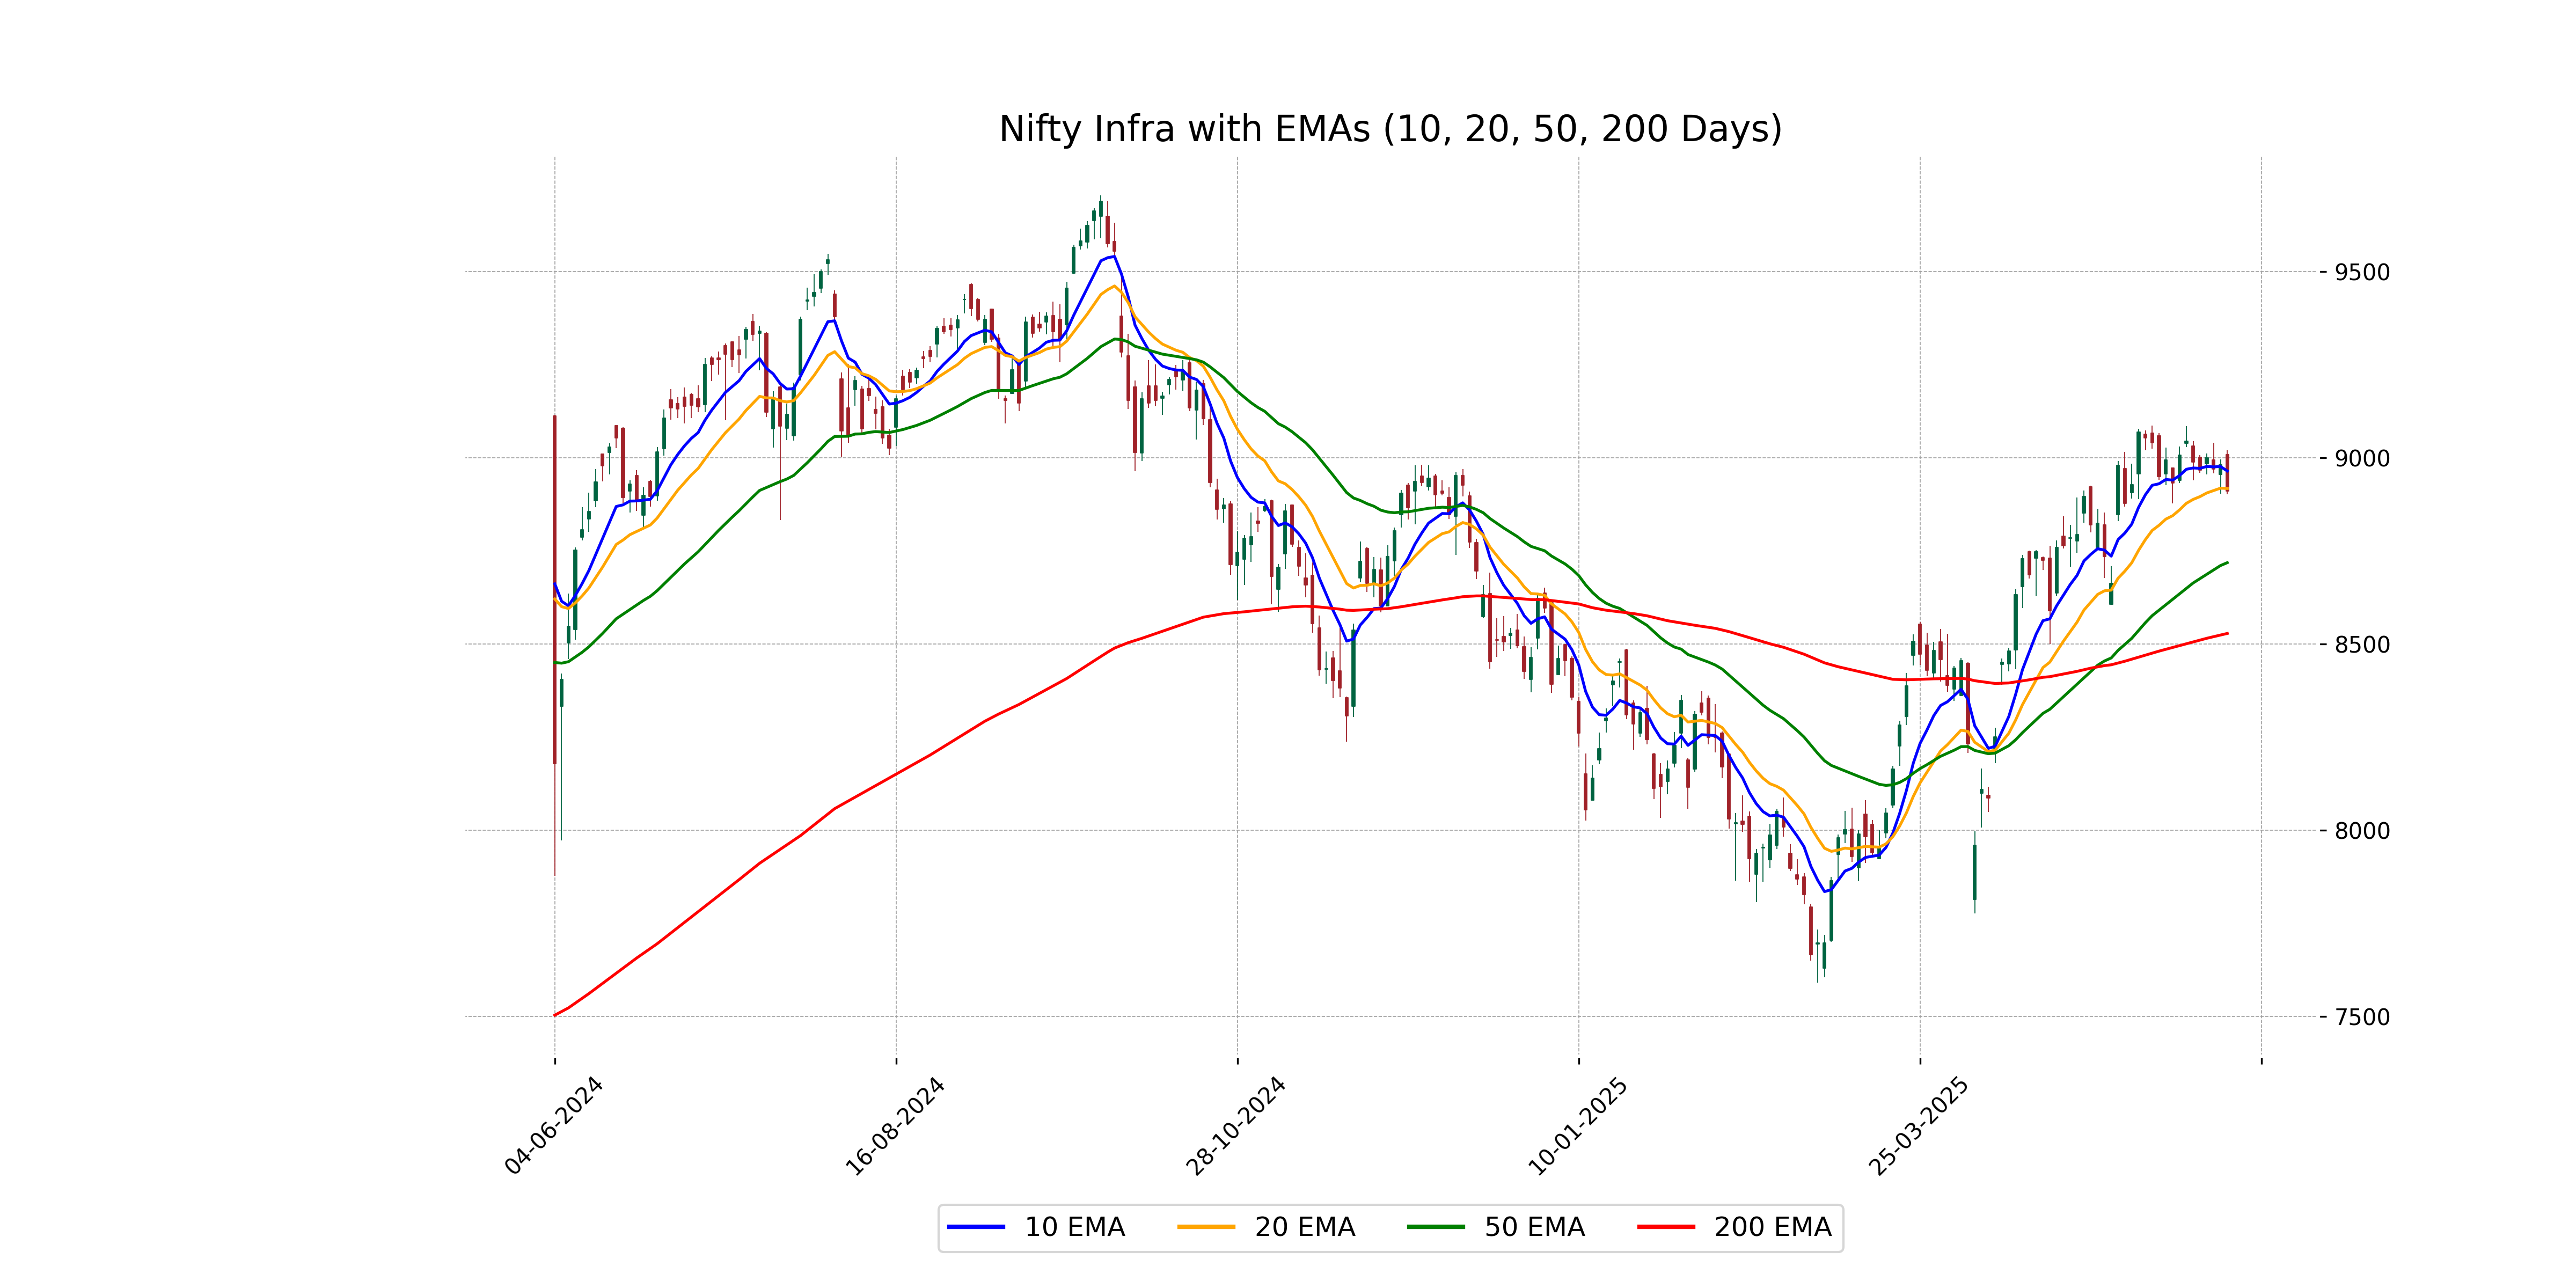
Relationship with Key Moving Averages
The closing price of Nifty Infra is 8910.25, which is slightly below the 10-day EMA of 8964.44 and very close to the 20-day EMA of 8917.53, indicating short-term weakness. The price remains above both the 50-day and 200-day EMAs, suggesting an ongoing long-term uptrend.
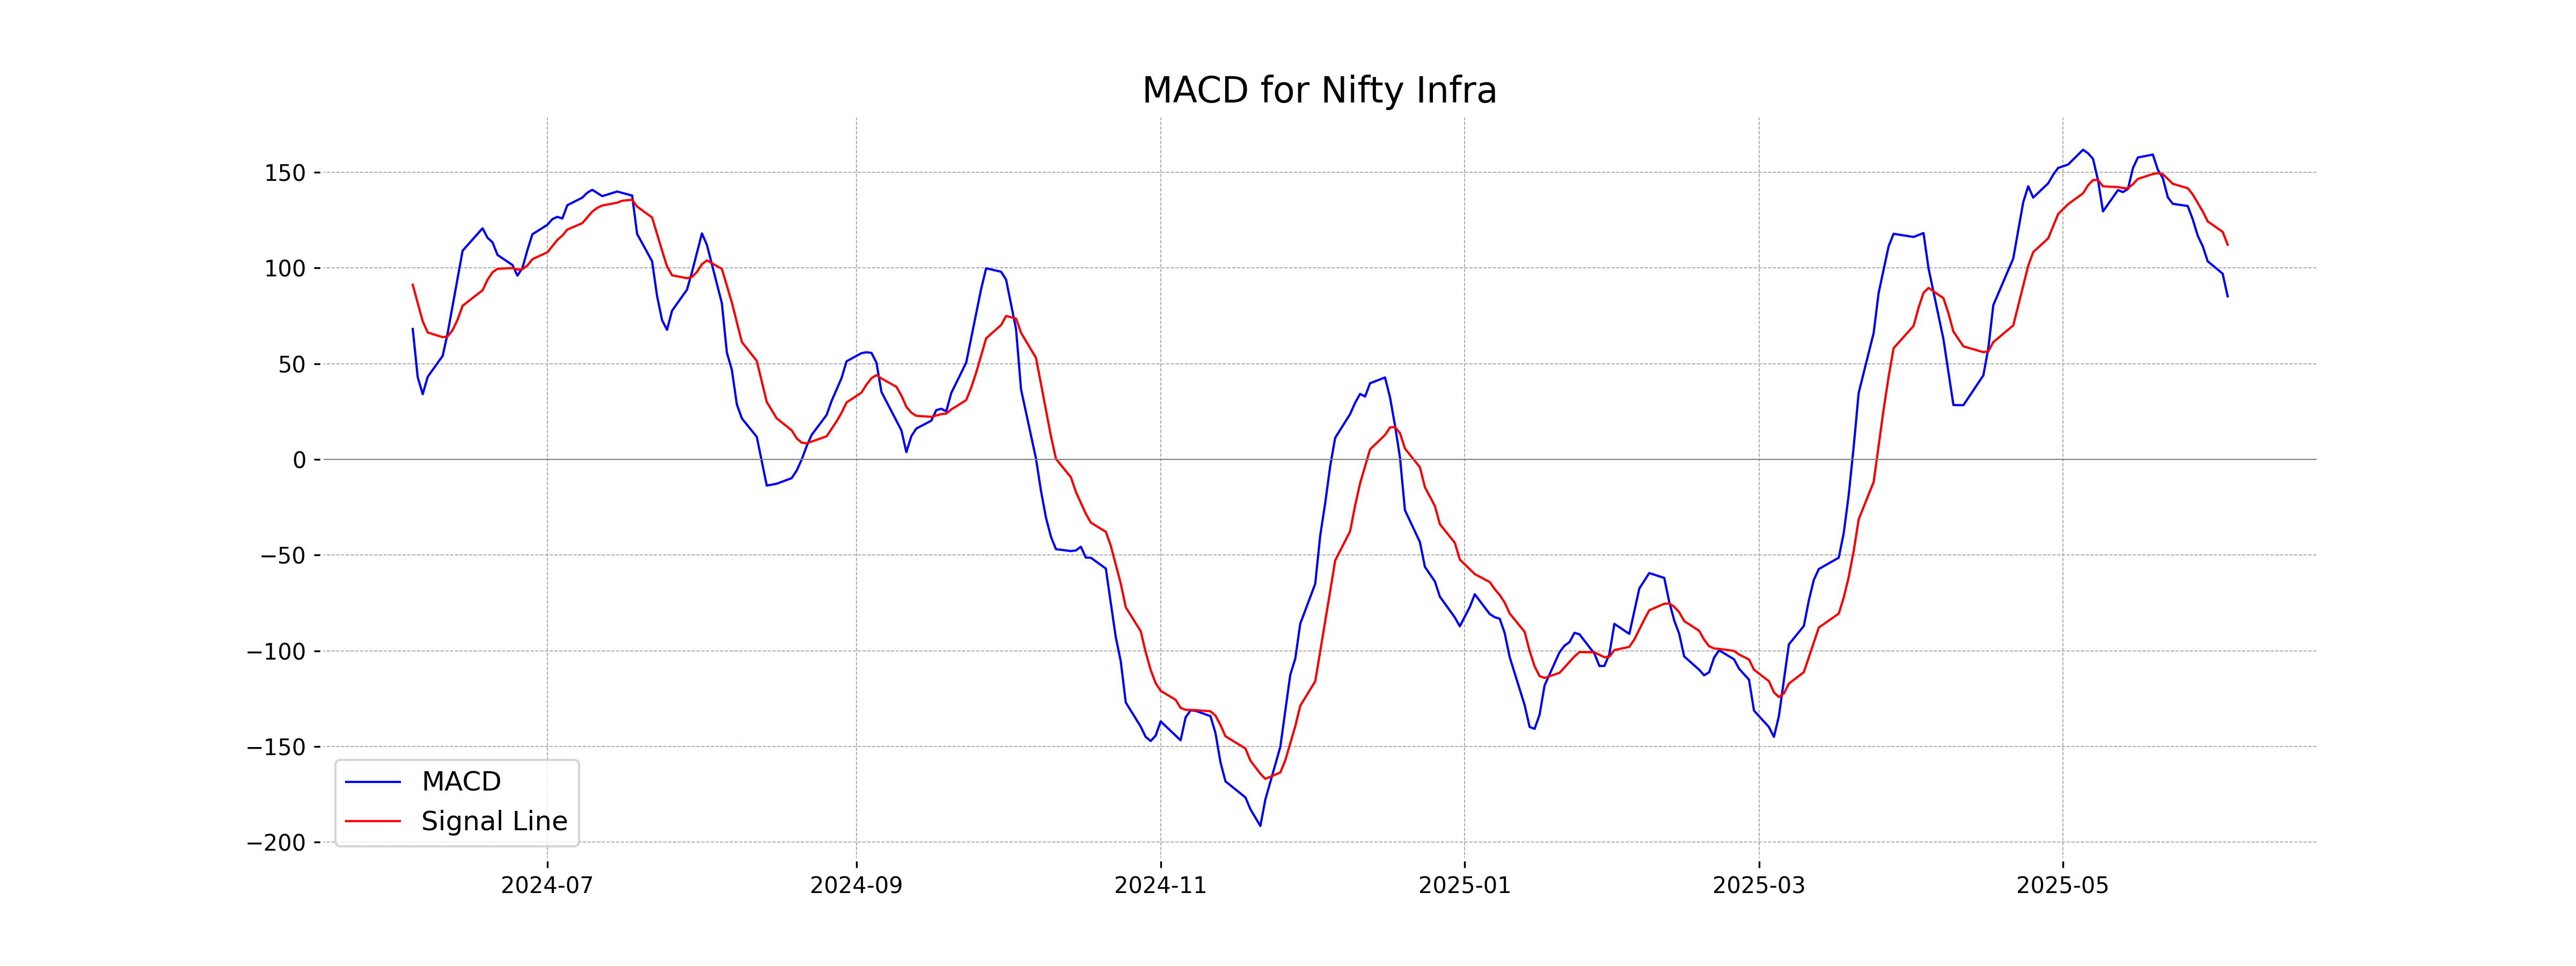
Moving Averages Trend (MACD)
The MACD for Nifty Infra is 85.16, which is below the MACD Signal of 112.11, indicating a bearish trend. Since the MACD is below the signal line, it suggests that the recent momentum is bearish and may continue in that direction unless the trend changes.
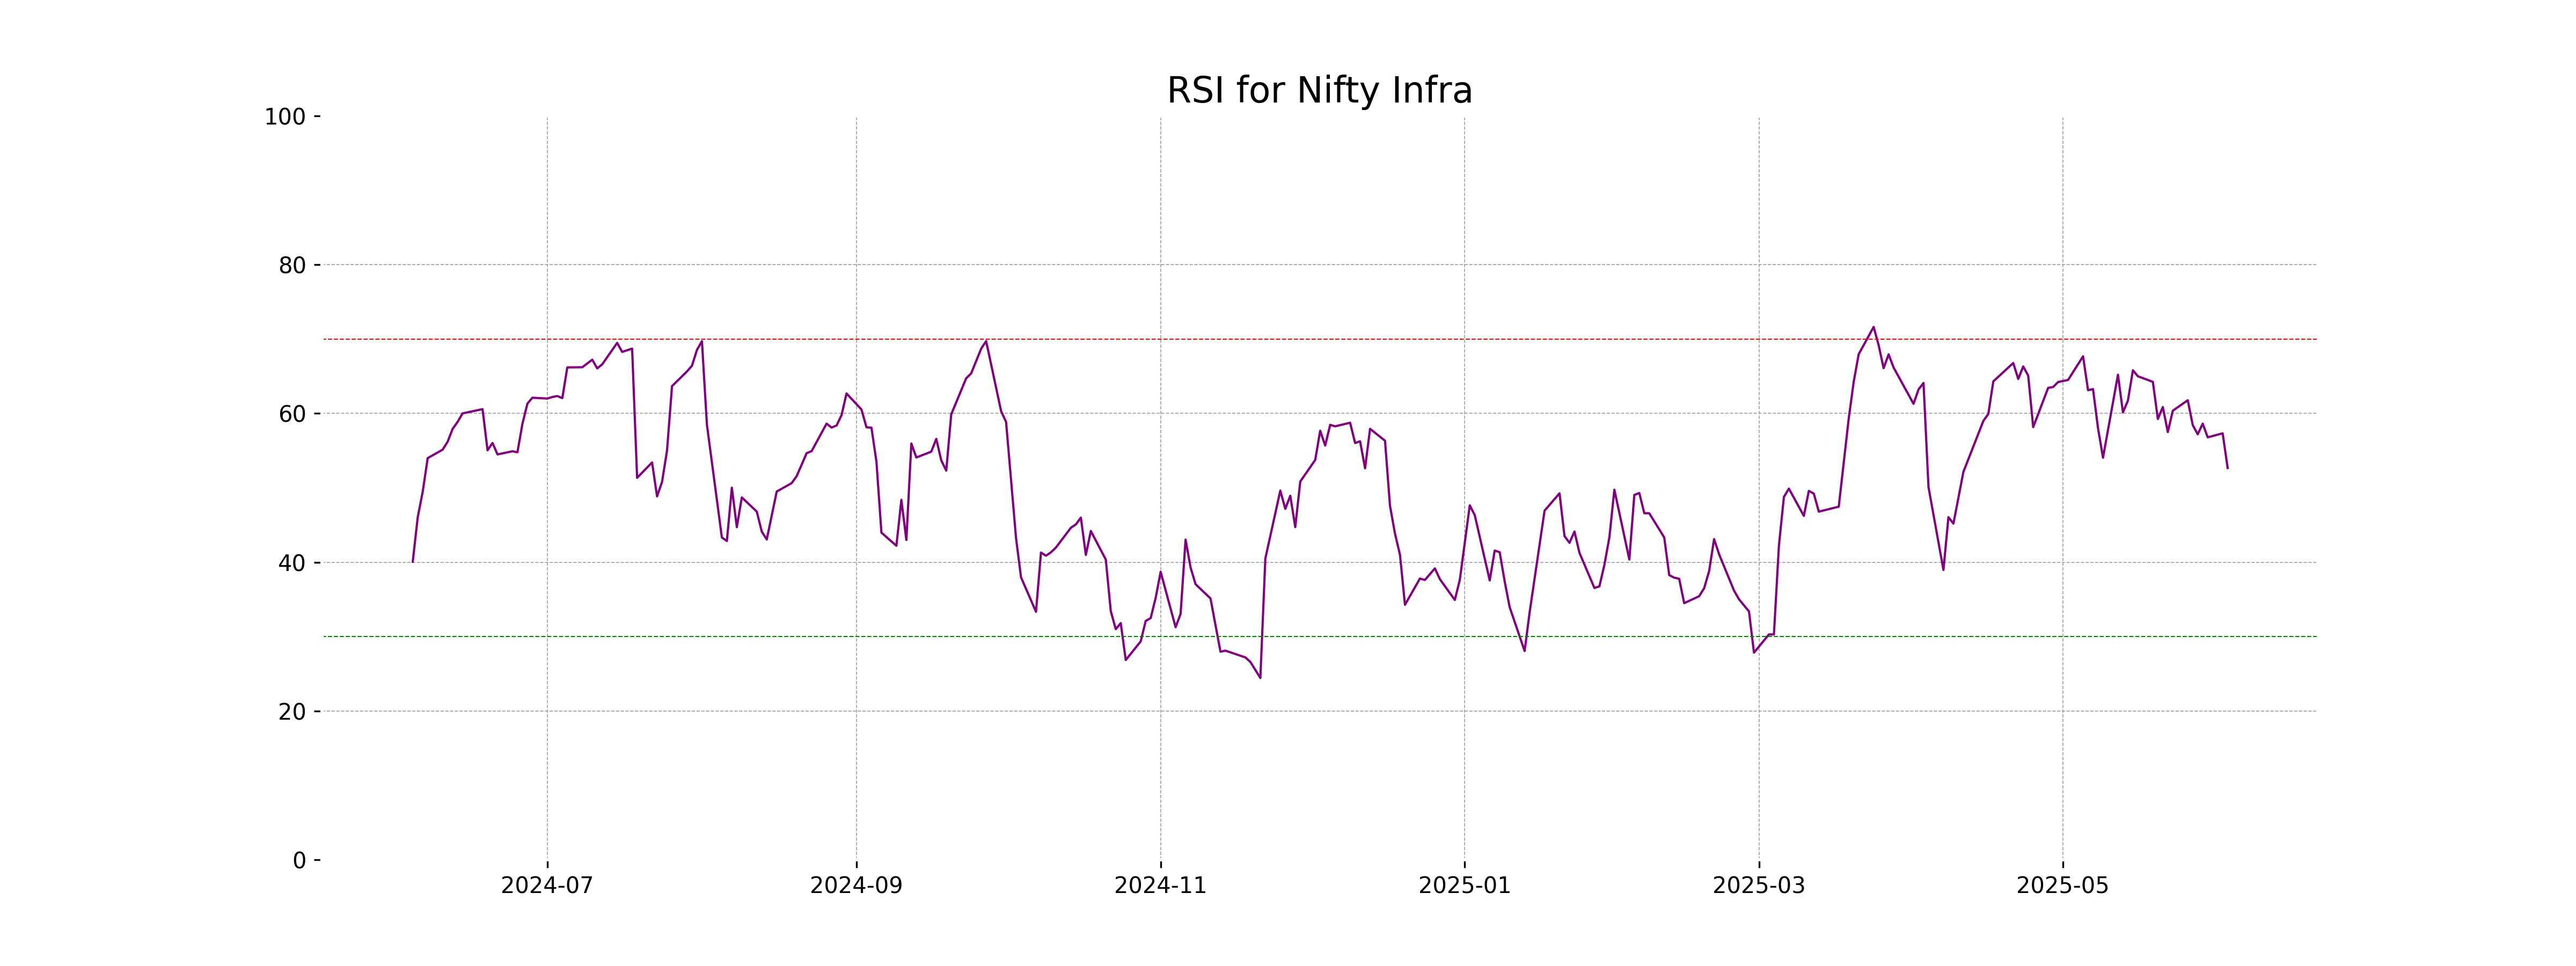
RSI Analysis
The current RSI for Nifty Infra is 52.67, which suggests that the index is in a neutral zone. Typically, an RSI above 70 indicates overbought conditions, while below 30 signifies an oversold state. Therefore, Nifty Infra is neither overbought nor oversold as of now.
Analysis for Nifty IT - June 03, 2025
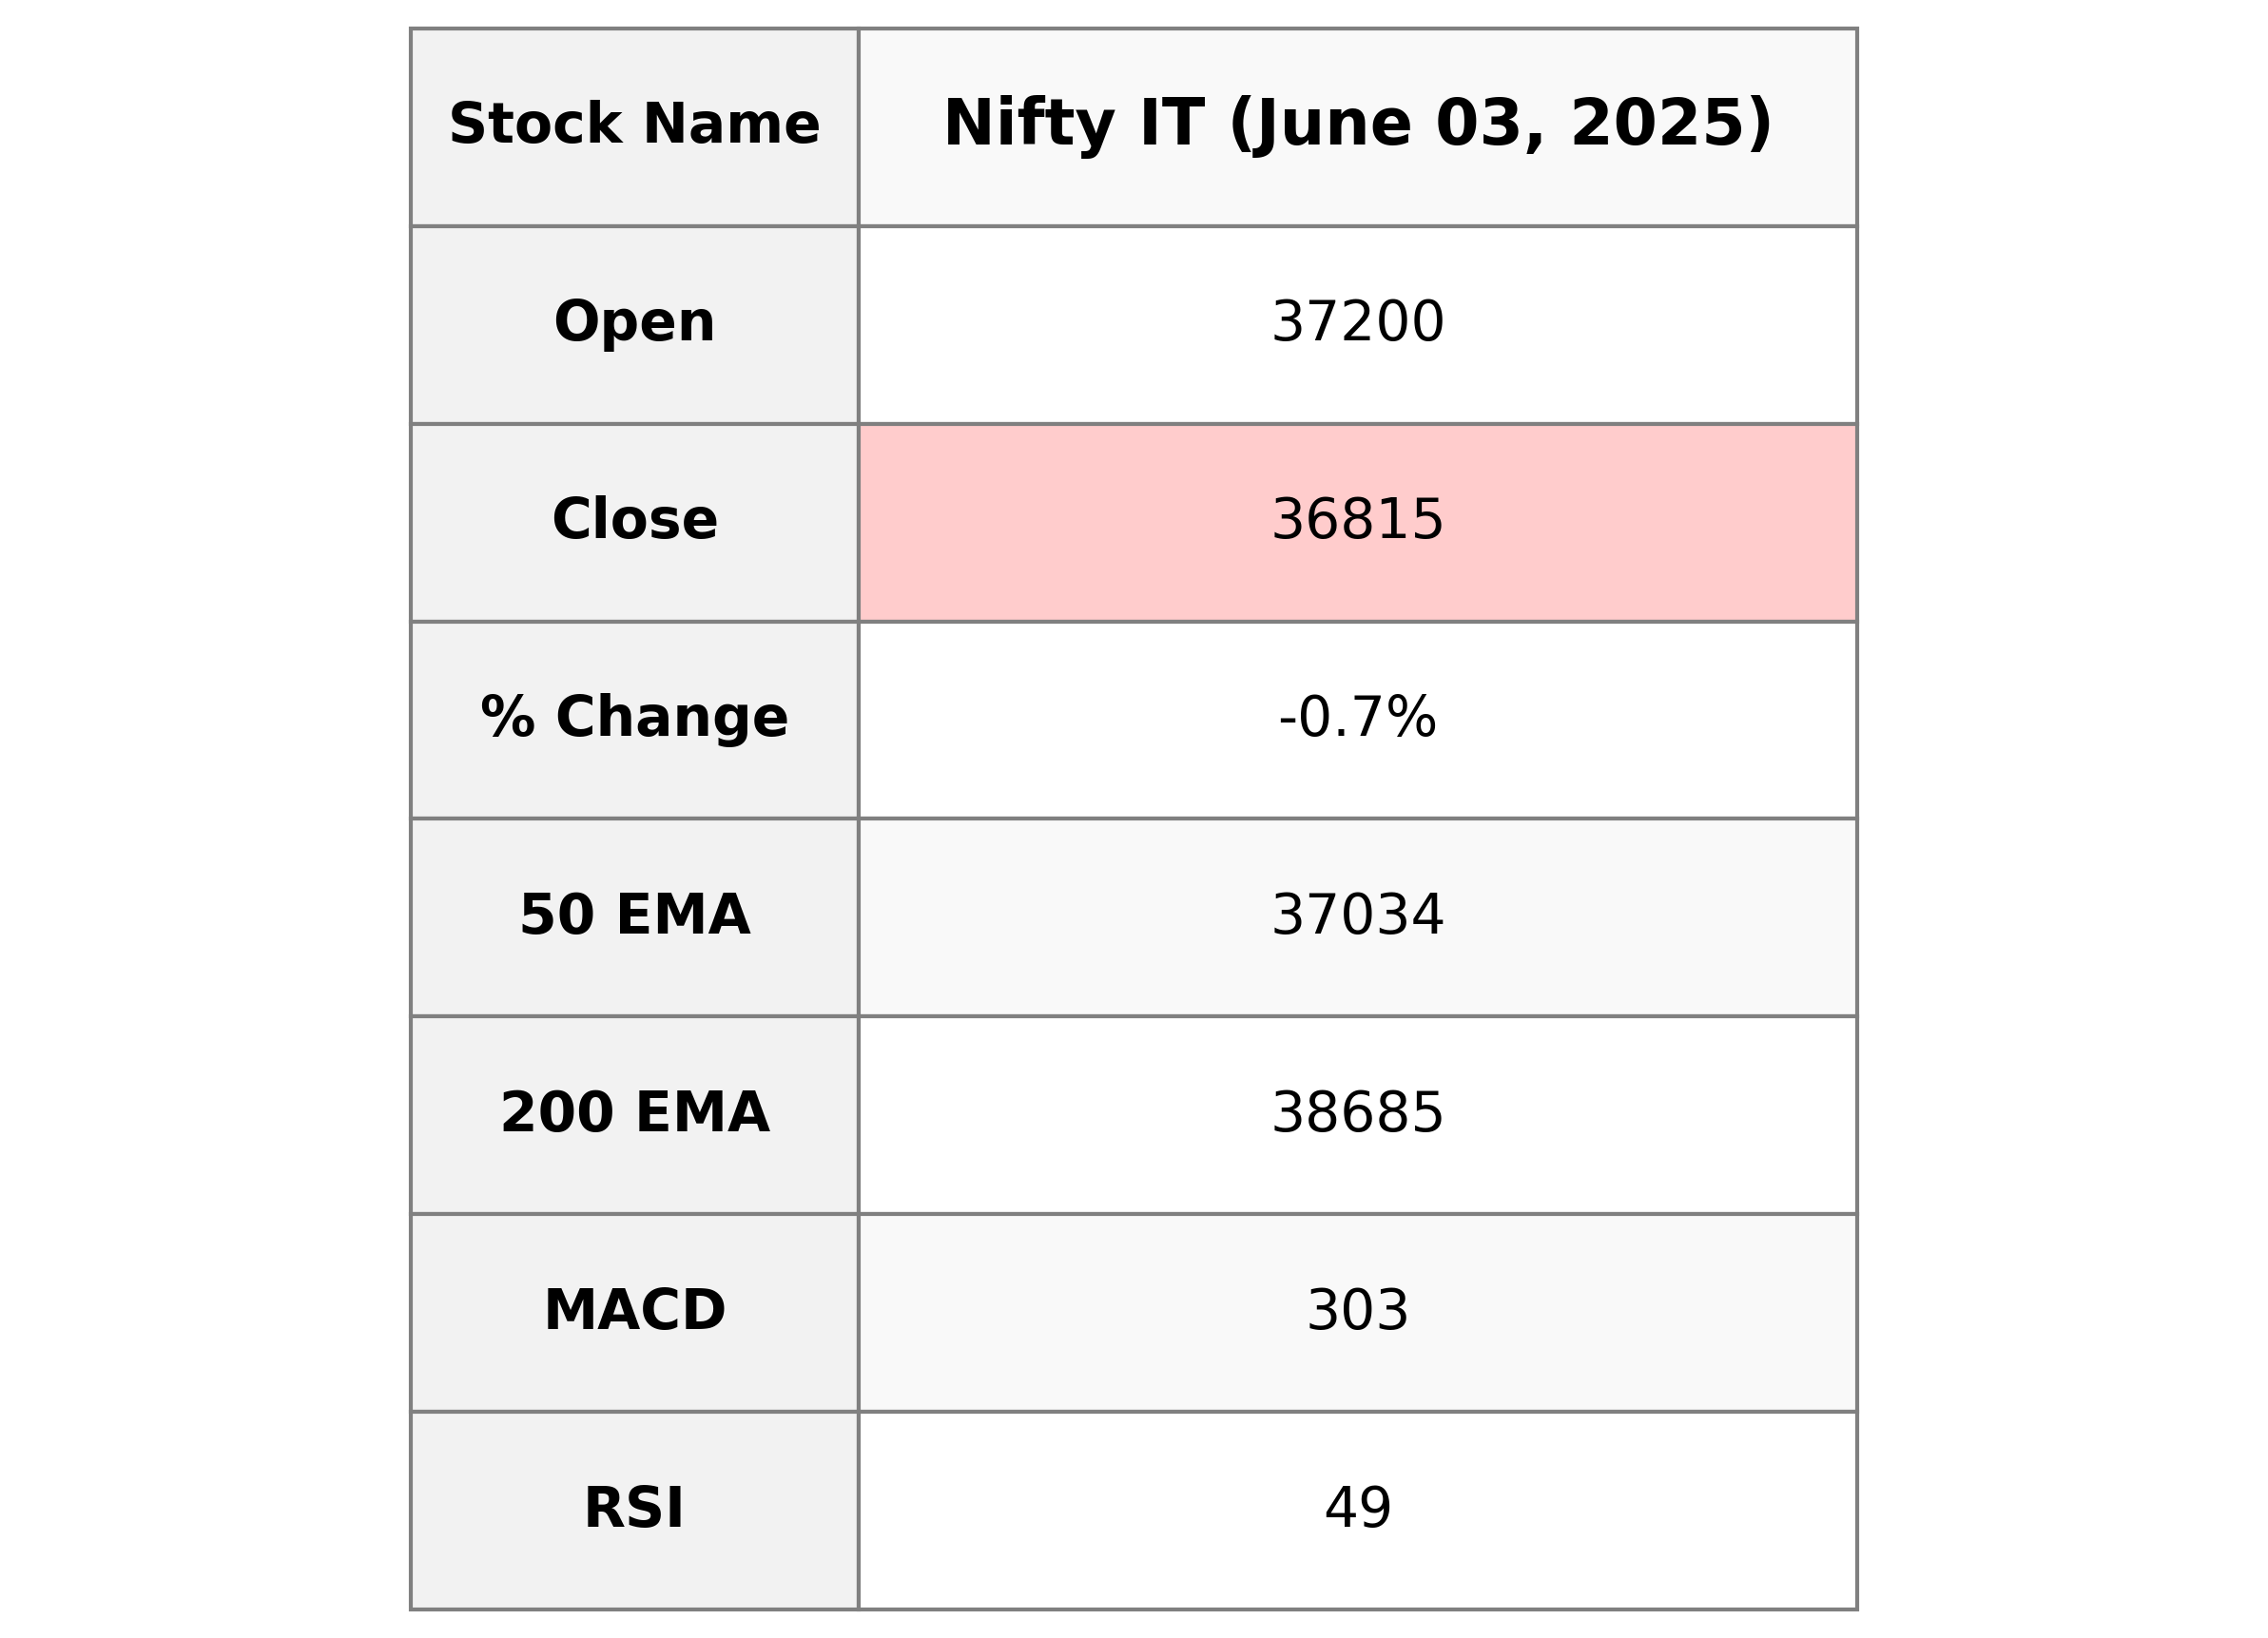
Nifty IT opened at 37199.65 and closed at 36814.90, marking a decrease of 0.67% or a points change of -246.95 from the previous close of 37061.85. The relative strength index (RSI) is at 48.79, indicating a neutral market sentiment. The moving average convergence divergence (MACD) of 302.66 is below its signal line of 410.83, suggesting bearish momentum.
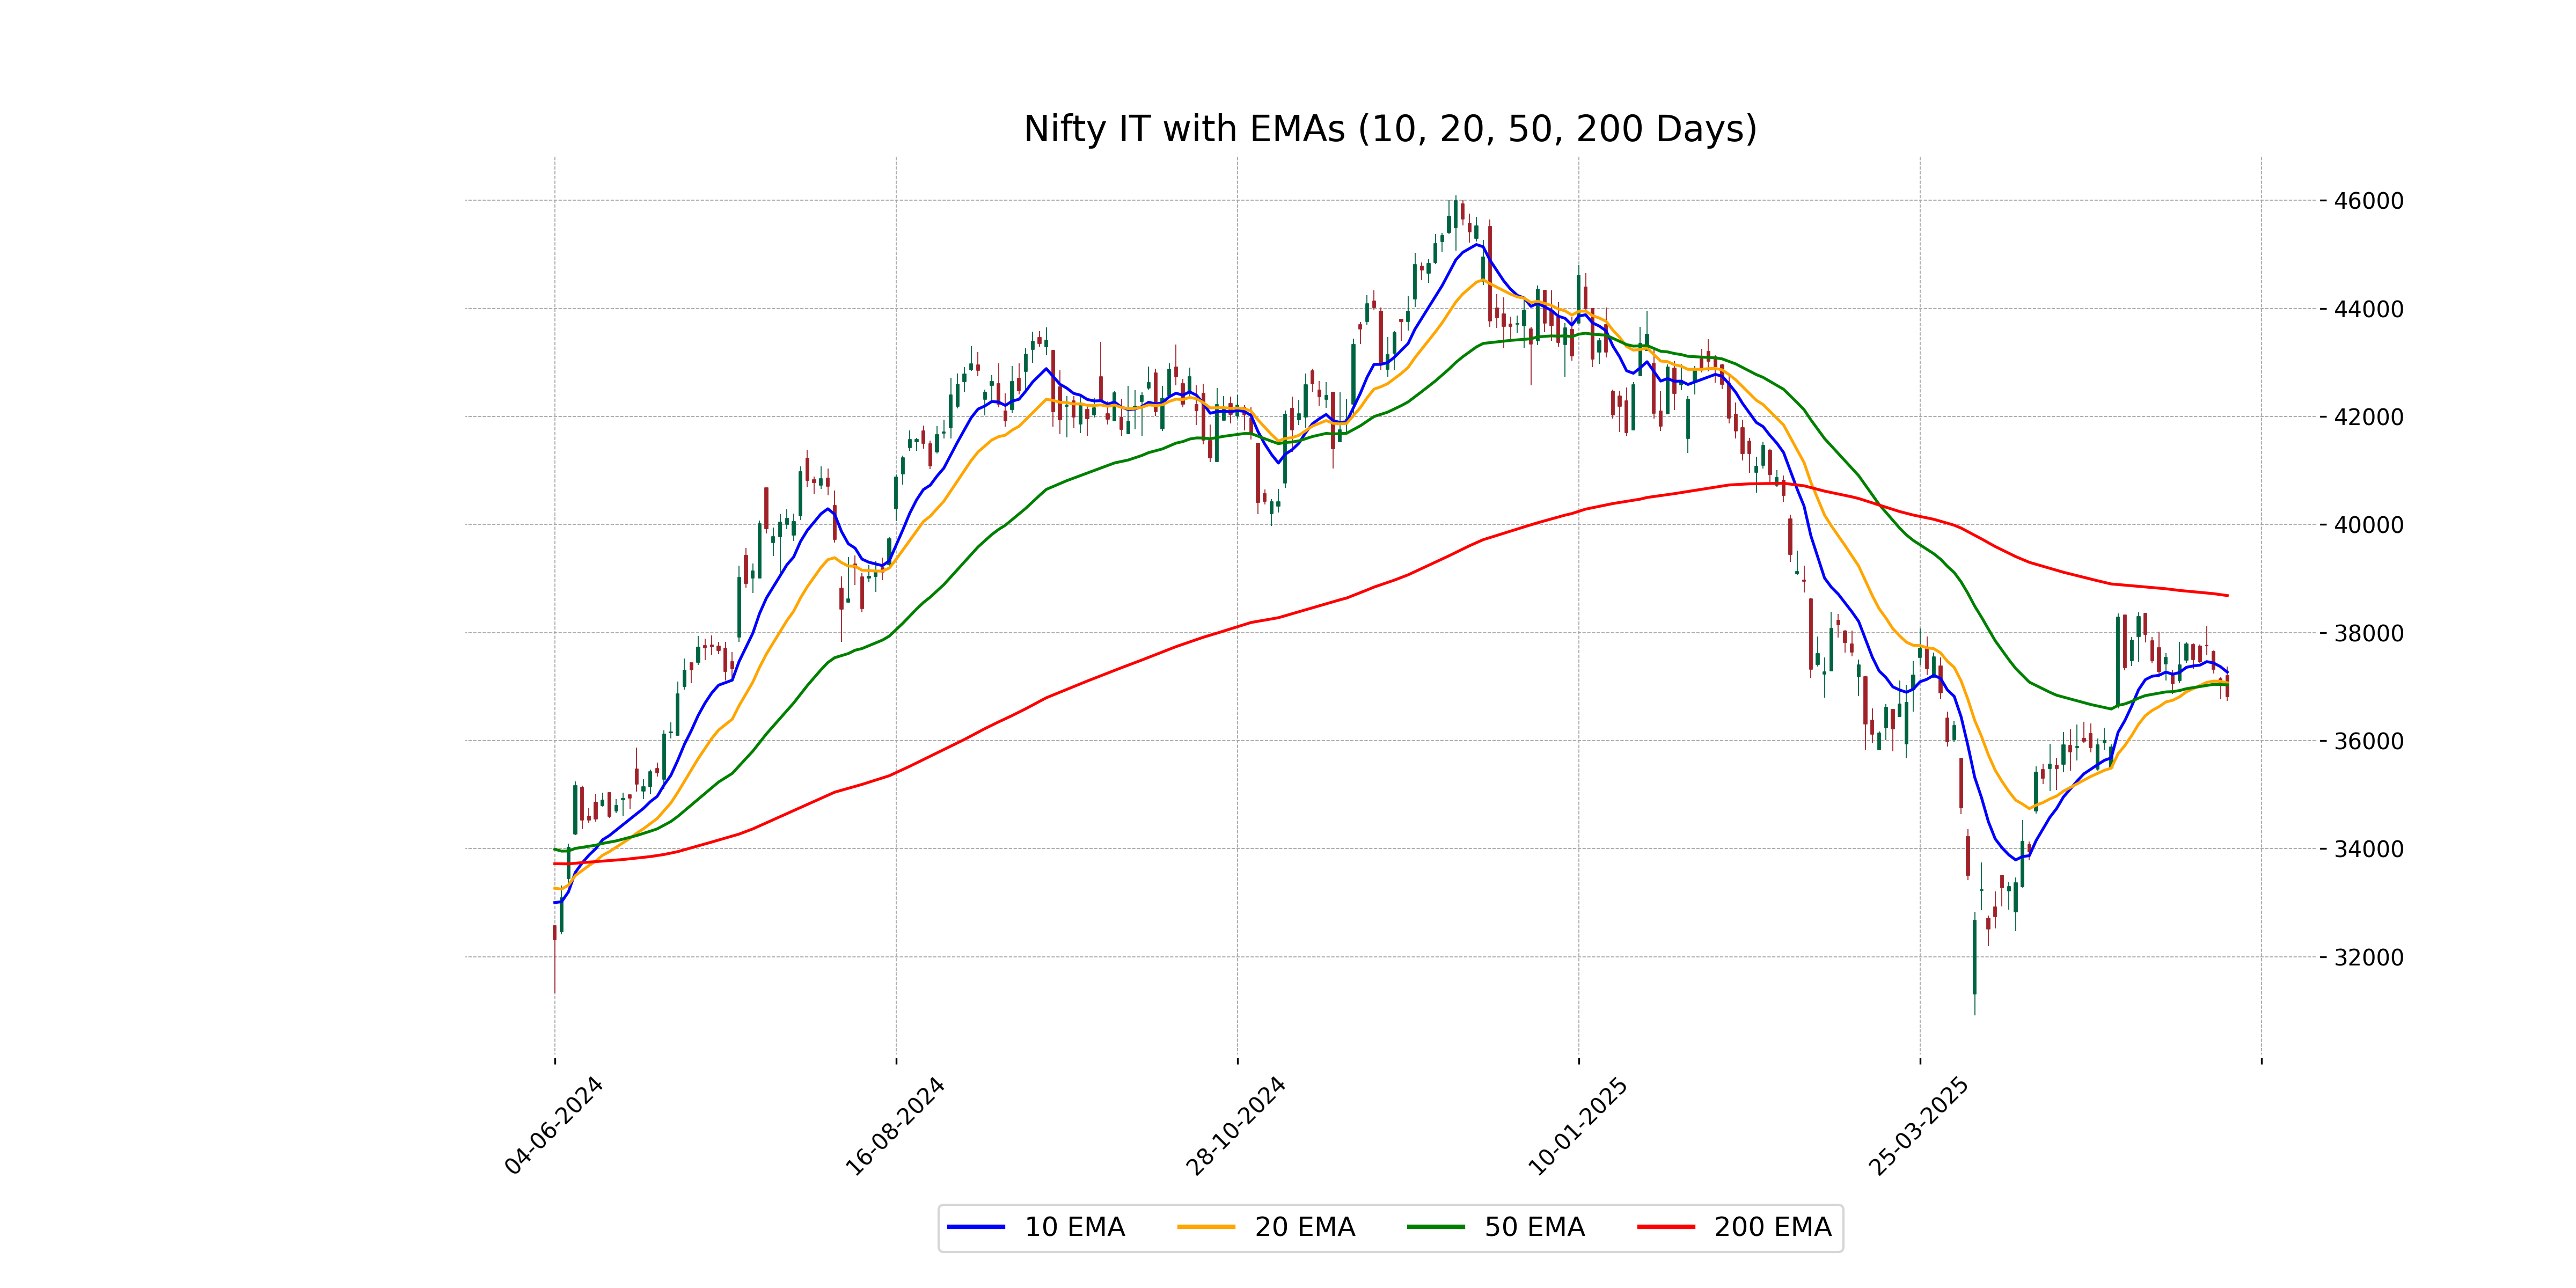
Relationship with Key Moving Averages
The closing price for Nifty IT is 36,814.90, which is below the 10-day EMA of 37,268.15, the 20-day EMA of 37,071.32, and the 50-day EMA of 37,033.75. This indicates a bearish short-term trend as the price is also below these key moving averages.
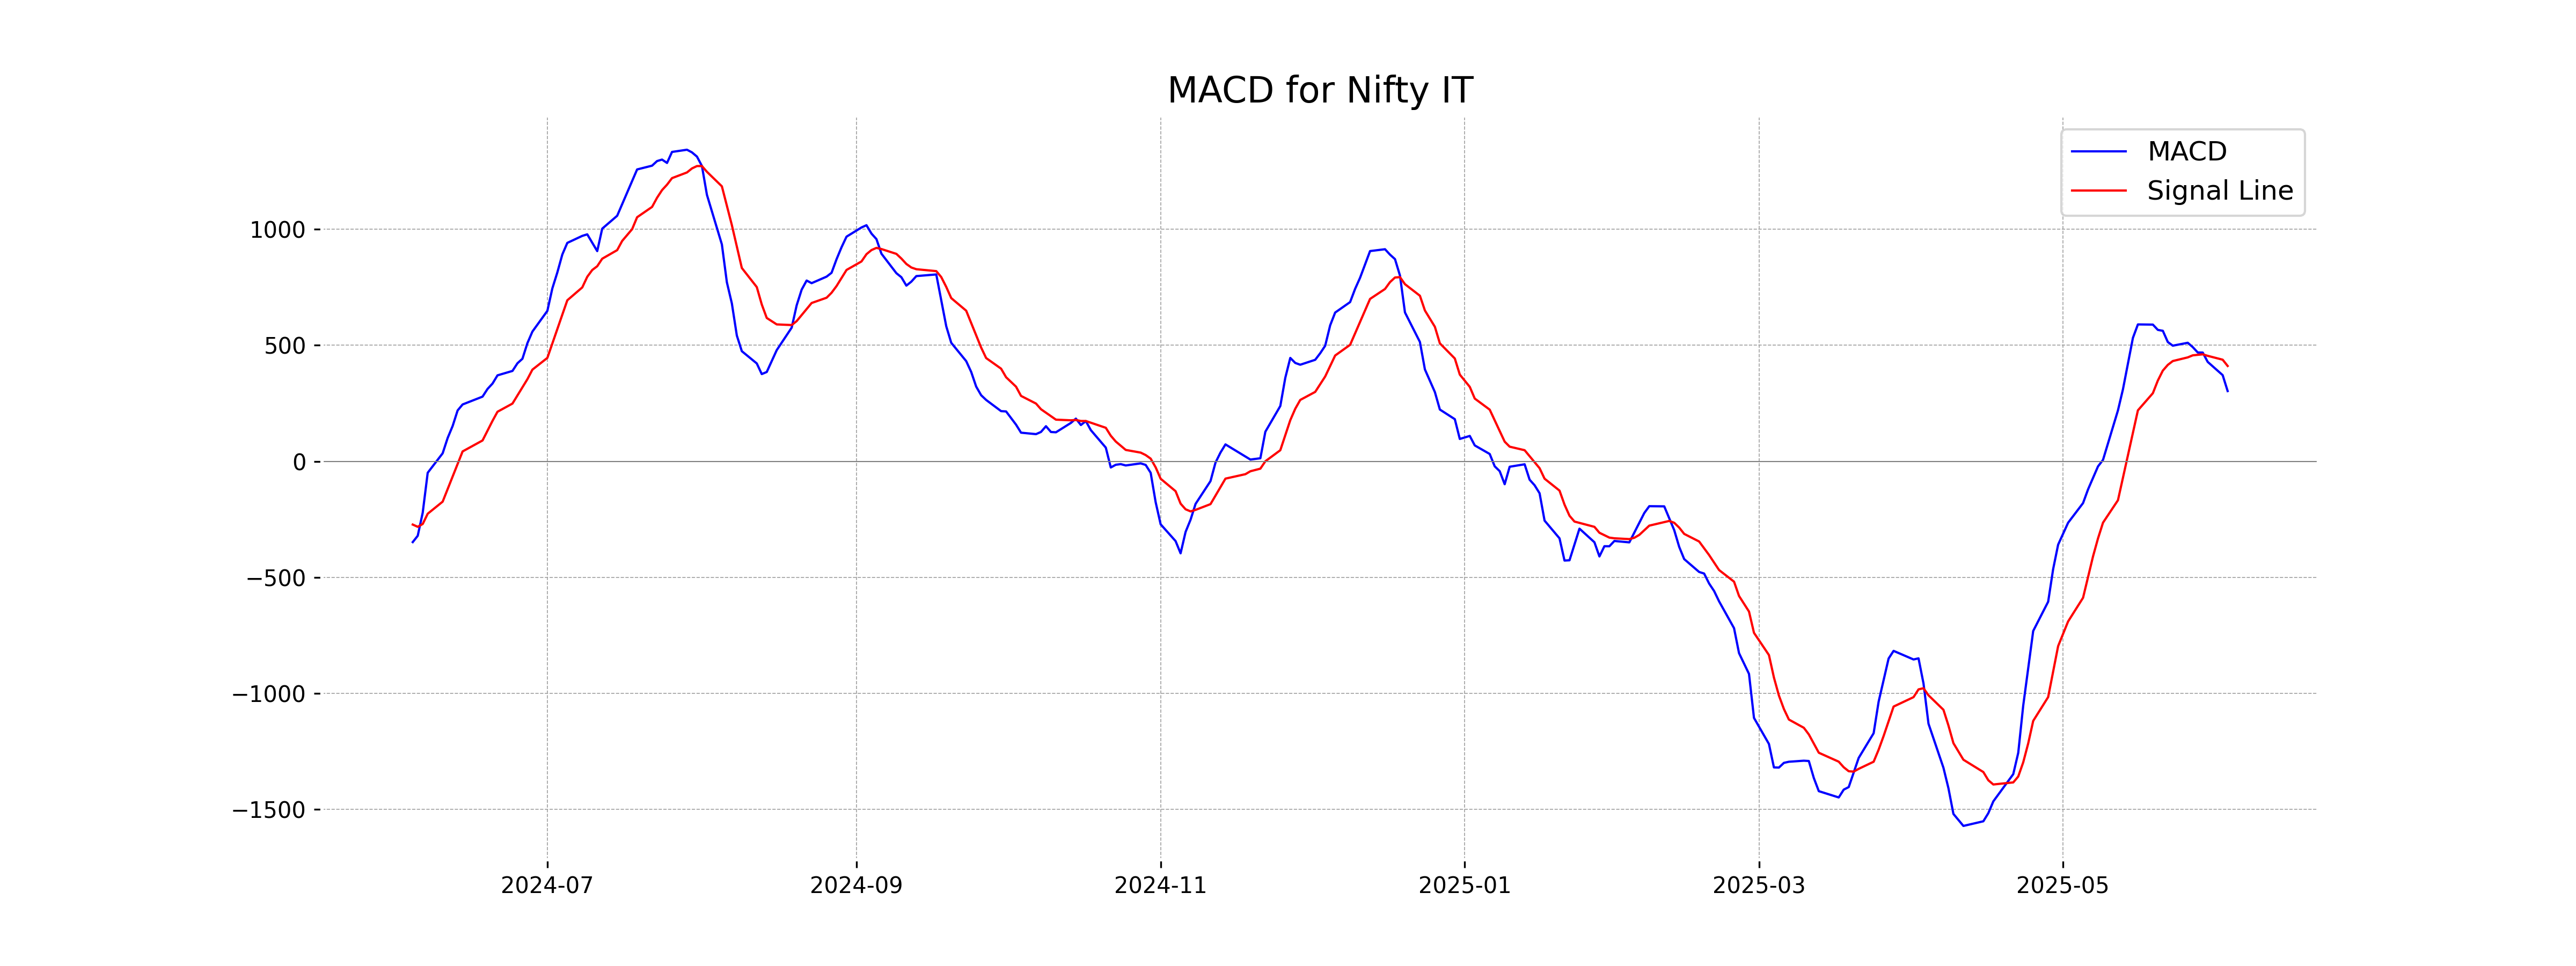
Moving Averages Trend (MACD)
Nifty IT MACD Analysis: The MACD value for Nifty IT is 302.66, which is below the MACD Signal line at 410.83. This suggests a bearish momentum in the market as the MACD is in a declining position relative to its signal line, indicating potential downward pressure on the stock price.
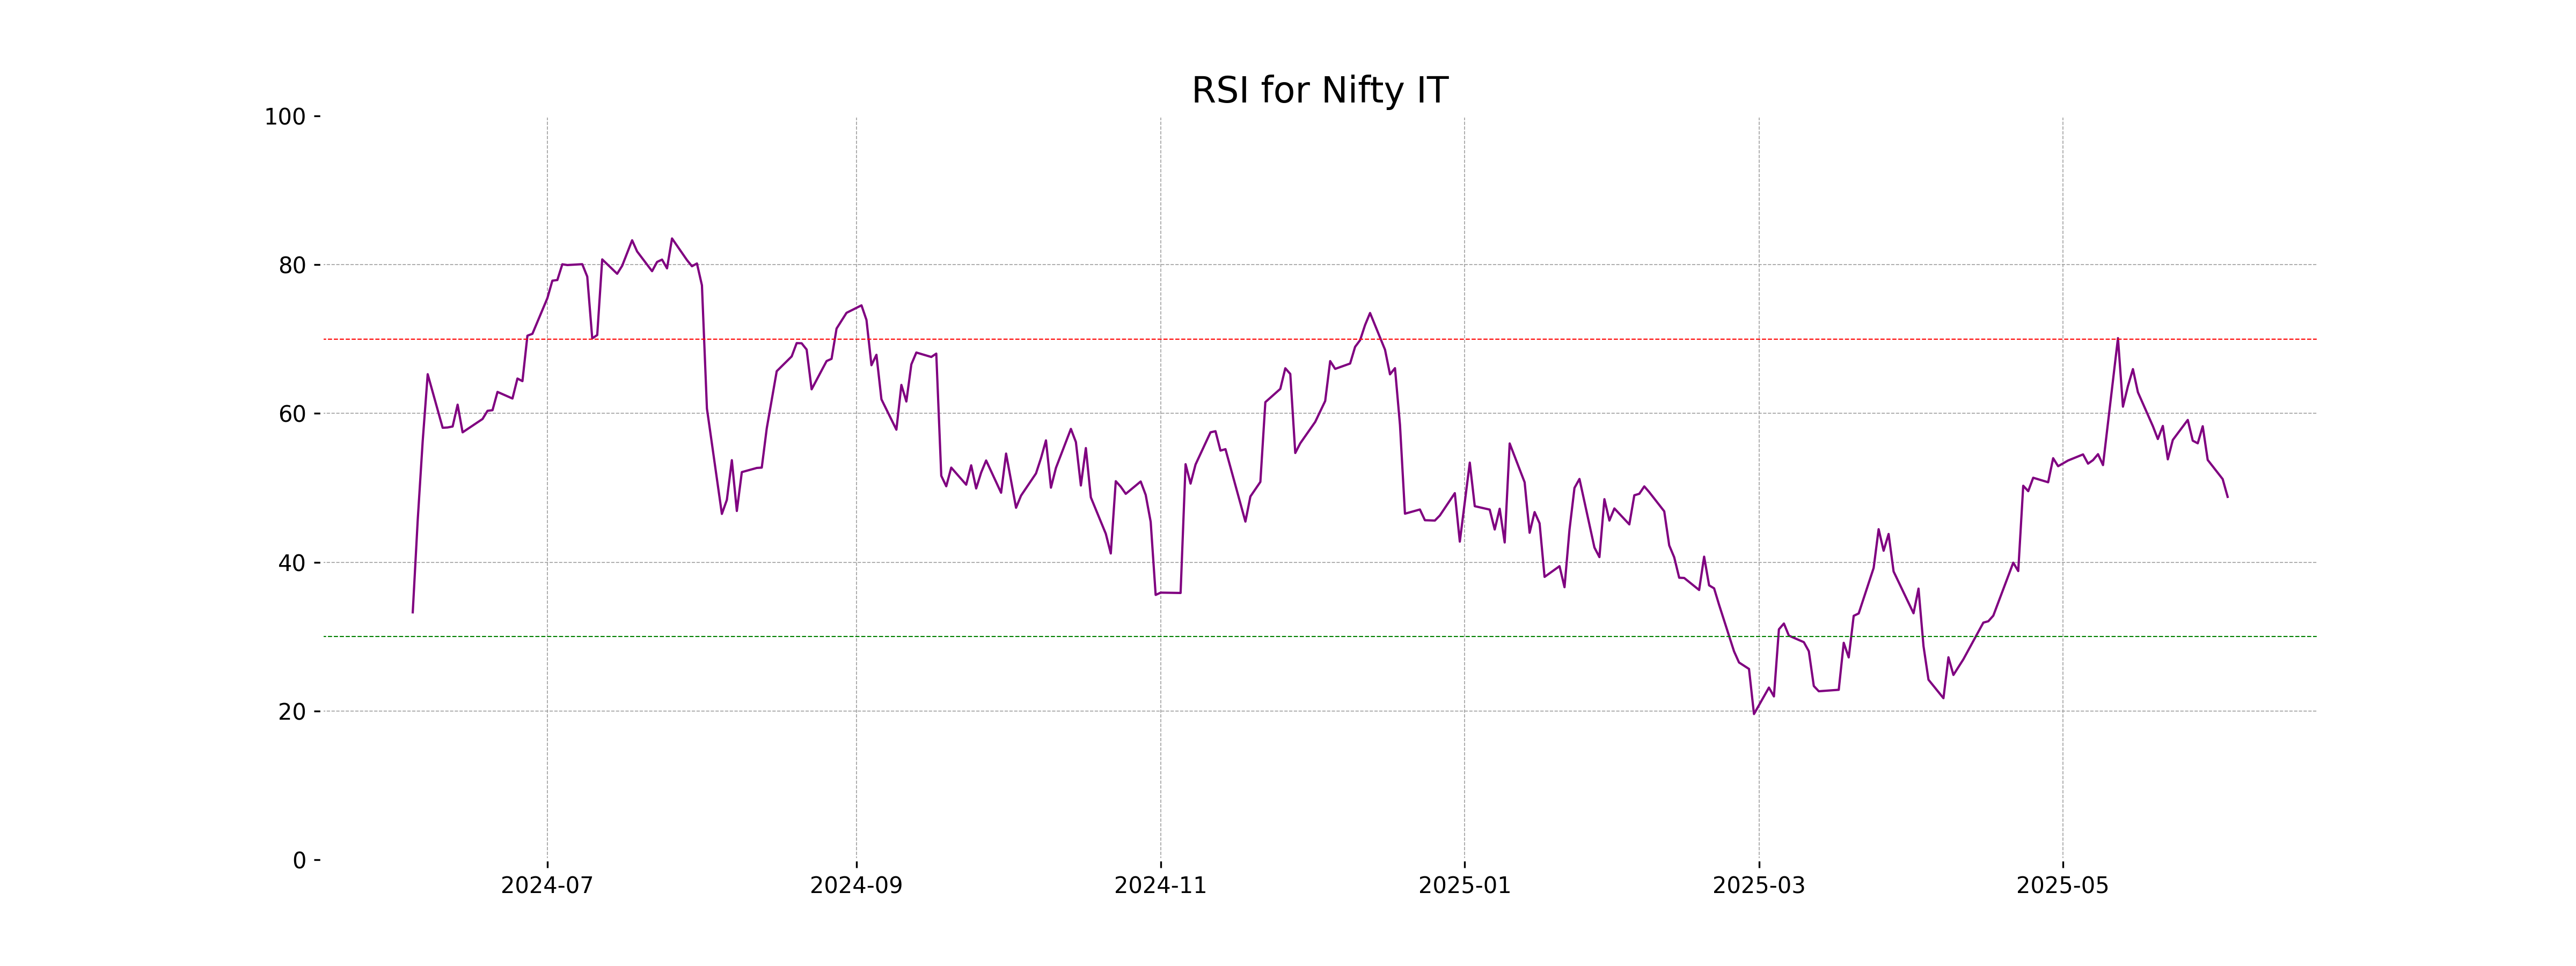
RSI Analysis
The RSI for Nifty IT is 48.79, indicating a neutral state where the stock is neither overbought nor oversold. This suggests that the recent price movement is relatively balanced without strong buying or selling pressure.
Analysis for Nifty Metal - June 03, 2025
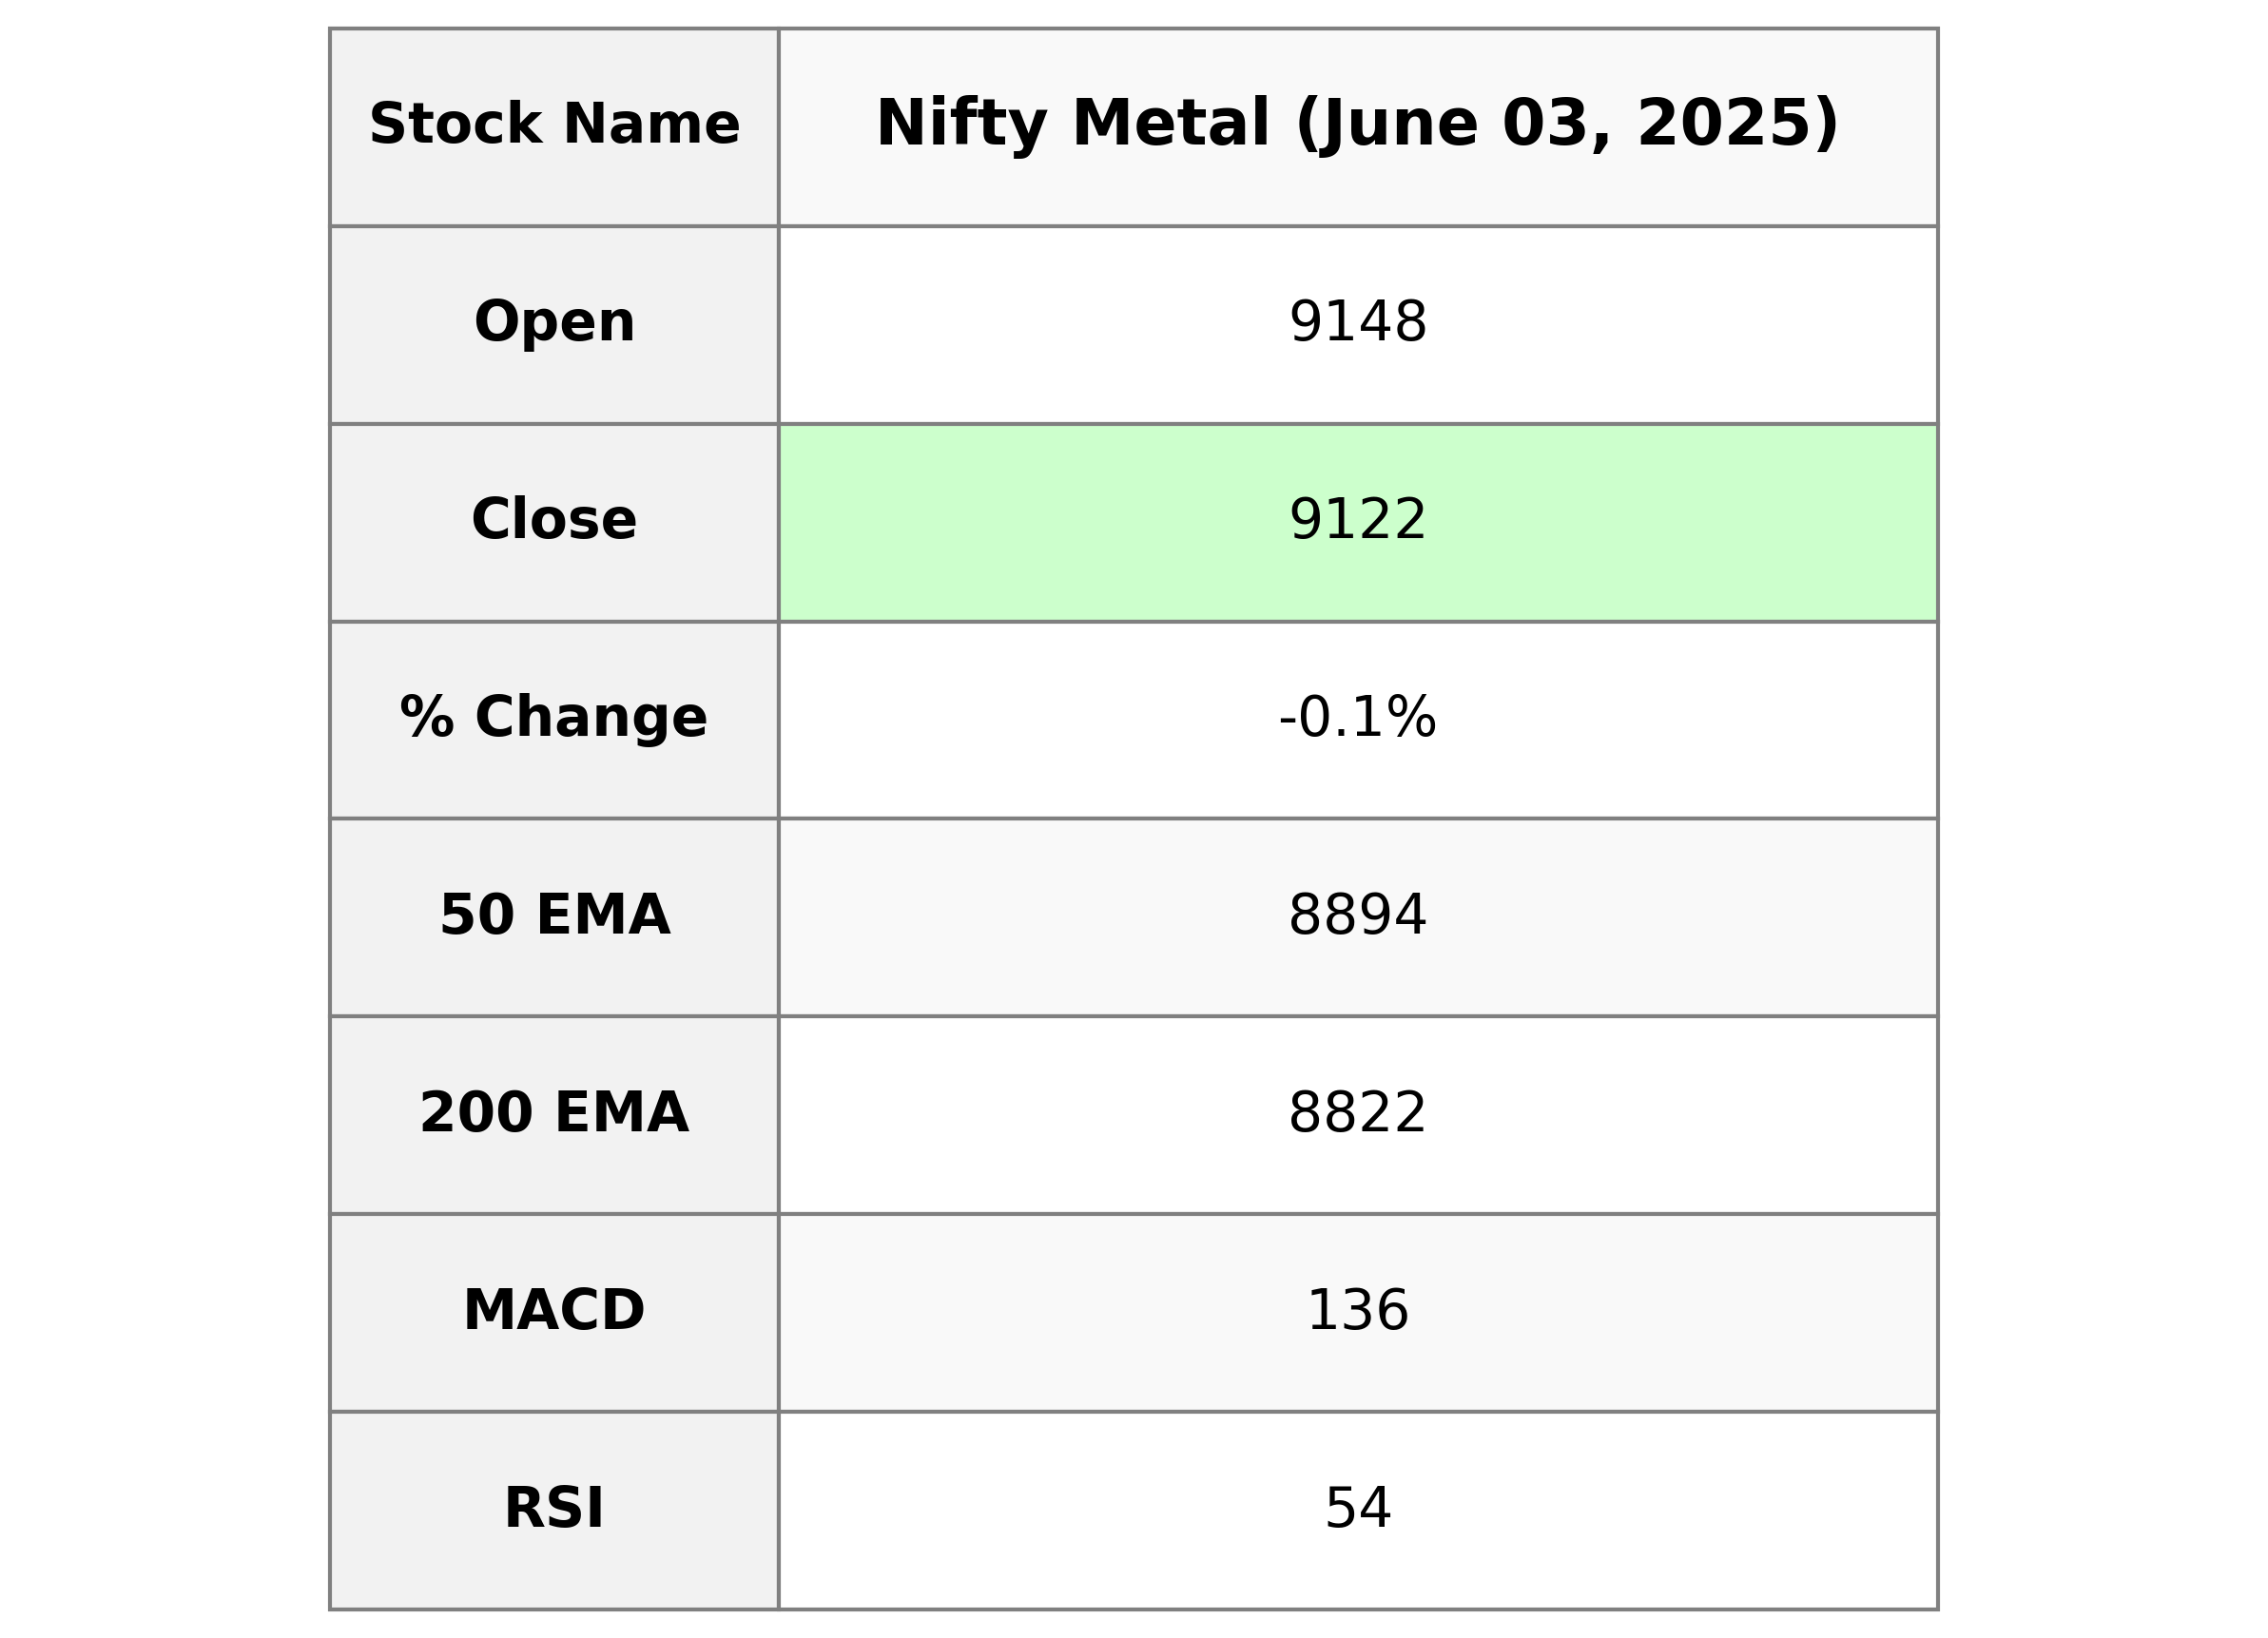
Nifty Metal opened at 9148.30 and closed at 9122.30, showing a minor decline with a percentage change of -0.068%. The index experienced a high of 9204.20 and a low of 9113.35. The current RSI stands at 54.42, indicating a slightly bullish momentum, while the MACD value of 136.01 is below the signal line, suggesting a potential cooldown in positive momentum.
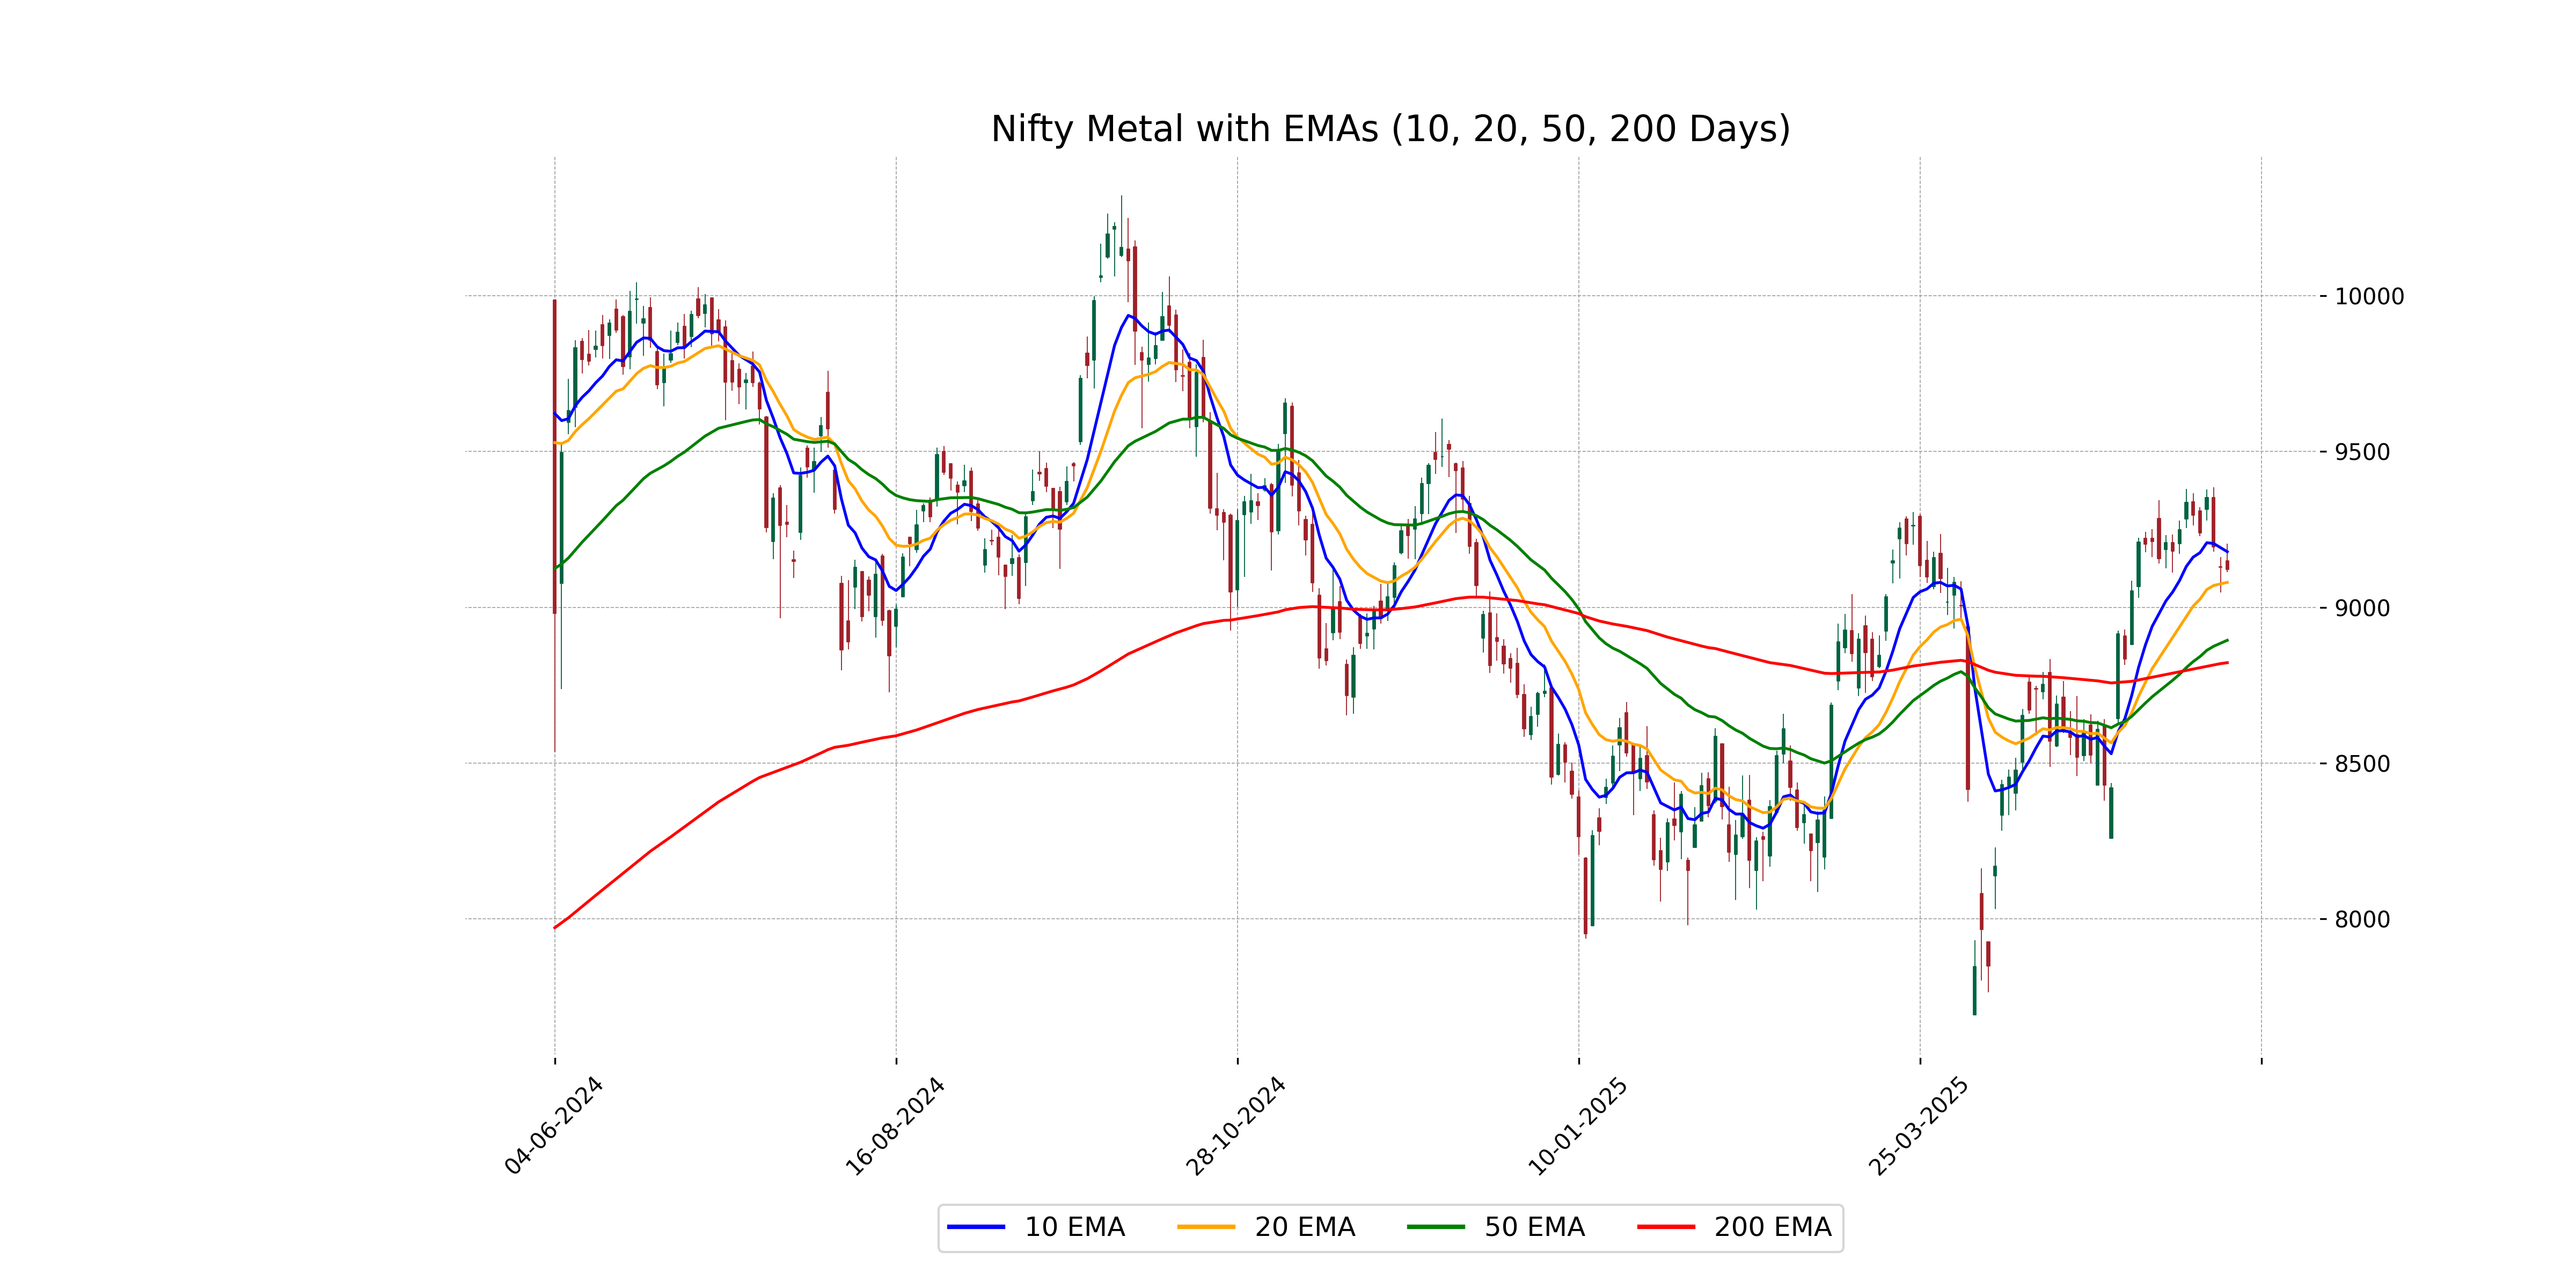
Relationship with Key Moving Averages
The closing price of Nifty Metal Index is below its 10-day EMA (9178.43) and above both the 50-day (8893.99) and 200-day (8822.09) EMAs, indicating a short-term bearish sentiment but a potentially bullish trend over the longer term. The MACD is also below the MACD Signal, which may suggest potential downward momentum.
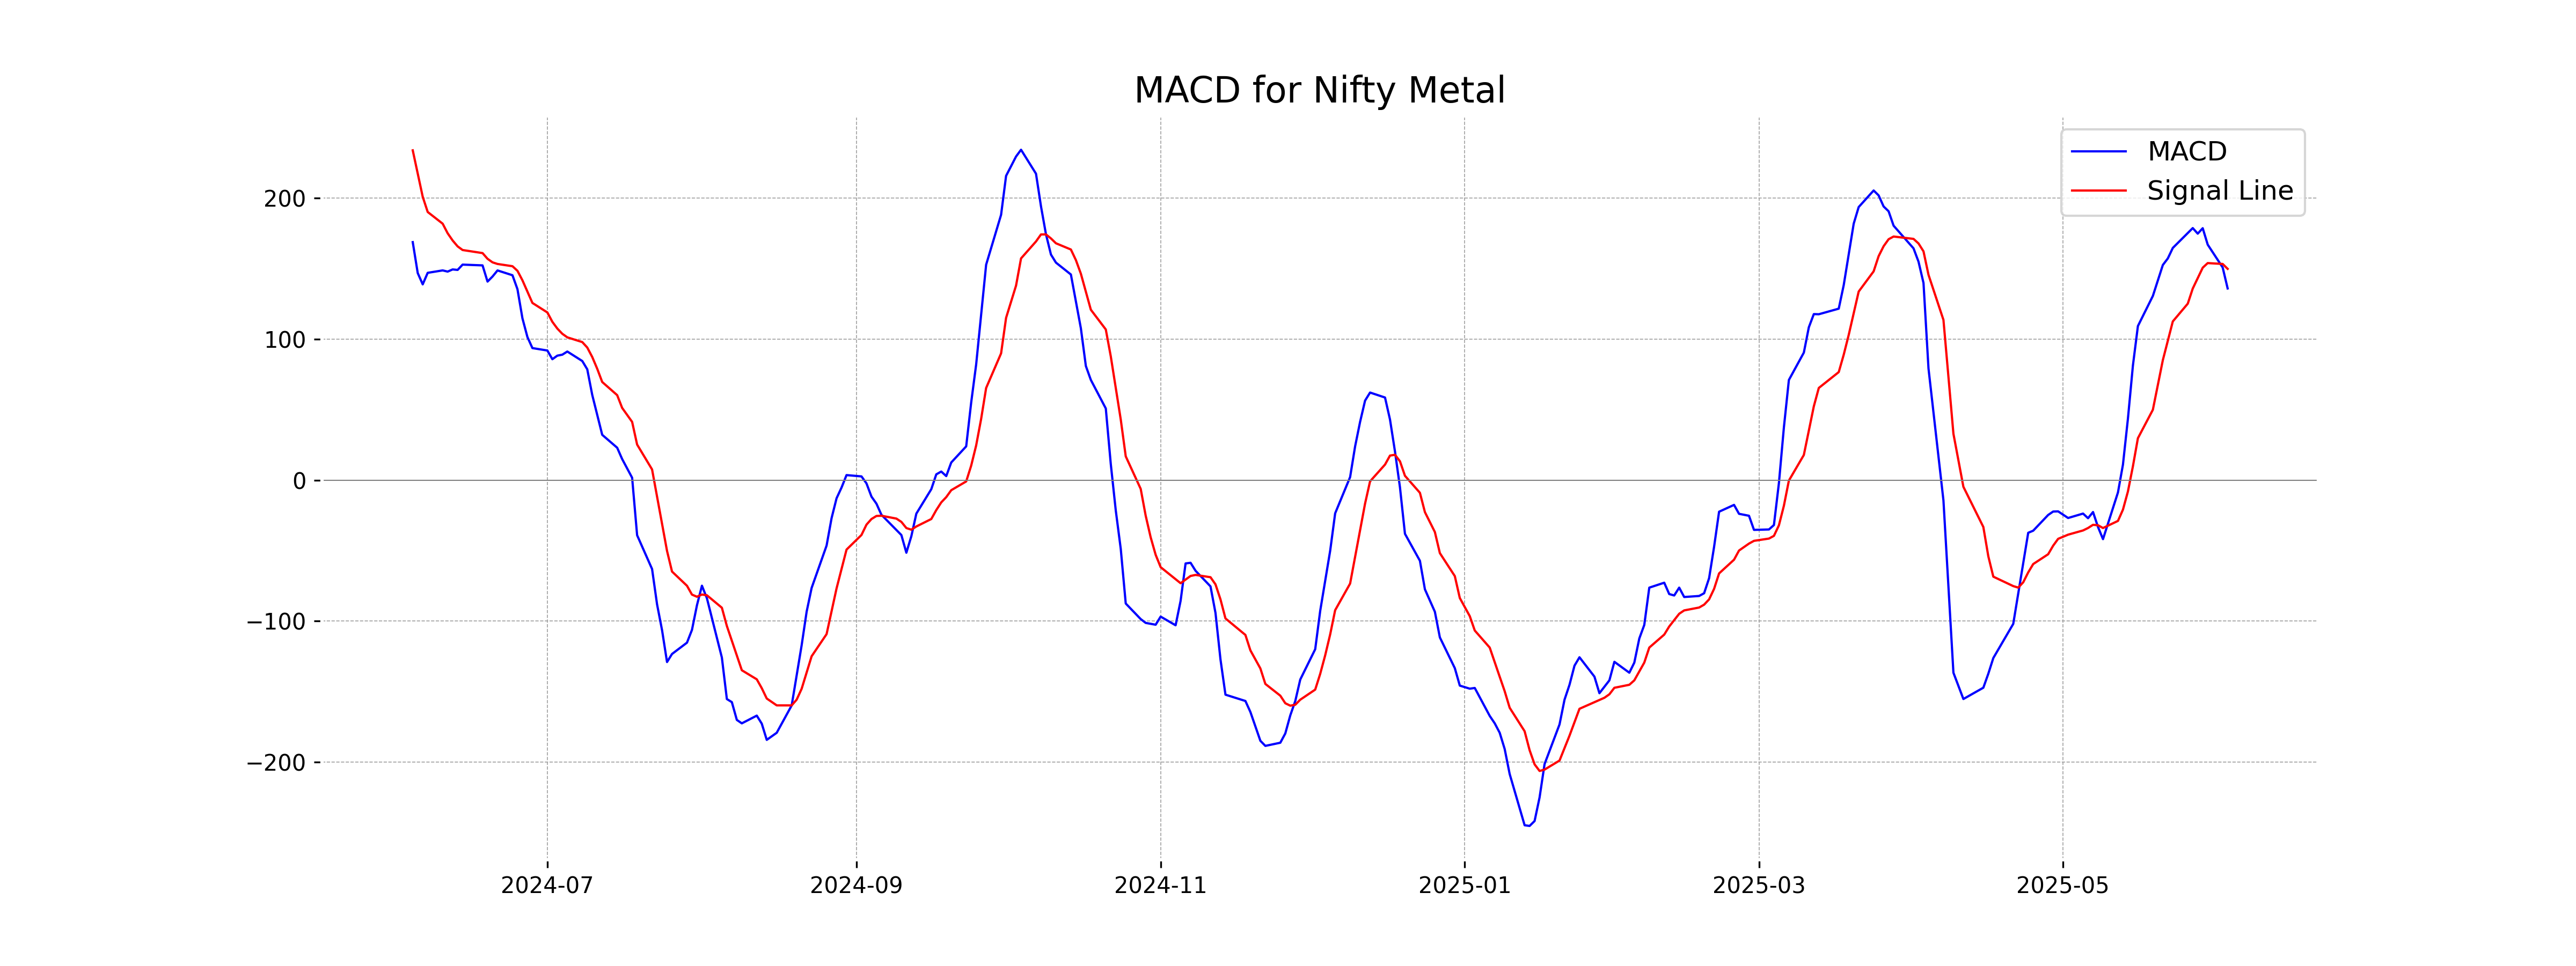
Moving Averages Trend (MACD)
The MACD value for Nifty Metal is 136.01, which is below the MACD Signal of 149.91. This suggests a bearish trend as the MACD line is below the signal line, indicating potential downward momentum.
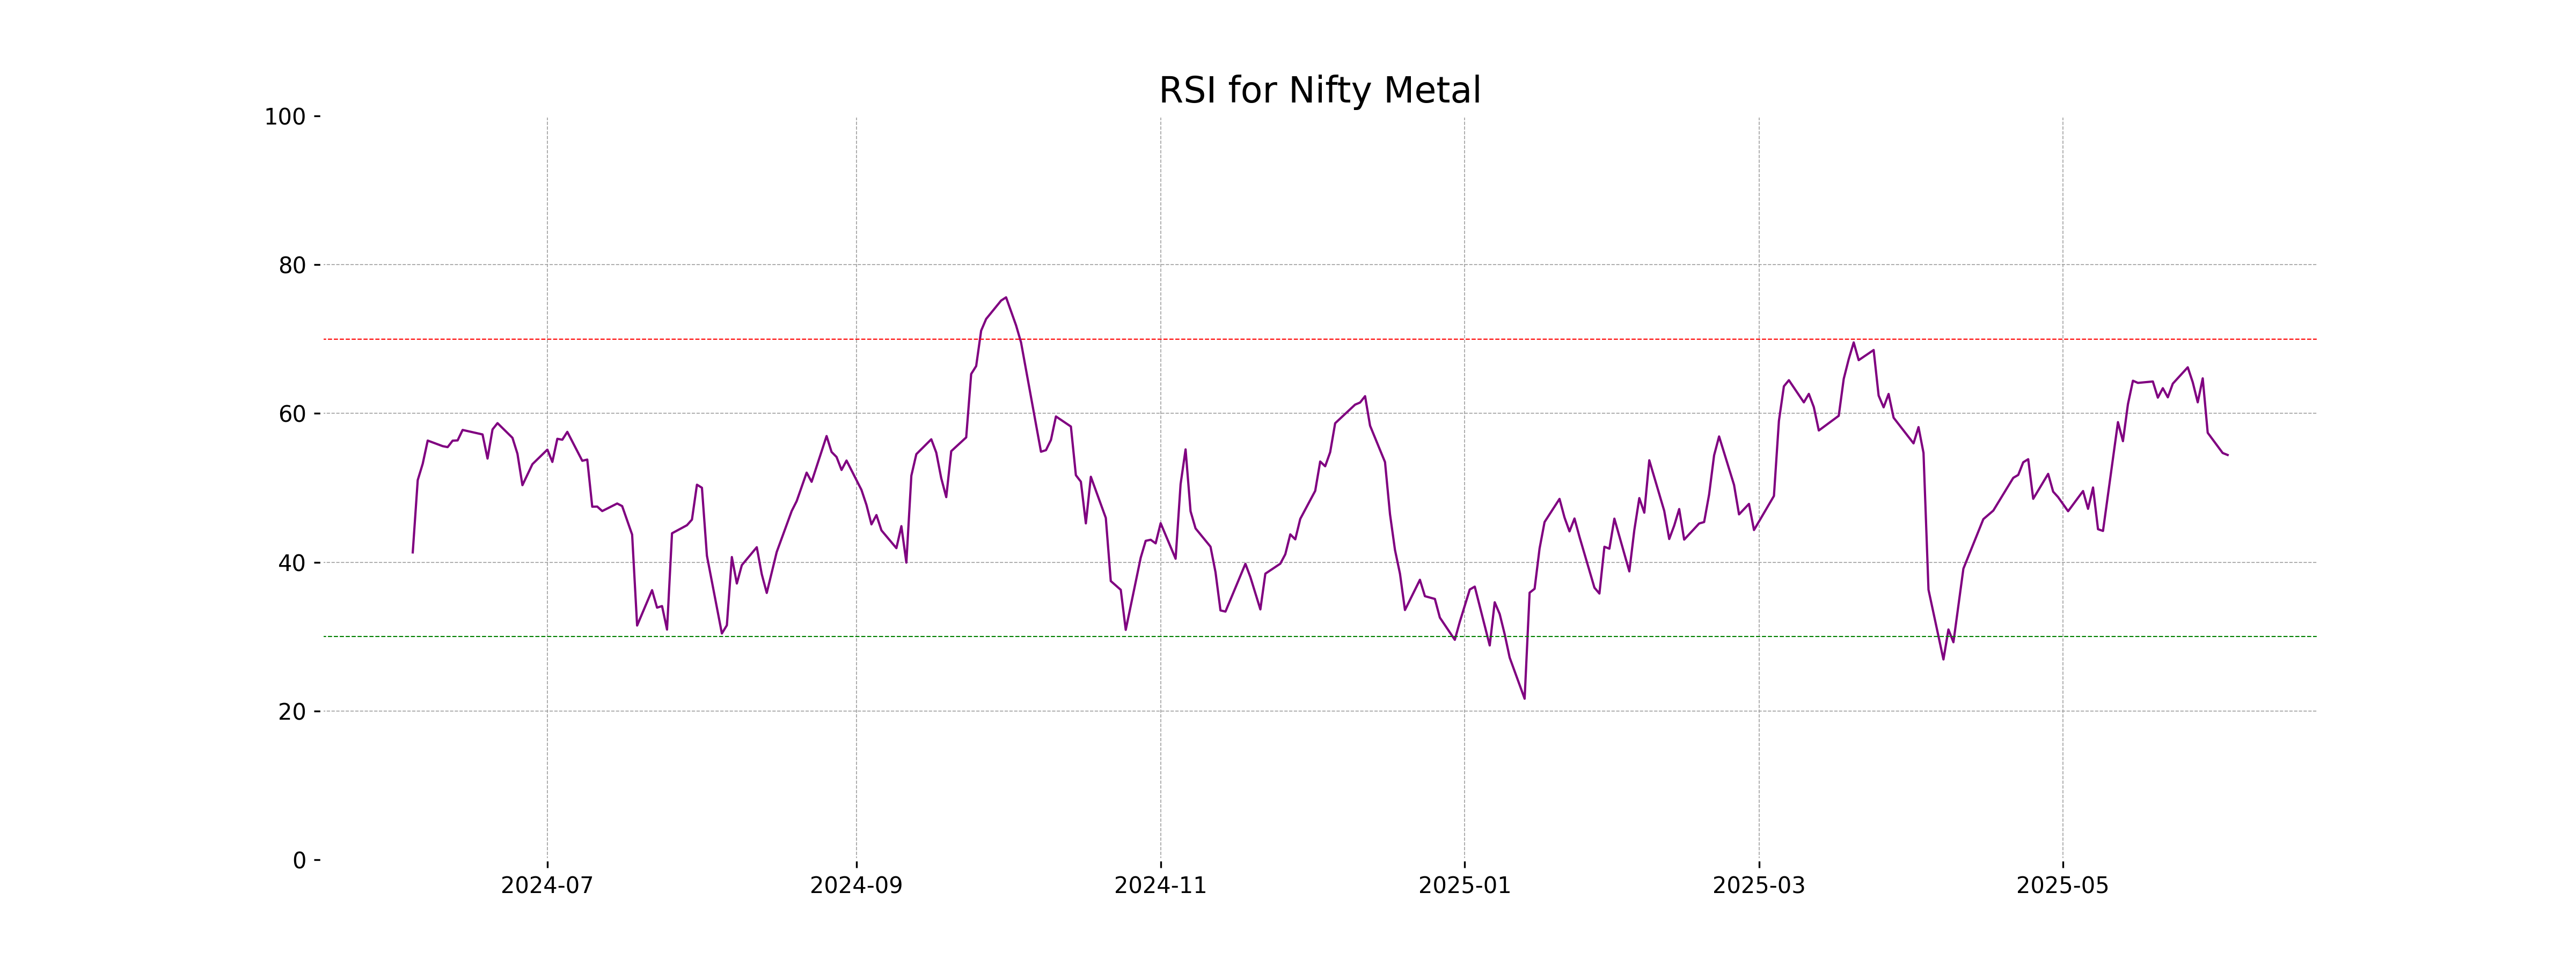
RSI Analysis
The RSI for Nifty Metal is 54.42, indicating a moderate level of market momentum. This value suggests that the stock is neither overbought nor oversold, reflecting a balanced trading position.
Analysis for Nifty Bank - June 03, 2025
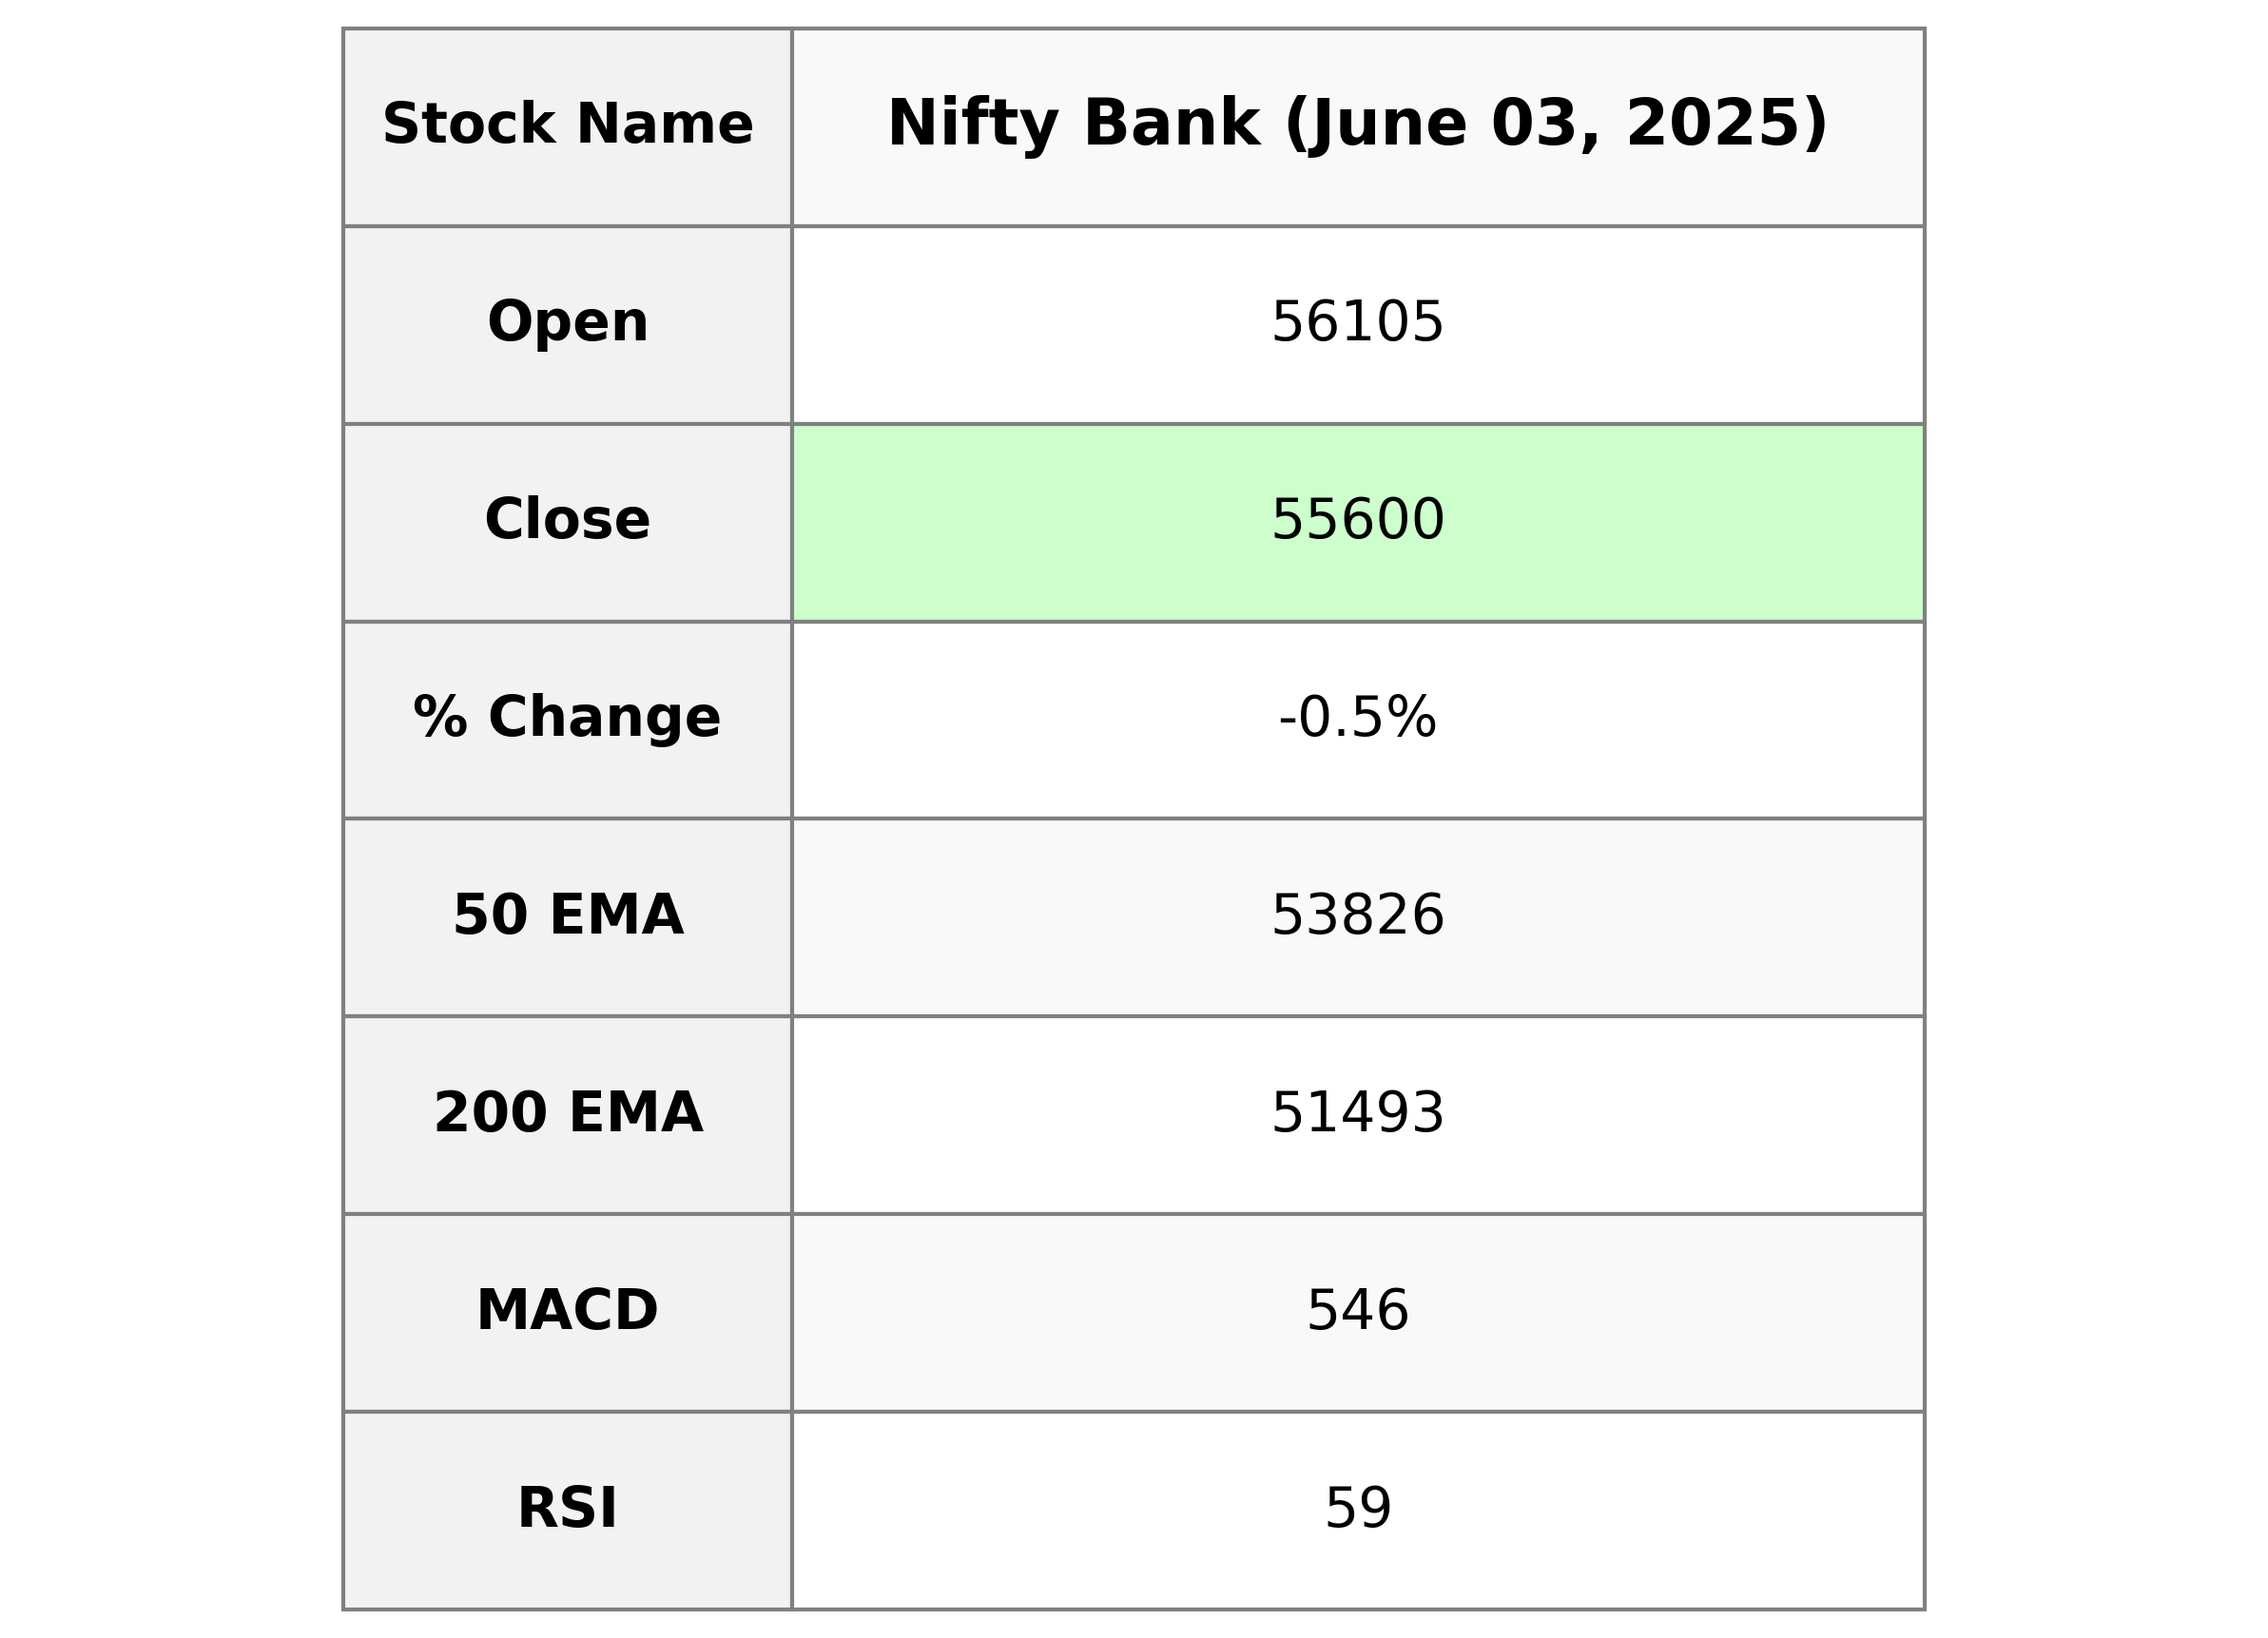
Nifty Bank opened at 56104.80 and closed at 55599.95, reflecting a percentage change of -0.54% from the previous close. The day's trading saw a high of 56161.40 and a low of 55455.80. The RSI stands at 58.91, indicating a moderate level of market momentum, while the MACD is below the signal line, suggesting potential bearish tendencies.
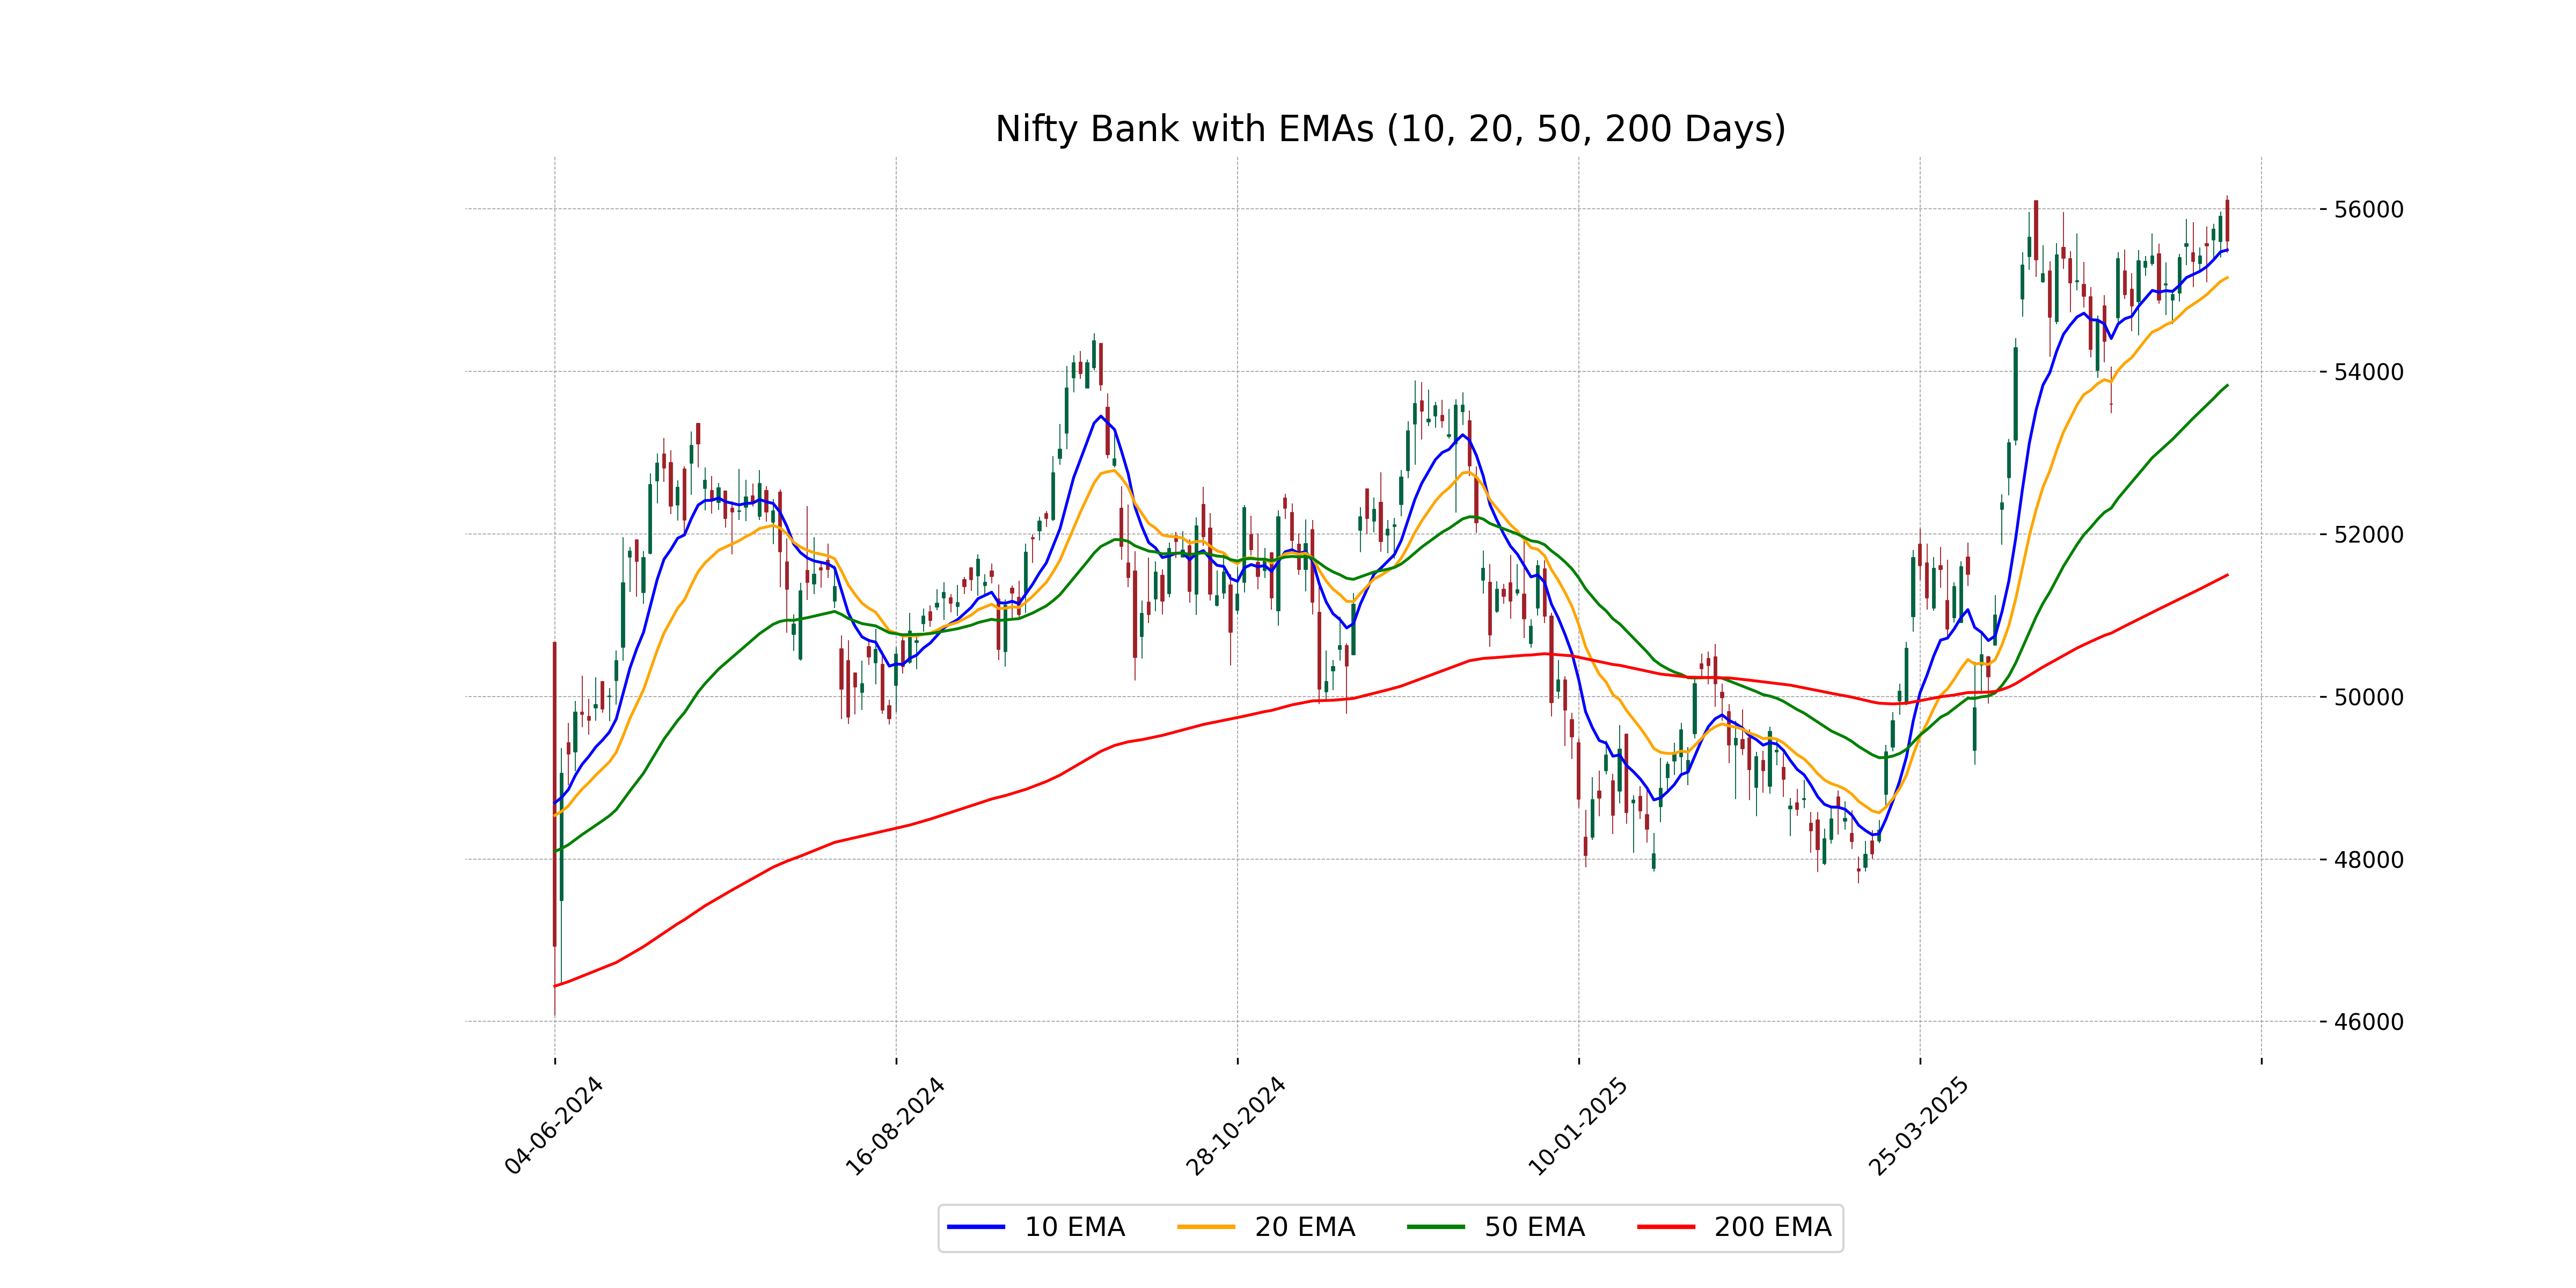
Relationship with Key Moving Averages
The Nifty Bank closed at 55,599.95, below its 10 EMA of 55,492.02, but above both the 50 EMA of 53,825.63 and 200 EMA of 51,492.79. This suggests a short-term bearish sentiment, but the long-term trend remains positive as the stock is trading above its longer-term averages.
Moving Averages Trend (MACD)
1. The current MACD value of 546.05 is below the signal line at 611.95, indicating a potential bearish trend for Nifty Bank. 2. This suggests that the momentum might be turning negative, and traders may want to closely monitor for further declines or await a potential bullish crossover for a trend reversal.

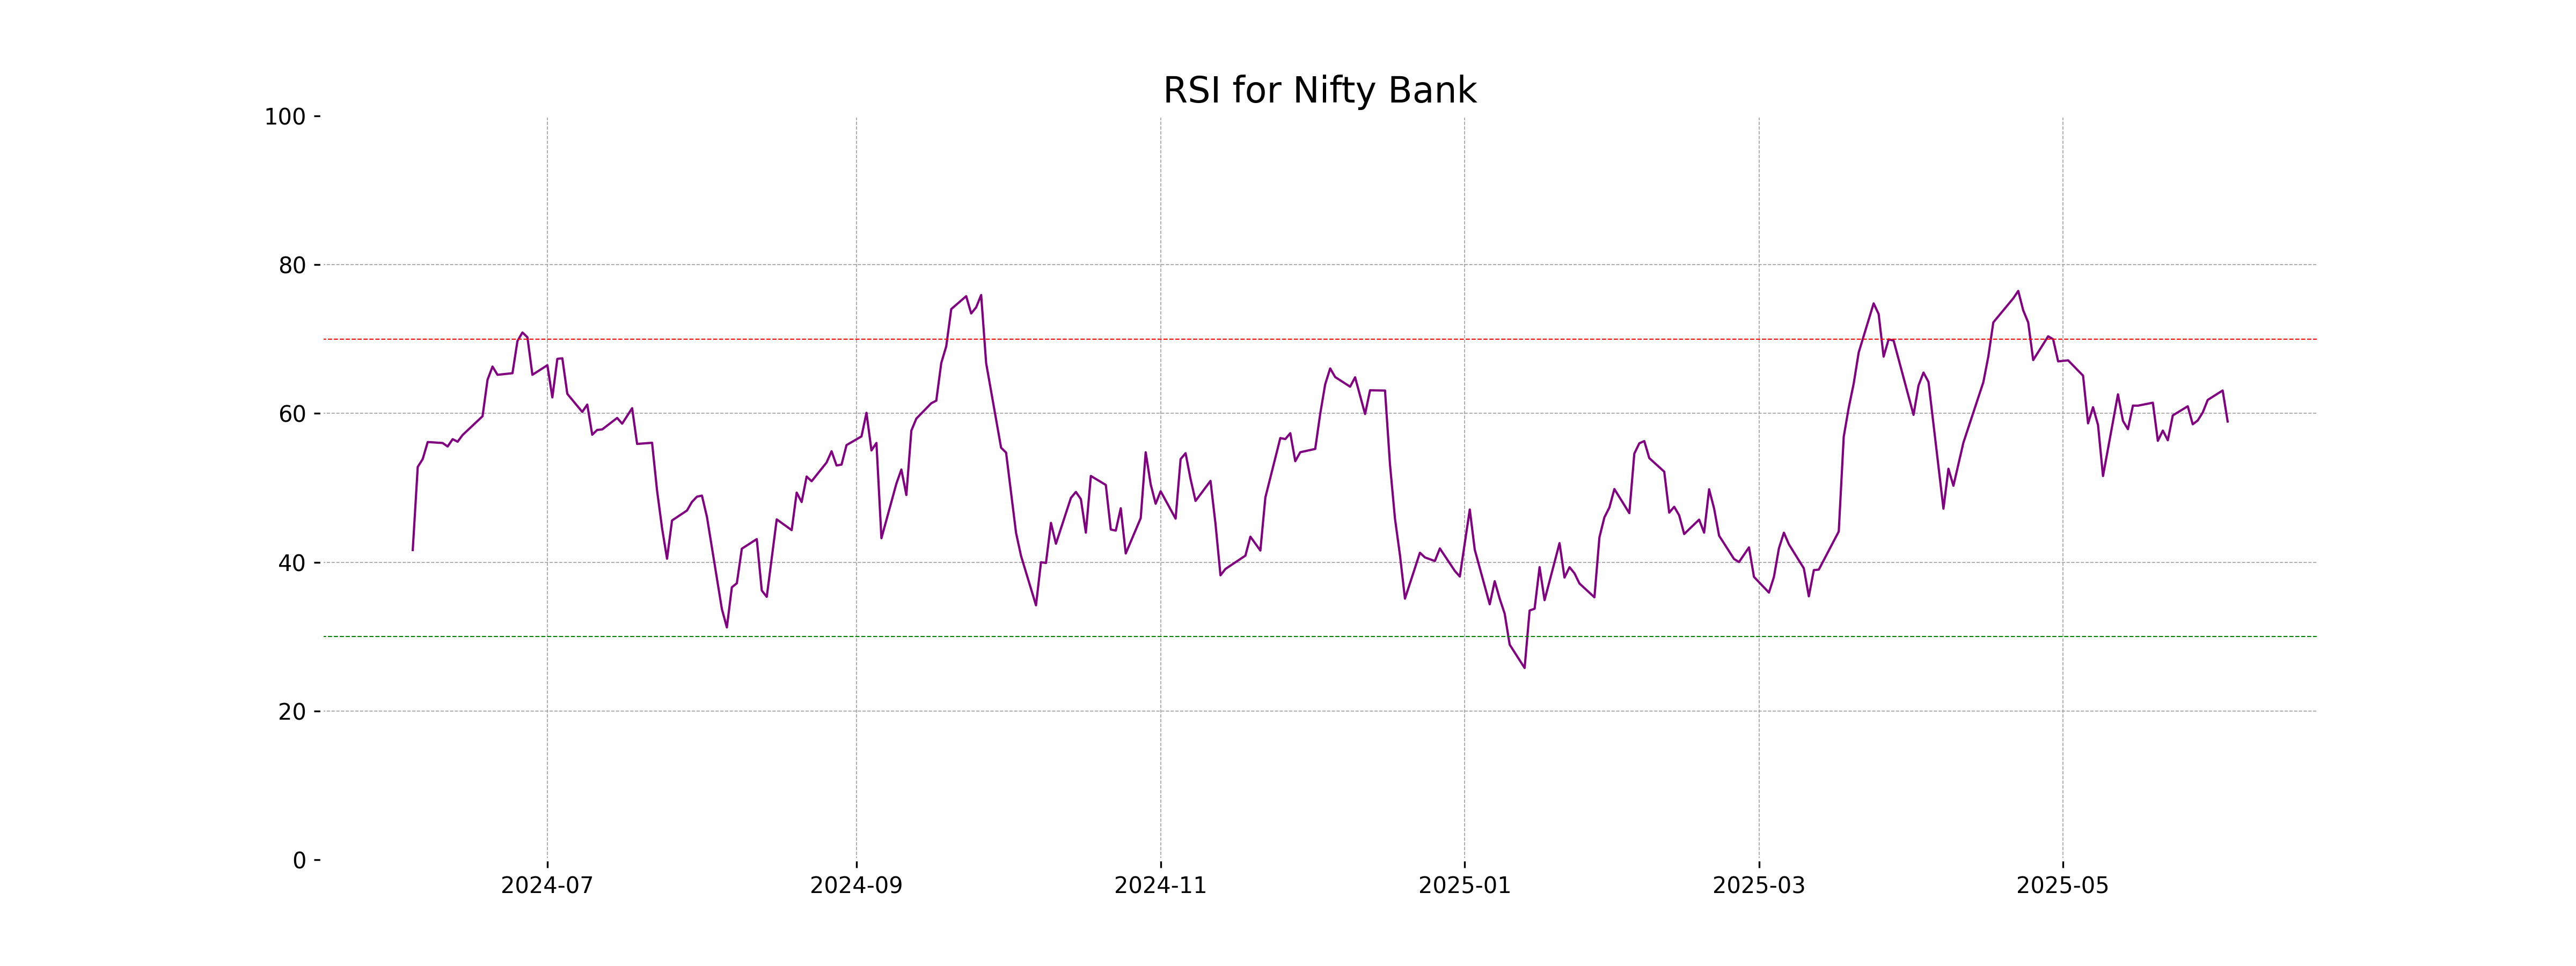
RSI Analysis
The RSI for Nifty Bank is 58.91, indicating a moderately strong market momentum. This suggests that the stock is nearing overbought territory but is not yet at extreme levels. It's essential to monitor for any further increases towards the 70 mark, which could indicate a potential overbought condition.
Analysis for Nifty 50 - June 03, 2025
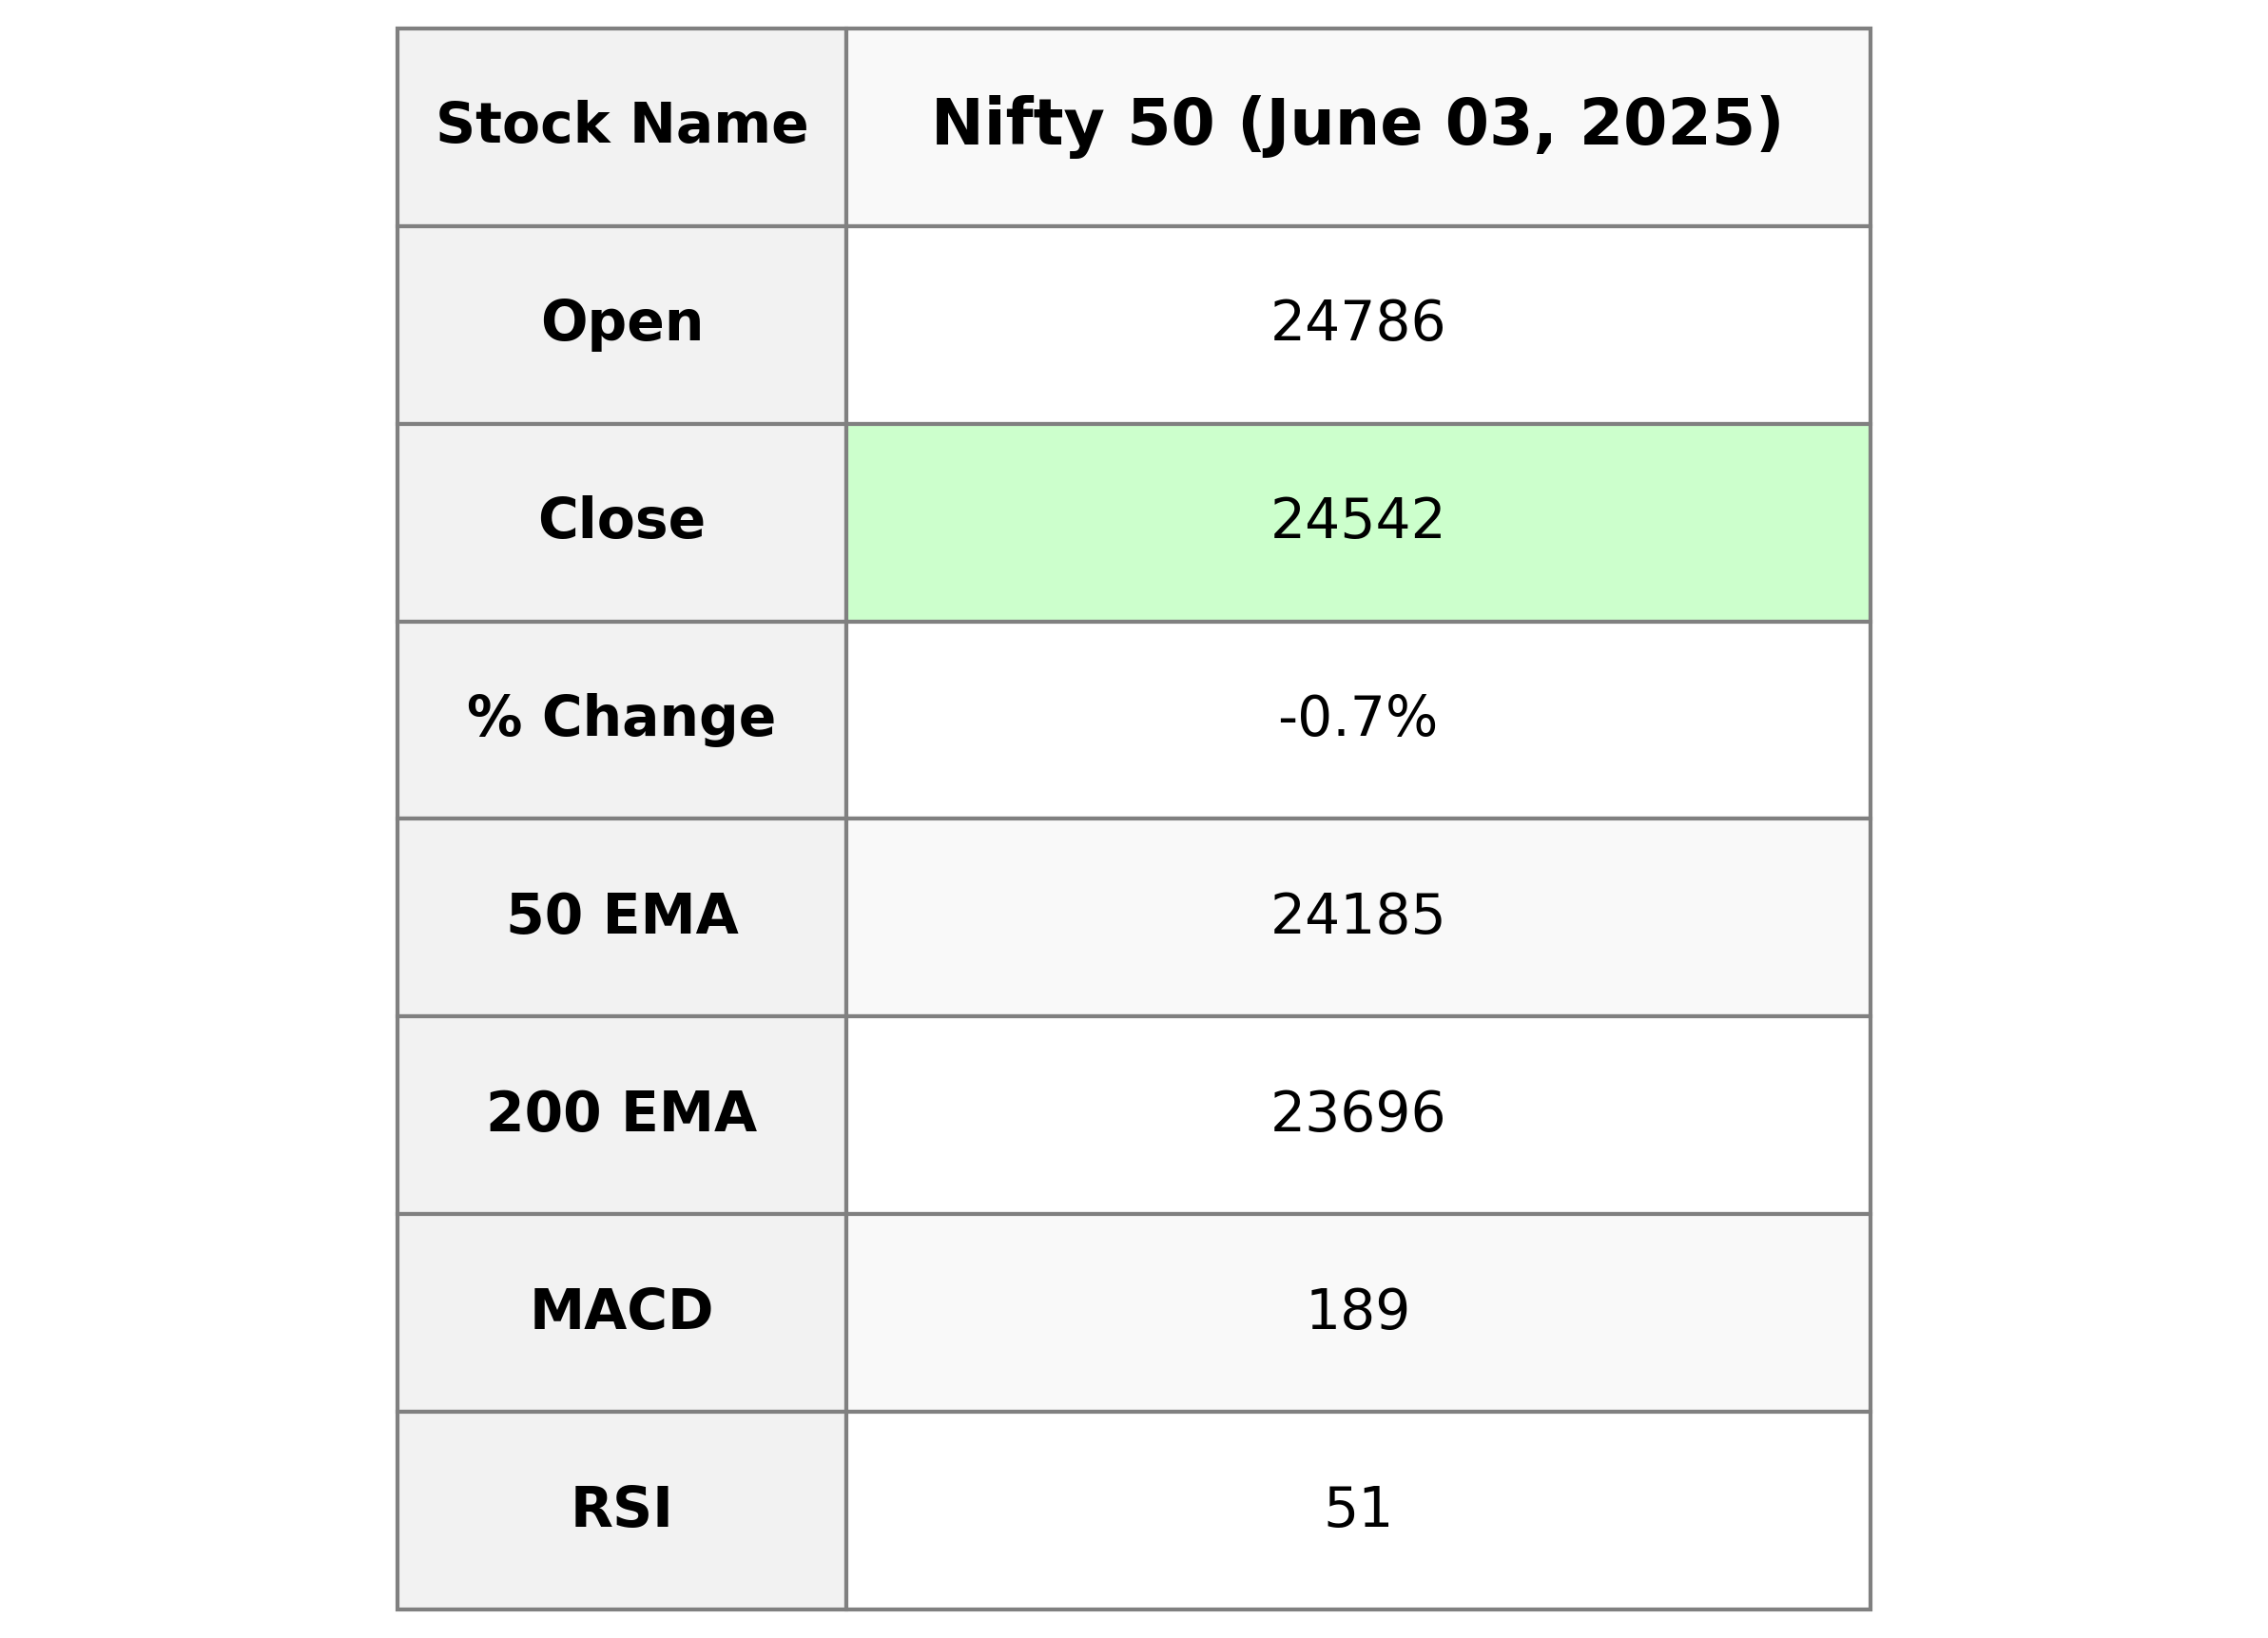
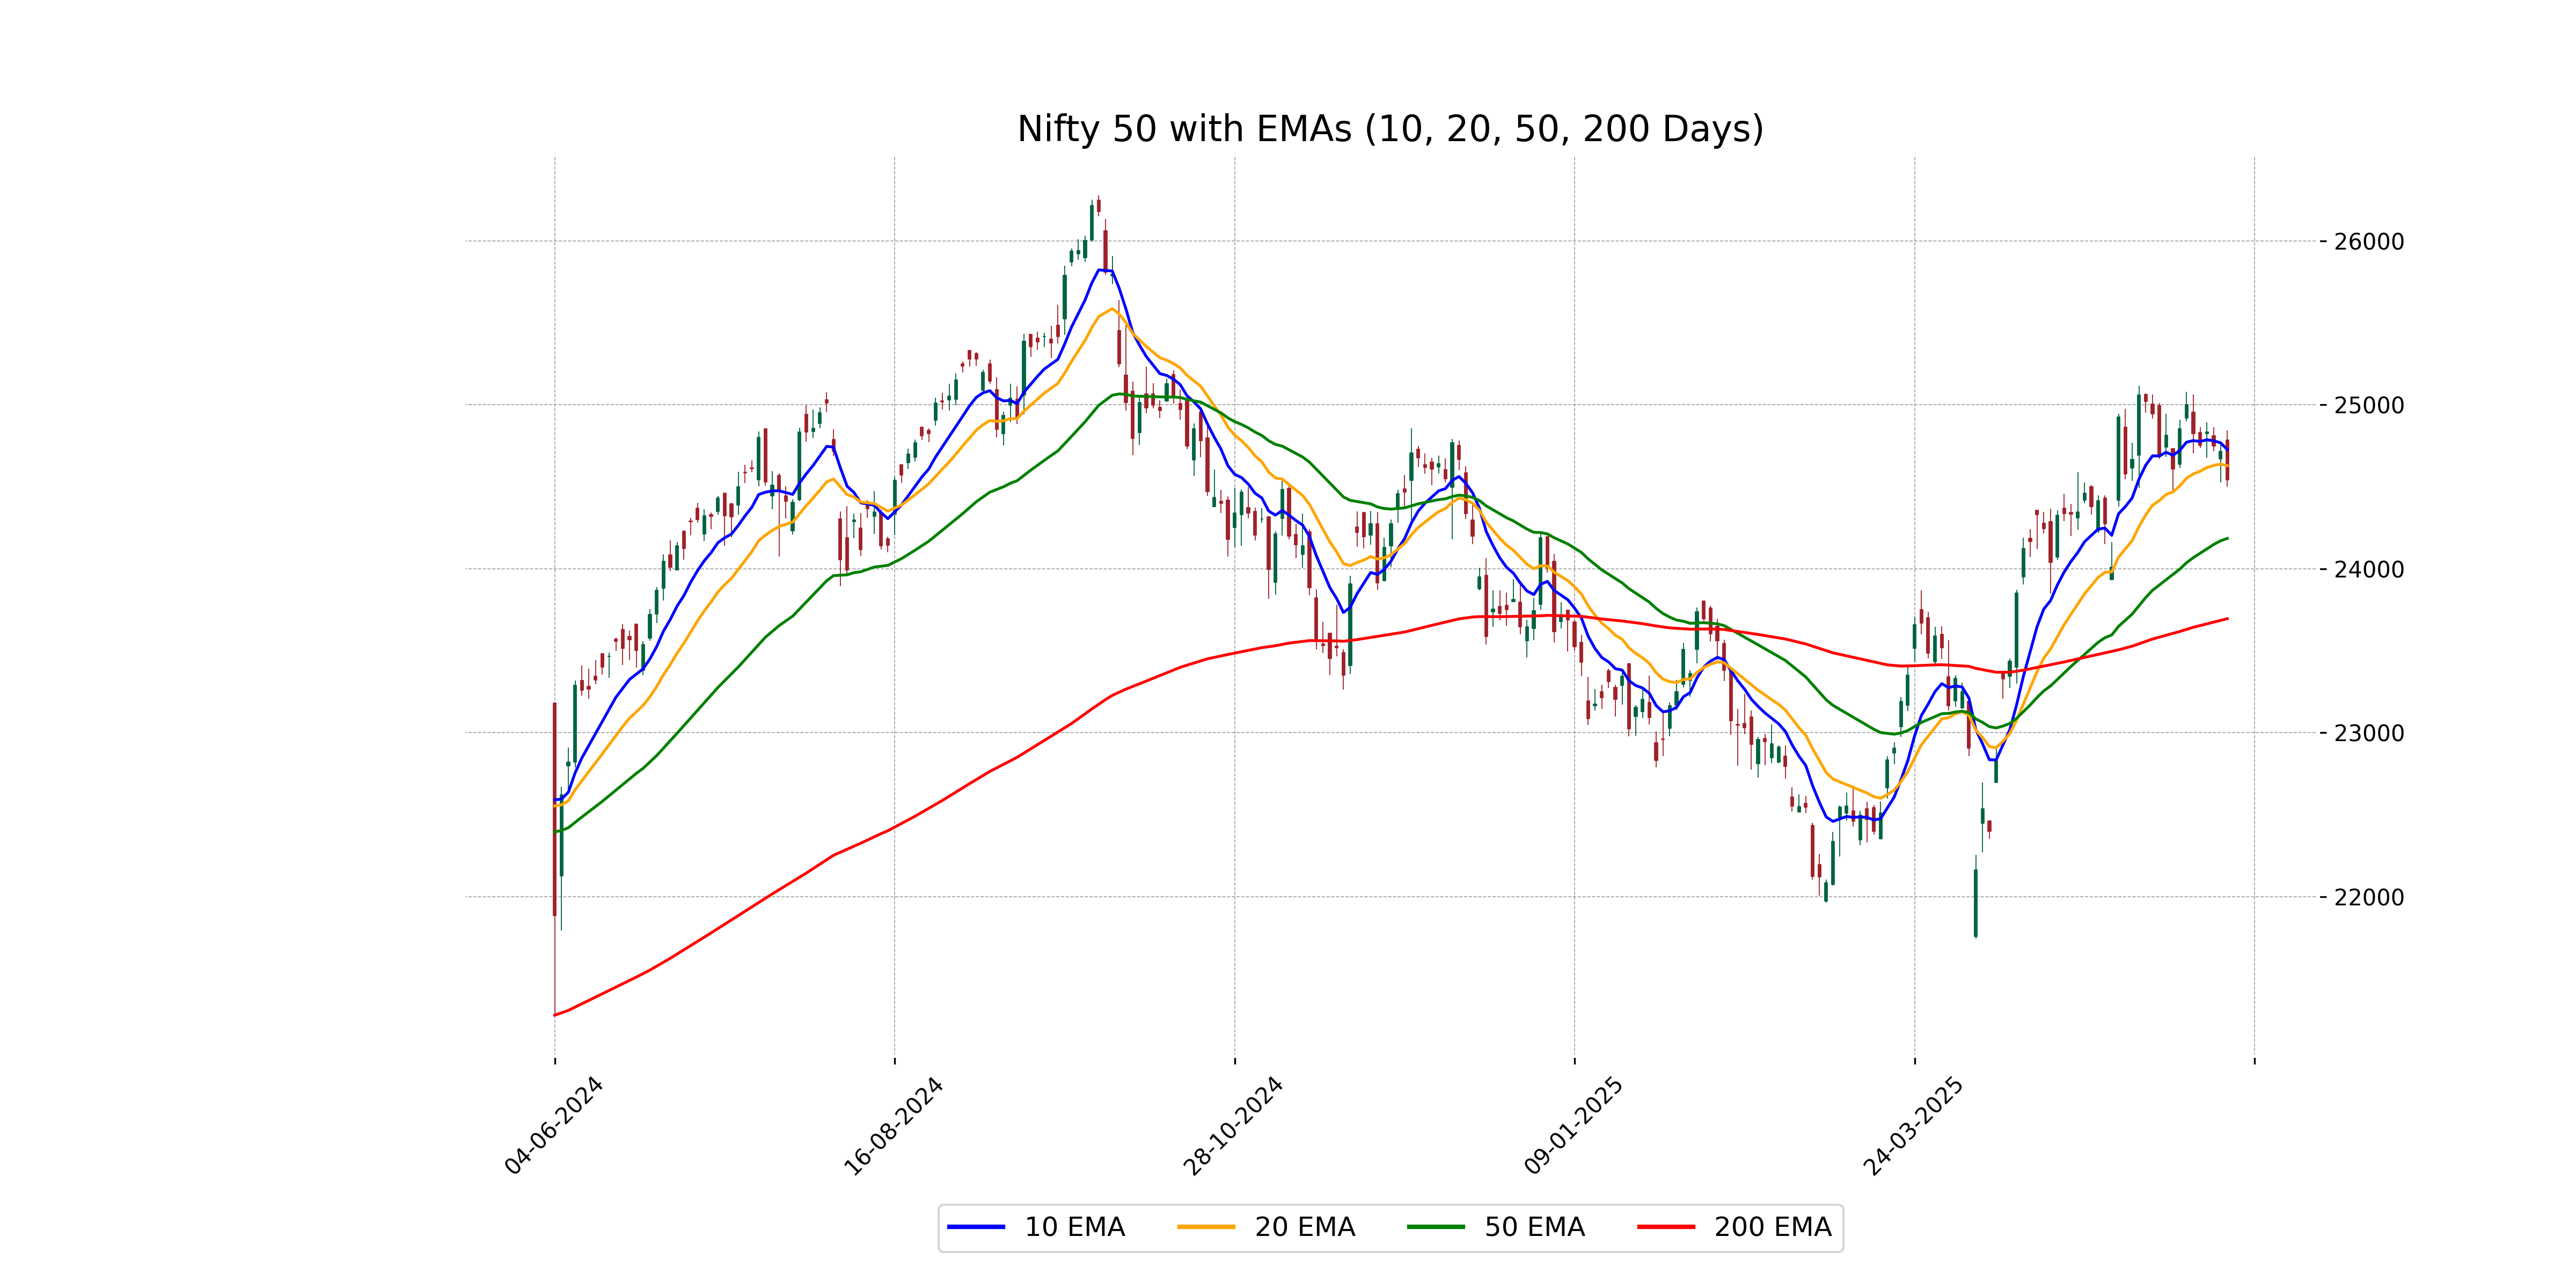
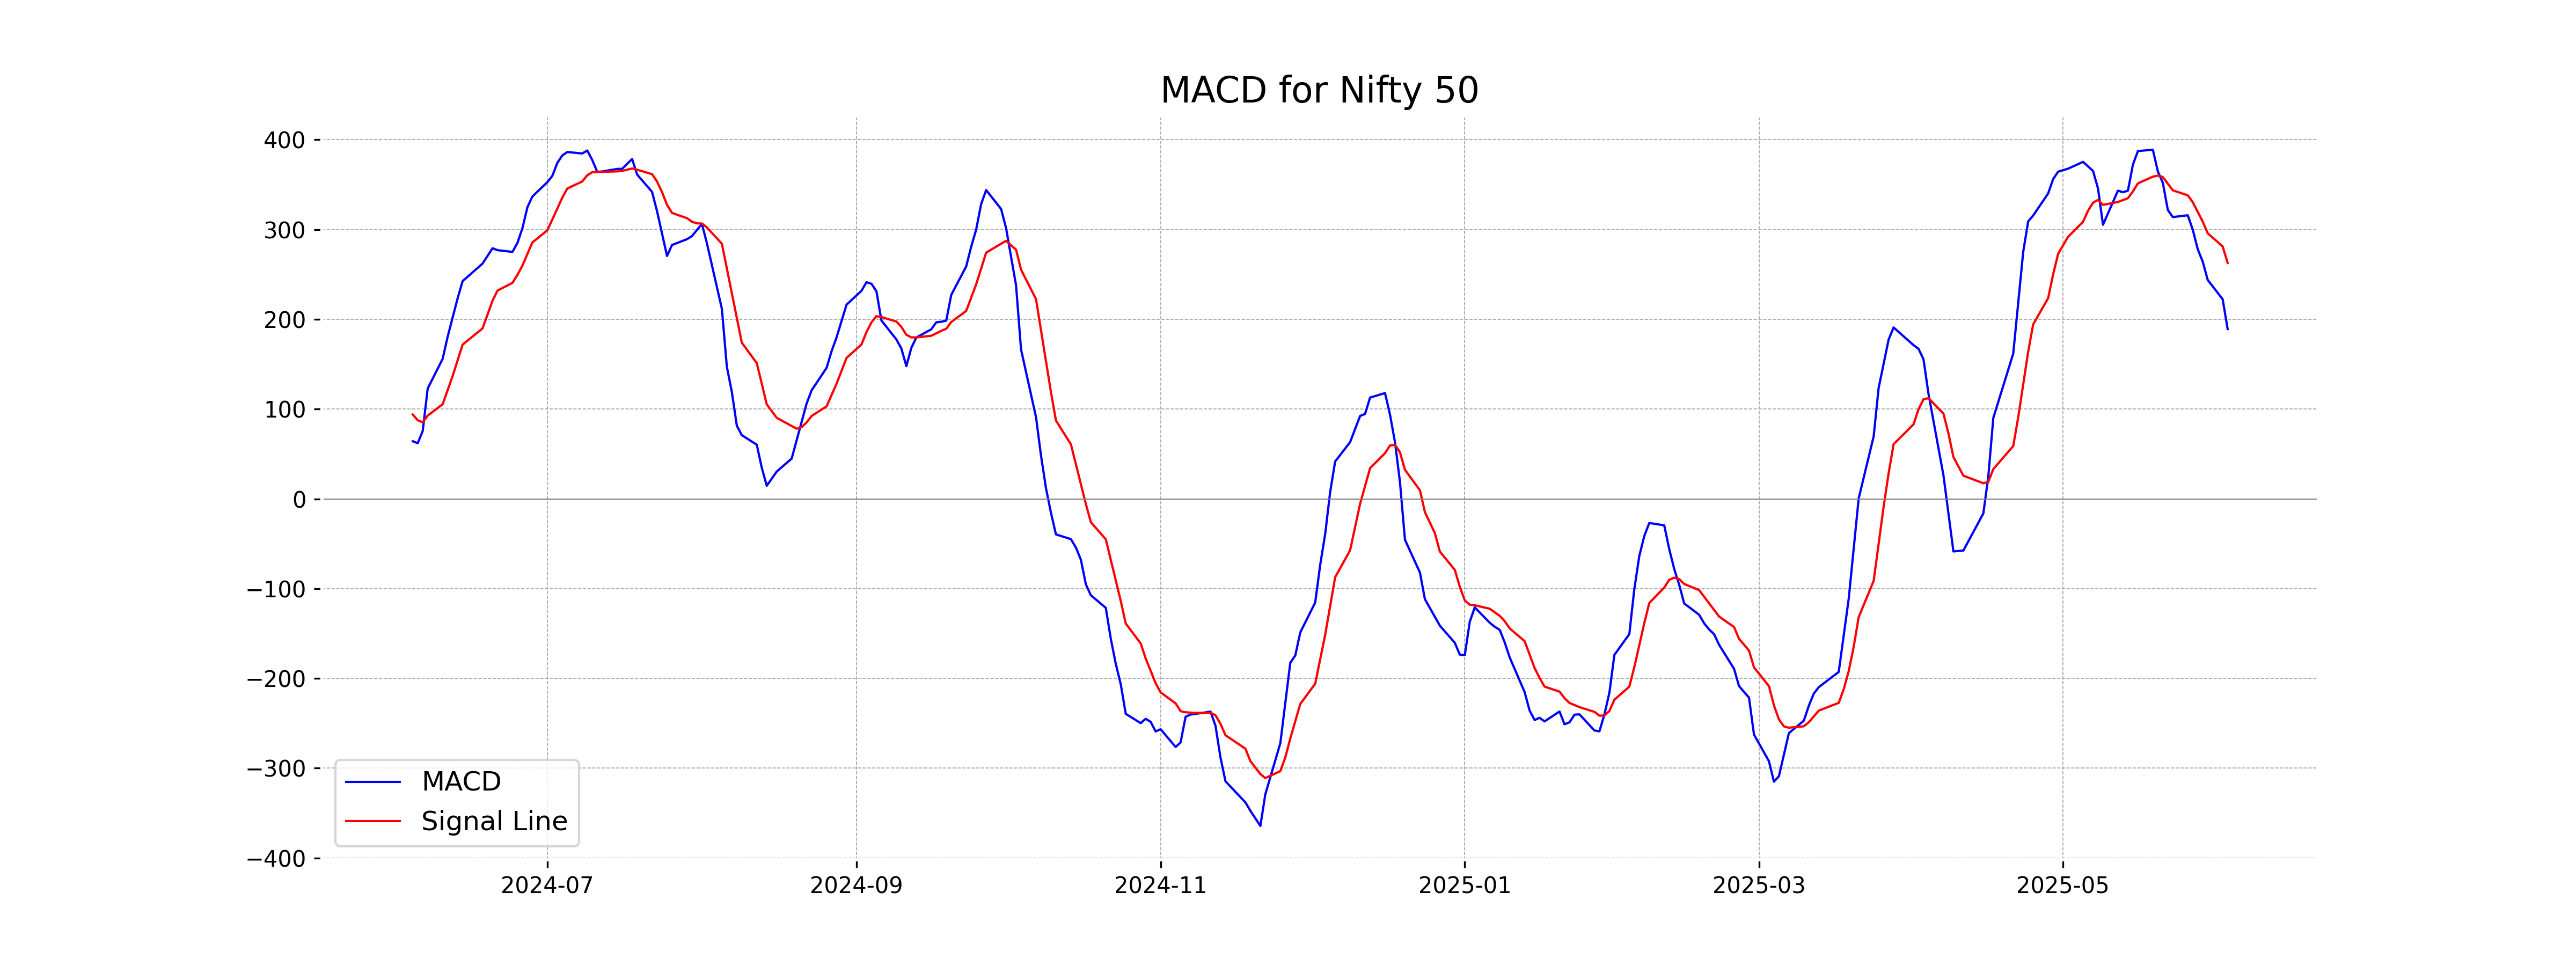
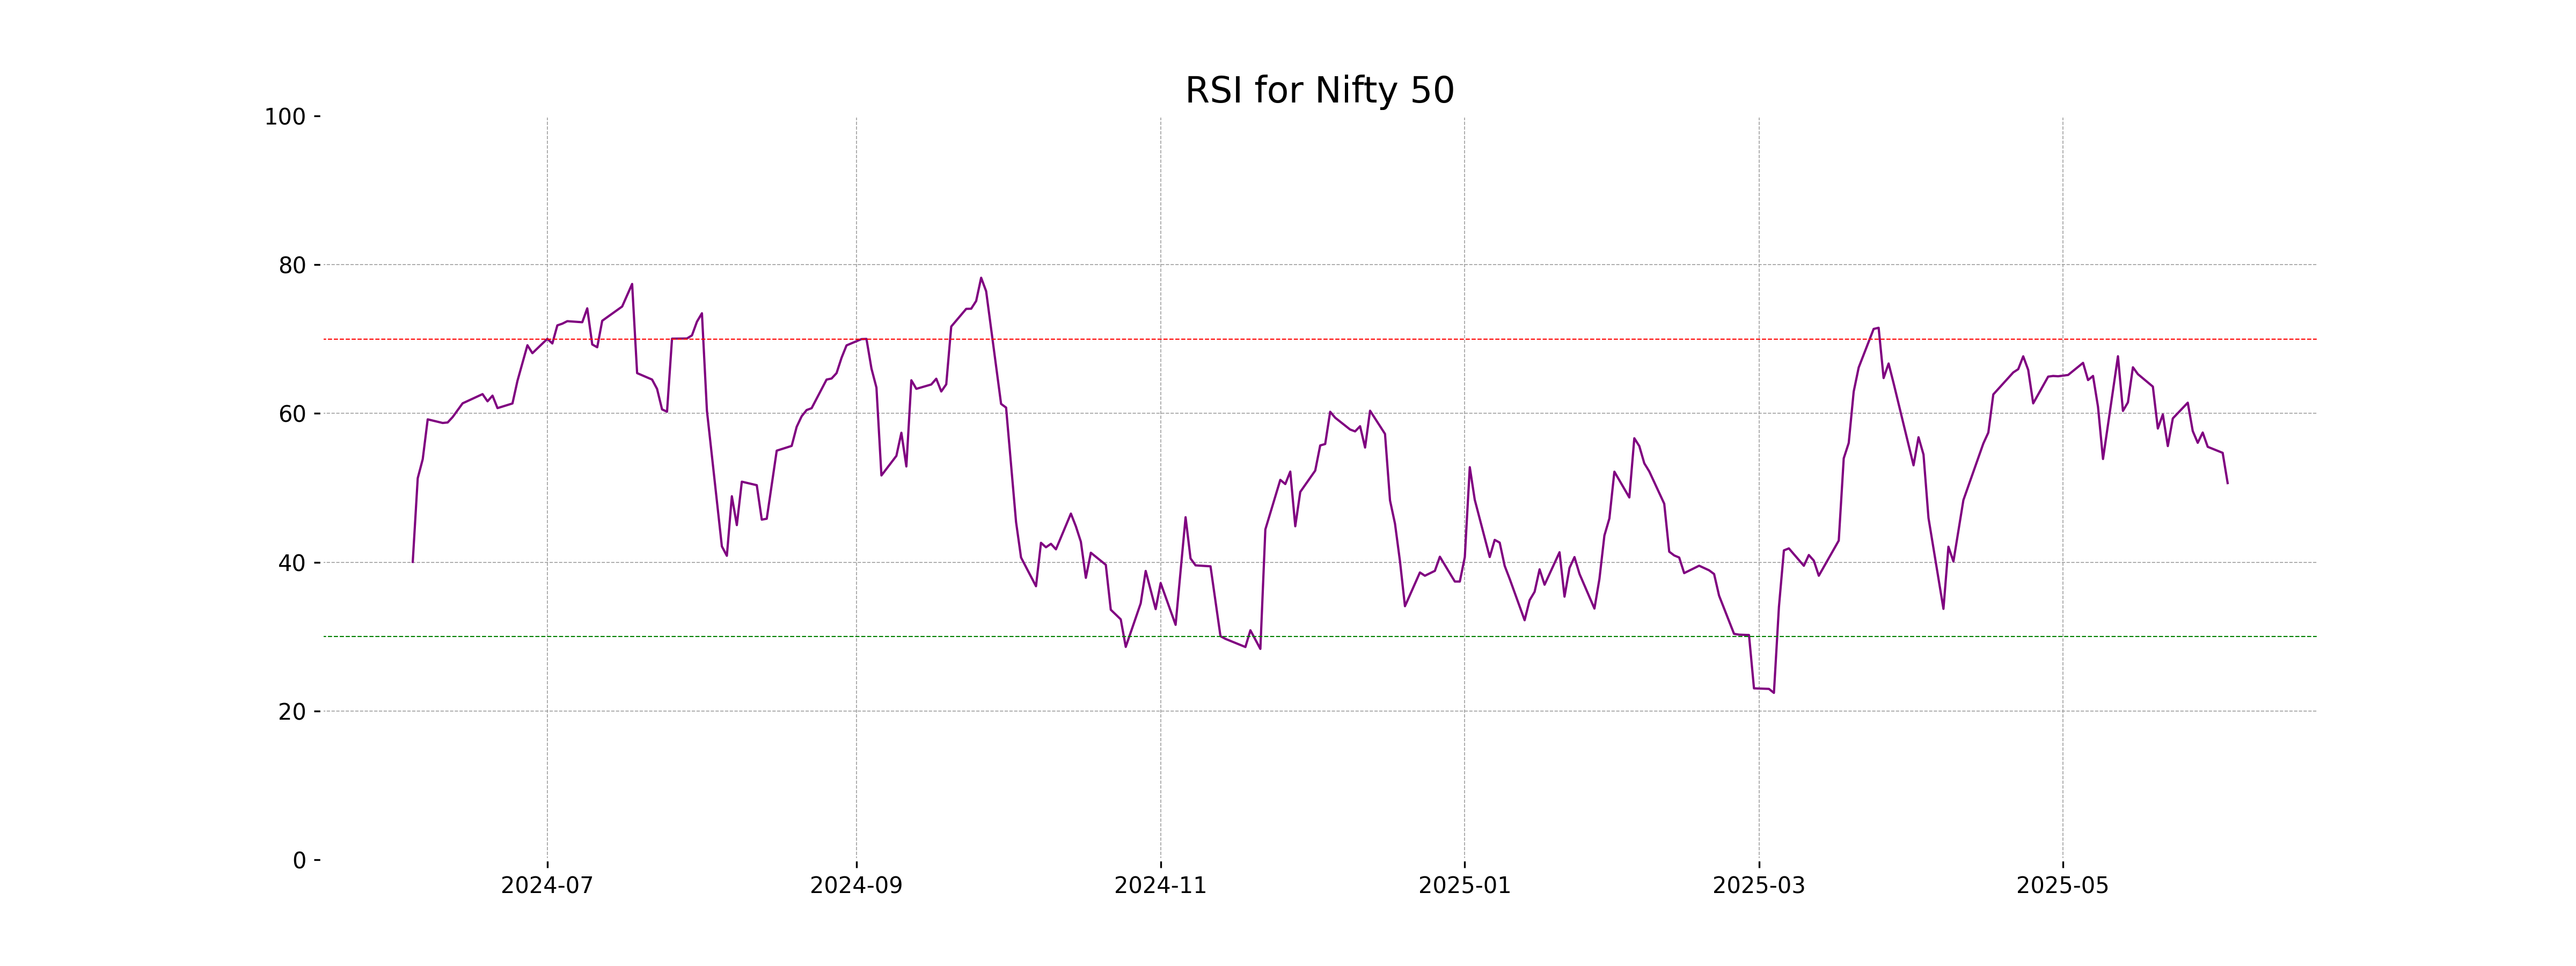
The Nifty 50 opened at 24,786.30, reached a high of 24,845.10, and closed at 24,542.50, which is a decrease of 0.704% from its previous close of 24,716.60. The index experienced a decline, with a points change of -174.10. The RSI is at 50.64, suggesting a neutral stance, while the MACD indicates a bearish trend as it is below the signal line.
Relationship with Key Moving Averages
Nifty 50 closed at 24,542.5, which is below its 10 EMA of 24,727.79, indicating short-term bearishness. It remains above the 50 EMA of 24,185.40 and the 200 EMA of 23,695.69, suggesting a long-term uptrend is still intact despite recent weakness.
Moving Averages Trend (MACD)
The MACD for Nifty 50 is 189.10, which is below the MACD Signal line of 262.76, indicating a bearish momentum. The negative points change of -174.10 and a declining % Change of -0.70% align with this bearish signal.
RSI Analysis
The Relative Strength Index (RSI) for Nifty 50 is at 50.64, indicating a neutral momentum in the market. With an RSI close to 50, it suggests a balance between buying and selling pressures, implying neither overbought nor oversold conditions.
Up Next

Indian stock market sector-wise performance today - June 03, 2025

Step-by-step guide to apply for a mortgage loan online with minimal documentation

Honda Activa 6G: Everything You Need to Know Before Buying

How much does a ULIP plan really cost? A break-down of all charges

Centre plans to borrow Rs 8.20 lakh cr from market in first half of FY27

Reliance denies buying Iranian oil amid US sanctions waiver

More videos

Premium petrol price up Rs 2, industrial diesel up Rs 22; no change in normal petrol, diesel rates

India's GDP expected to register over 8 pc growth in Sep-Dec: Report

Govt announces seven measures to help boost exports

RBI keeps interest rates on hold after US trade deal boosts outlook

RBI proposes to compensate customers up to Rs 25,000 loss due to fraud

RBI raises GDP growth projection of Q1, Q2 of FY27

RBI pauses rate cuts, retains interest rate at 5.25 pc

Rupee jumps 122 paise to close at 90.27 against US dollar on India-US trade deal

Stock markets cheer India-US trade deal: Sensex, Nifty surge 2.5 pc

UPI transactions hit record high of Rs 230 lakh crore in 2025-26 till Dec: Govt