


Highlights
- Sensex, Nifty 50 close below key EMAs
- Nifty Metal and IT lead sectoral losses
- RSI indicates oversold signals in multiple indices
Latest news

India's semiconductor push gains momentum as Odisha signs chip technology MoU with Intel, 3DGS

ScamMukt Launches India's Dedicated AI Scam Protection App -- Because Spotting a Scam Is Now a Basic Survival Skill for Every Indian

Lakshya Powertech Limited Announces H2 FY26 and FY26 Results

Delhi HC issues summons, signals interim protection for actor Naga Chaitanya's personality rights

Why My Interior Designers Is Becoming Relevant to Both Interior Seekers and Interior Professionals in India

Subhash Ghai shares glimpse from Salman Khan's 'Maatrubhumi' screening, wishes him "grand success"

boAt launches India's first Type-C charging Smartwatch lineup

Tim Hortons® India Introduces All-New Refreshing Matcha Coolers
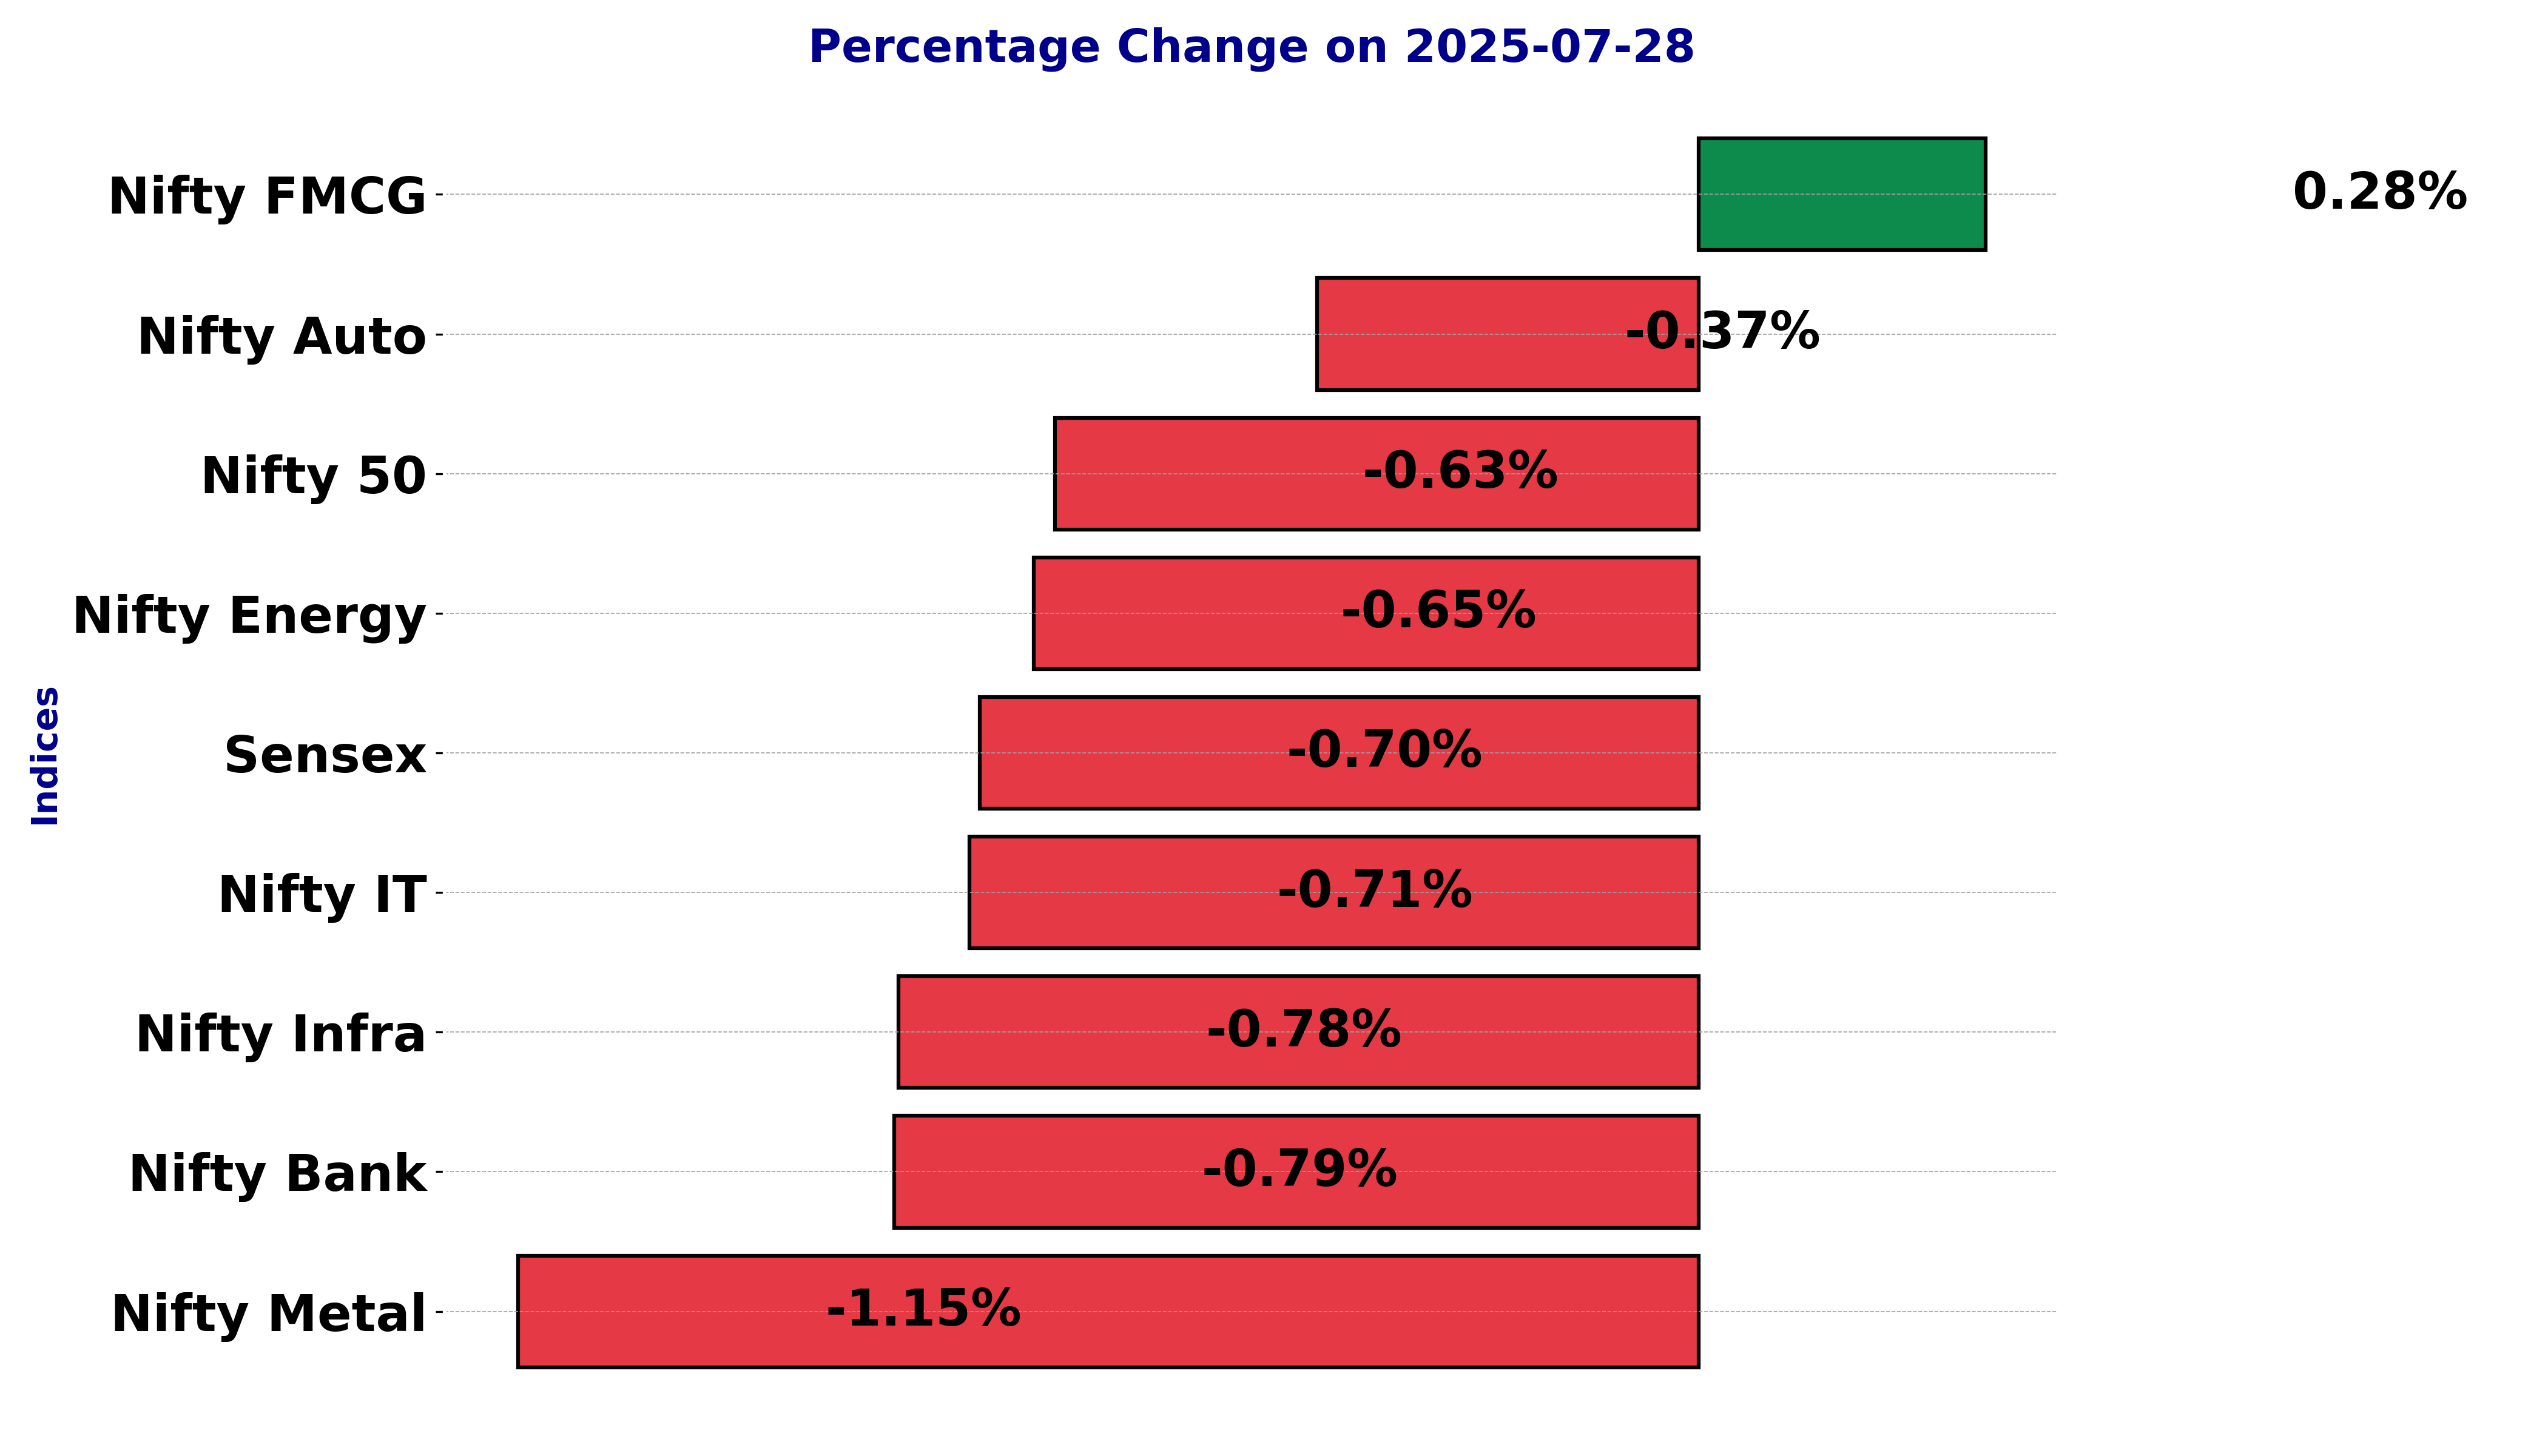
Indian stock market sector-wise performance today - July 28, 2025


The Indian stock market on Monday (July 28, 2025) witnessed mixed movements across various indices, with several sectors experiencing notable changes in their percentage values.
Among the key indices, the S&P BSE Sensex saw a decline of 0.70%, closing at 80,891.02. Nifty Auto also registered a slight dip of 0.37% to finish at 23,693.
Meanwhile, the Nifty Energy index fell by 0.65%, ending at 35,021.55. On a more positive note, Nifty FMCG displayed a modest increase of 0.28%, closing at 54,732.95, indicating some resilience in the fast-moving consumer goods sector.
In contrast, the Nifty Infra experienced a decrease of 0.78%, closing at 8,995.65. A significant movement was observed in the Nifty IT index, which dropped by 0.71%, ending the session at 35,370.05.
Meanwhile, the Nifty Metal index showed the steepest decline, falling by 1.15% to close at 9,316.45, marking it as the most negatively impacted sector of the day.
The banking sector, represented by Nifty Bank, also declined by 0.78%, with a closing value of 56,084.90.
Lastly, the Nifty 50 index closed at 24,680.90, experiencing a reduction of 0.63%. The most affected sector, Nifty Metal, experienced a decline of over 1%.
This downturn could be attributed to external factors such as global commodity price fluctuations and concerns over demand from key markets, which often play a crucial role in determining the performance of the metal sector.
Additionally, a strong or fluctuating currency can impact export-related earnings, adding to investor concerns.
Overall, the day's market activity reflected a cautious sentiment among investors, with sectors like FMCG showing slight gains, while sectors sensitive to global economic conditions, such as metals, faced more substantial declines.
As market participants continue to navigate external economic influences, these trends highlight the importance of sector-specific factors in shaping overall market performance.
Analysis for Sensex - July 28, 2025
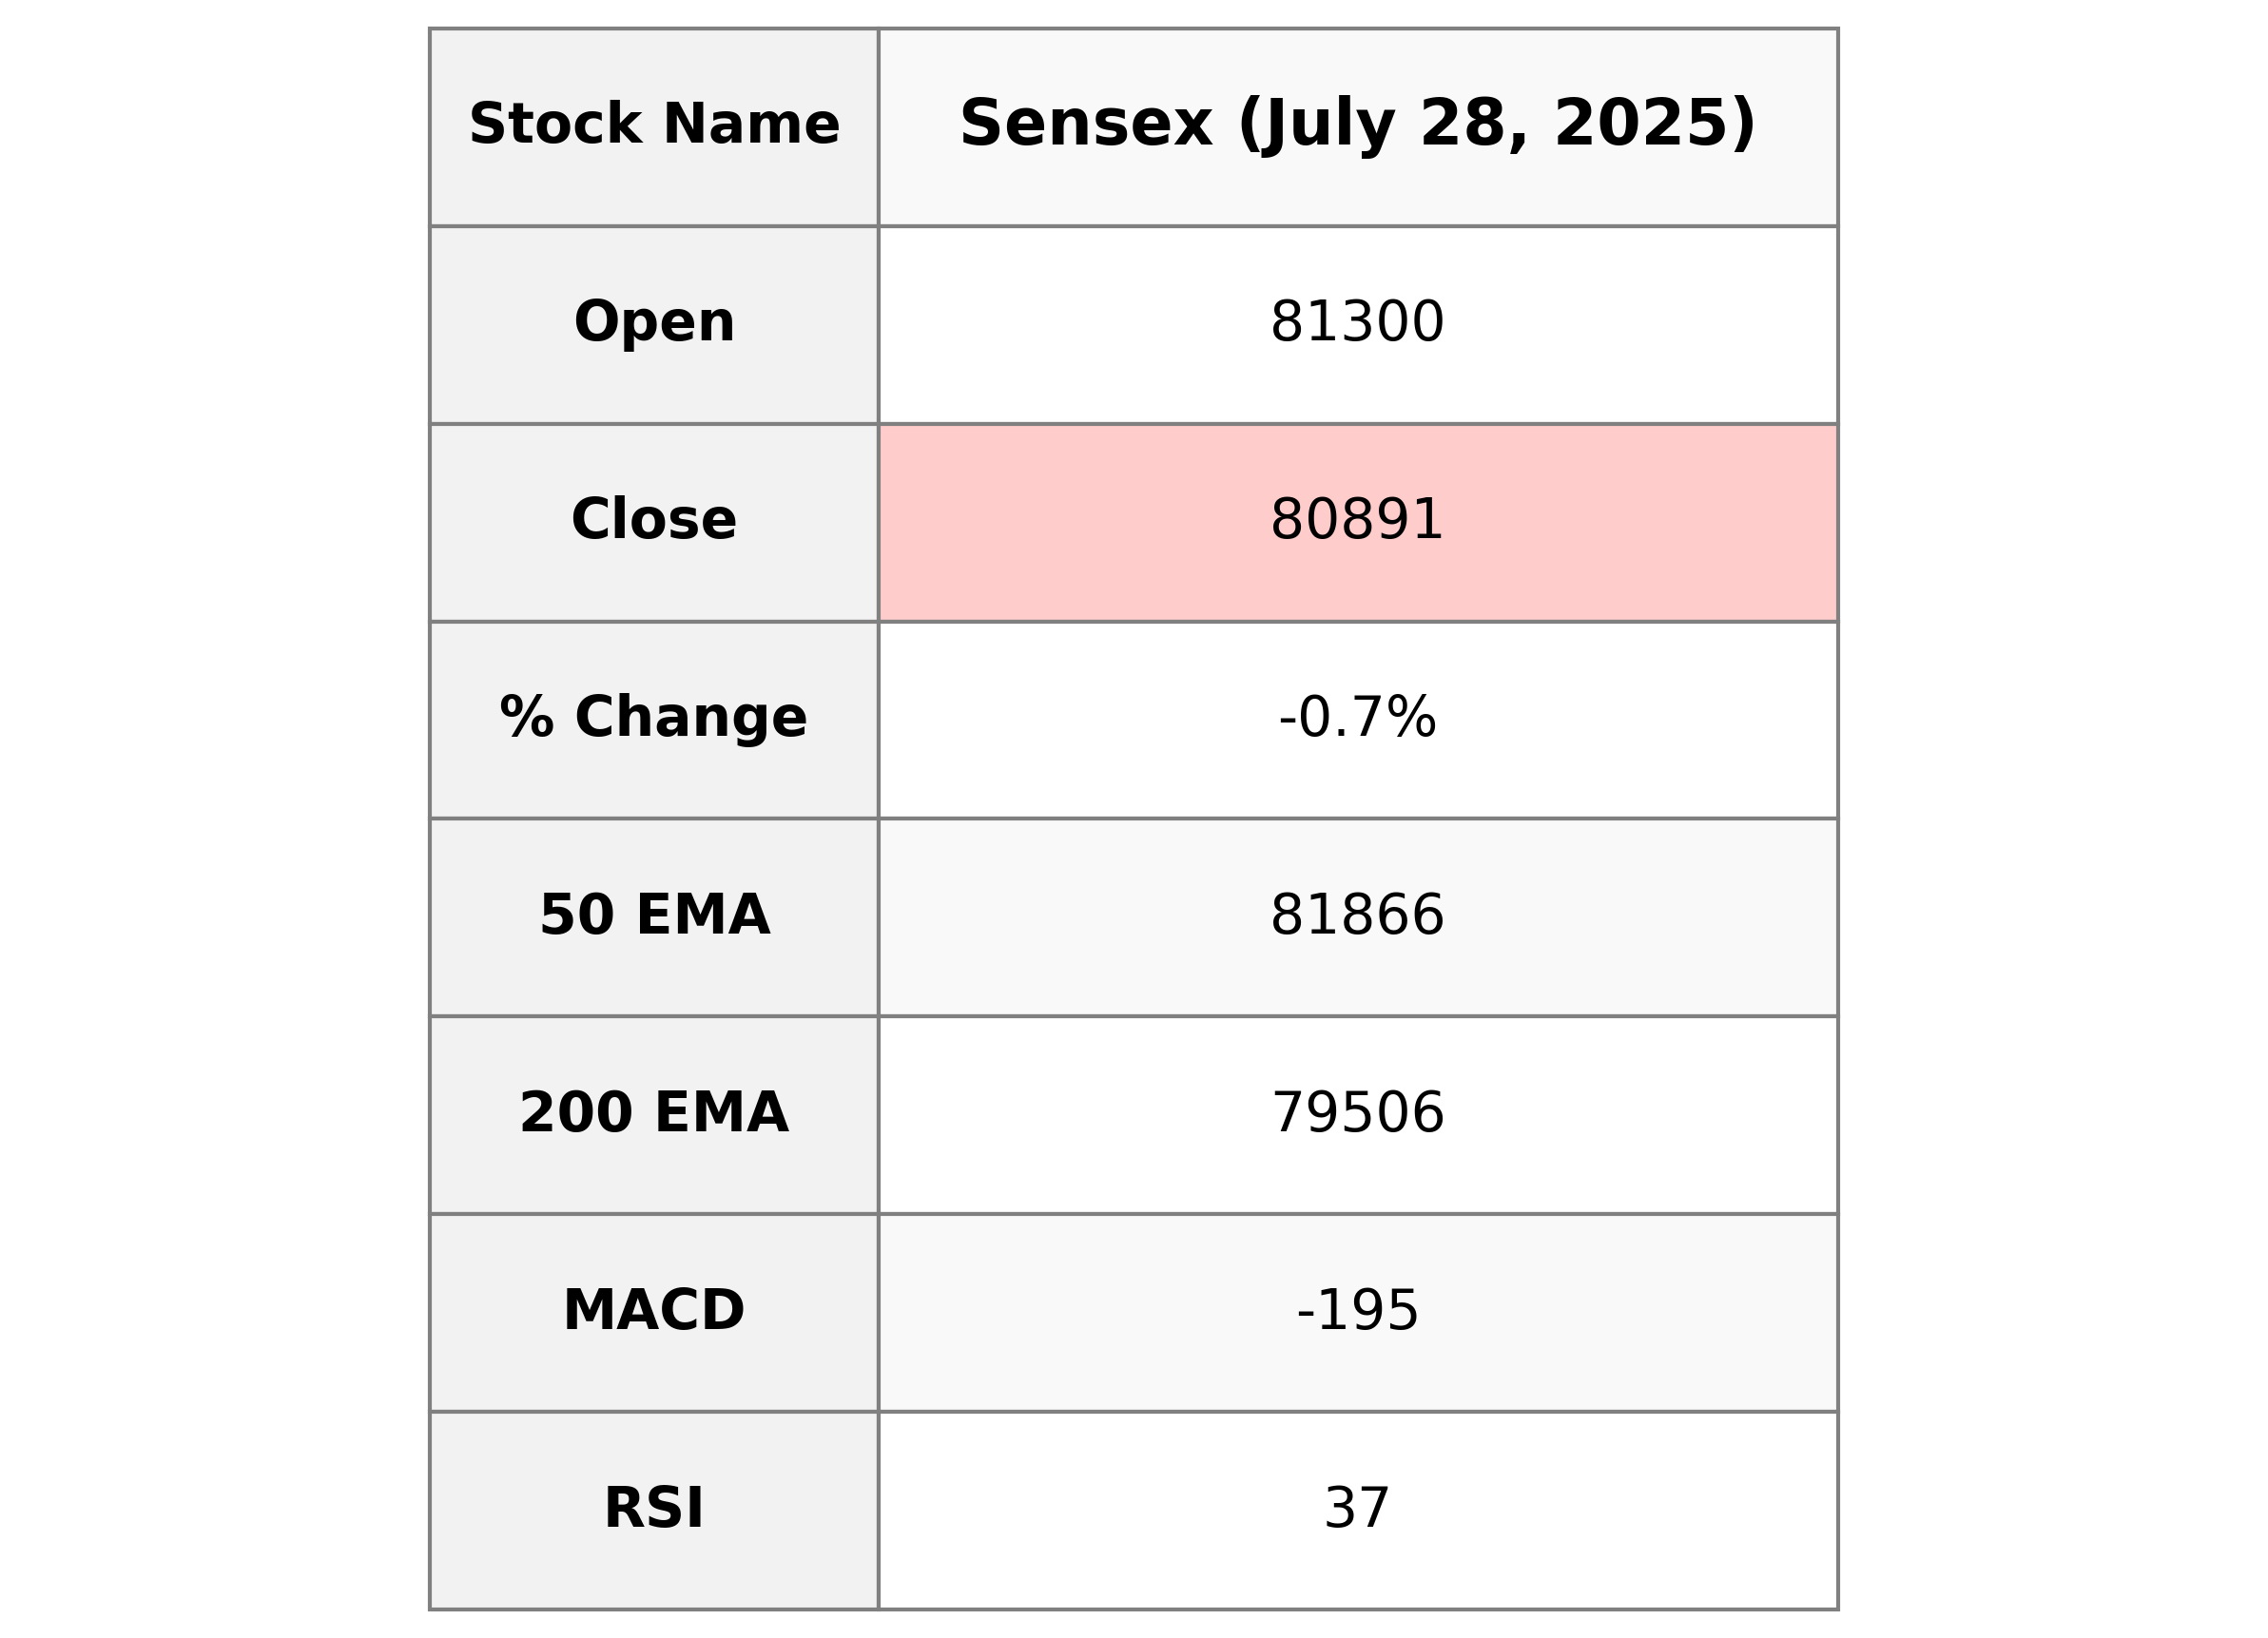
Sensex Performance The Sensex opened at 81299.97 and closed lower at 80891.02, indicating a decrease of 572.07 points, or a -0.70% change from the previous close of 81463.09. With key indicators such as the RSI at 36.73 suggesting a bearish sentiment, and the MACD at -195.40 showing a negative trend below the signal line, the market appears to be under pressure.
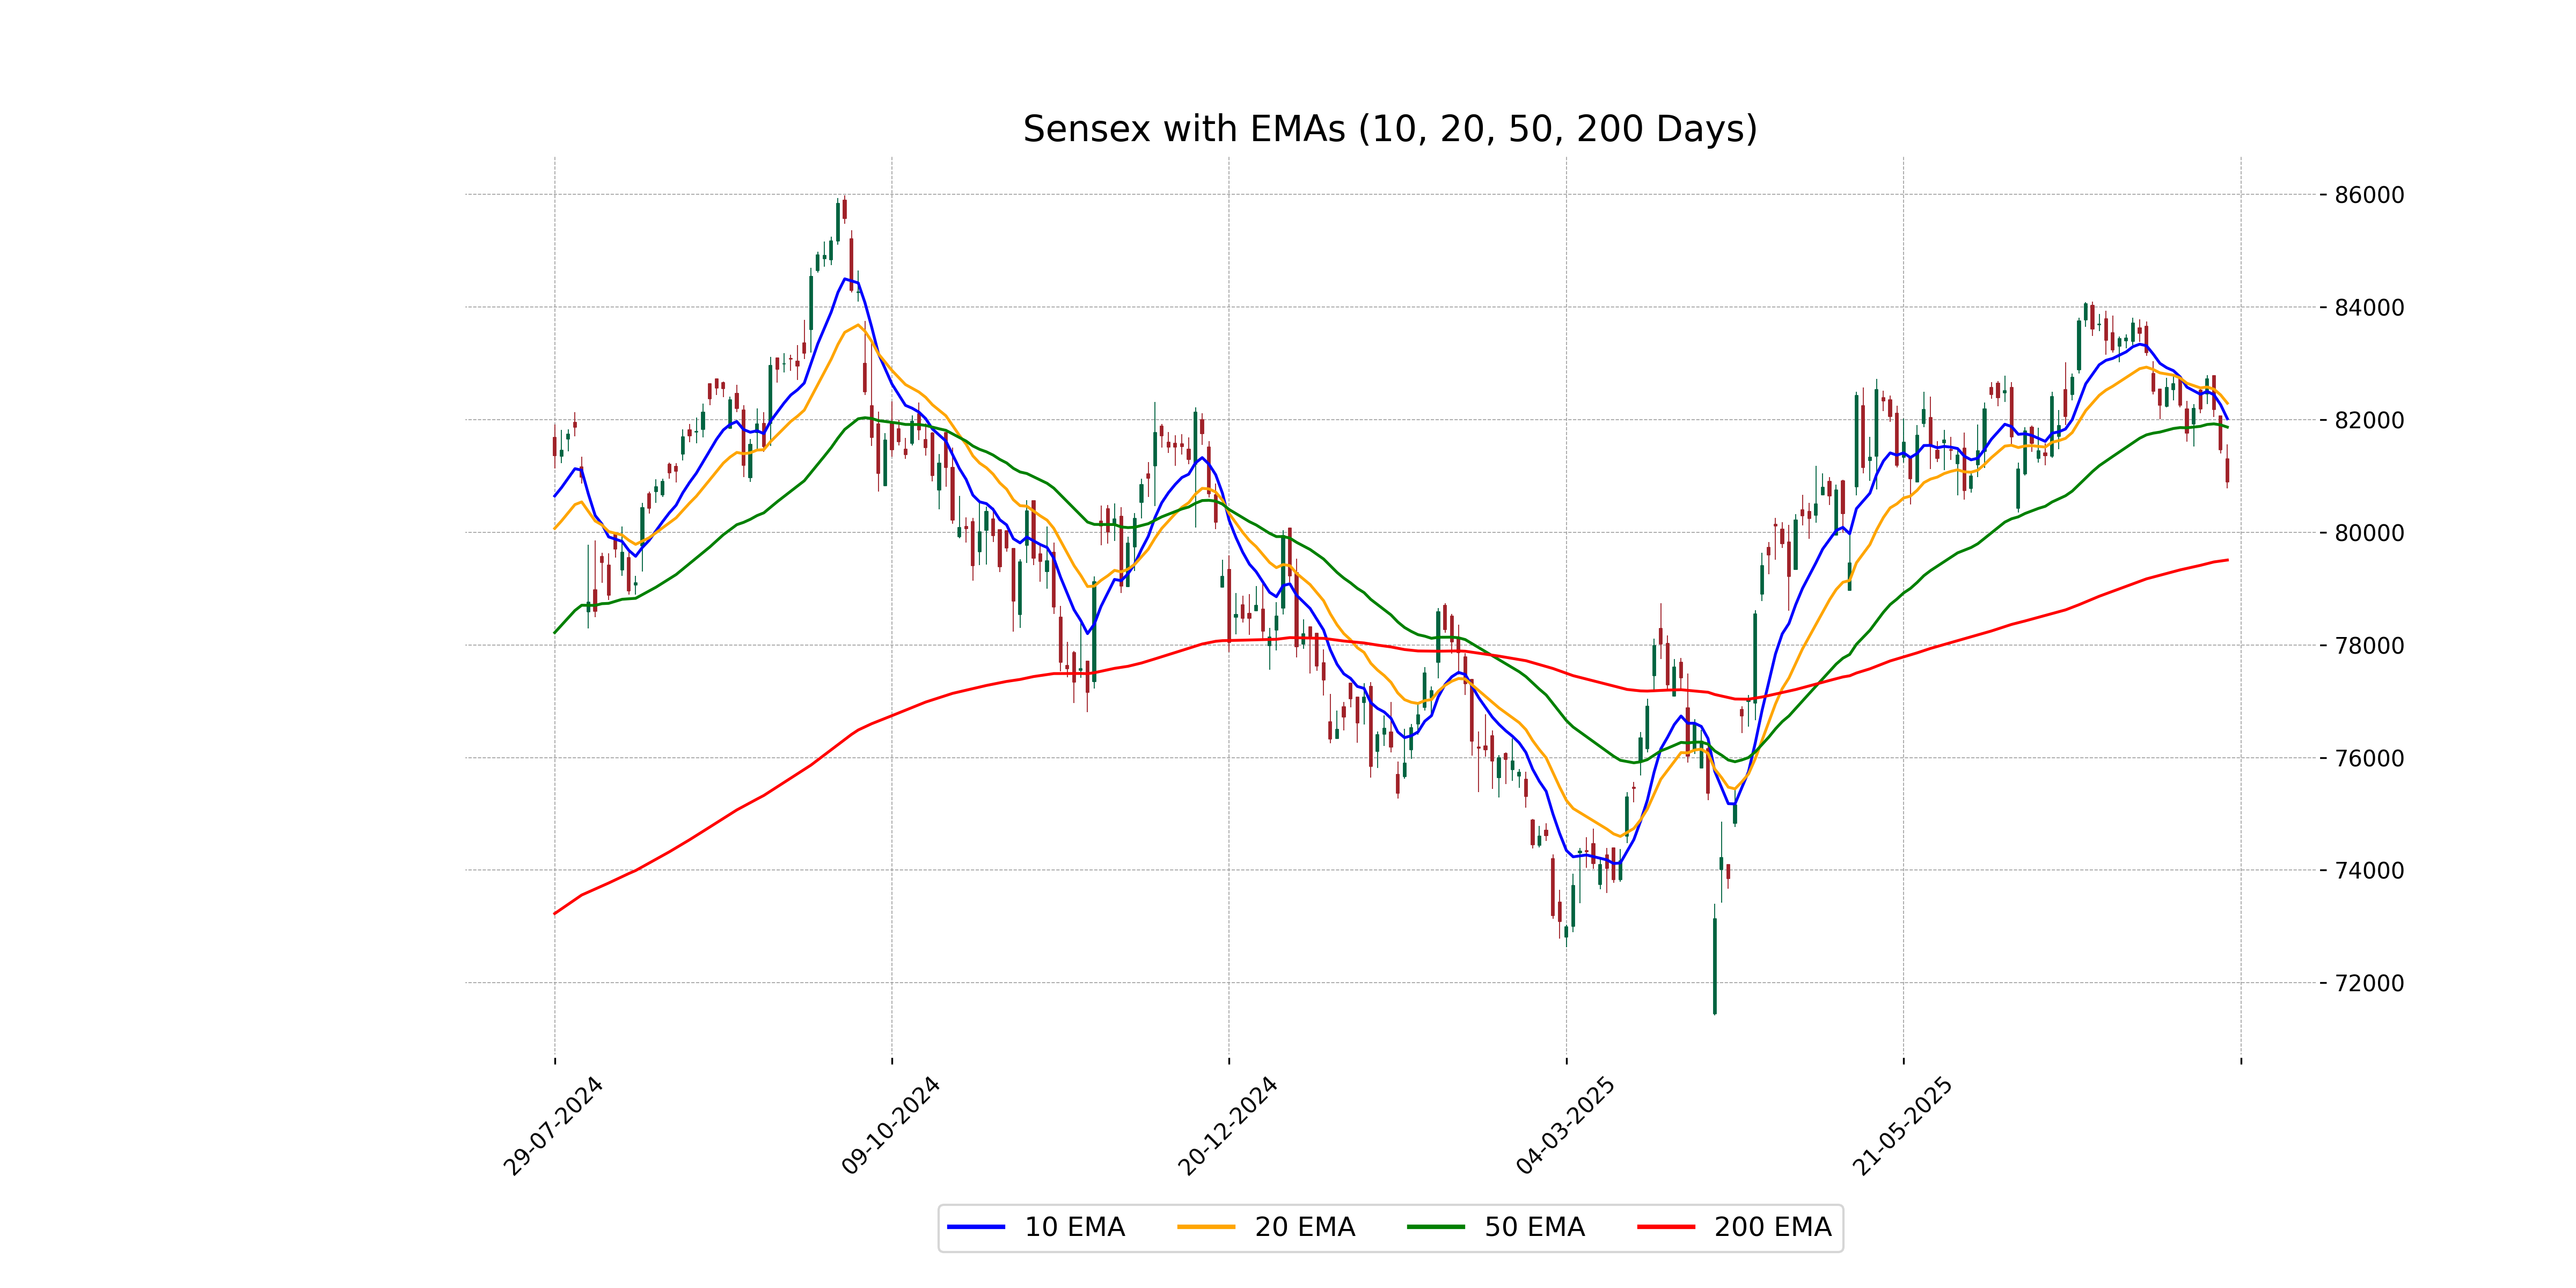
Relationship with Key Moving Averages
The Sensex closed below its 10-day, 20-day, and 50-day EMAs, indicating a bearish sentiment with the 10 EMA at 82014.71, 20 EMA at 82291.01, and 50 EMA at 81866.27. Additionally, the current RSI is 36.73, suggesting it is approaching an oversold region.
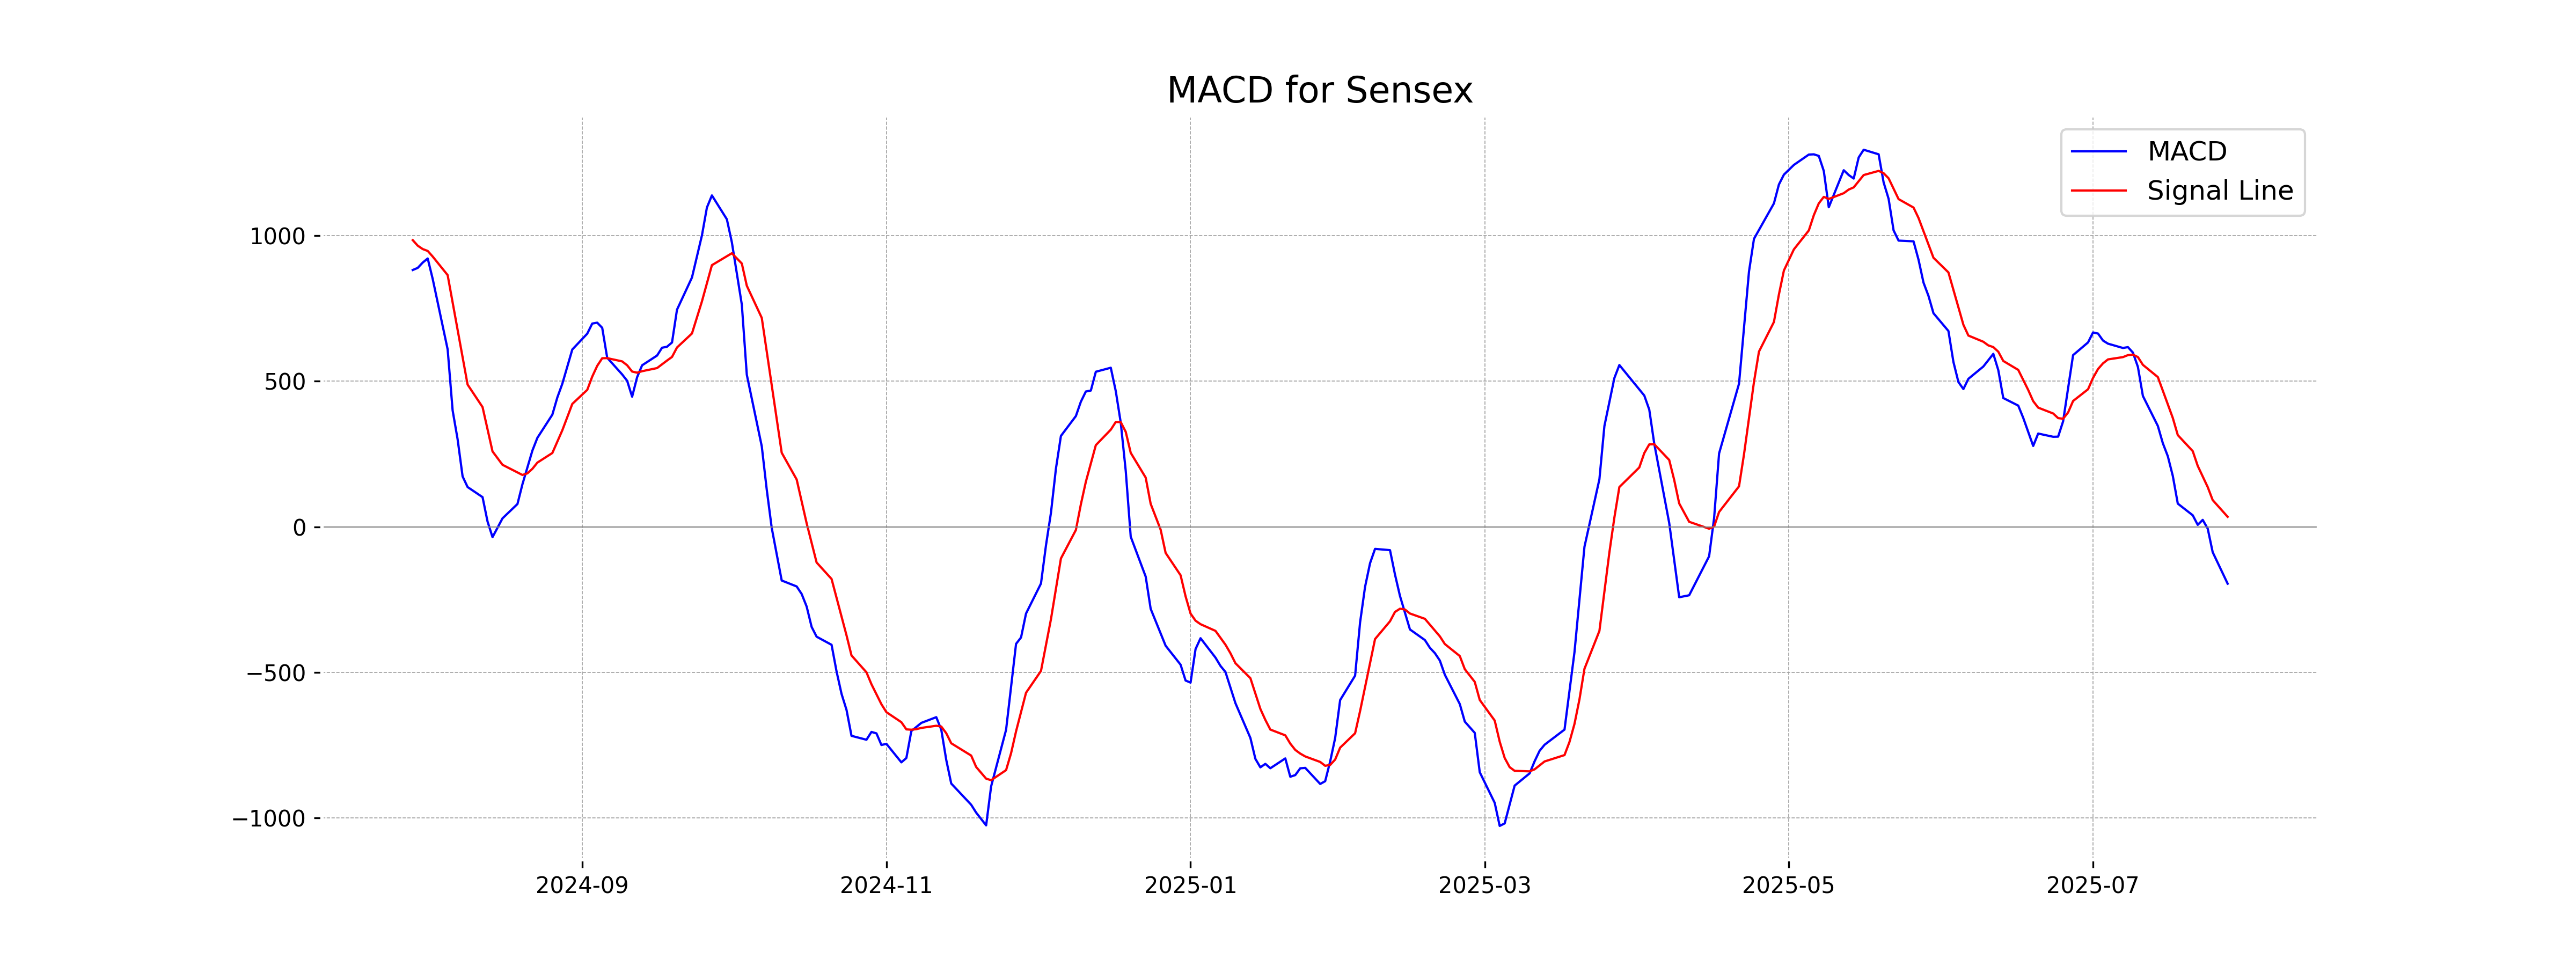
Moving Averages Trend (MACD)
Sensex MACD Analysis: The MACD value of -195.40 indicates a bearish trend, as it is below the MACD Signal line of 34.23. This suggests potential further downward movement in the Sensex.
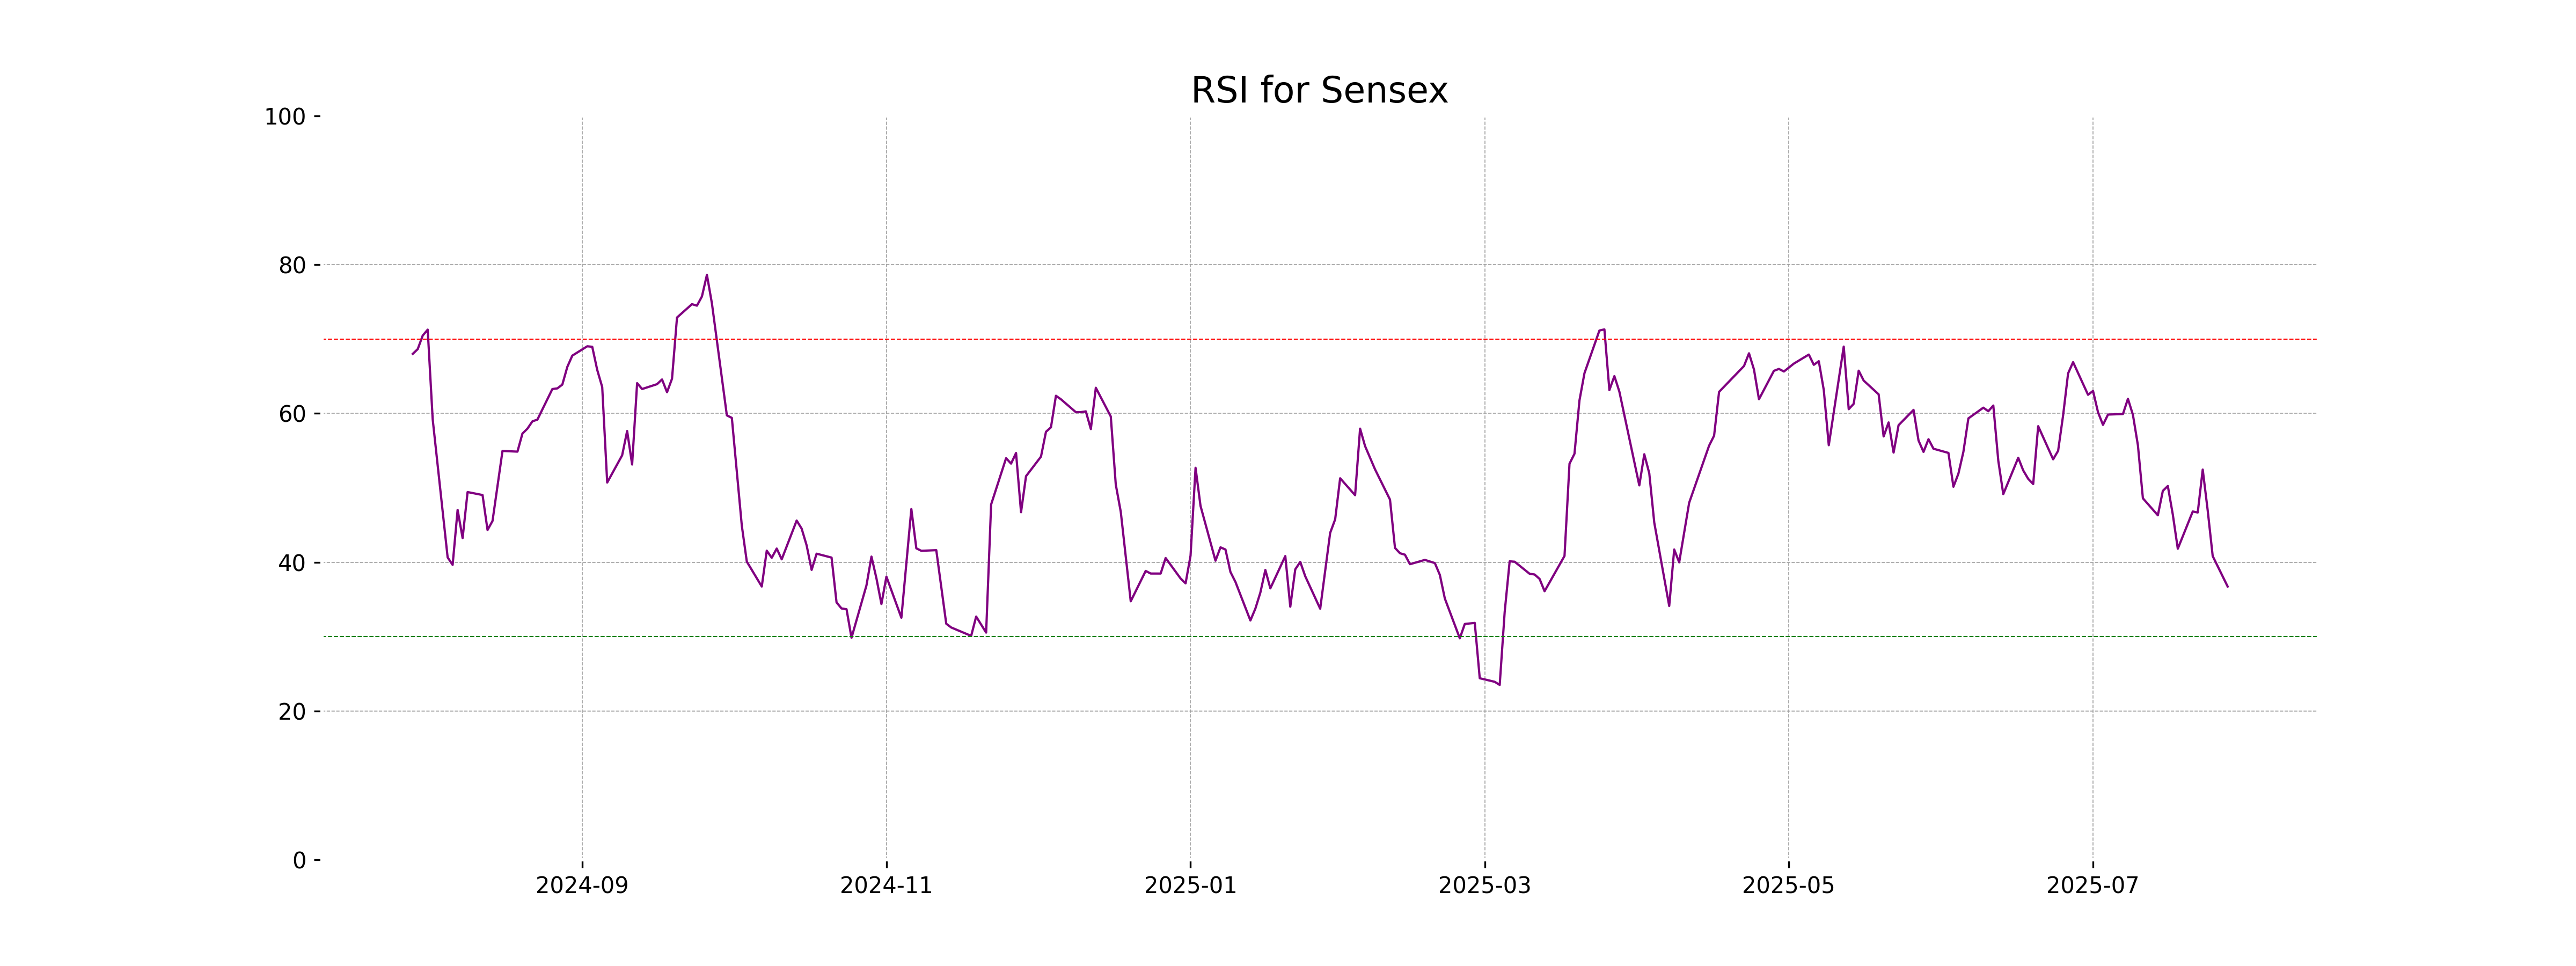
RSI Analysis
The RSI for Sensex is 36.73, which indicates that the index is approaching the oversold territory, as RSI levels below 30 typically suggest oversold conditions. This may imply potential buying interest or a pause in the current downward trend if the RSI continues to decline.
Analysis for Nifty Auto - July 28, 2025
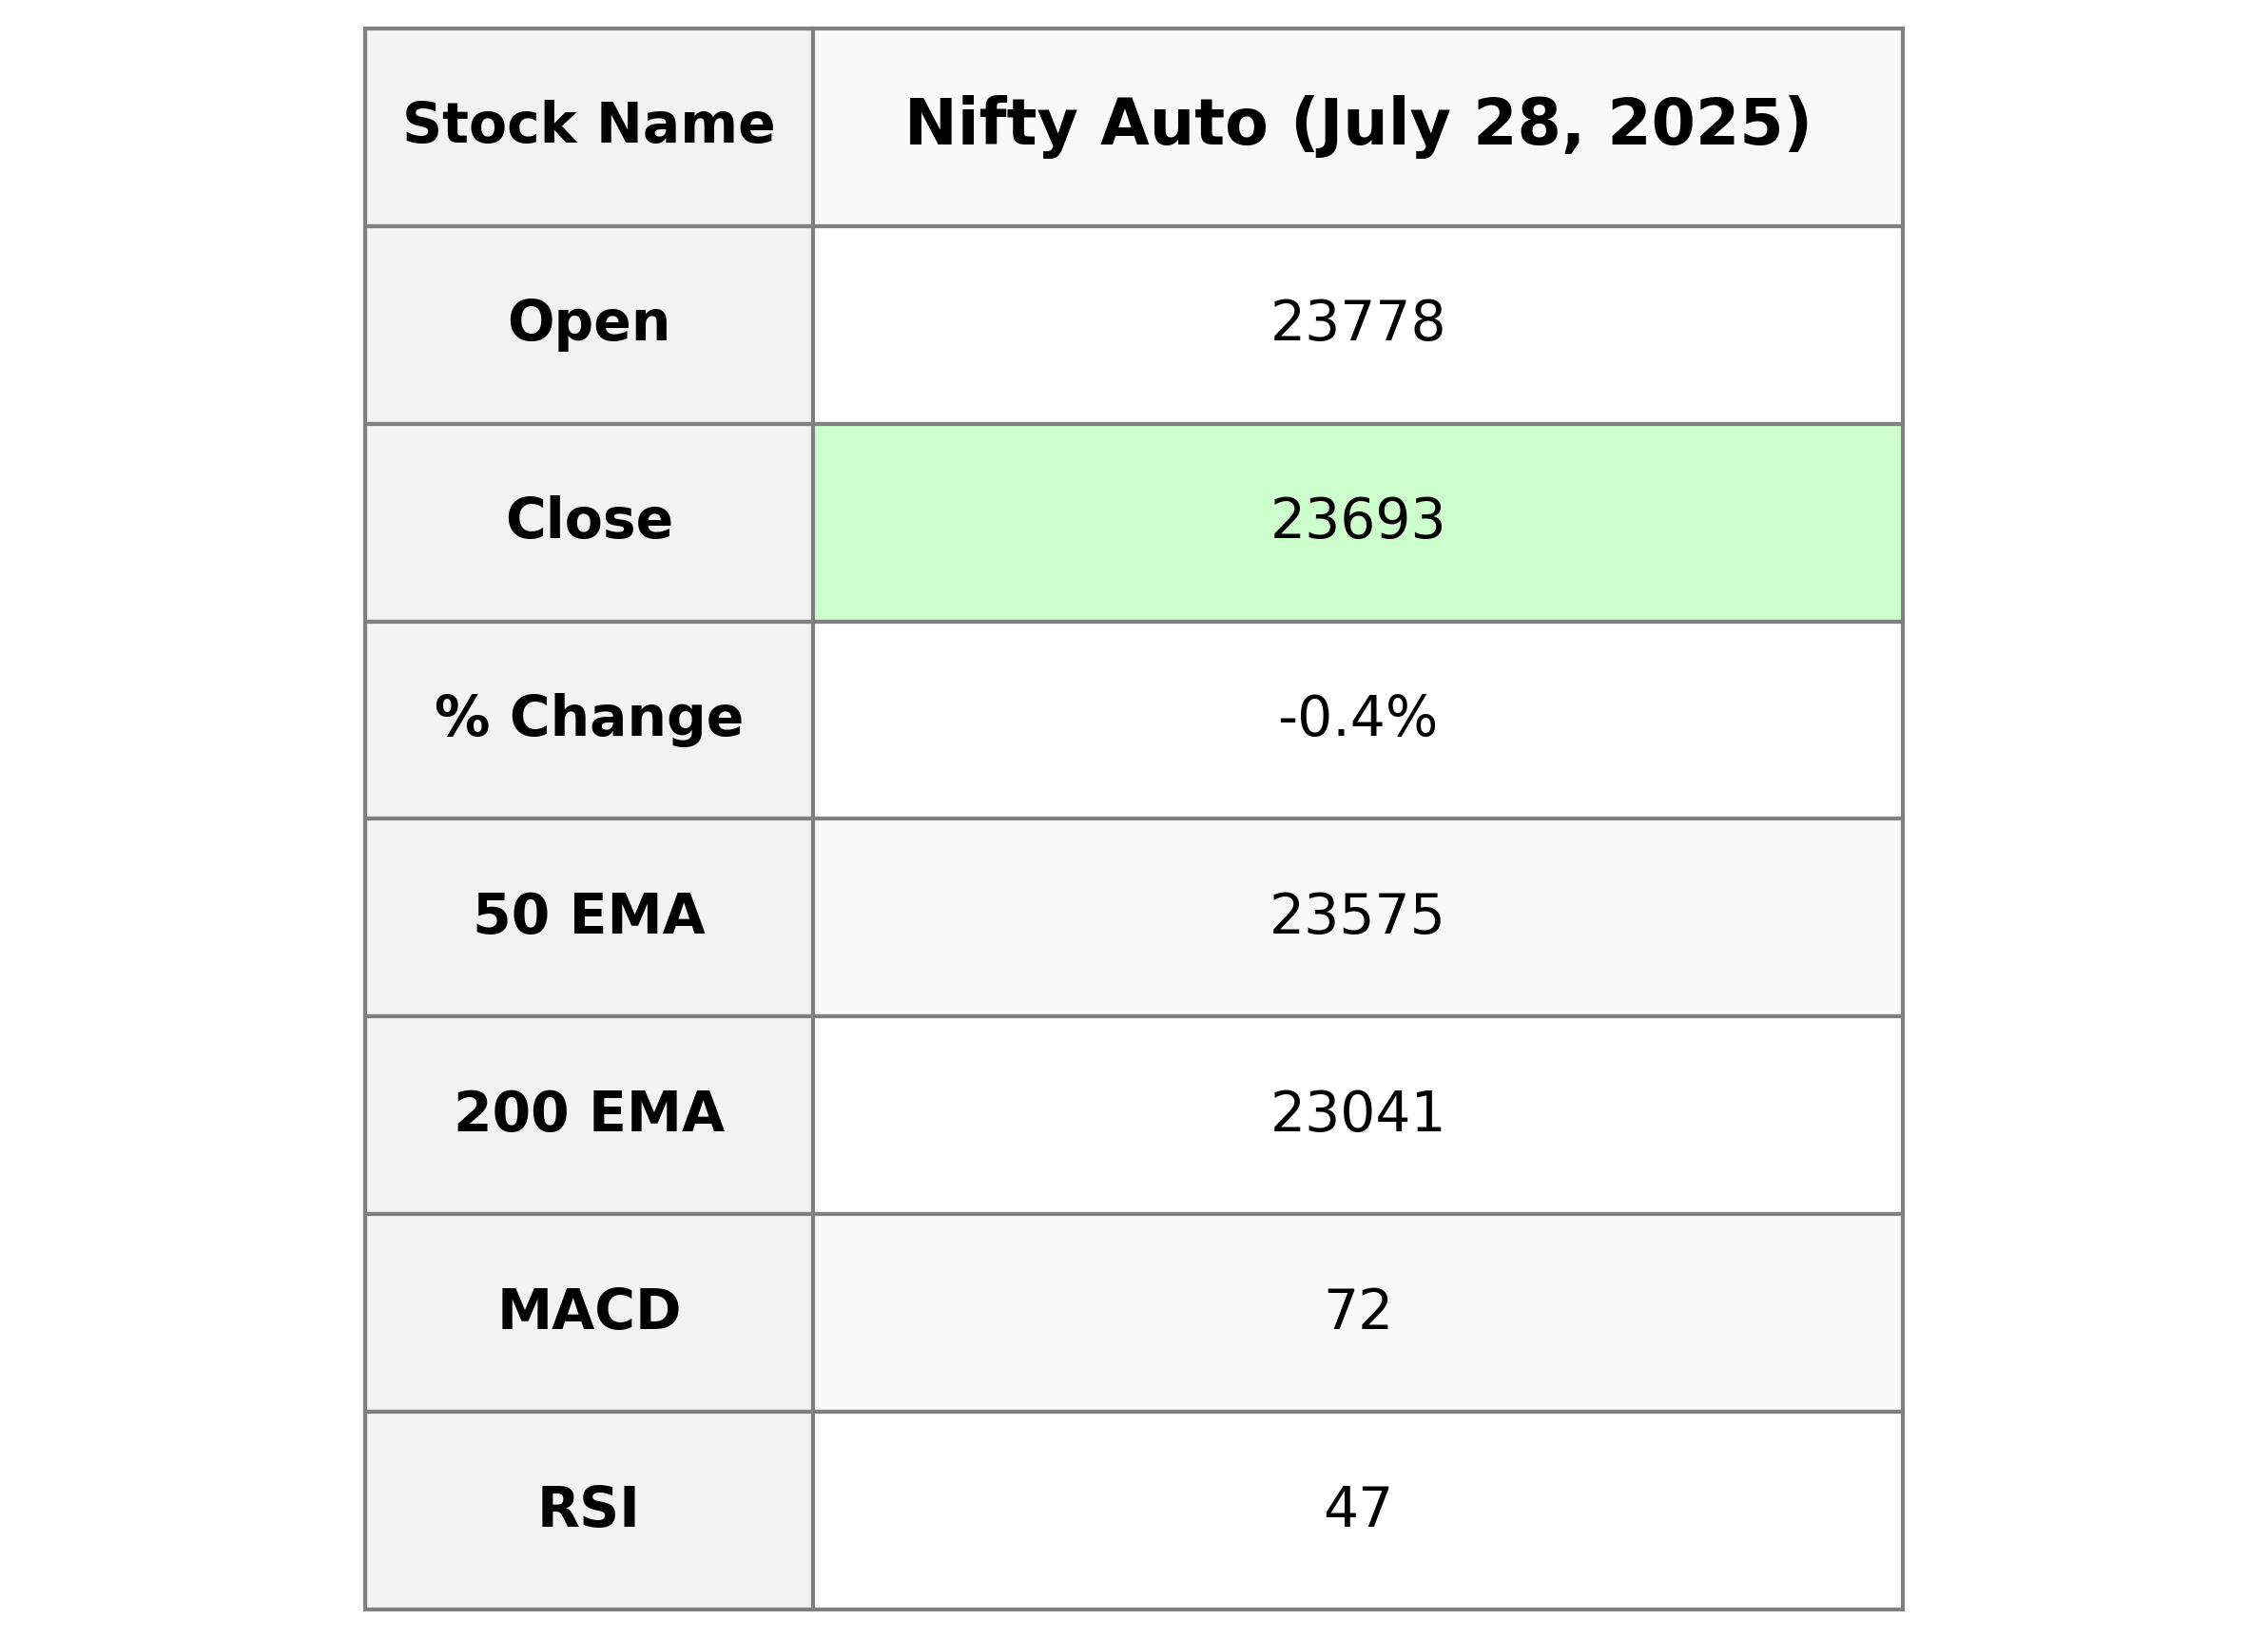
Nifty Auto Performance Summary: Nifty Auto opened at 23,777.70, reached a high of 23,981.60, and closed at 23,693.00, resulting in a 0.37% decline or a points change of -88.55 from the previous close of 23,781.55. Technical indicators show the index is below key EMAs, with an RSI of 46.99 indicating neither overbought nor oversold conditions, and a MACD below its signal which could suggest bearish momentum.
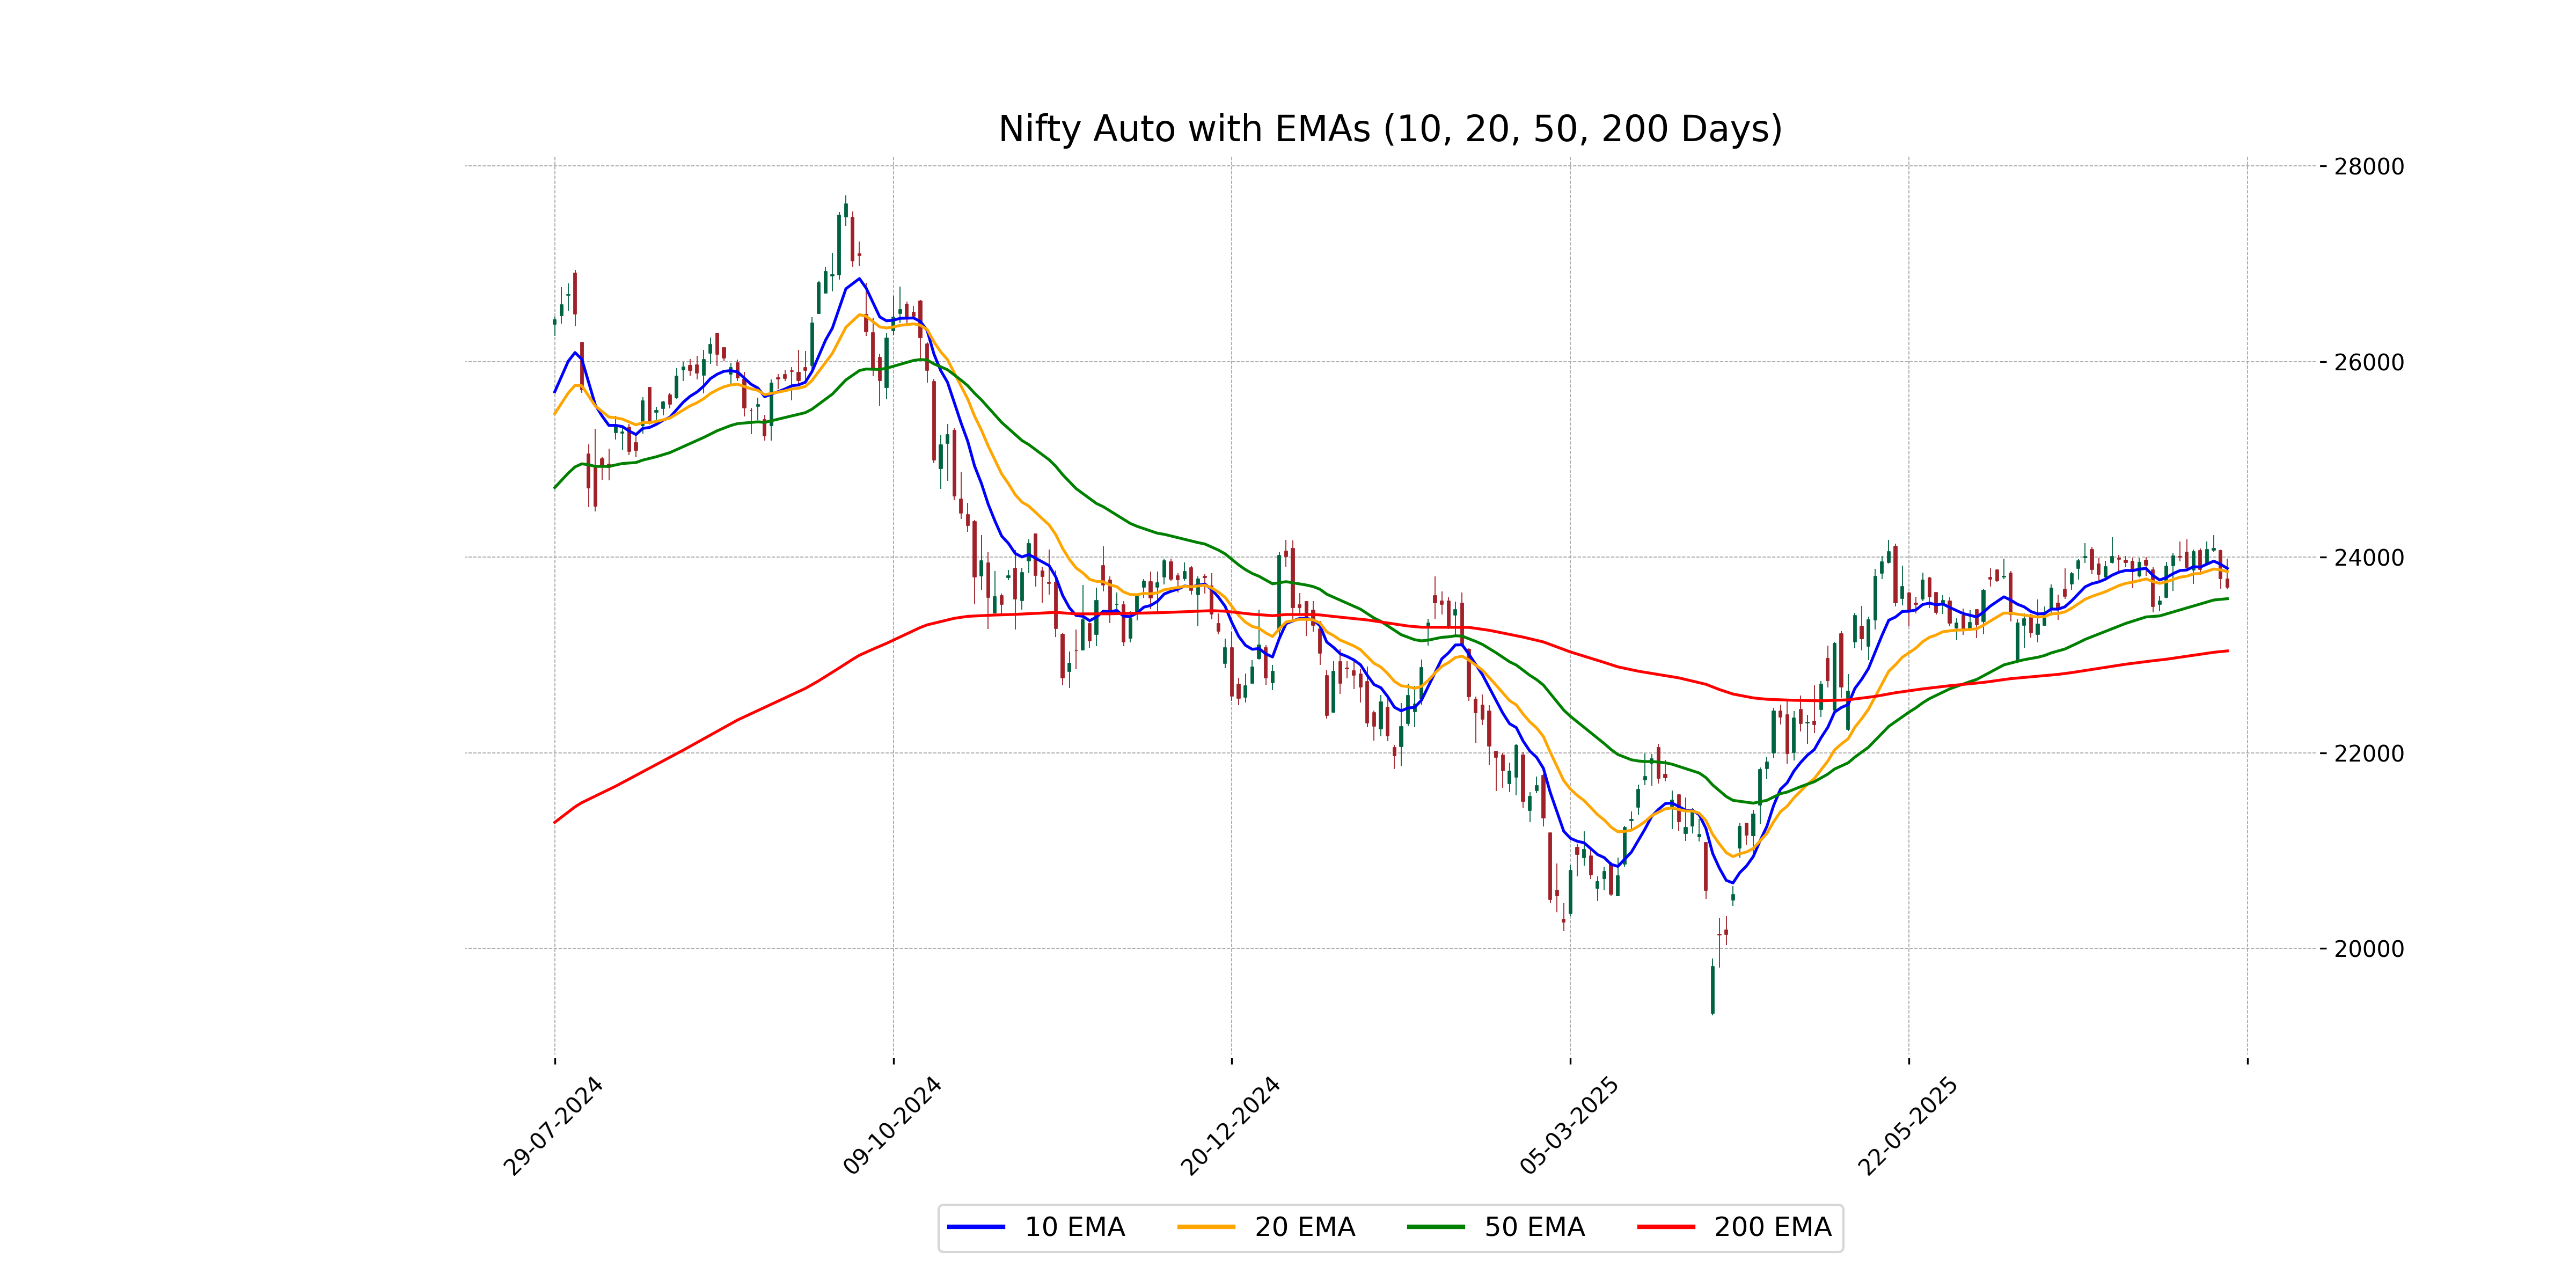
Relationship with Key Moving Averages
Nifty Auto closed at 23693, slightly below its previous close of 23781.55, with a change of -0.37%. It is positioned below the 10-day and 20-day EMAs, which are 23884.18 and 23852.12 respectively, indicating a short-term bearish trend. However, it remains above the 50-day EMA, which is 23574.60, suggesting potential support in the medium term.
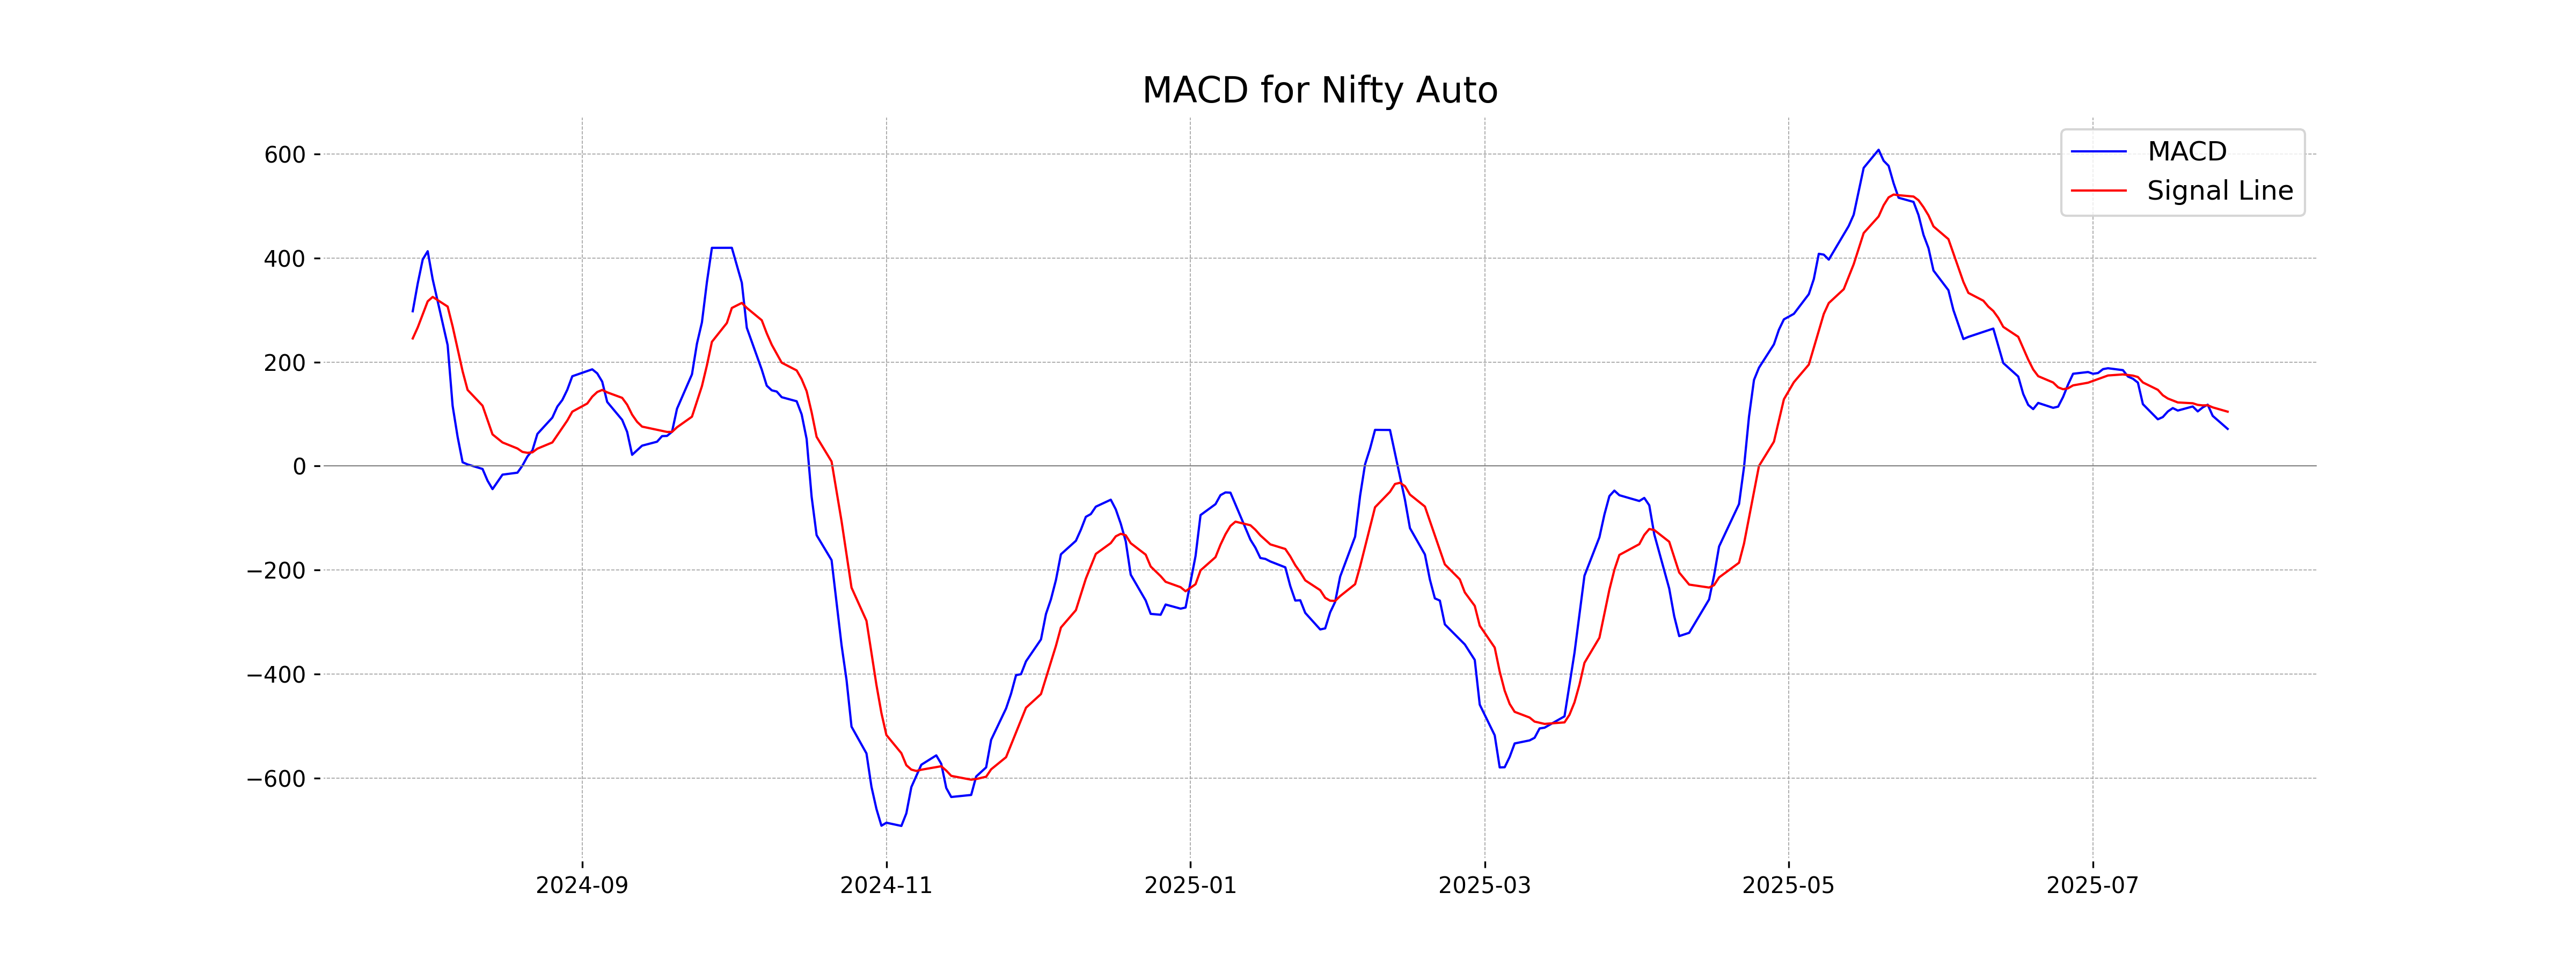
Moving Averages Trend (MACD)
Nifty Auto MACD Analysis: The MACD value for Nifty Auto is 71.57, which is below the MACD Signal of 104.69, indicating a bearish signal. This suggests potential for continued downside momentum in the stock.
RSI Analysis
The current RSI for Nifty Auto is 46.99, indicating that the index is in a neutral zone and neither overbought nor oversold. Generally, an RSI below 30 suggests an oversold condition, while above 70 indicates overbought levels. Therefore, Nifty Auto's RSI suggests no immediate buying or selling pressure based on this metric alone.

Analysis for Nifty Energy - July 28, 2025
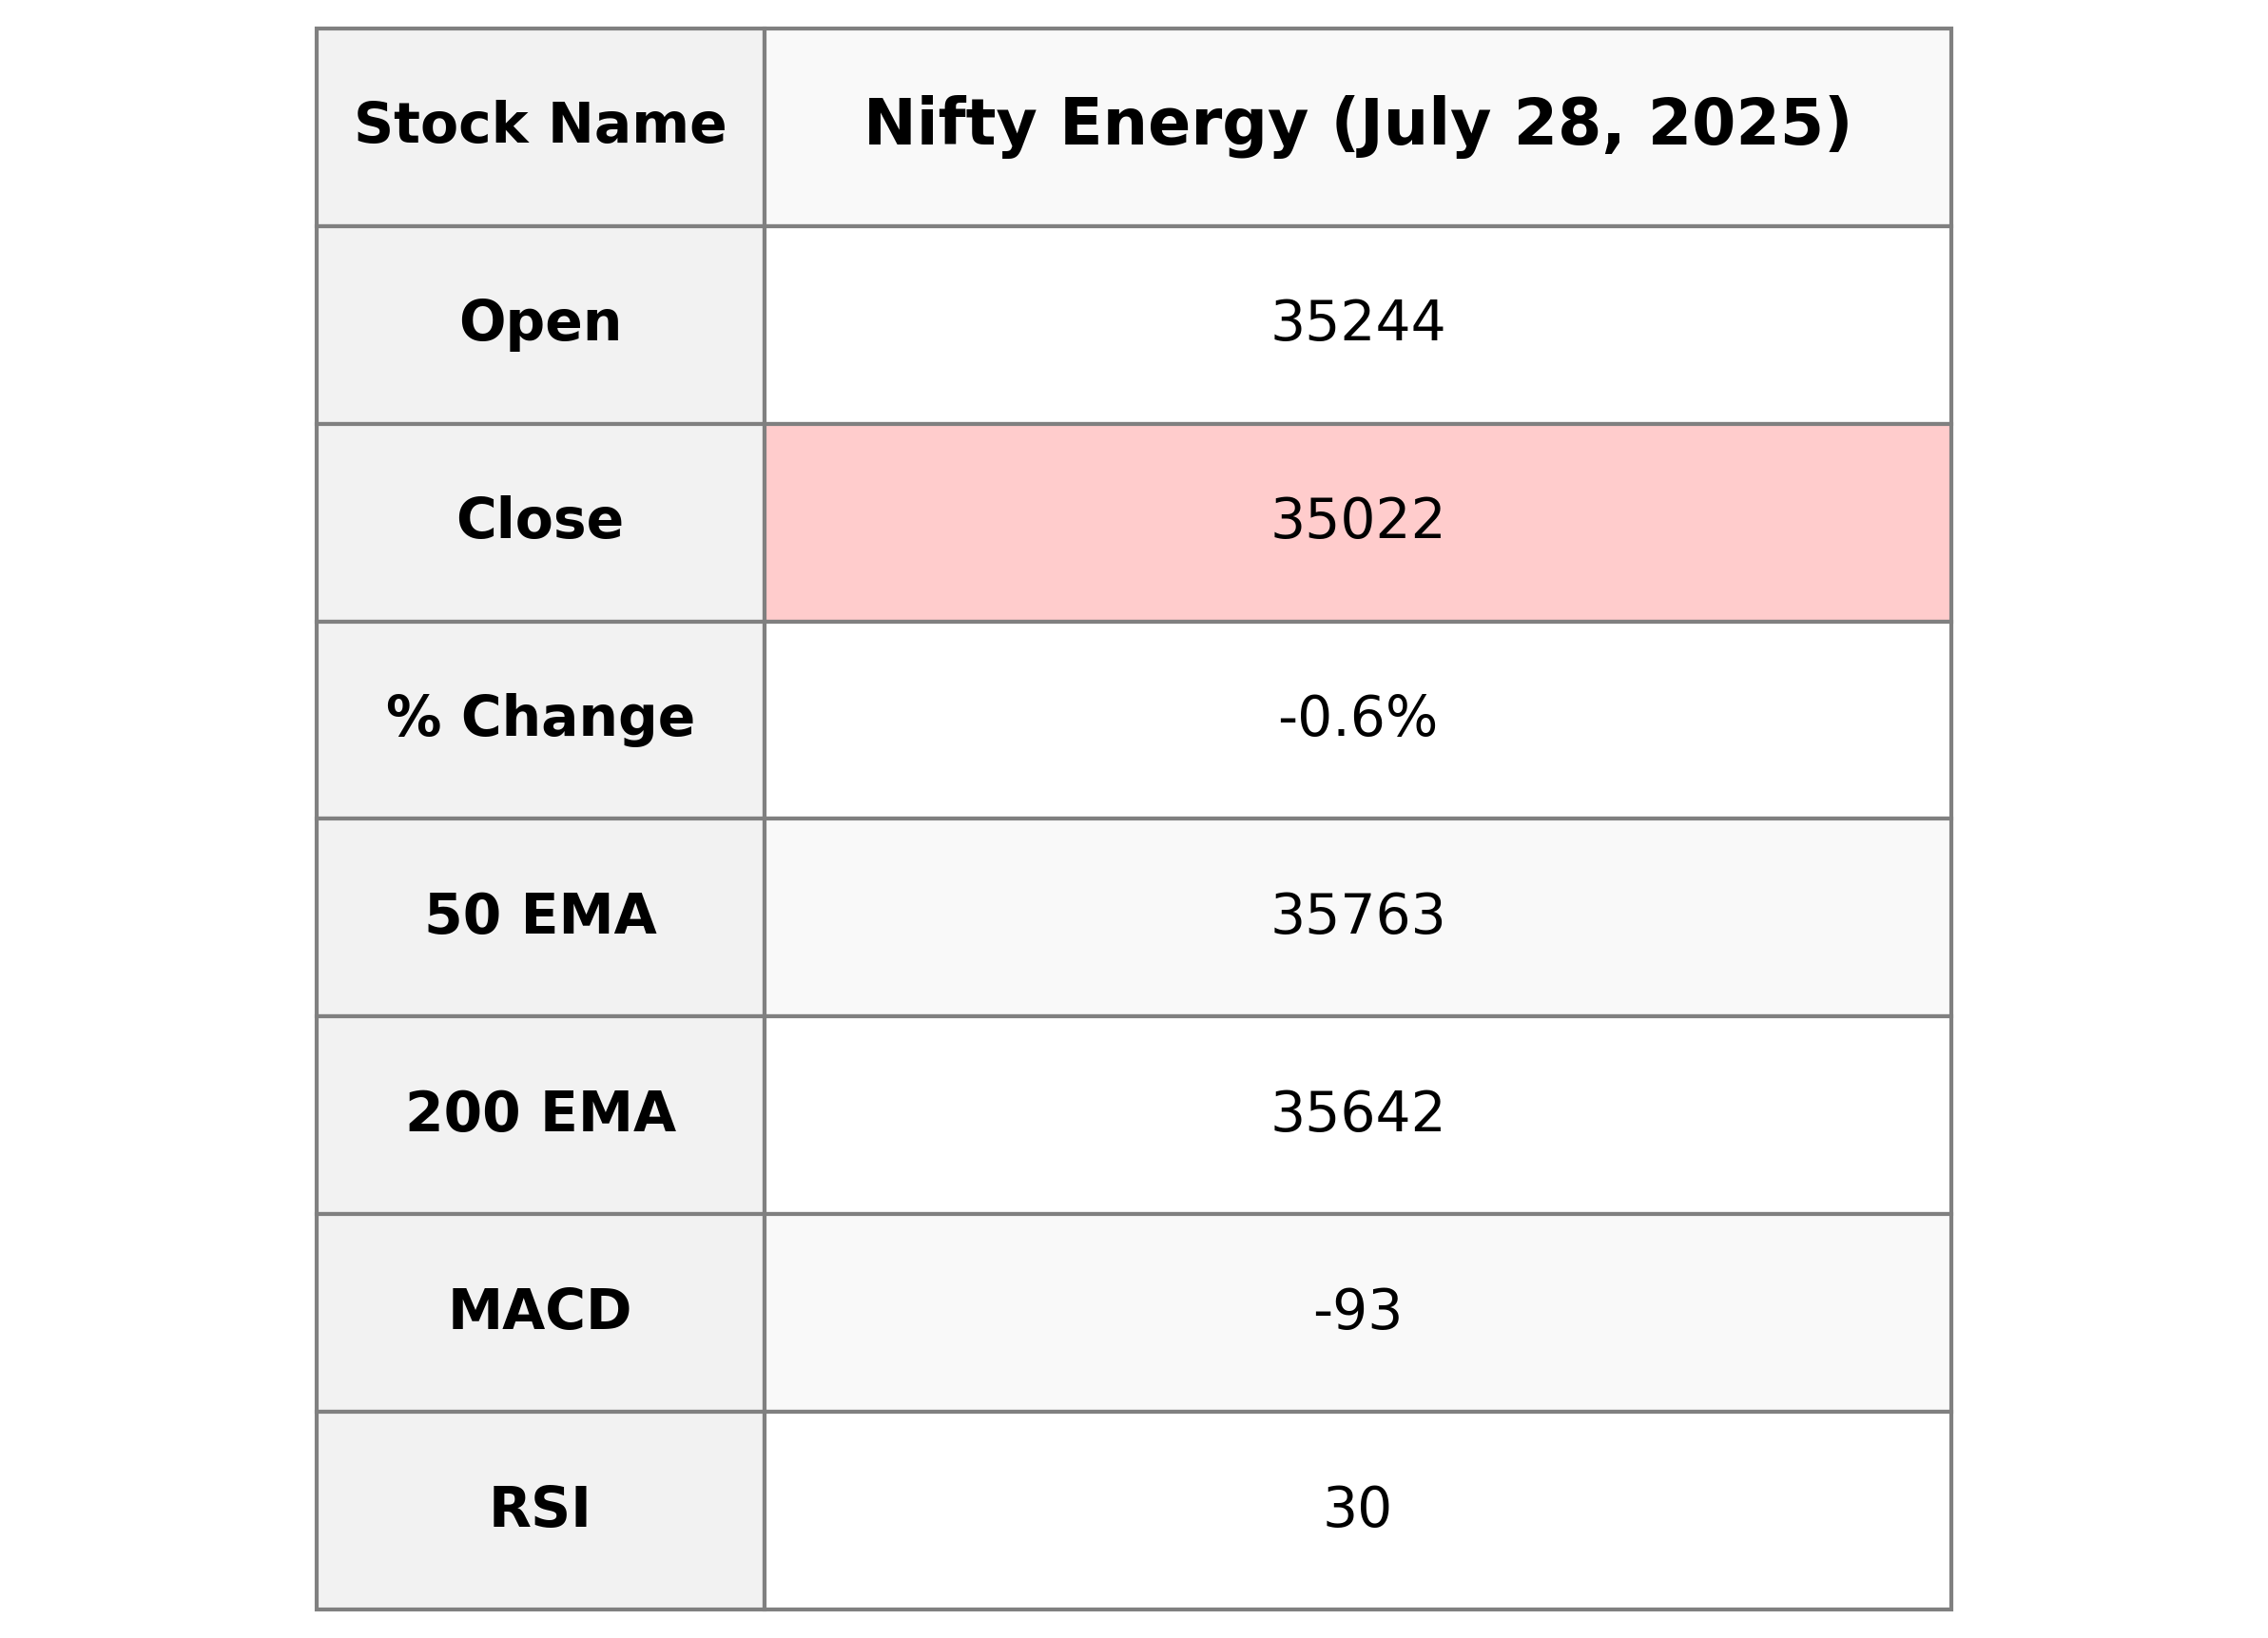
Nifty Energy opened at 35,244.10 and closed at 35,021.55, experiencing a decrease of -0.65%, which equates to a points change of -228.95. The technical indicators show that its RSI is at 30.32, suggesting it may be in oversold territory, and the MACD is at -92.88, which indicates a bearish trend compared to the MACD signal of 70.57.
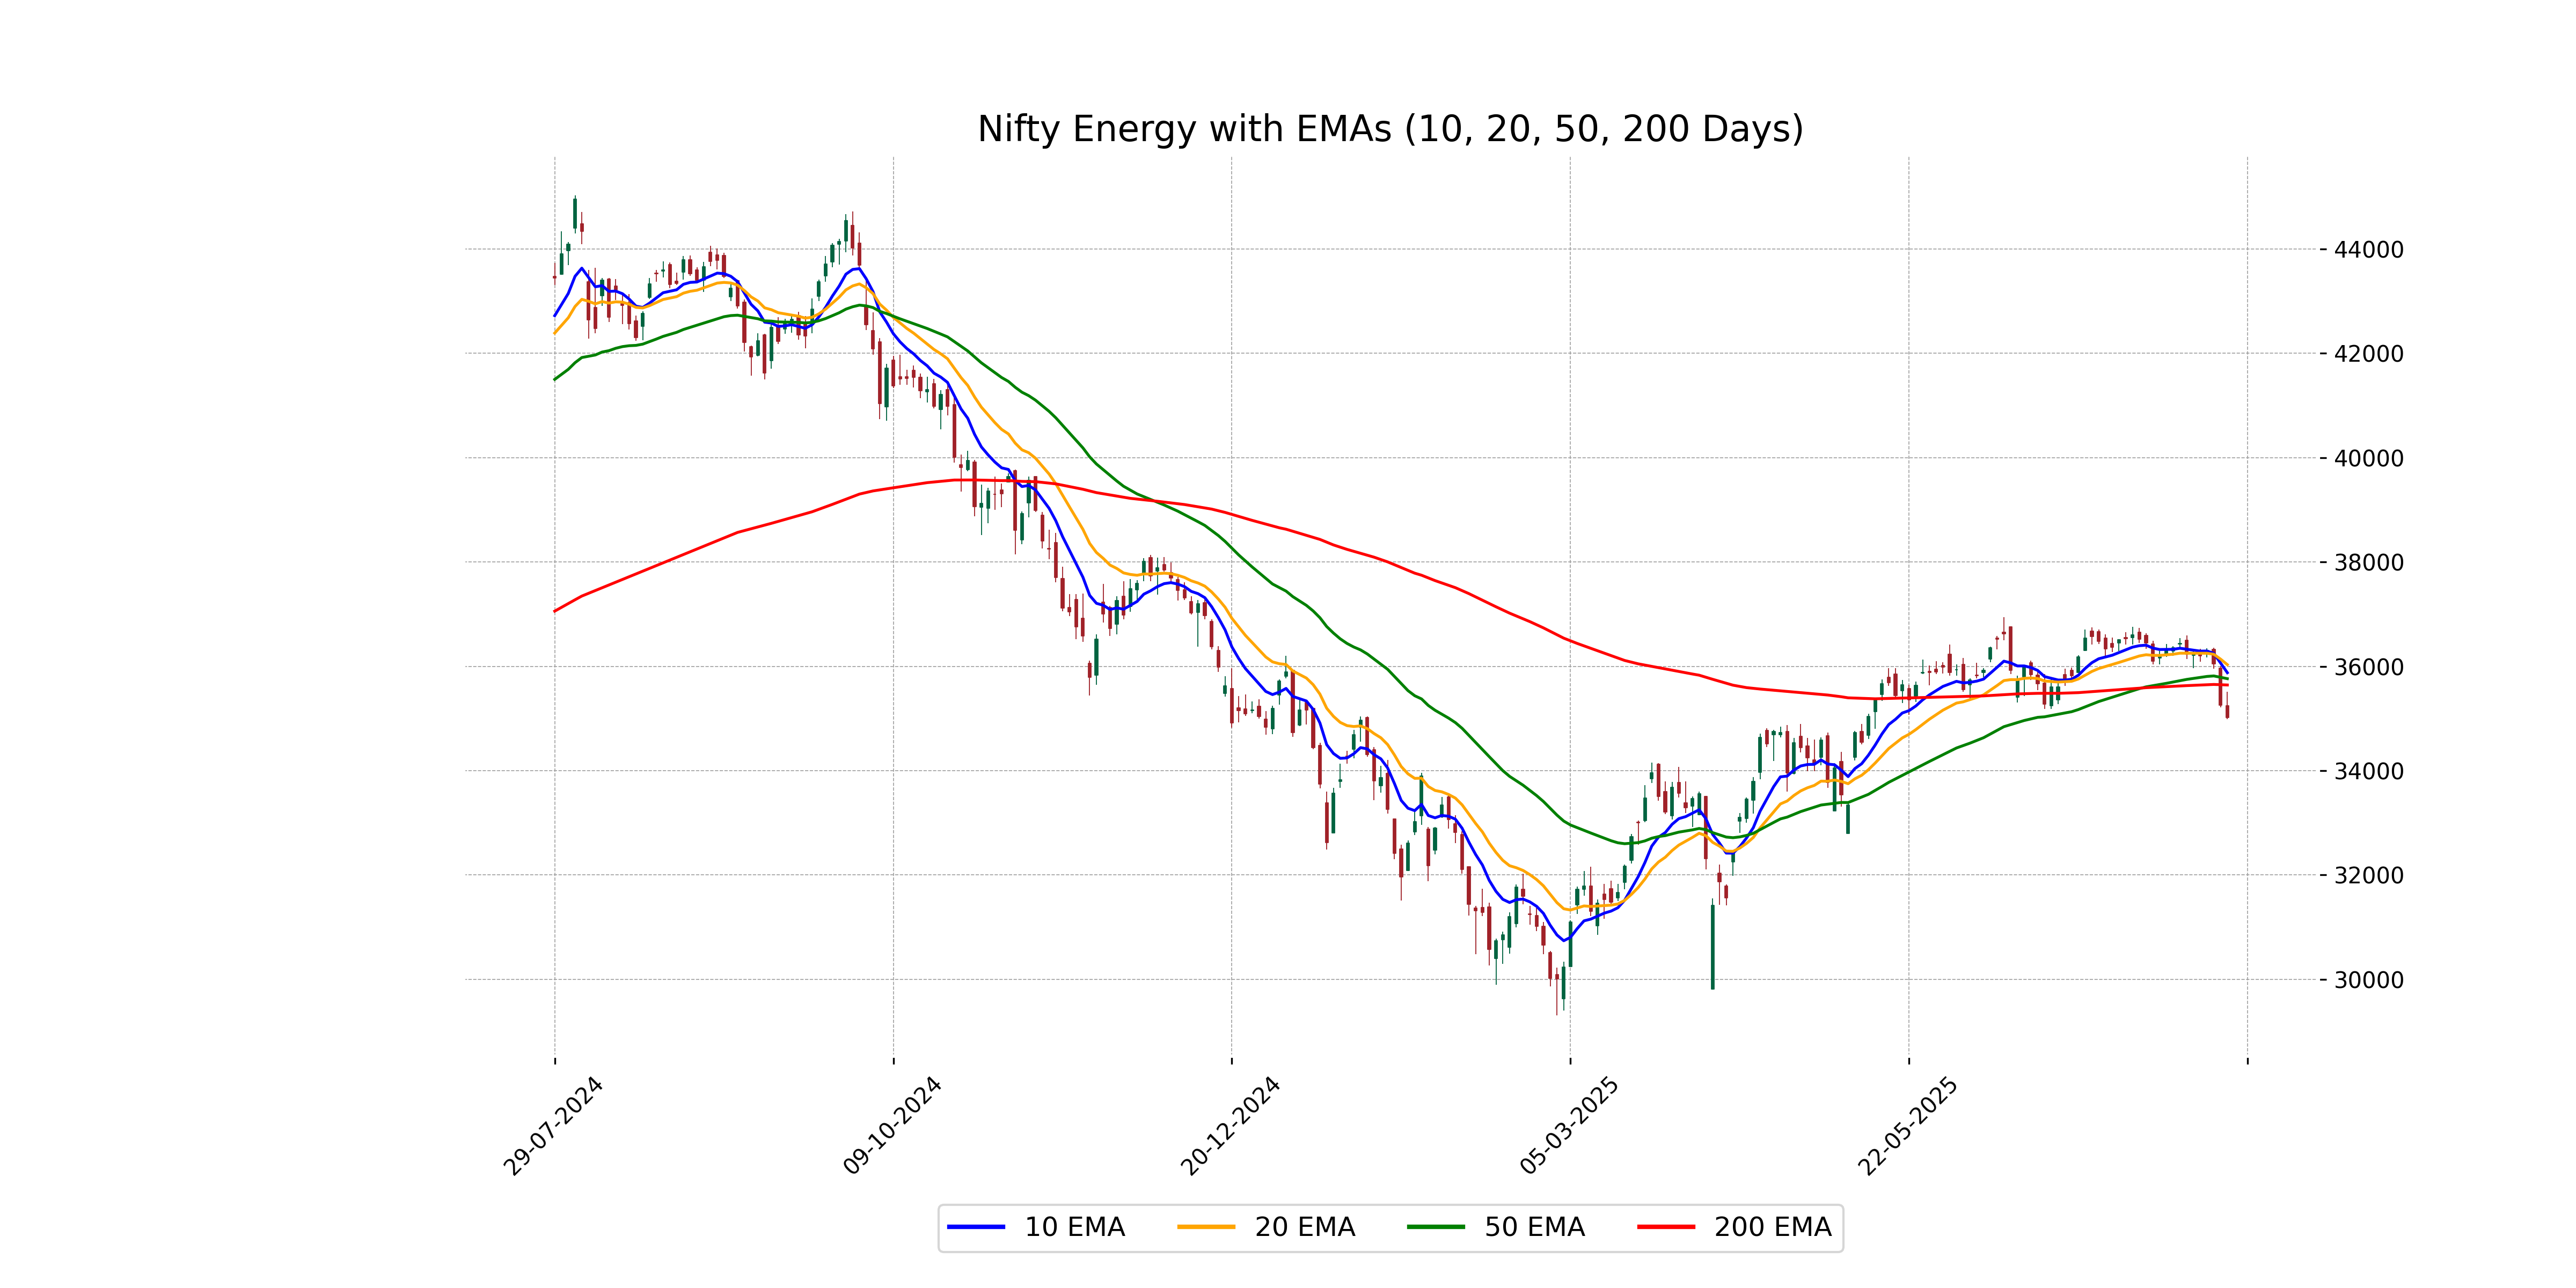
Relationship with Key Moving Averages
Nifty Energy is currently trading below its key moving averages, indicating potential bearish momentum. The index's close at 35021.55 is below the 50 EMA (35762.62), 200 EMA (35641.62), 10 EMA (35876.87), and 20 EMA (36030.88), suggesting it is under selling pressure.
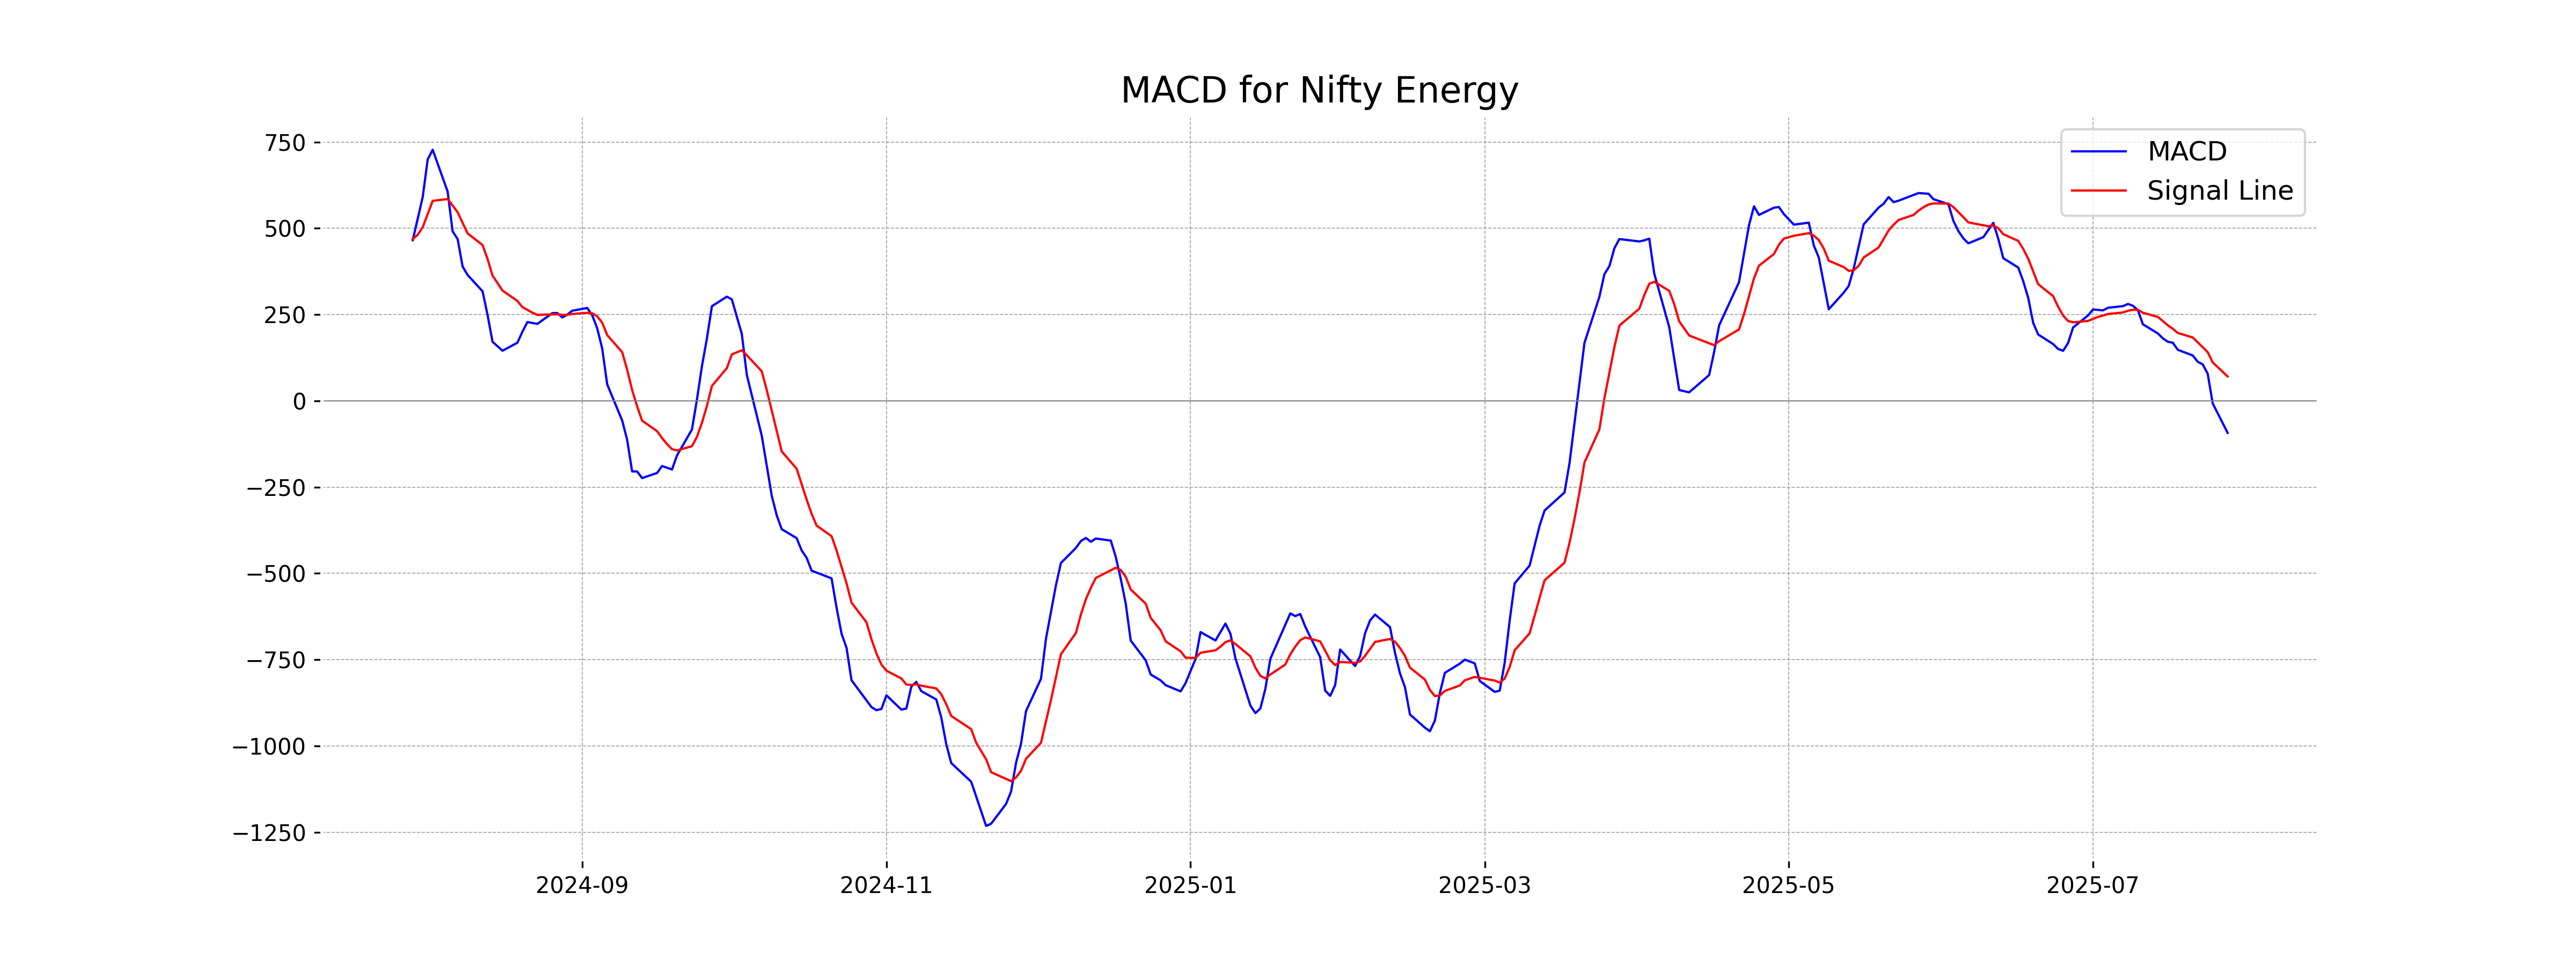
Moving Averages Trend (MACD)
Nifty Energy shows a bearish signal as its MACD value is -92.88, significantly below the MACD Signal of 70.57. This divergence suggests a potential downtrend, coupled with an RSI of 30.32, indicating that the stock might be oversold.
RSI Analysis
The RSI value for Nifty Energy is 30.32, which suggests that the index is approaching oversold territory. An RSI near this level often indicates potential for a reversal or a bounce, as it reflects that the asset might be undervalued in the short term.

Analysis for Nifty FMCG - July 28, 2025
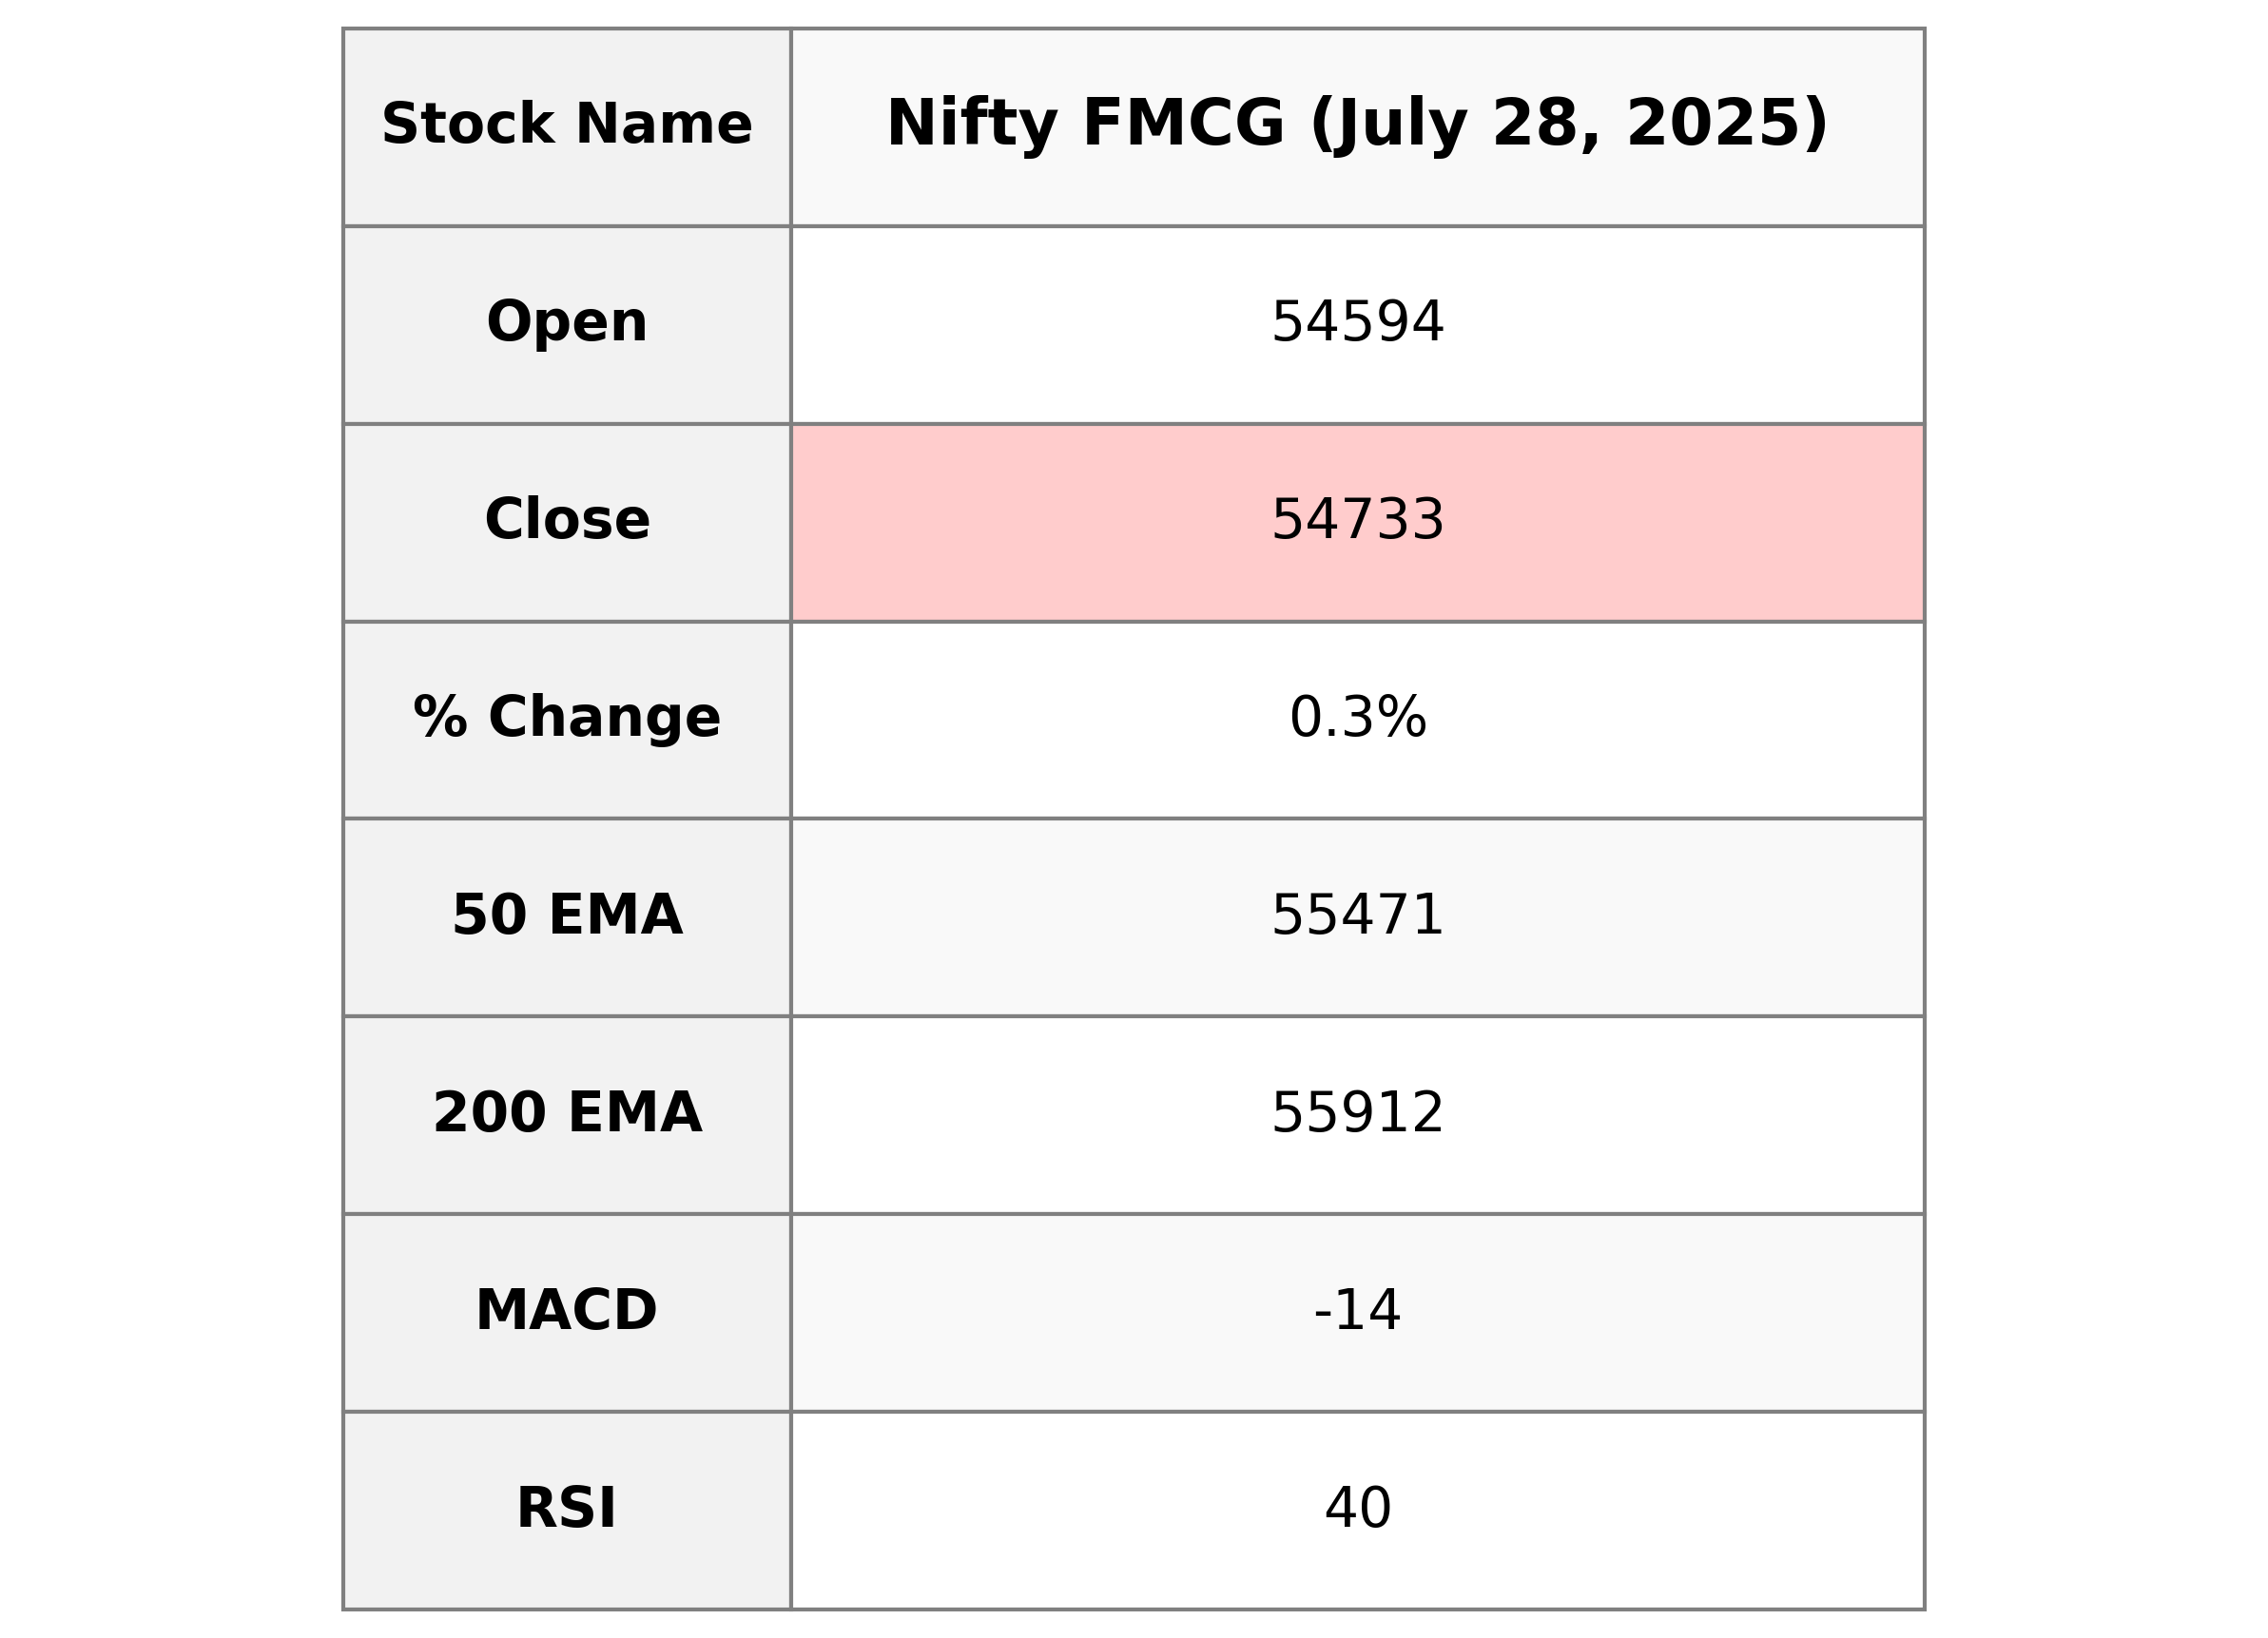
Nifty FMCG opened at 54593.75 and closed at 54732.95, showing a percentage change of 0.28% with a points change of 153. Despite the positive daily change, its relative strength index (RSI) is at 40.47, indicating a potential bearish sentiment. The MACD value of -13.68 below the MACD Signal of 146.66 further supports this view.
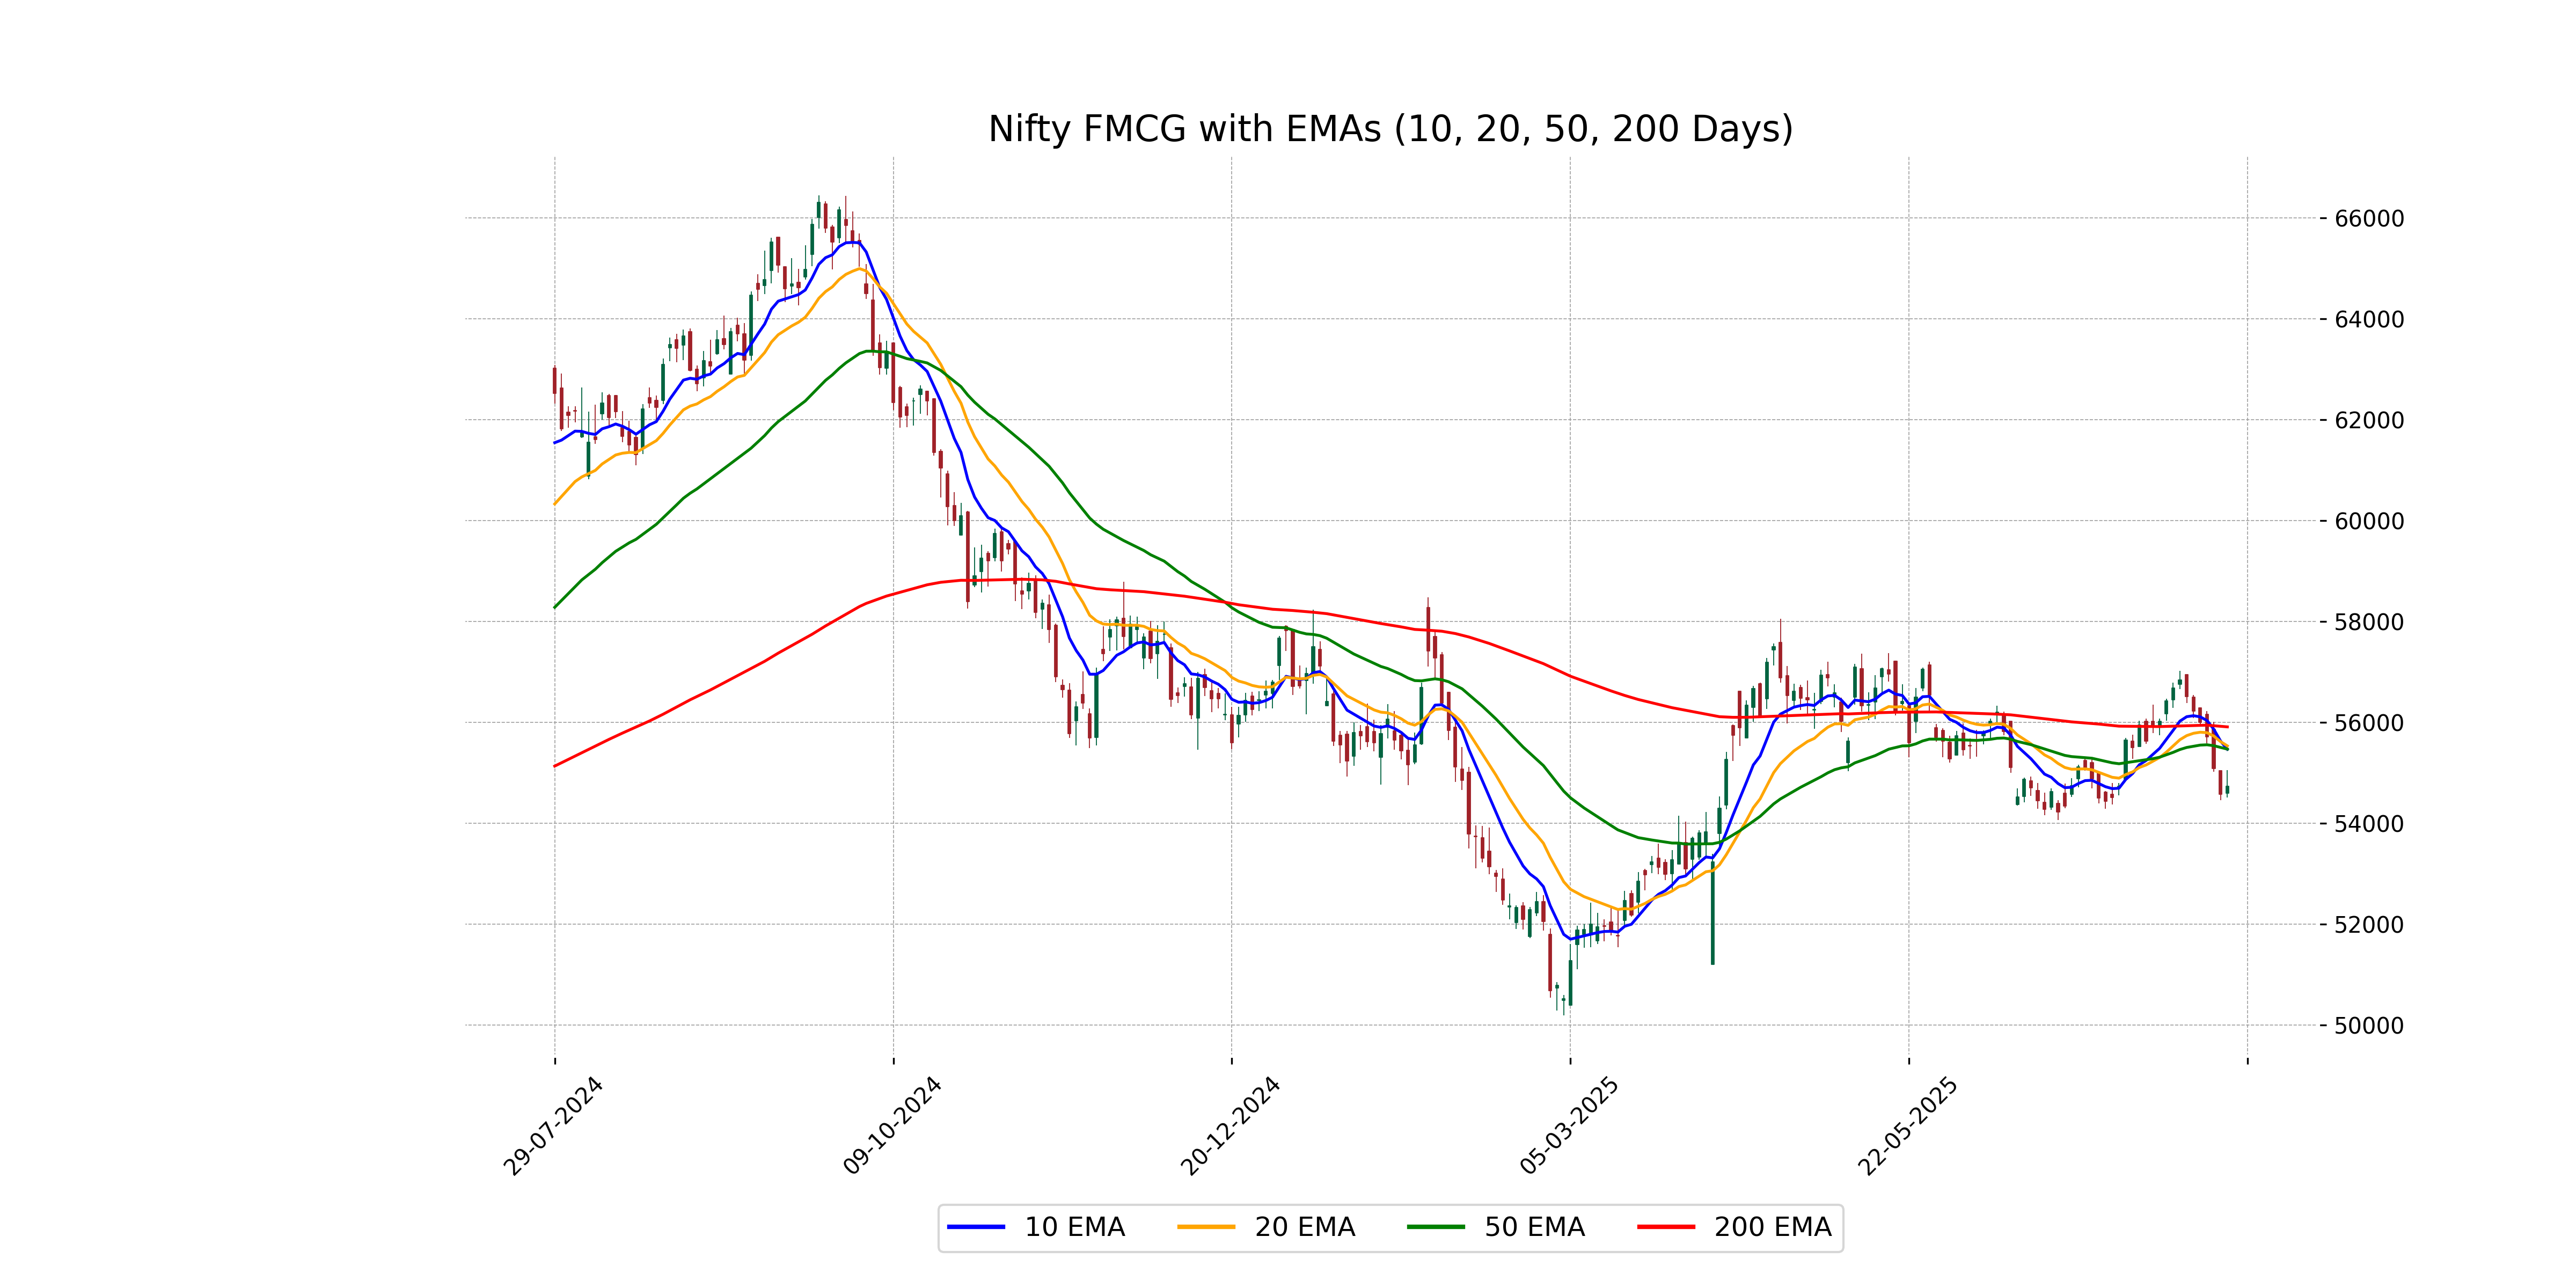
Relationship with Key Moving Averages
The Nifty FMCG index closed at 54732.95, which is below its 50 EMA of 55470.59, 200 EMA of 55911.58, 10 EMA of 55467.48, and 20 EMA of 55534.90. This suggests a bearish trend as the current price is below all major moving averages.
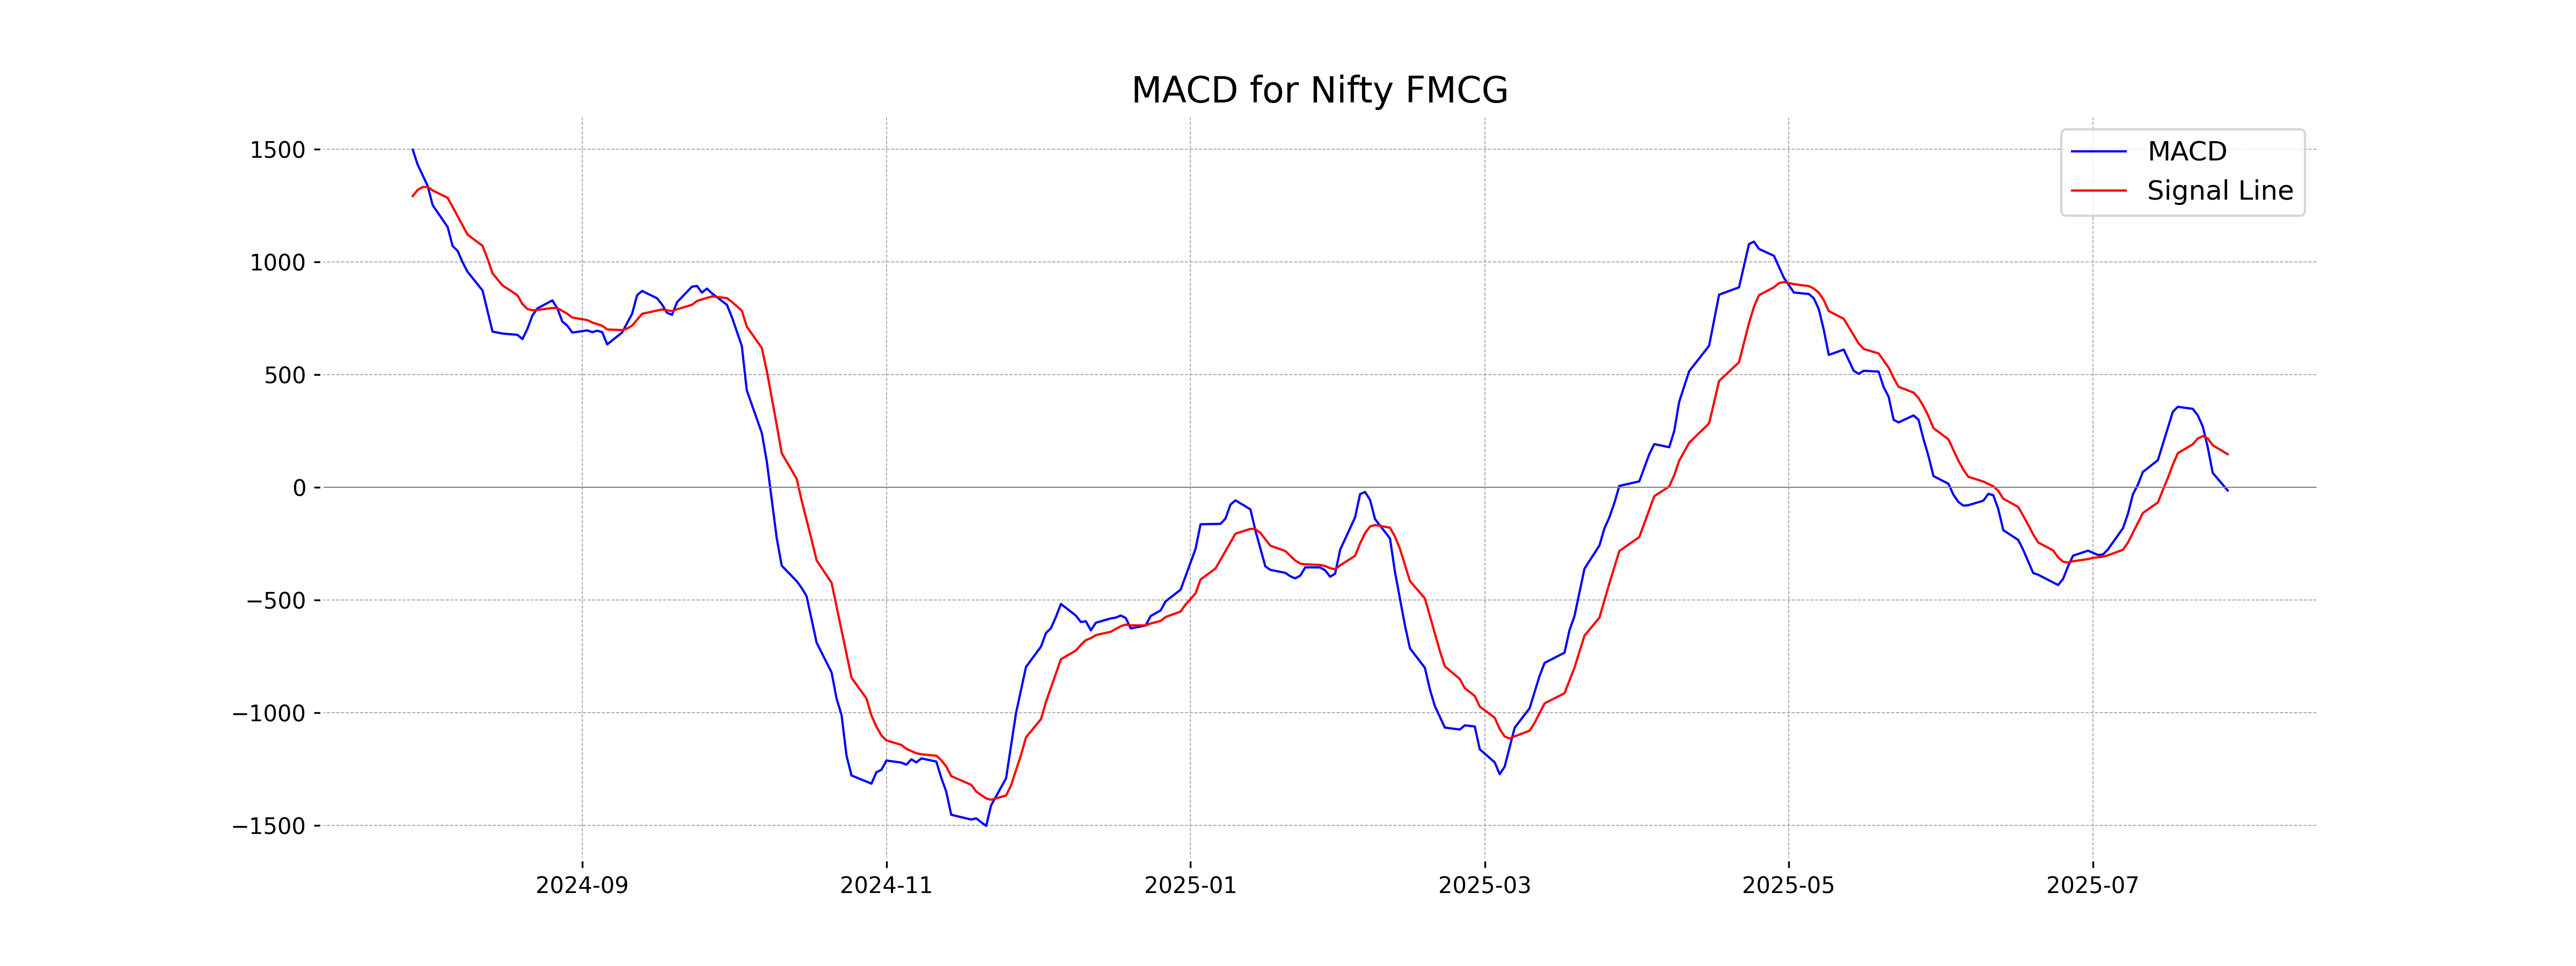
Moving Averages Trend (MACD)
MACD Analysis for Nifty FMCG: The MACD value of -13.68 is below the MACD Signal line of 146.66, indicating a potential bearish momentum in the market. This suggests that the price may continue to face downward pressure if the trend persists.
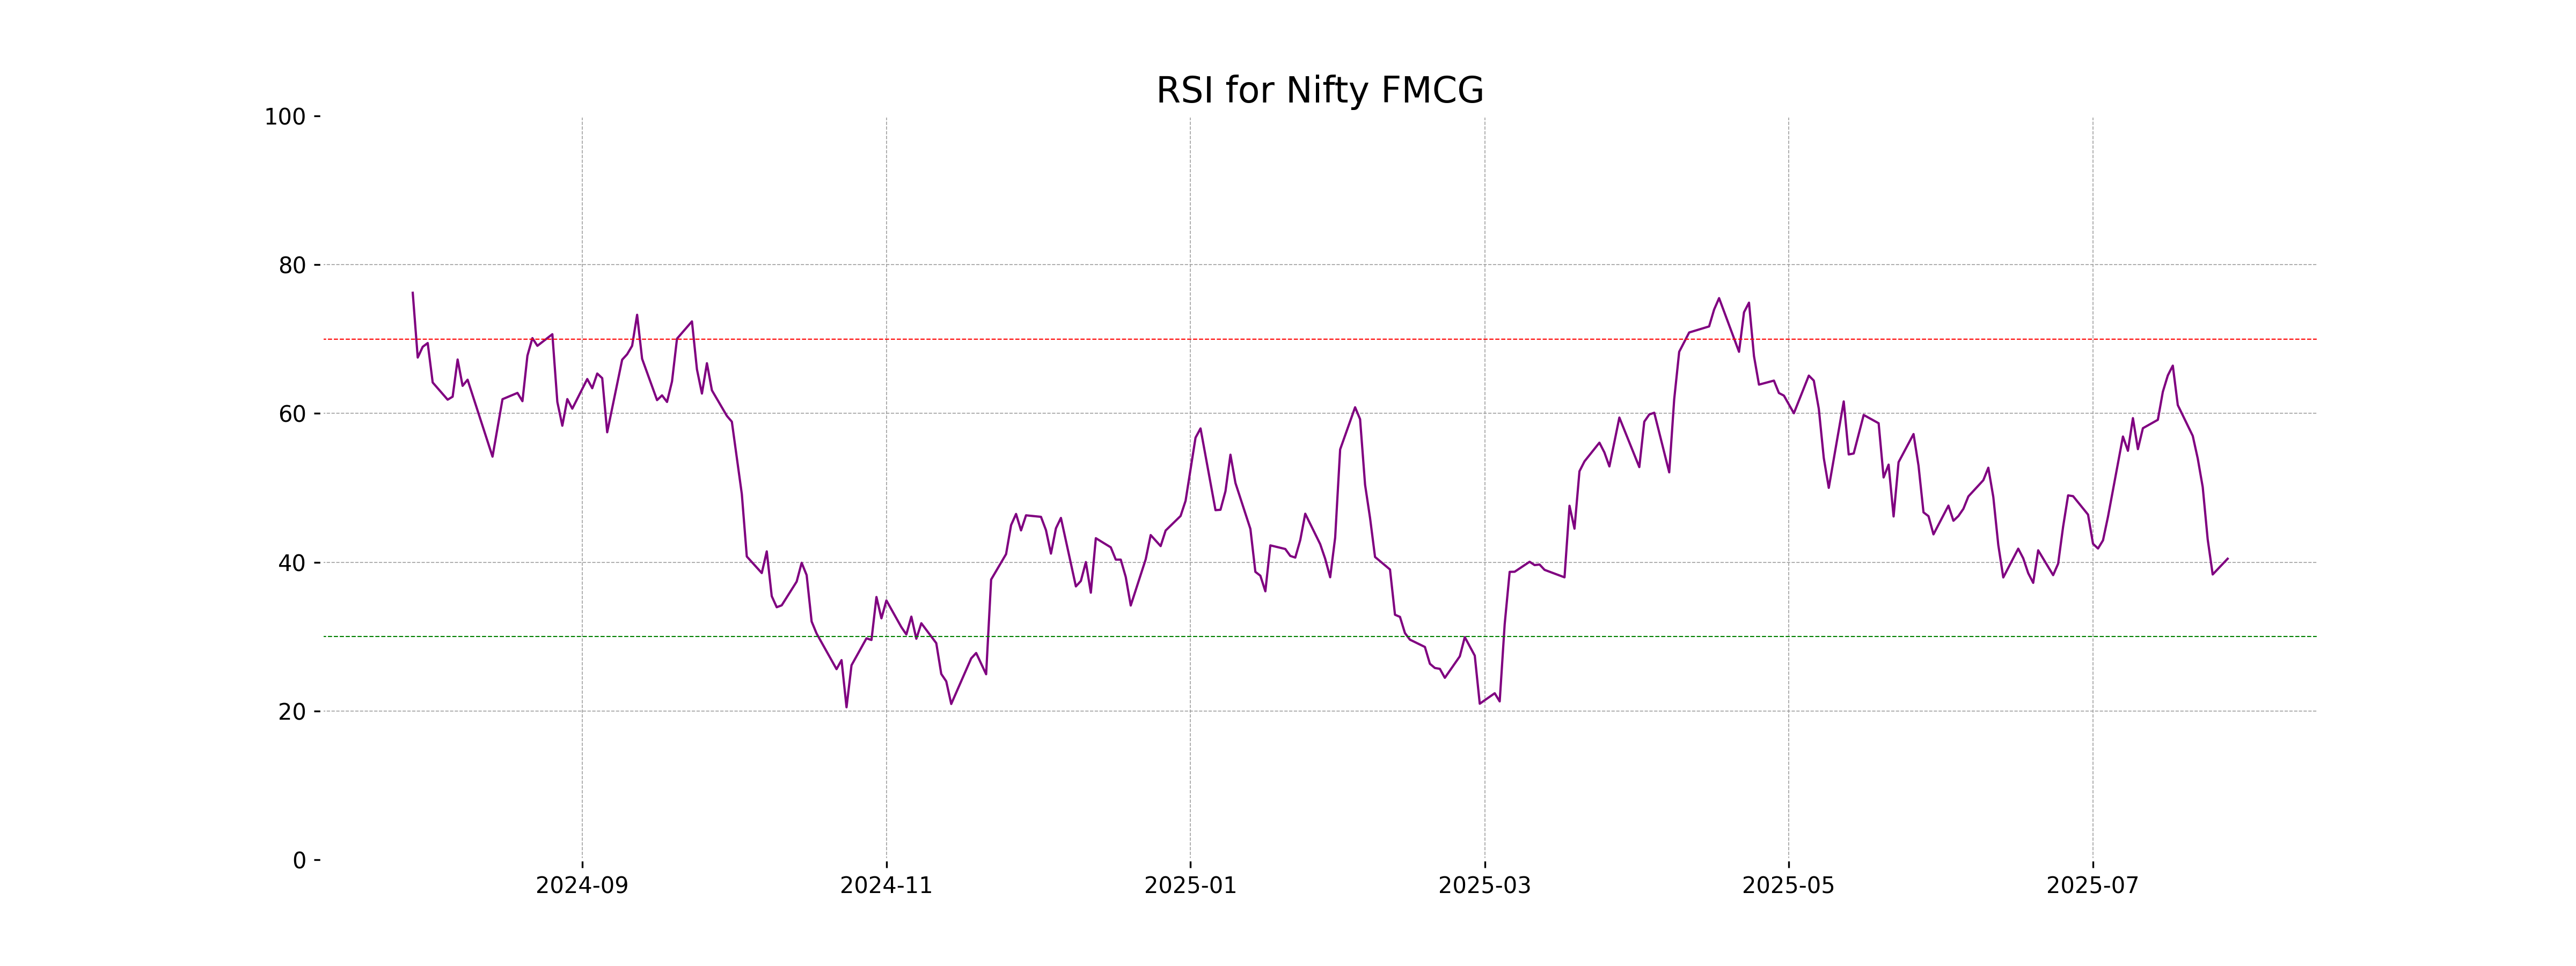
RSI Analysis
The Nifty FMCG RSI value is 40.47, which suggests it is in a moderately oversold condition. This indicates that the index might see a potential rebound or an upward correction if buying interest increases. However, it's crucial to monitor other indicators and market conditions for confirmation.
Analysis for Nifty Infra - July 28, 2025
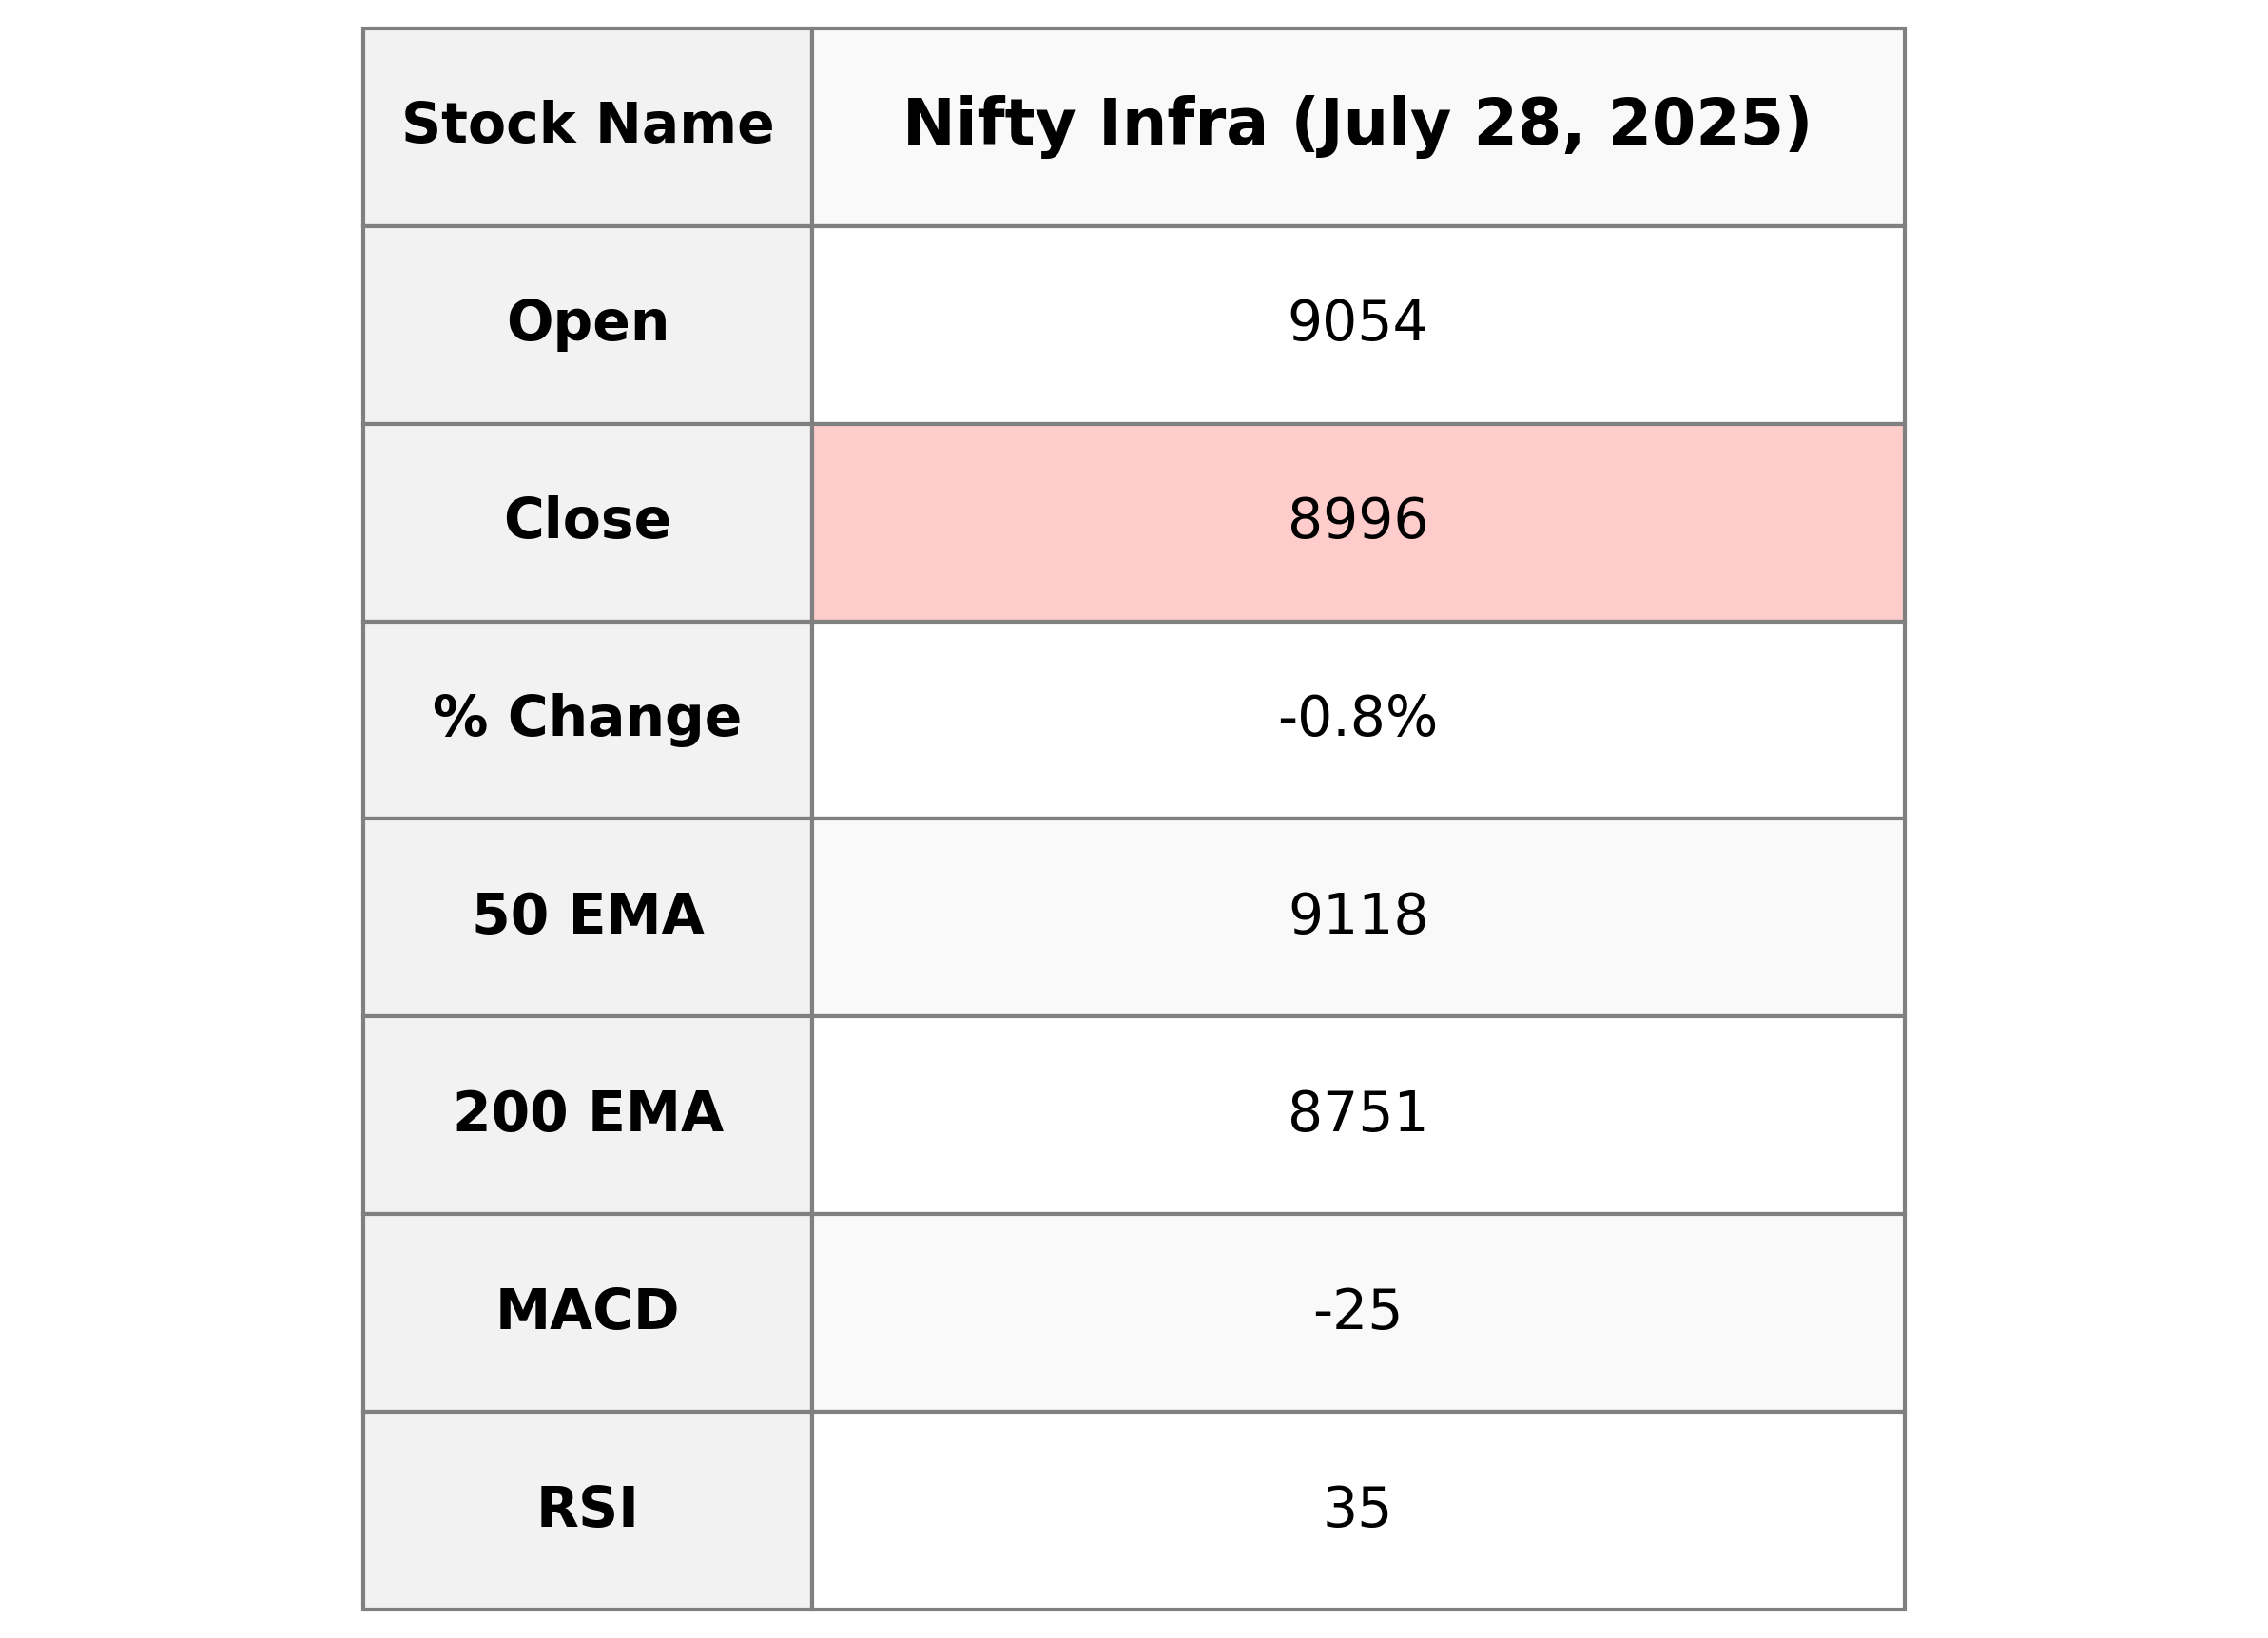
Nifty Infra opened at 9053.70 and closed at 8995.65, marking a decline of 0.78% compared to the previous close. The sector experienced a points change of -70.85, and technical indicators like RSI at 35.08 suggest weak momentum. Key EMAs show the index is trading below its short-term averages, indicating potential bearish sentiment.
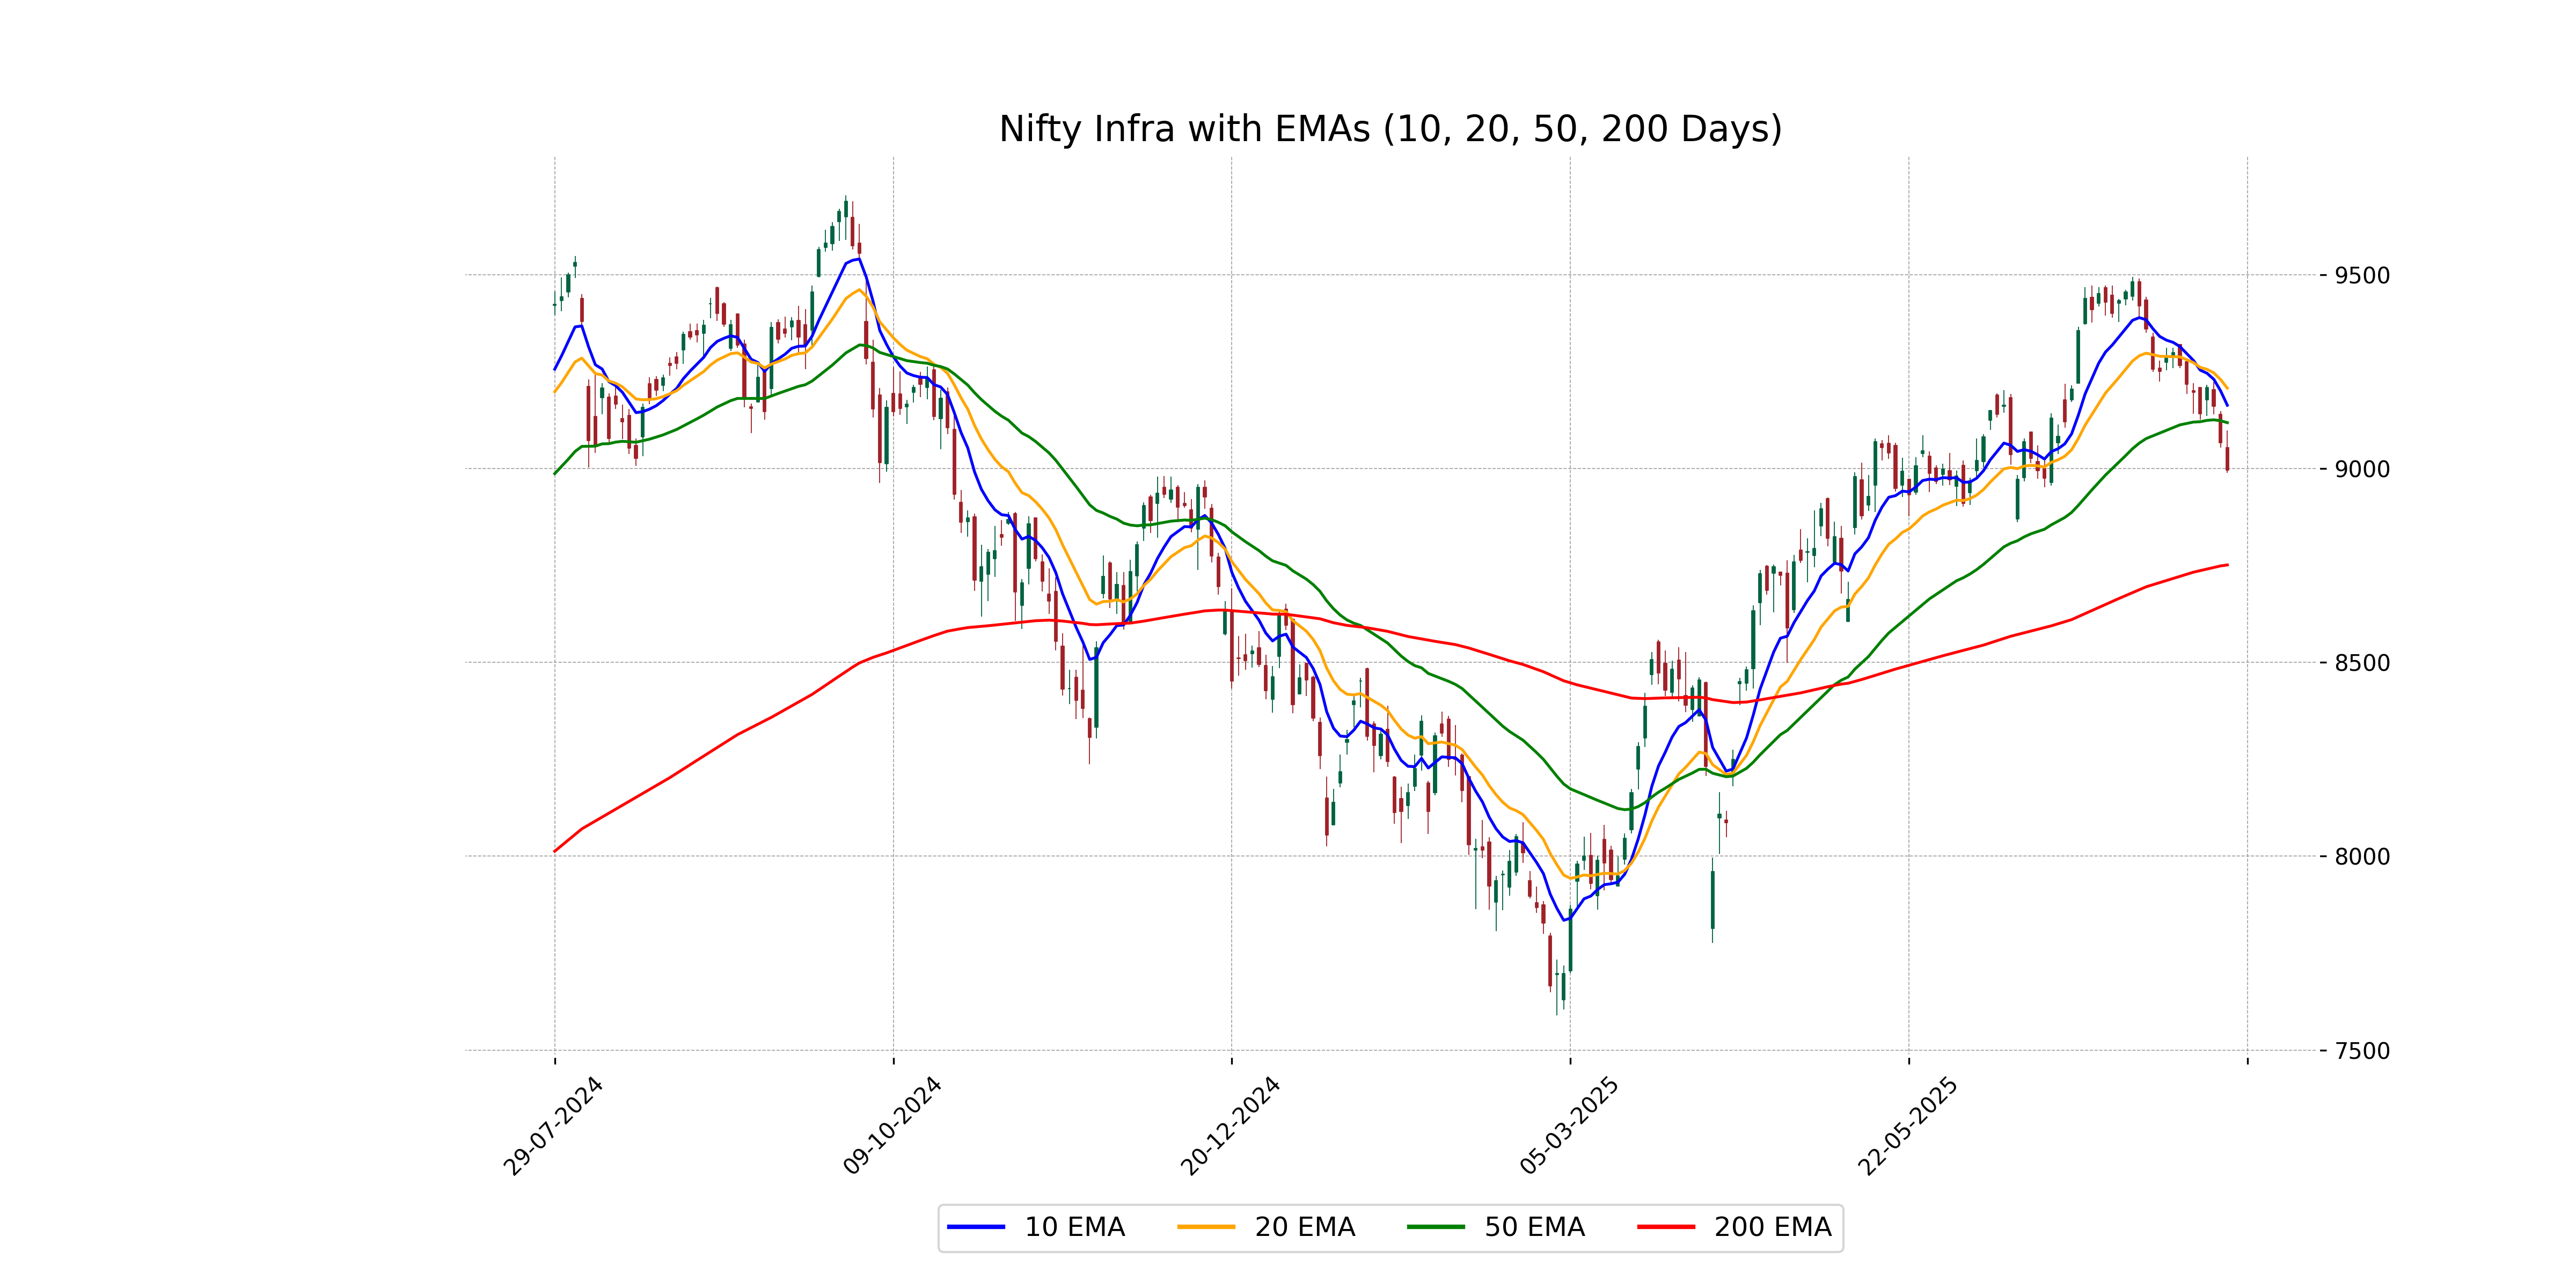
Relationship with Key Moving Averages
The Nifty Infra closed below its 50-day EMA (9118.34) and 10-day EMA (9163.24), indicating a potential bearish trend. However, it remains above the 200-day EMA (8751.29), suggesting long-term support.
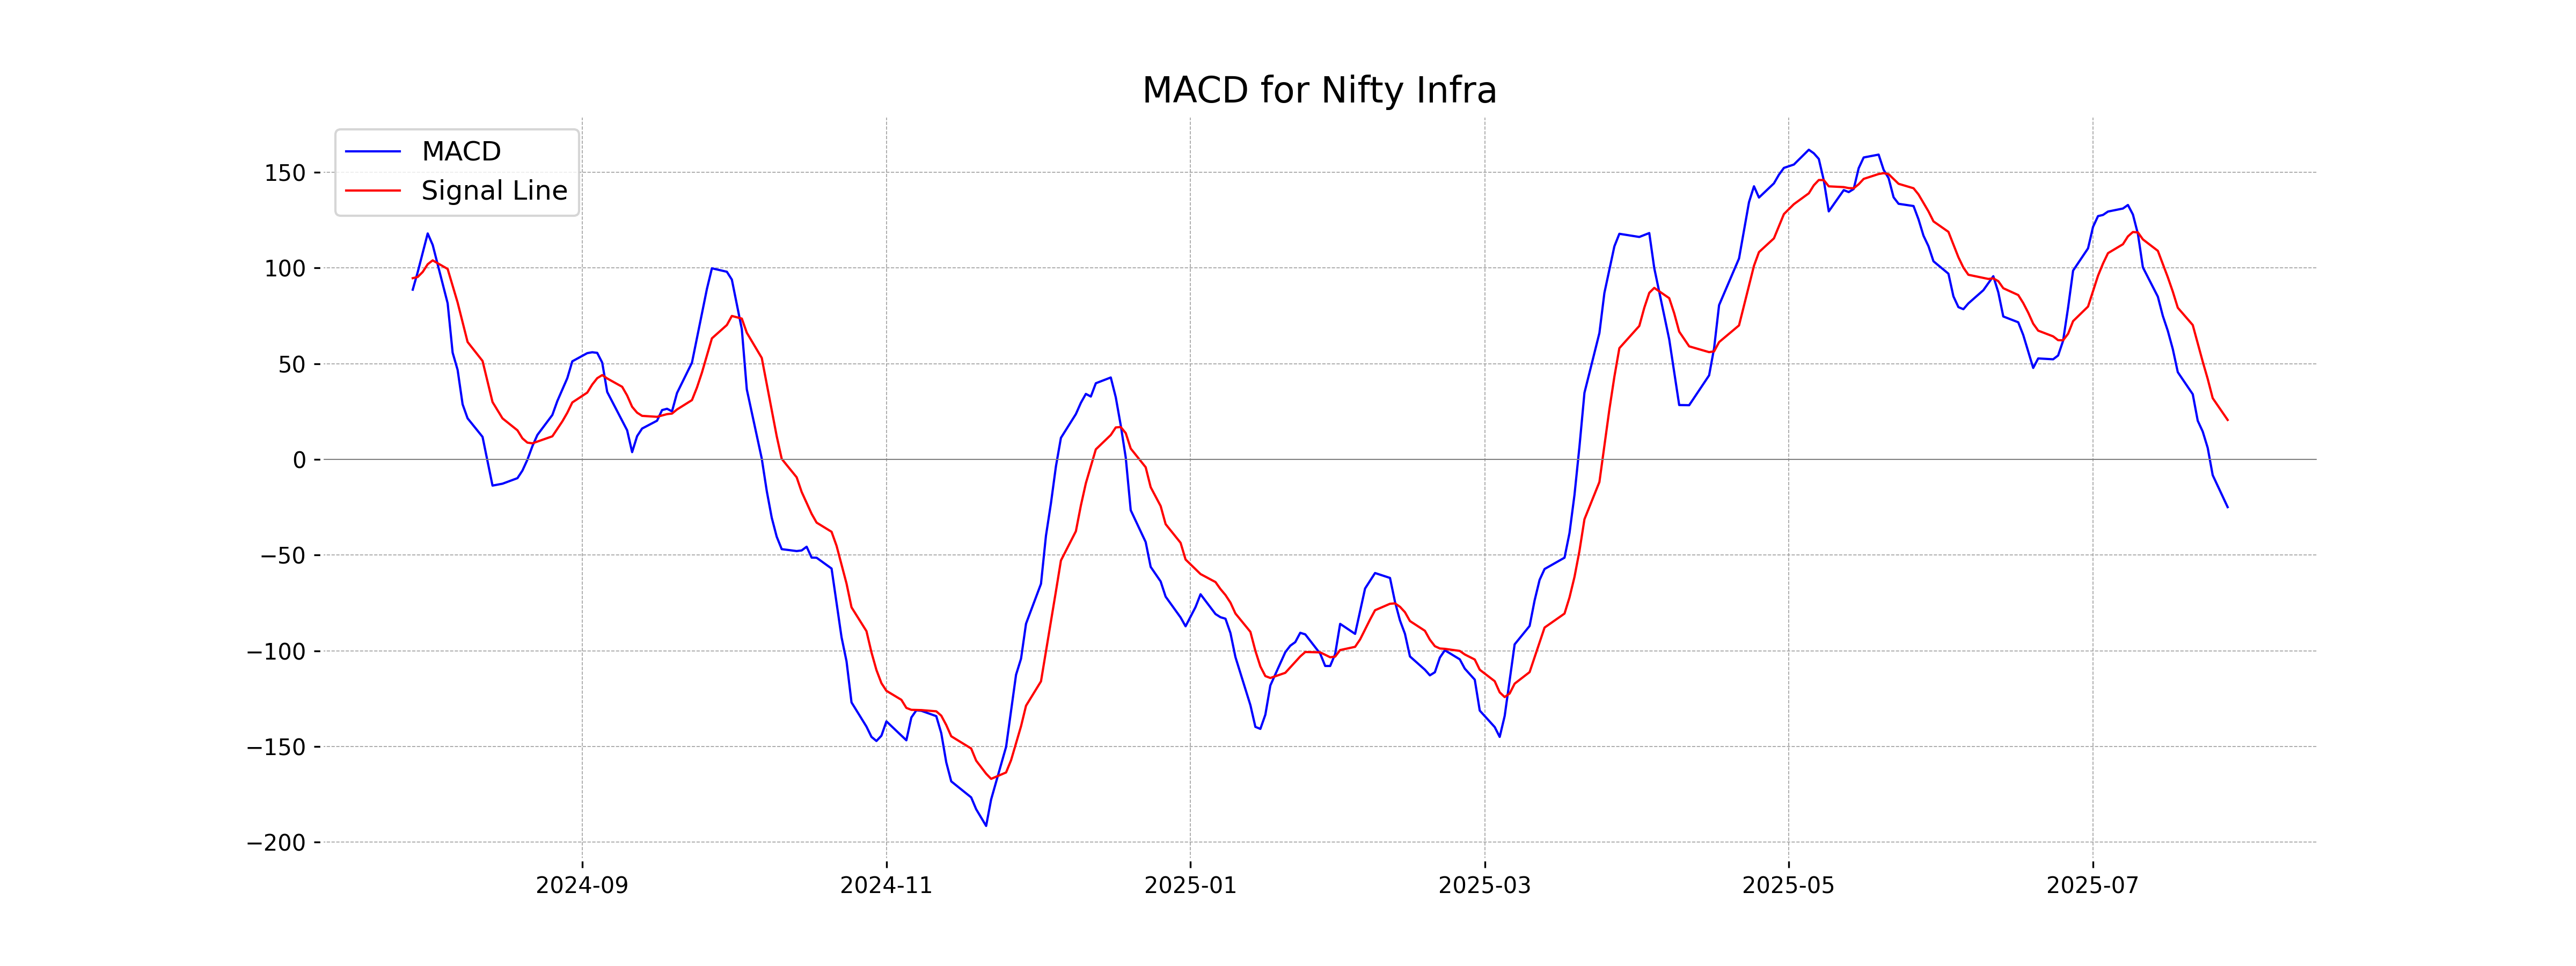
Moving Averages Trend (MACD)
The MACD for Nifty Infra is negative at -24.96 with a signal line at 20.59, indicating bearish momentum as the MACD line is below the signal line. Additionally, the RSI of 35.08 suggests that the stock might be approaching oversold conditions.
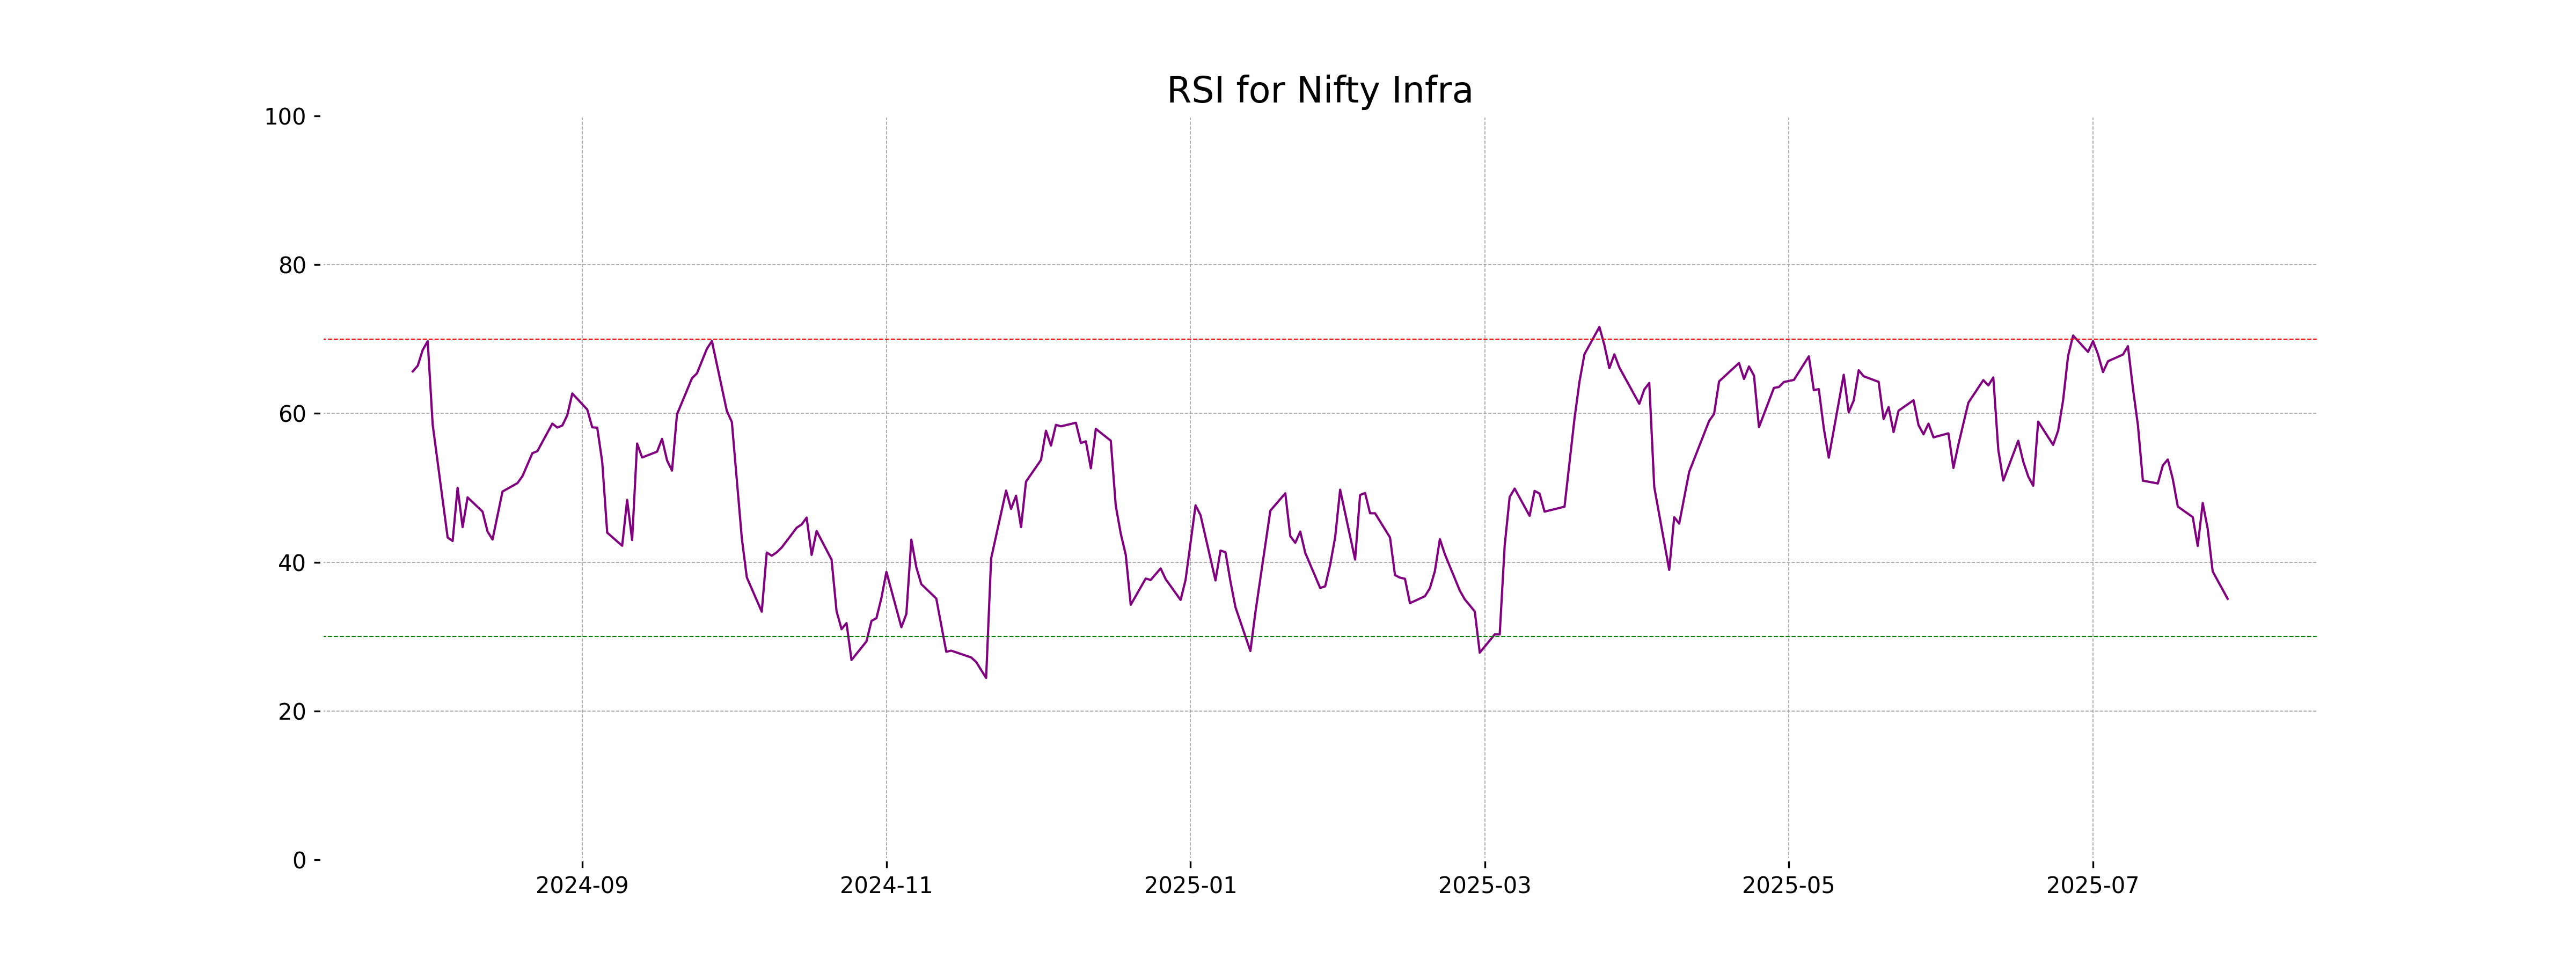
RSI Analysis
The RSI for Nifty Infra is 35.08, which indicates that the stock is nearing an oversold condition. This suggests that the stock may be undervalued, and a potential reversal to the upside could occur if the trend continues.
Analysis for Nifty IT - July 28, 2025
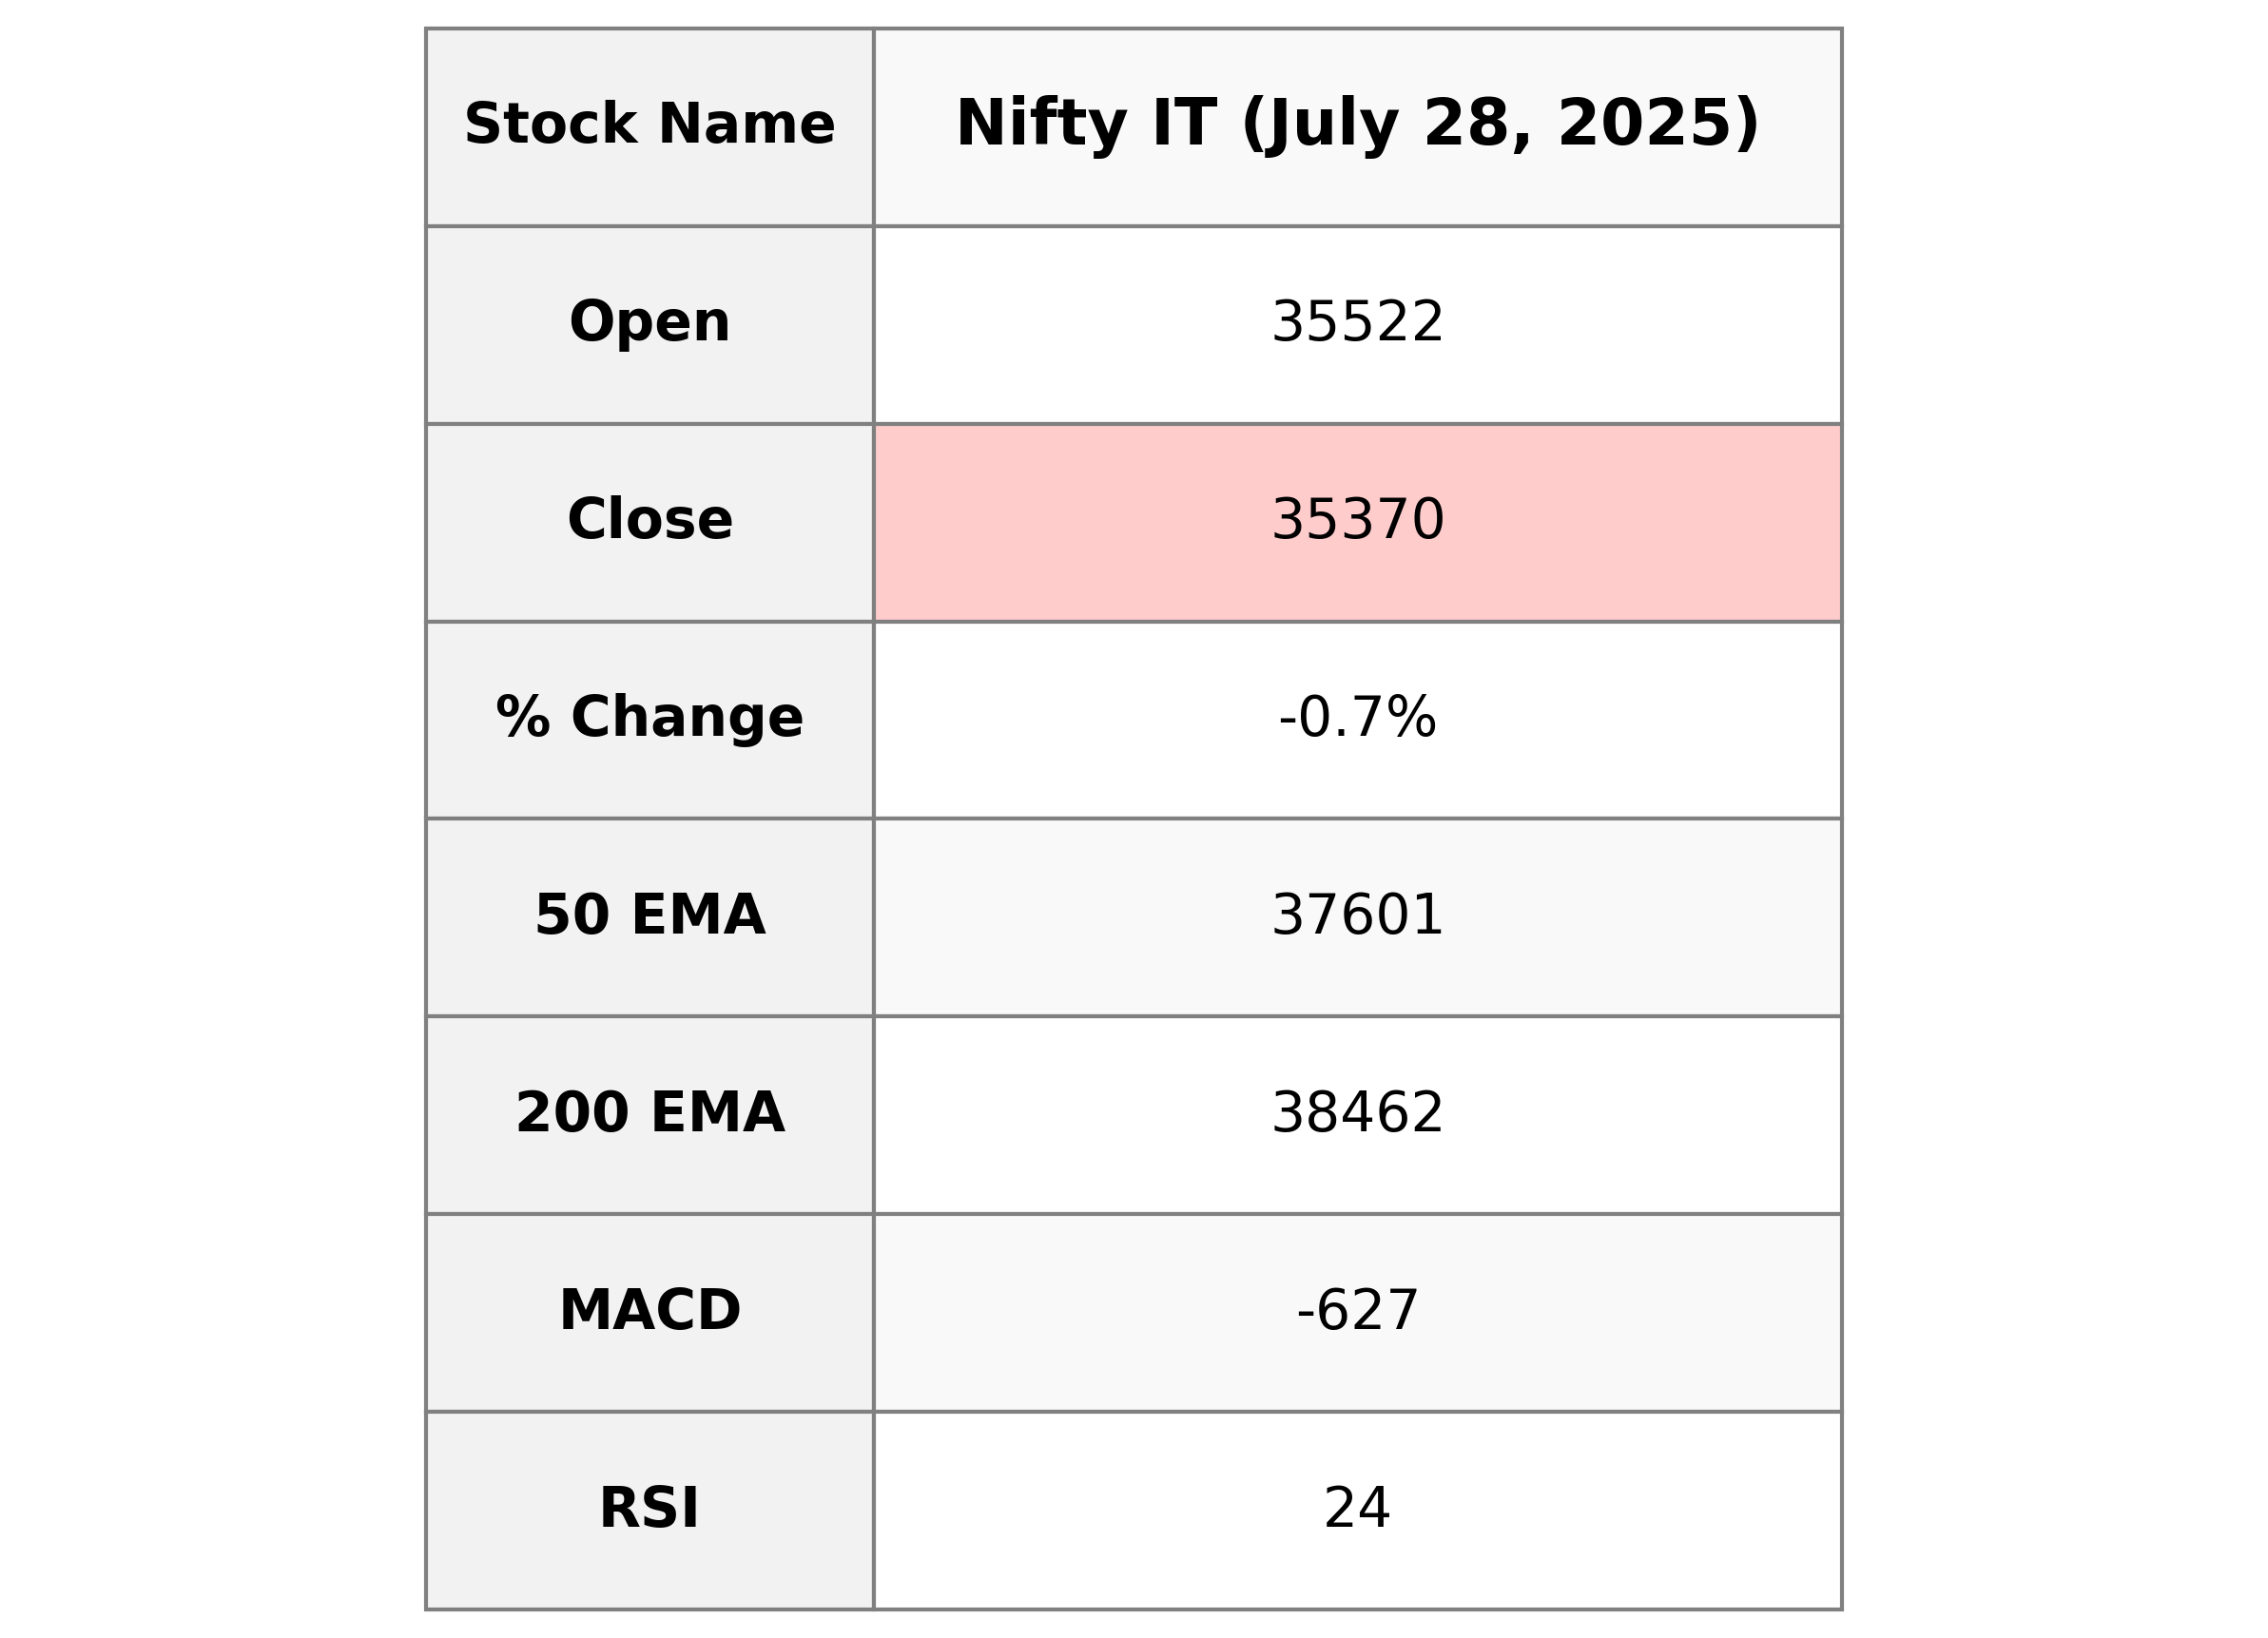
Nifty IT opened at 35,521.70, reached a high of 35,566.55, and closed at 35,370.05. It experienced a decline of approximately 0.71%, with a point change of -253.70. The relative strength index (RSI) is 23.96, suggesting it might be oversold, and the moving average convergence divergence (MACD) indicates negative momentum.
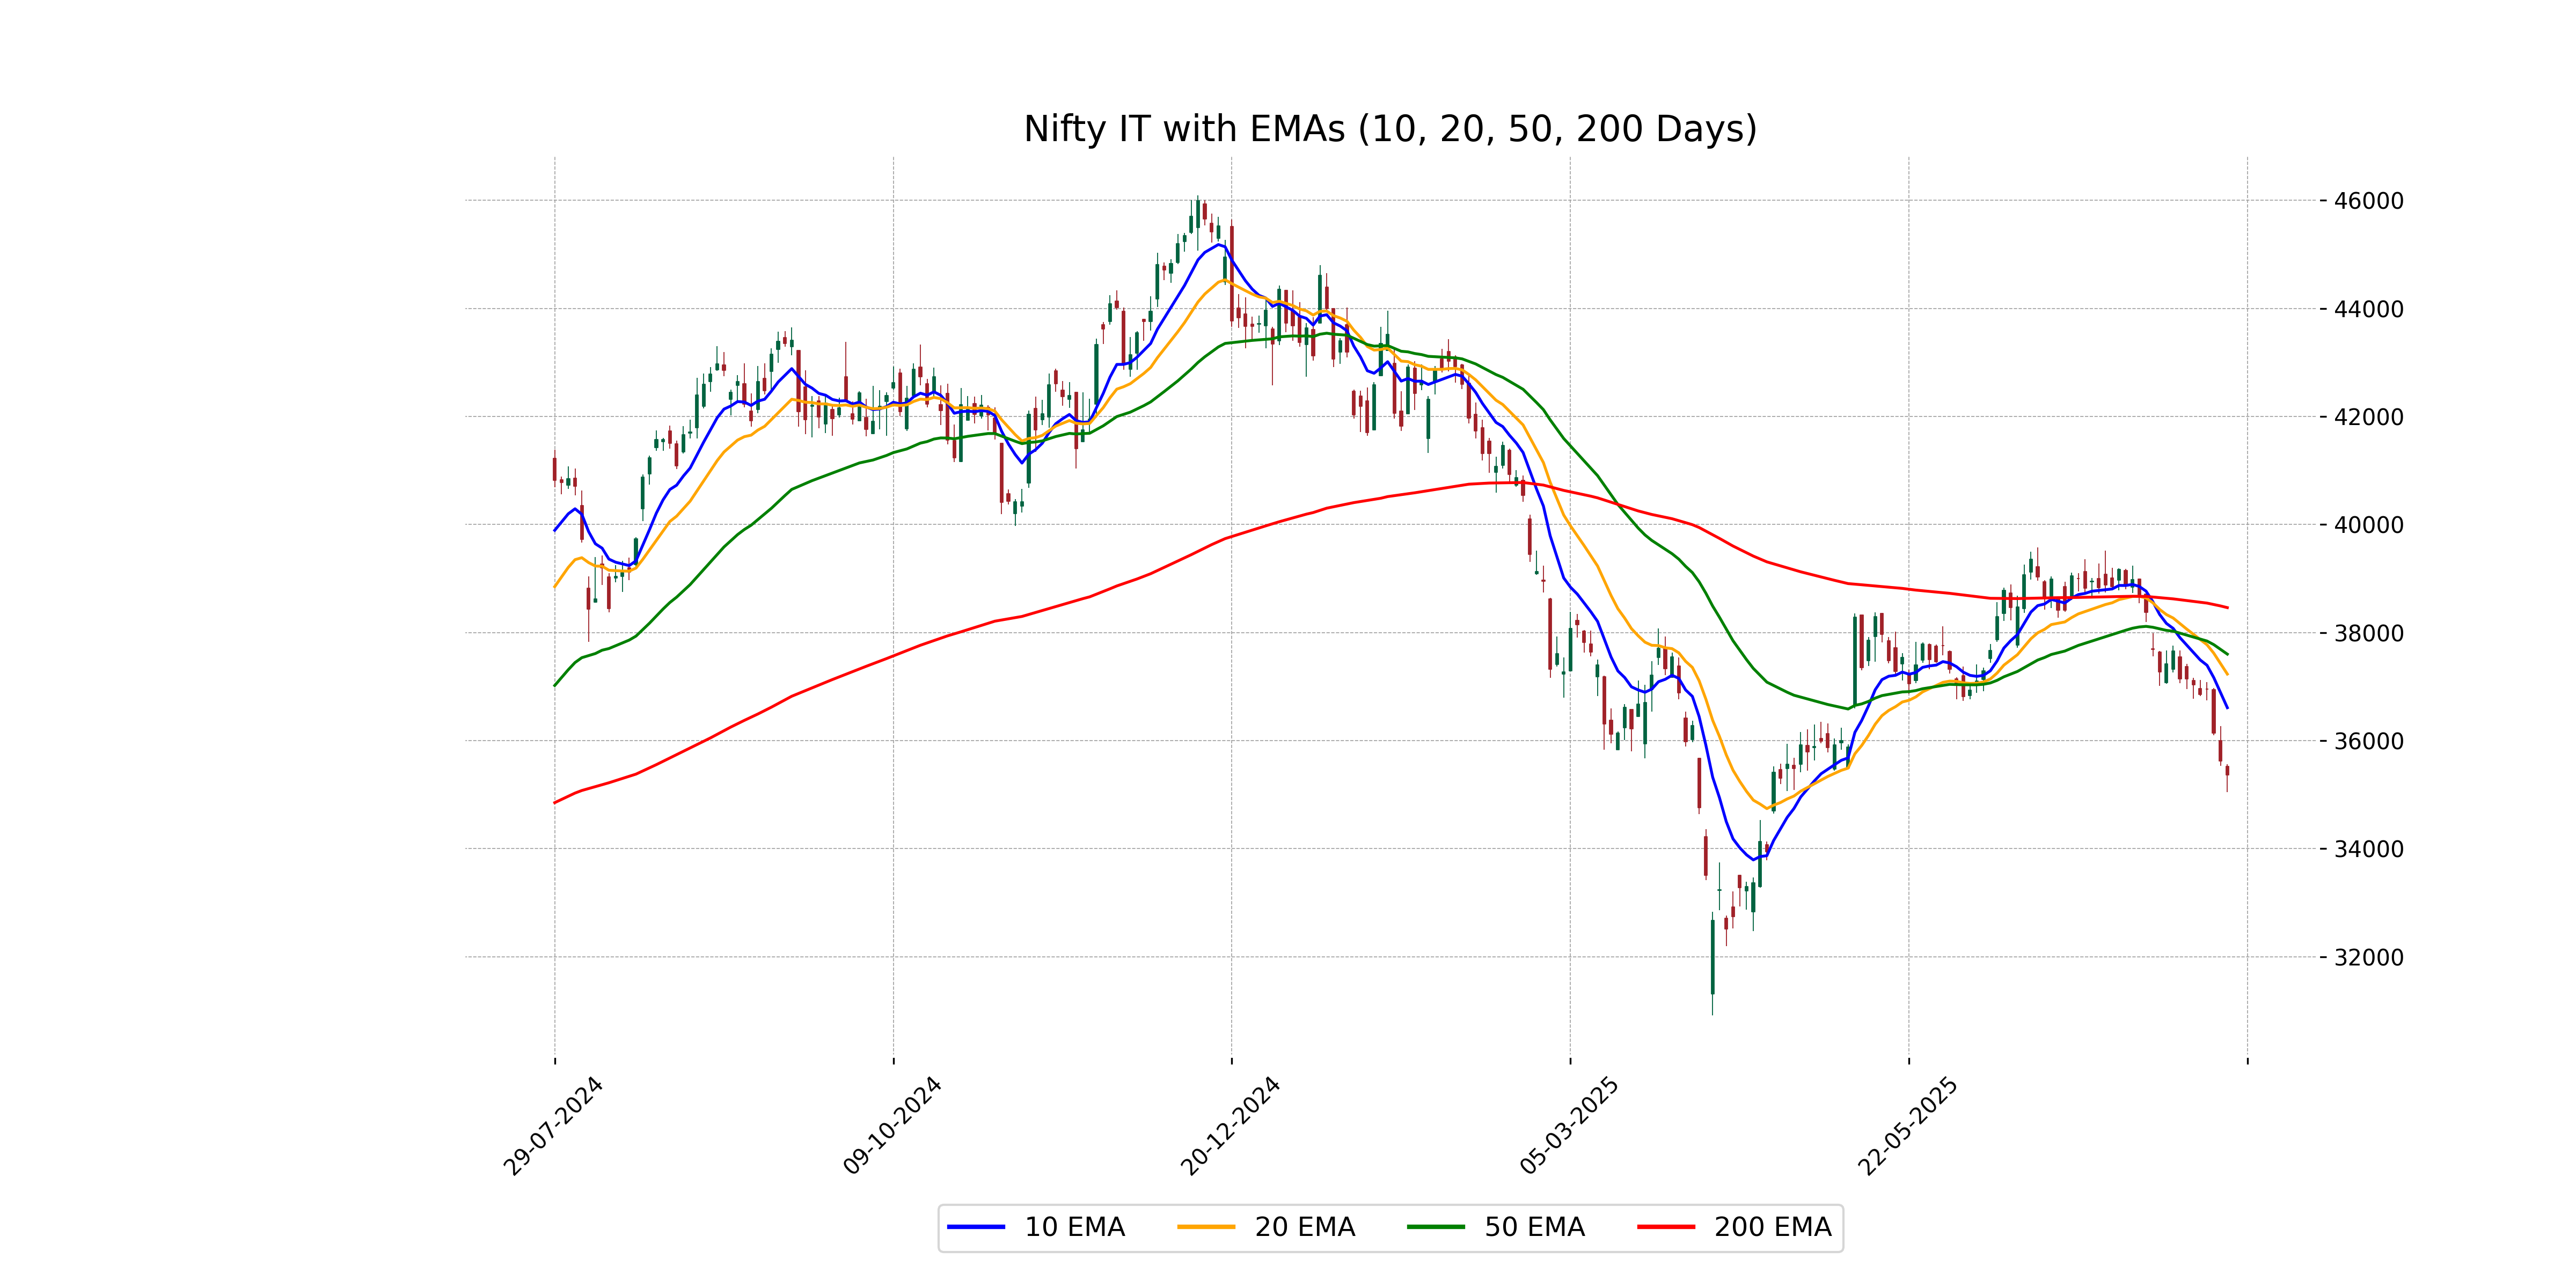
Relationship with Key Moving Averages
The Nifty IT index closed significantly below its key moving averages, with the close of 35370.05 compared to the 50 EMA at 37601.11 and the 200 EMA at 38461.90. This indicates the index is in a bearish trend, confirmed by the negative MACD value of -626.75 and a low RSI of 23.96, suggesting the market is oversold.
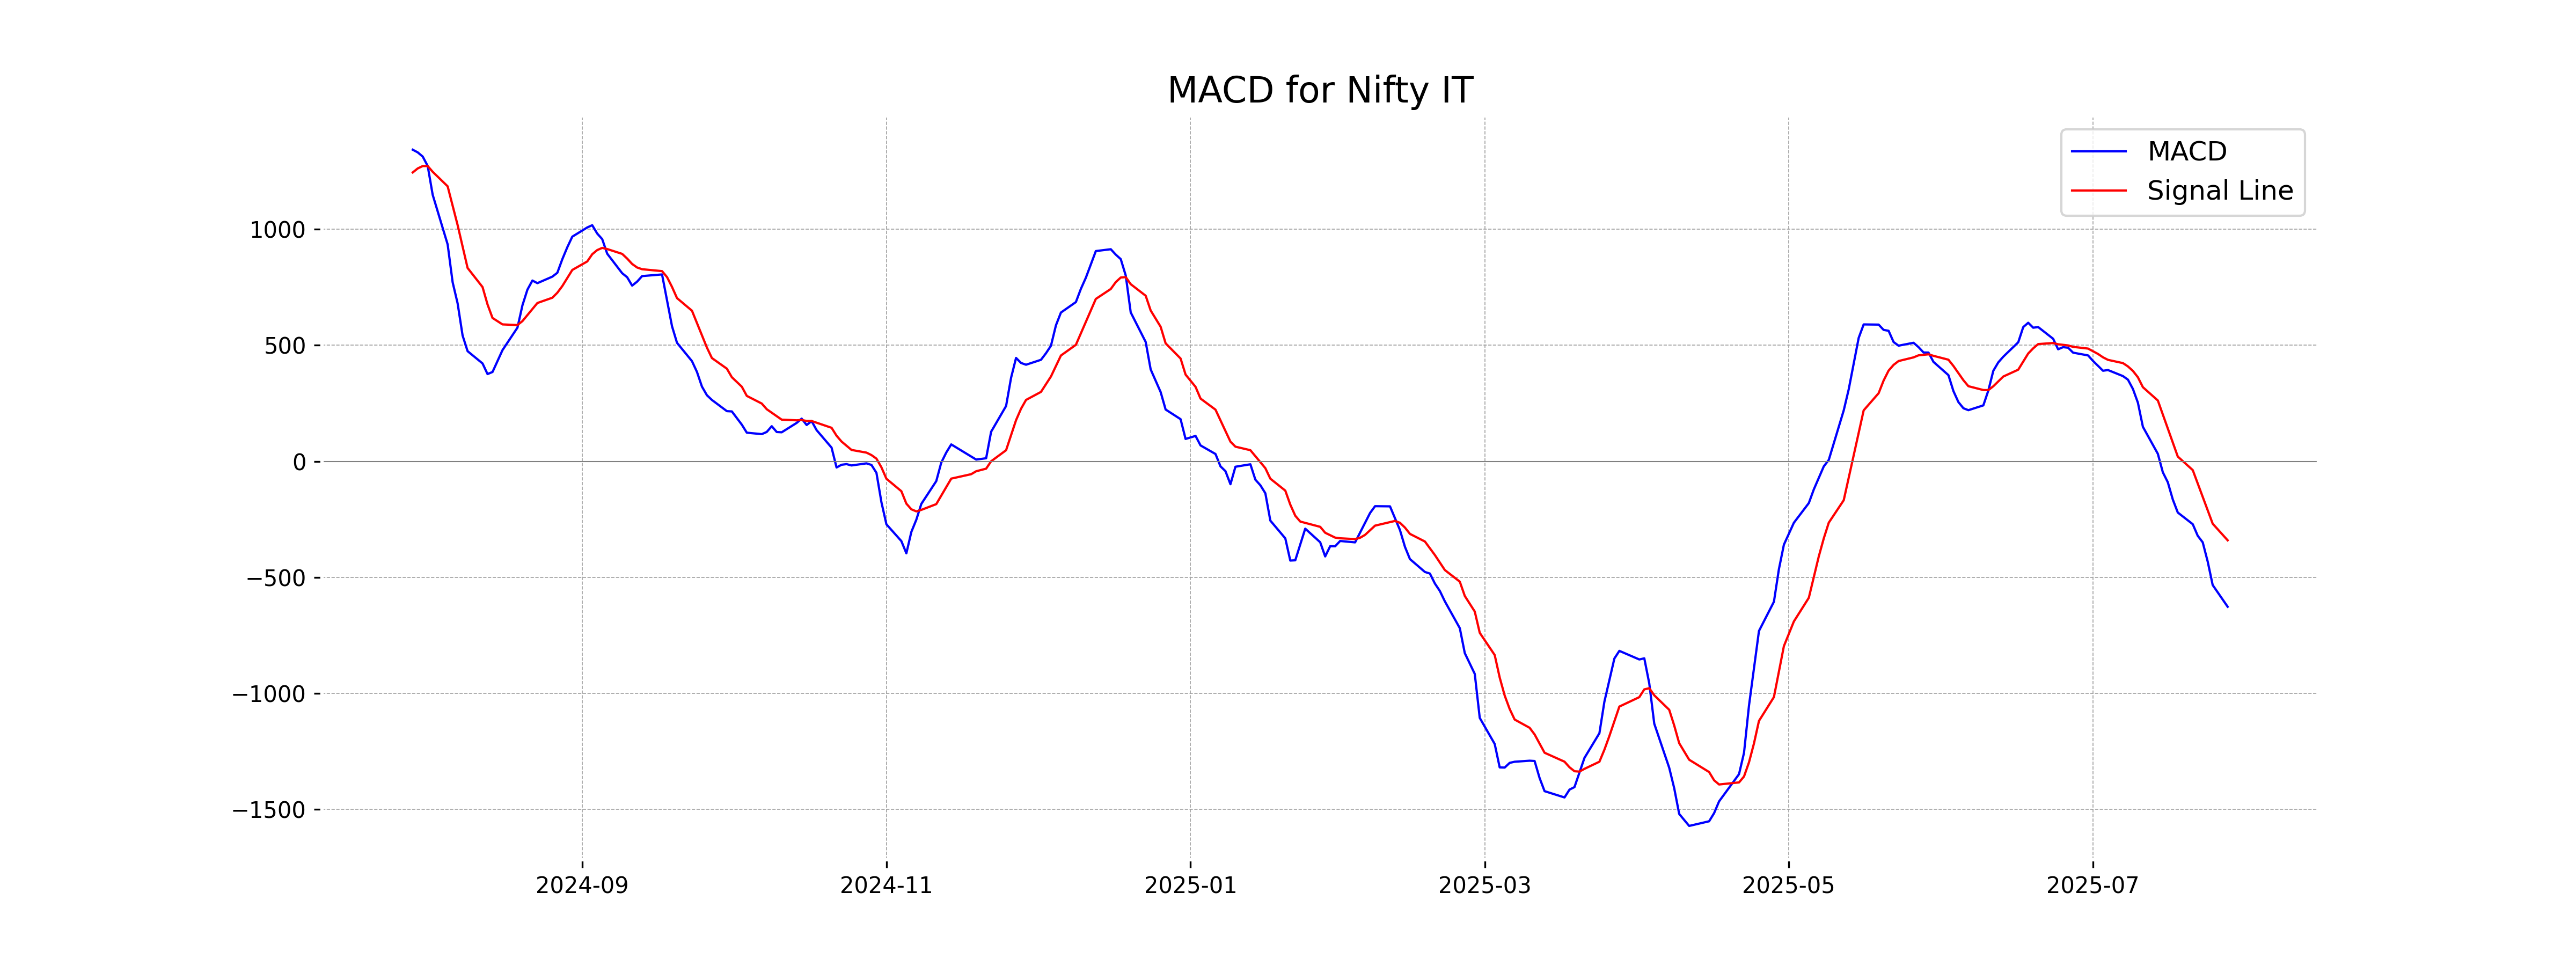
Moving Averages Trend (MACD)
The MACD for Nifty IT is -626.75, with a signal line at -340.51, indicating a bearish trend as the MACD line is below the signal line. Additionally, with the RSI at 23.96, the stock appears to be oversold, suggesting potential for a reversal.
RSI Analysis
The RSI for Nifty IT stands at 23.96, which indicates that the stock is currently in the oversold territory. Values below 30 often suggest that the stock may be undervalued and could experience a potential price reversal or bounce.

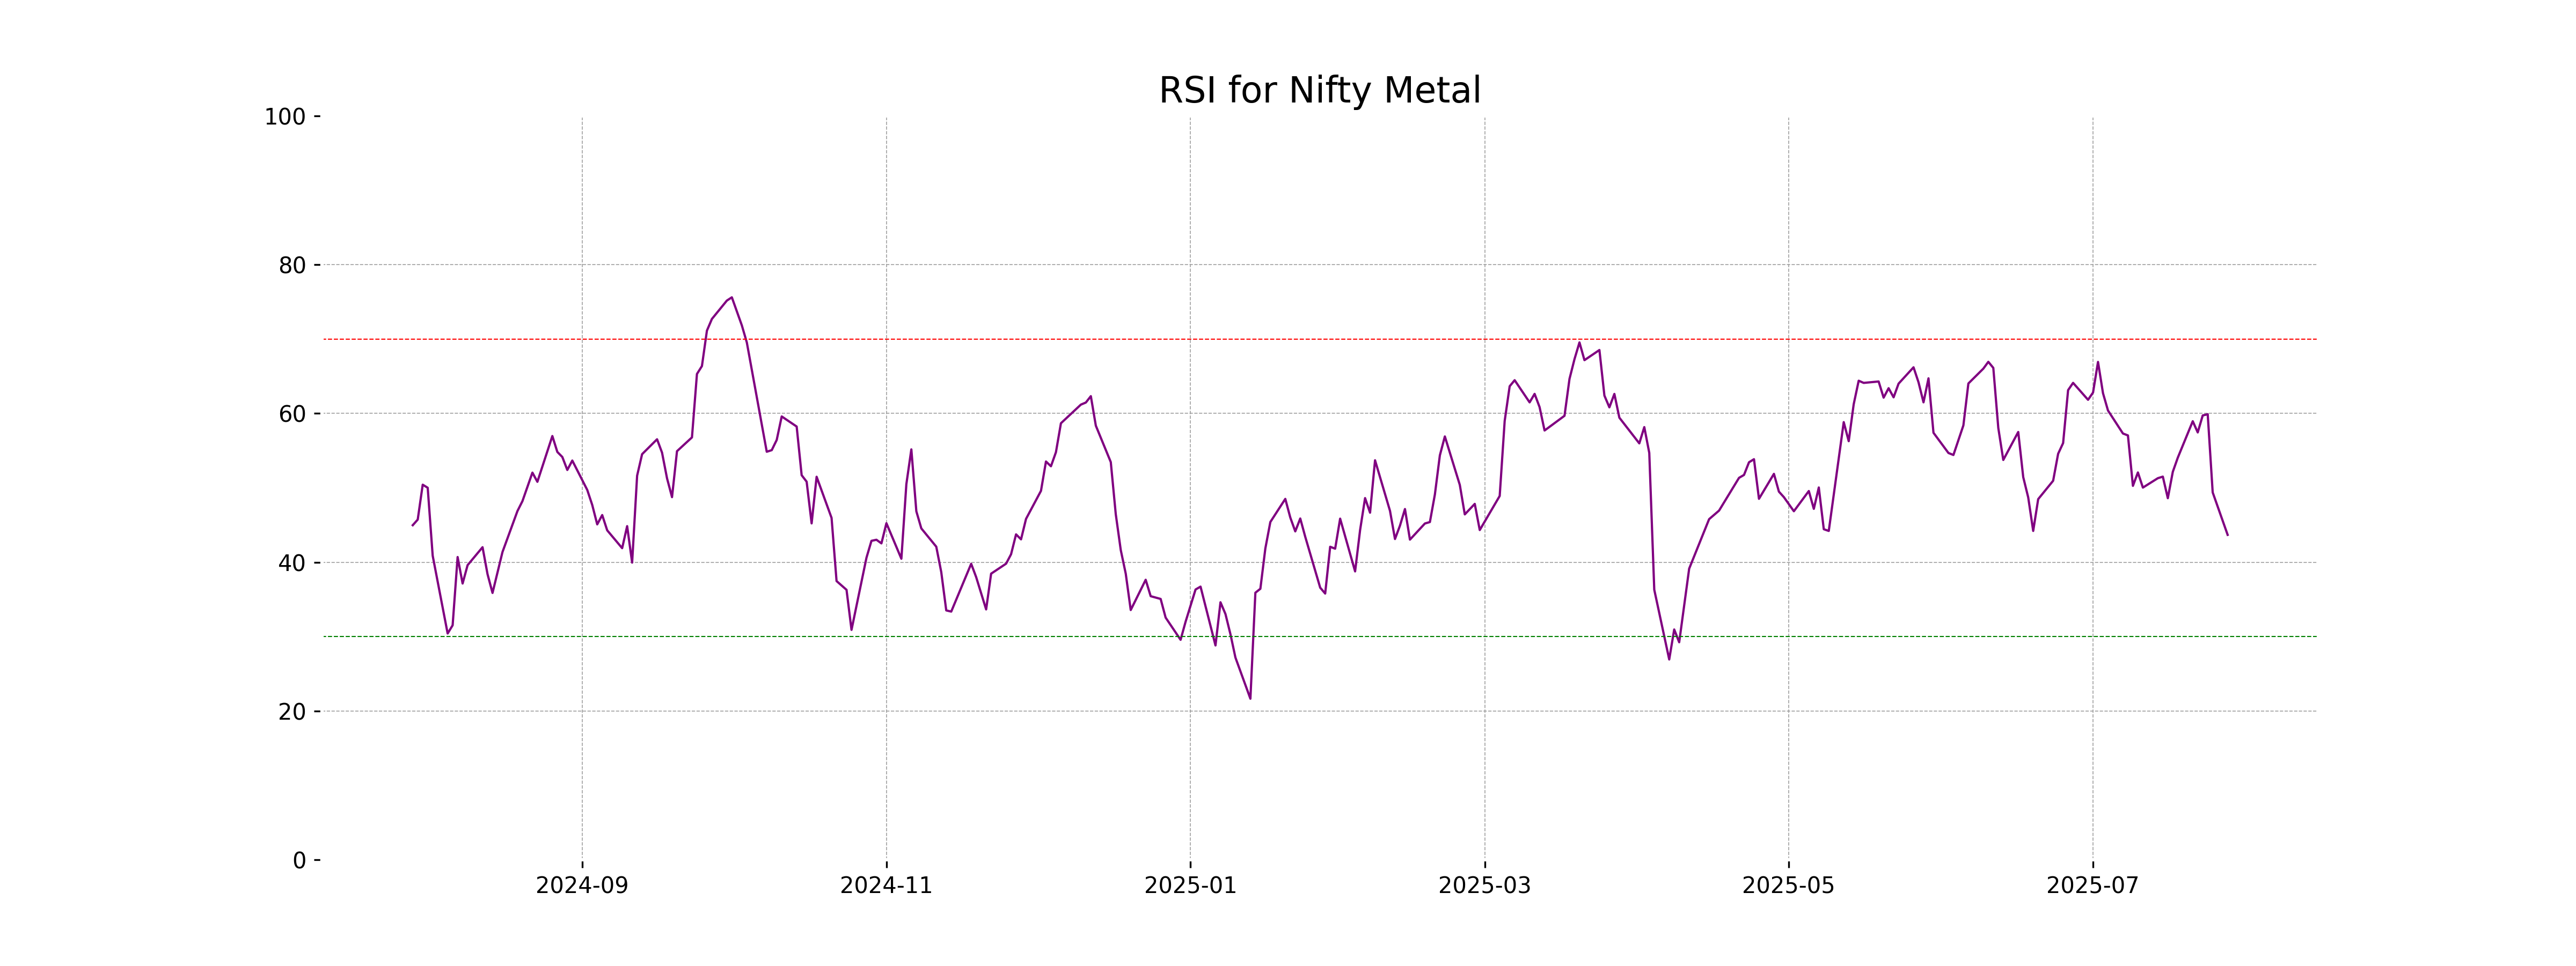
Analysis for Nifty Metal - July 28, 2025

Nifty Metal opened at 9418.10, reached a high of 9432.50, and closed at 9316.45, marking a decline of 1.15% from the previous close of 9425.10, with a points change of -108.65. The RSI stands at 43.68, indicating relatively weak momentum, and the MACD is below its signal line, suggesting a bearish trend.
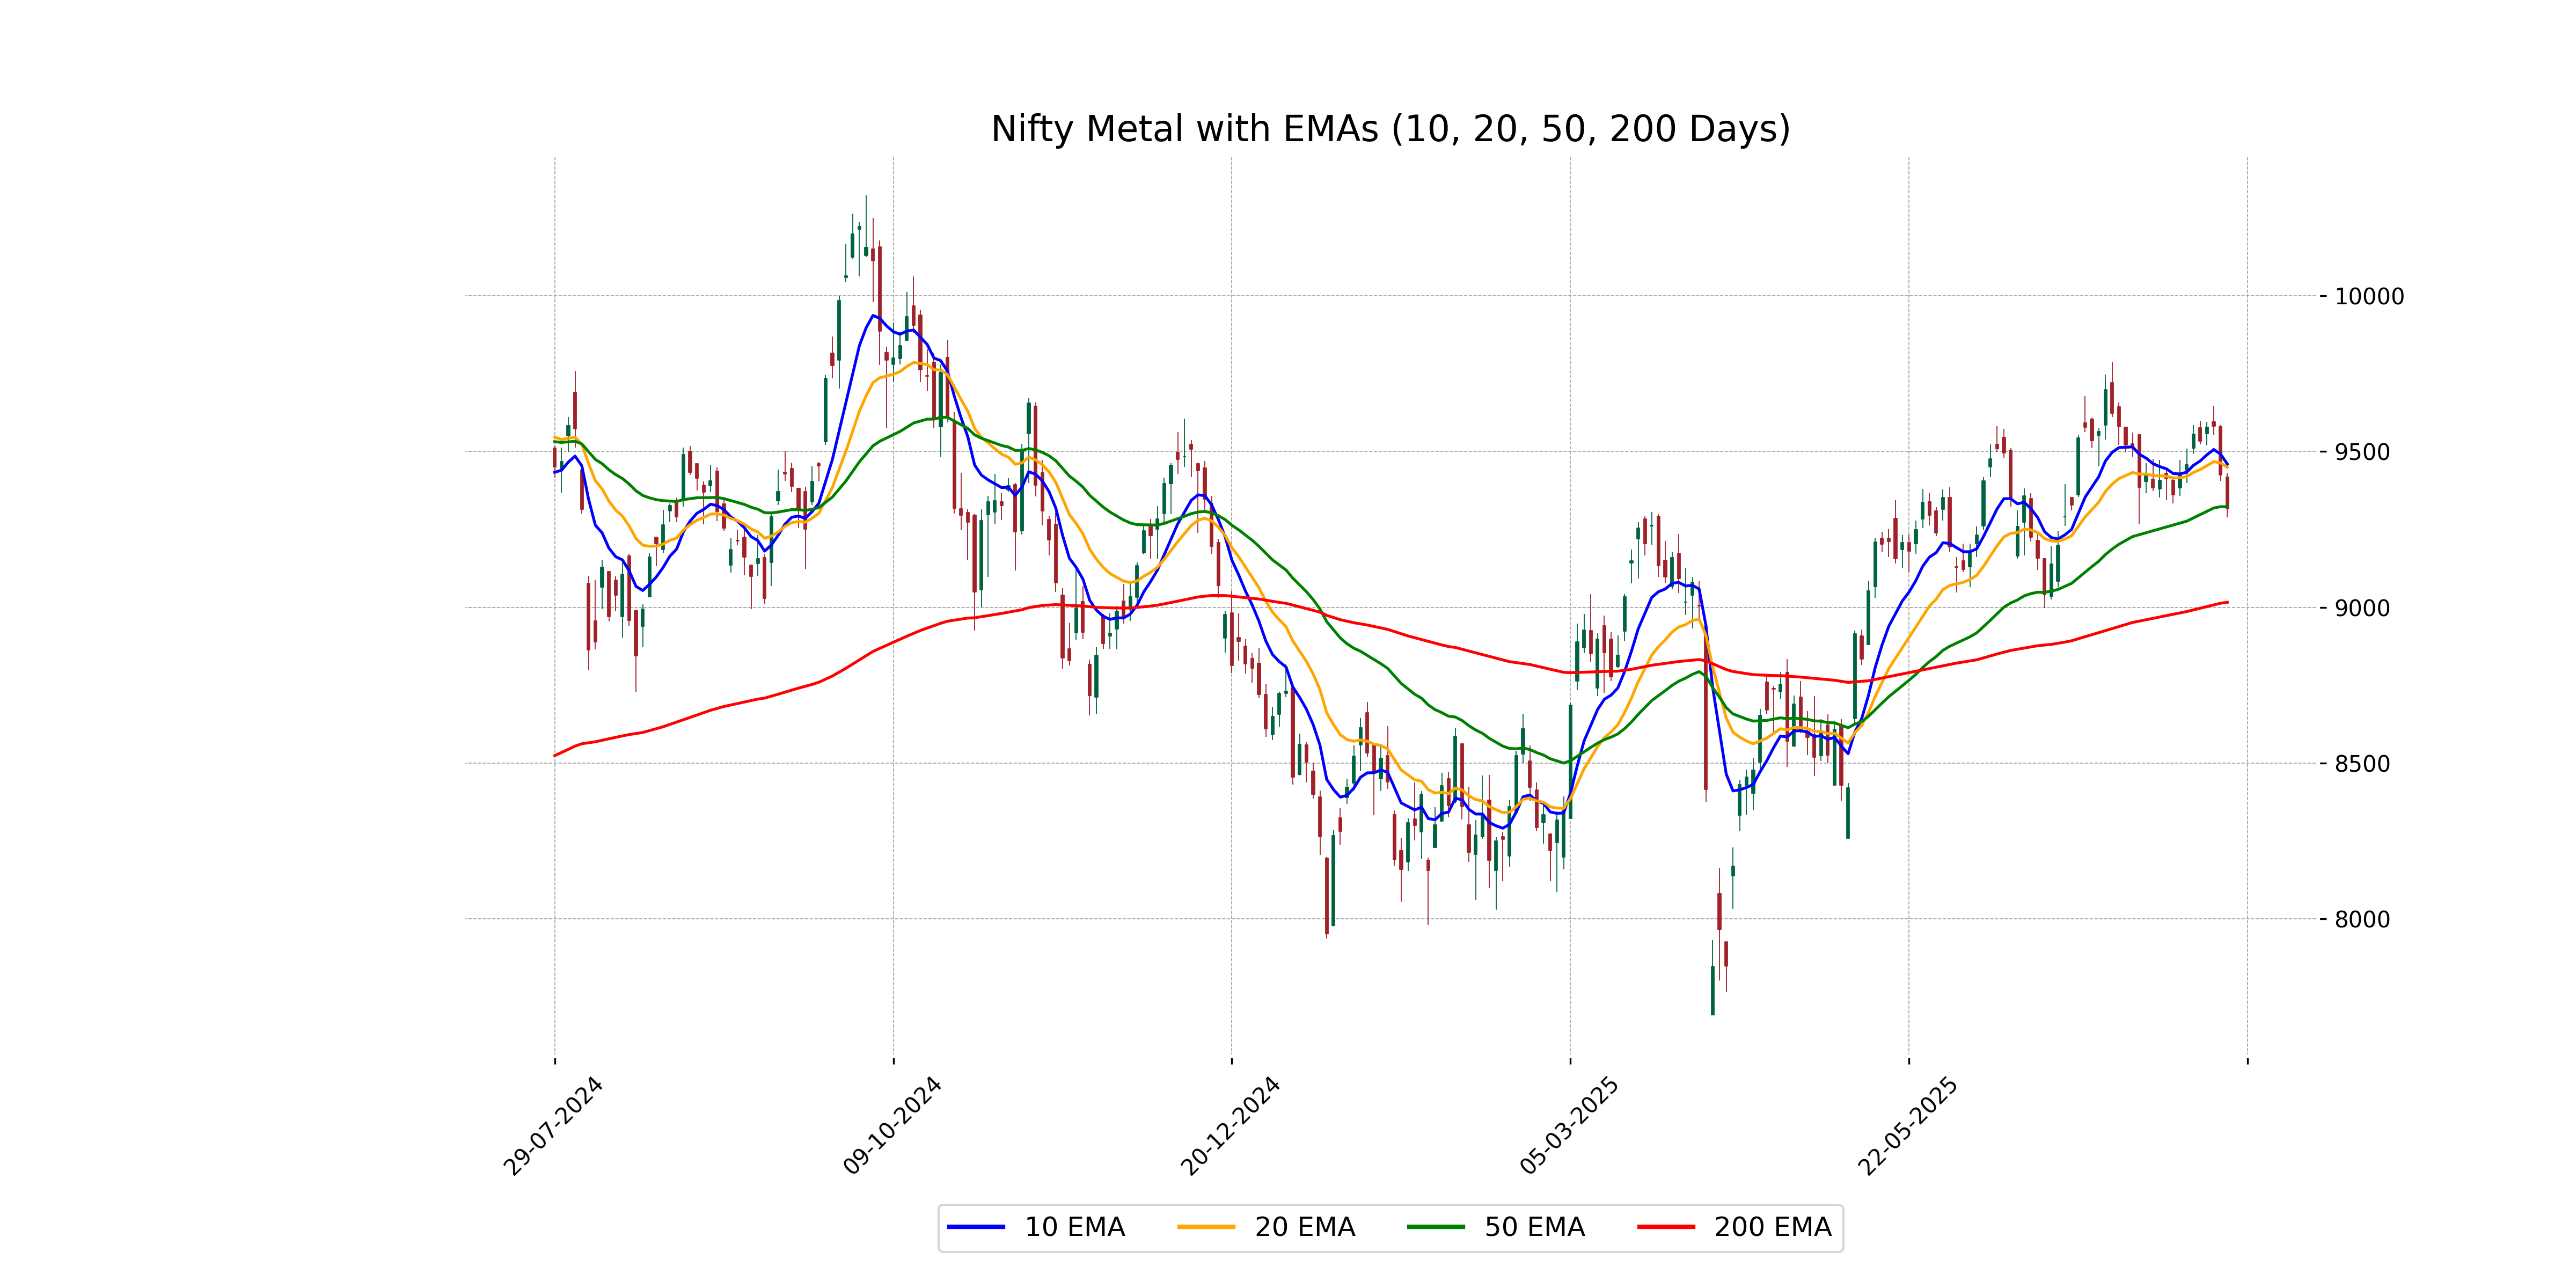
Relationship with Key Moving Averages
The Nifty Metal index closed below its 10-day EMA (9459.88) and 20-day EMA (9449.49), indicating a short-term downtrend. However, it is close to its 50-day EMA (9322.75), suggesting potential near-term support around current levels.
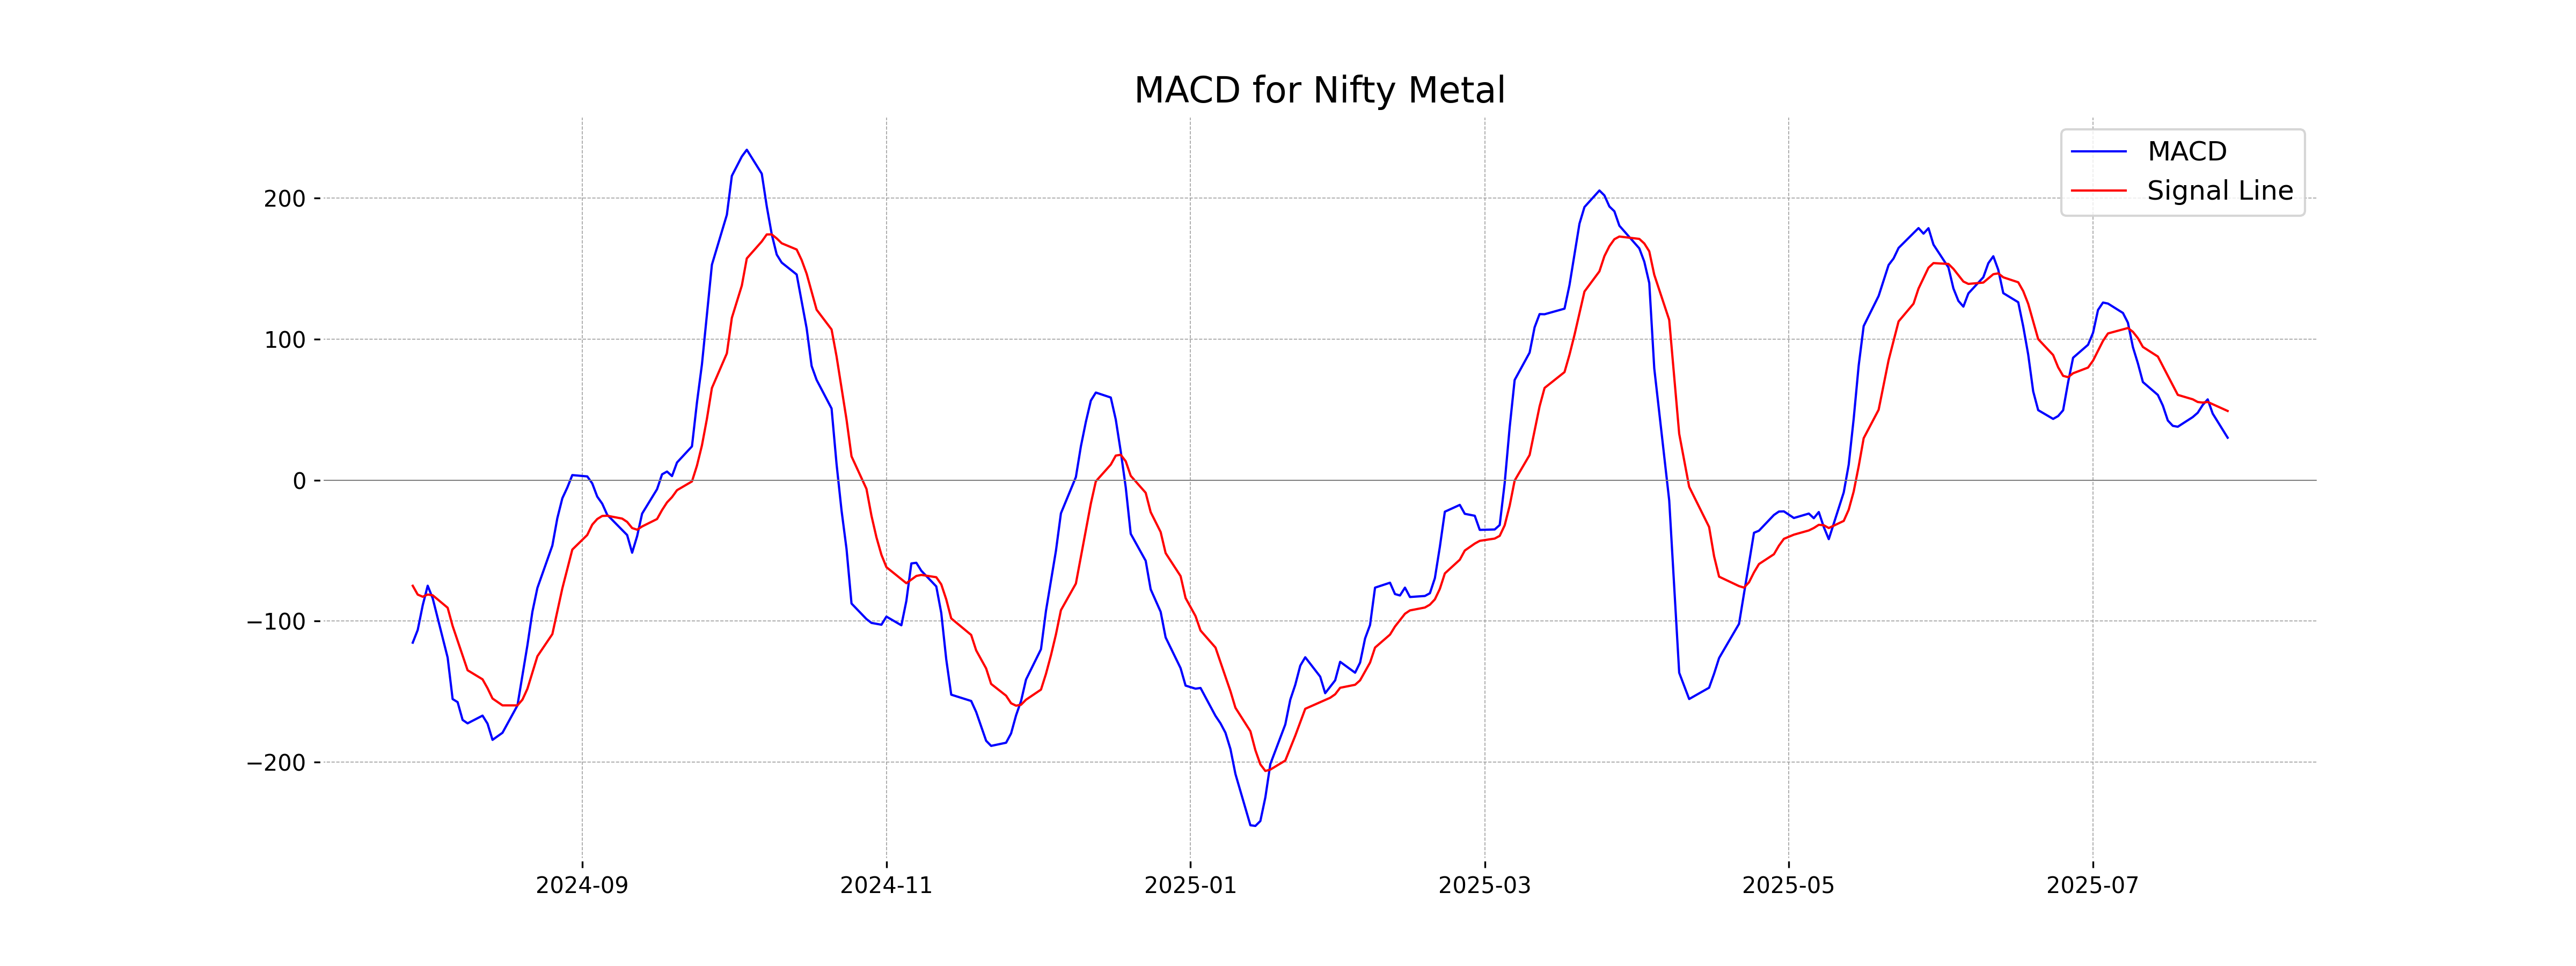
Moving Averages Trend (MACD)
Nifty Metal MACD Analysis: The MACD value for Nifty Metal is 30.14, which is below the signal line of 49.11. This indicates a bearish momentum, suggesting that the stock may experience downward pressure in the short term.
RSI Analysis
The RSI for Nifty Metal is currently at 43.68, which indicates that the index is in the neutral zone and not yet oversold or overbought. This suggests there is no strong momentum indicating a trend reversal or continuation at this point.
Analysis for Nifty Bank - July 28, 2025

Nifty Bank opened at 56,215.10 and closed at 56,084.90, registering a decrease of 444 points, which is a change of -0.79%. The stock's RSI is 43.10, indicating it is nearing oversold territory. The current price is below the 10 and 20 EMAs, but slightly above the 50 EMA.
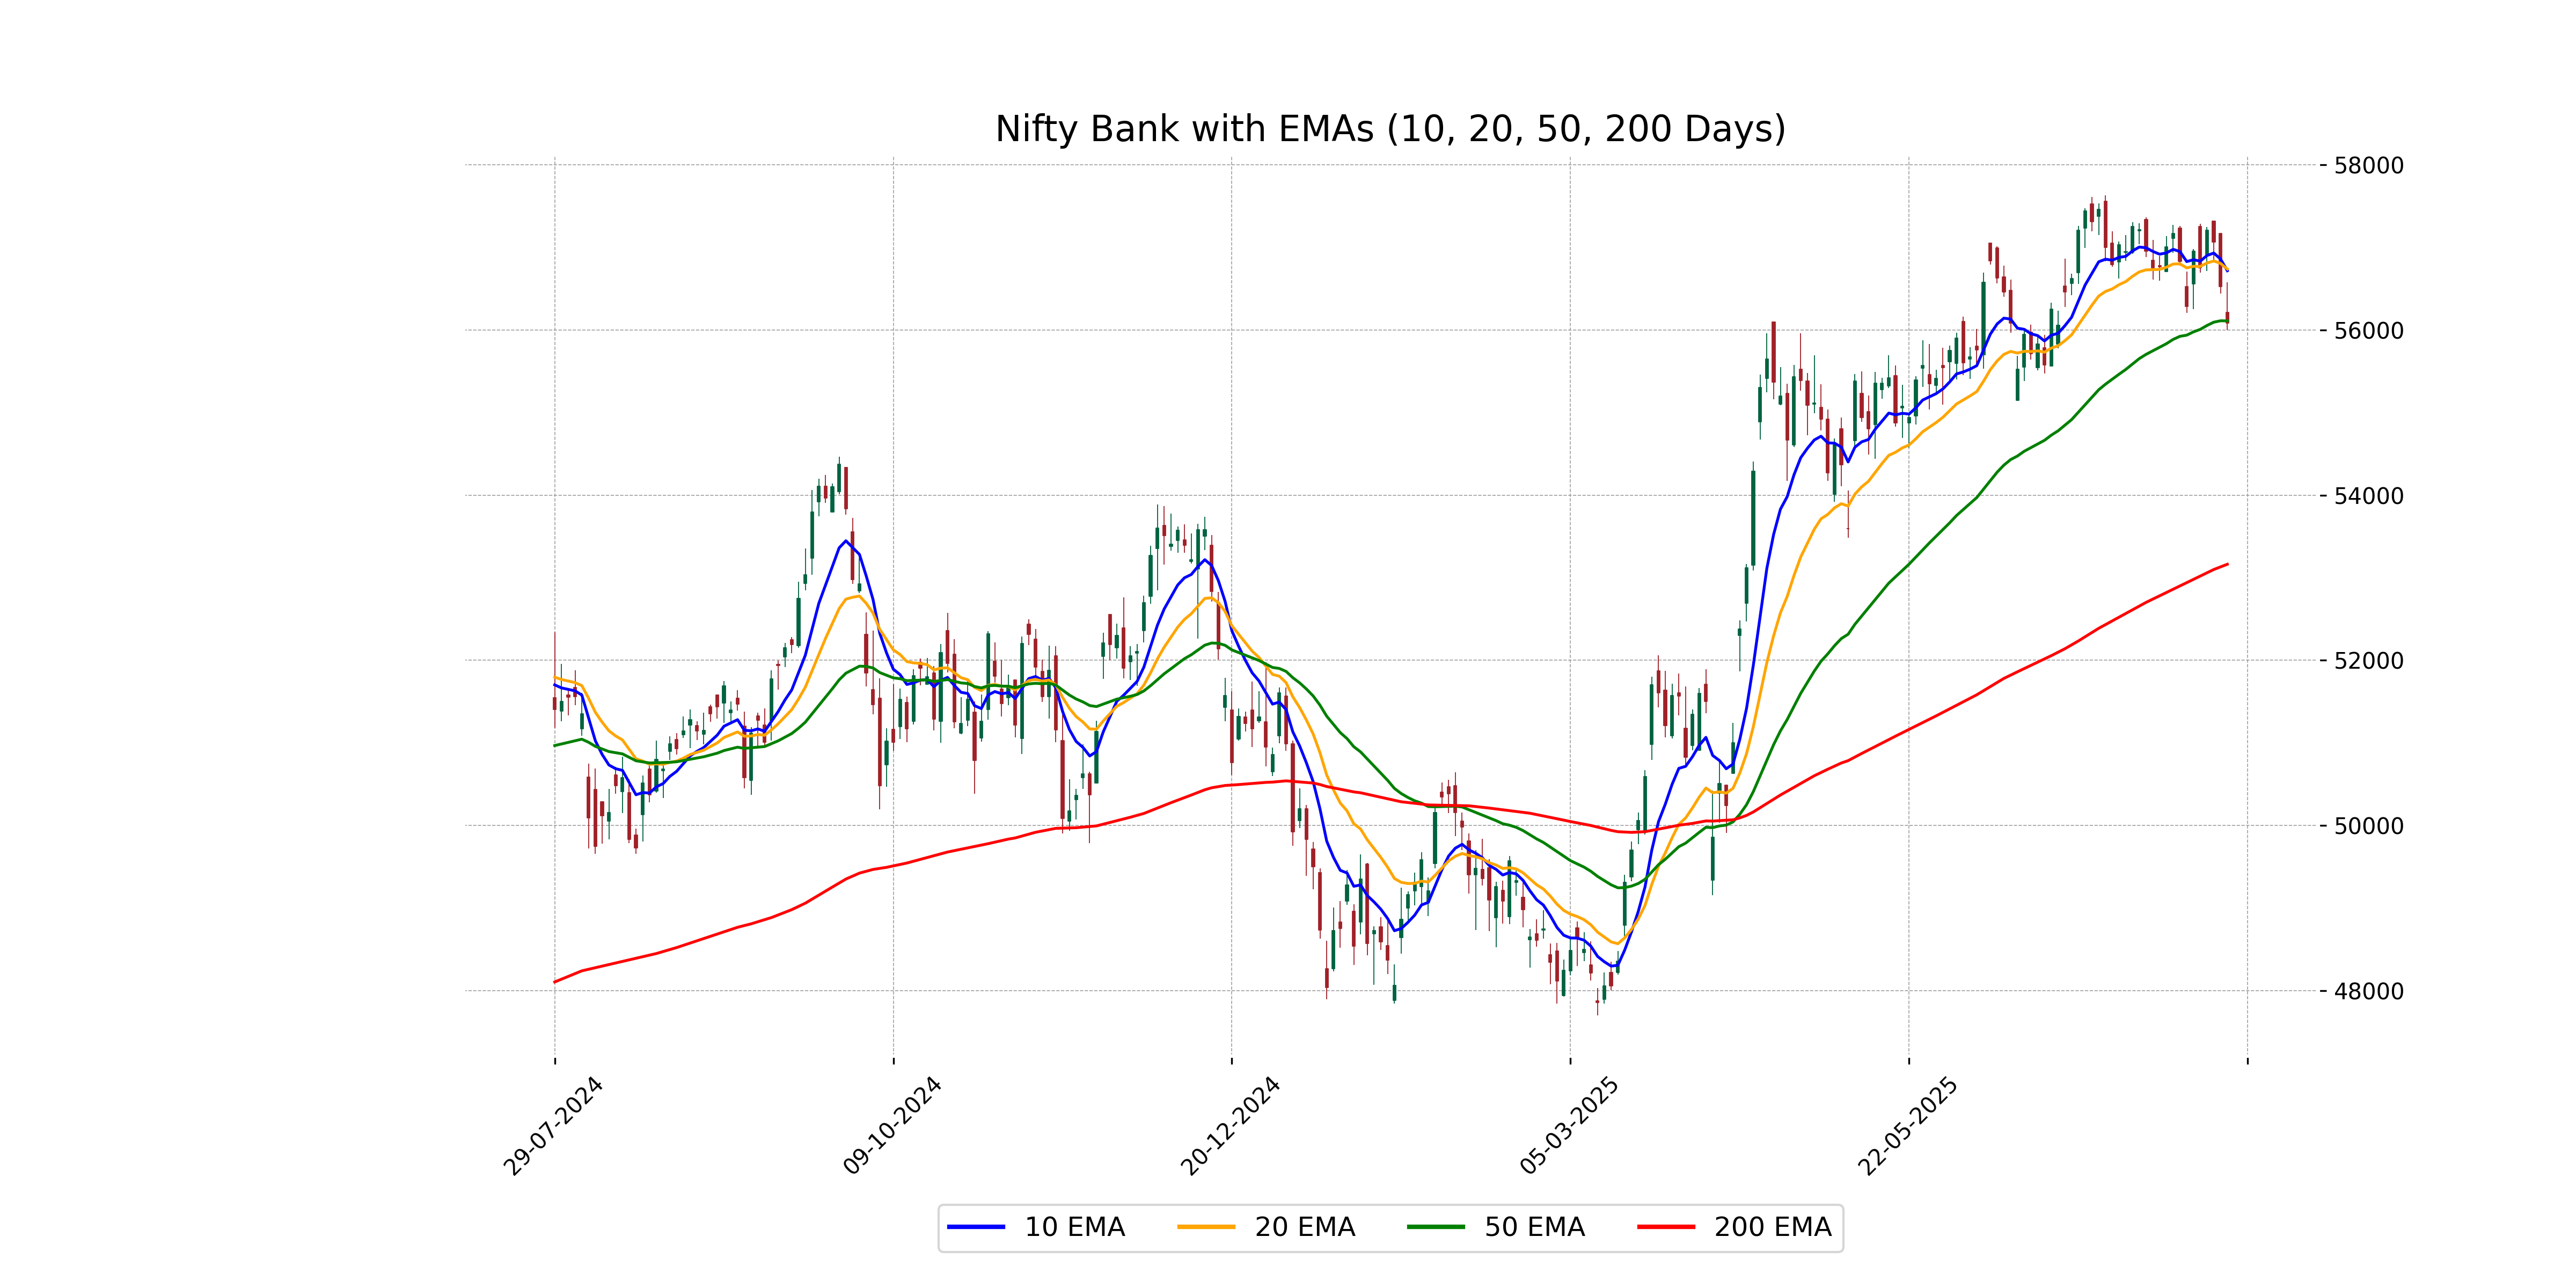
Relationship with Key Moving Averages
The Nifty Bank close of 56084.90 is below the 10 EMA and 20 EMA, indicating a short-term bearish trend. However, it is close to the 50 EMA of 56110.72, suggesting a possible support level.
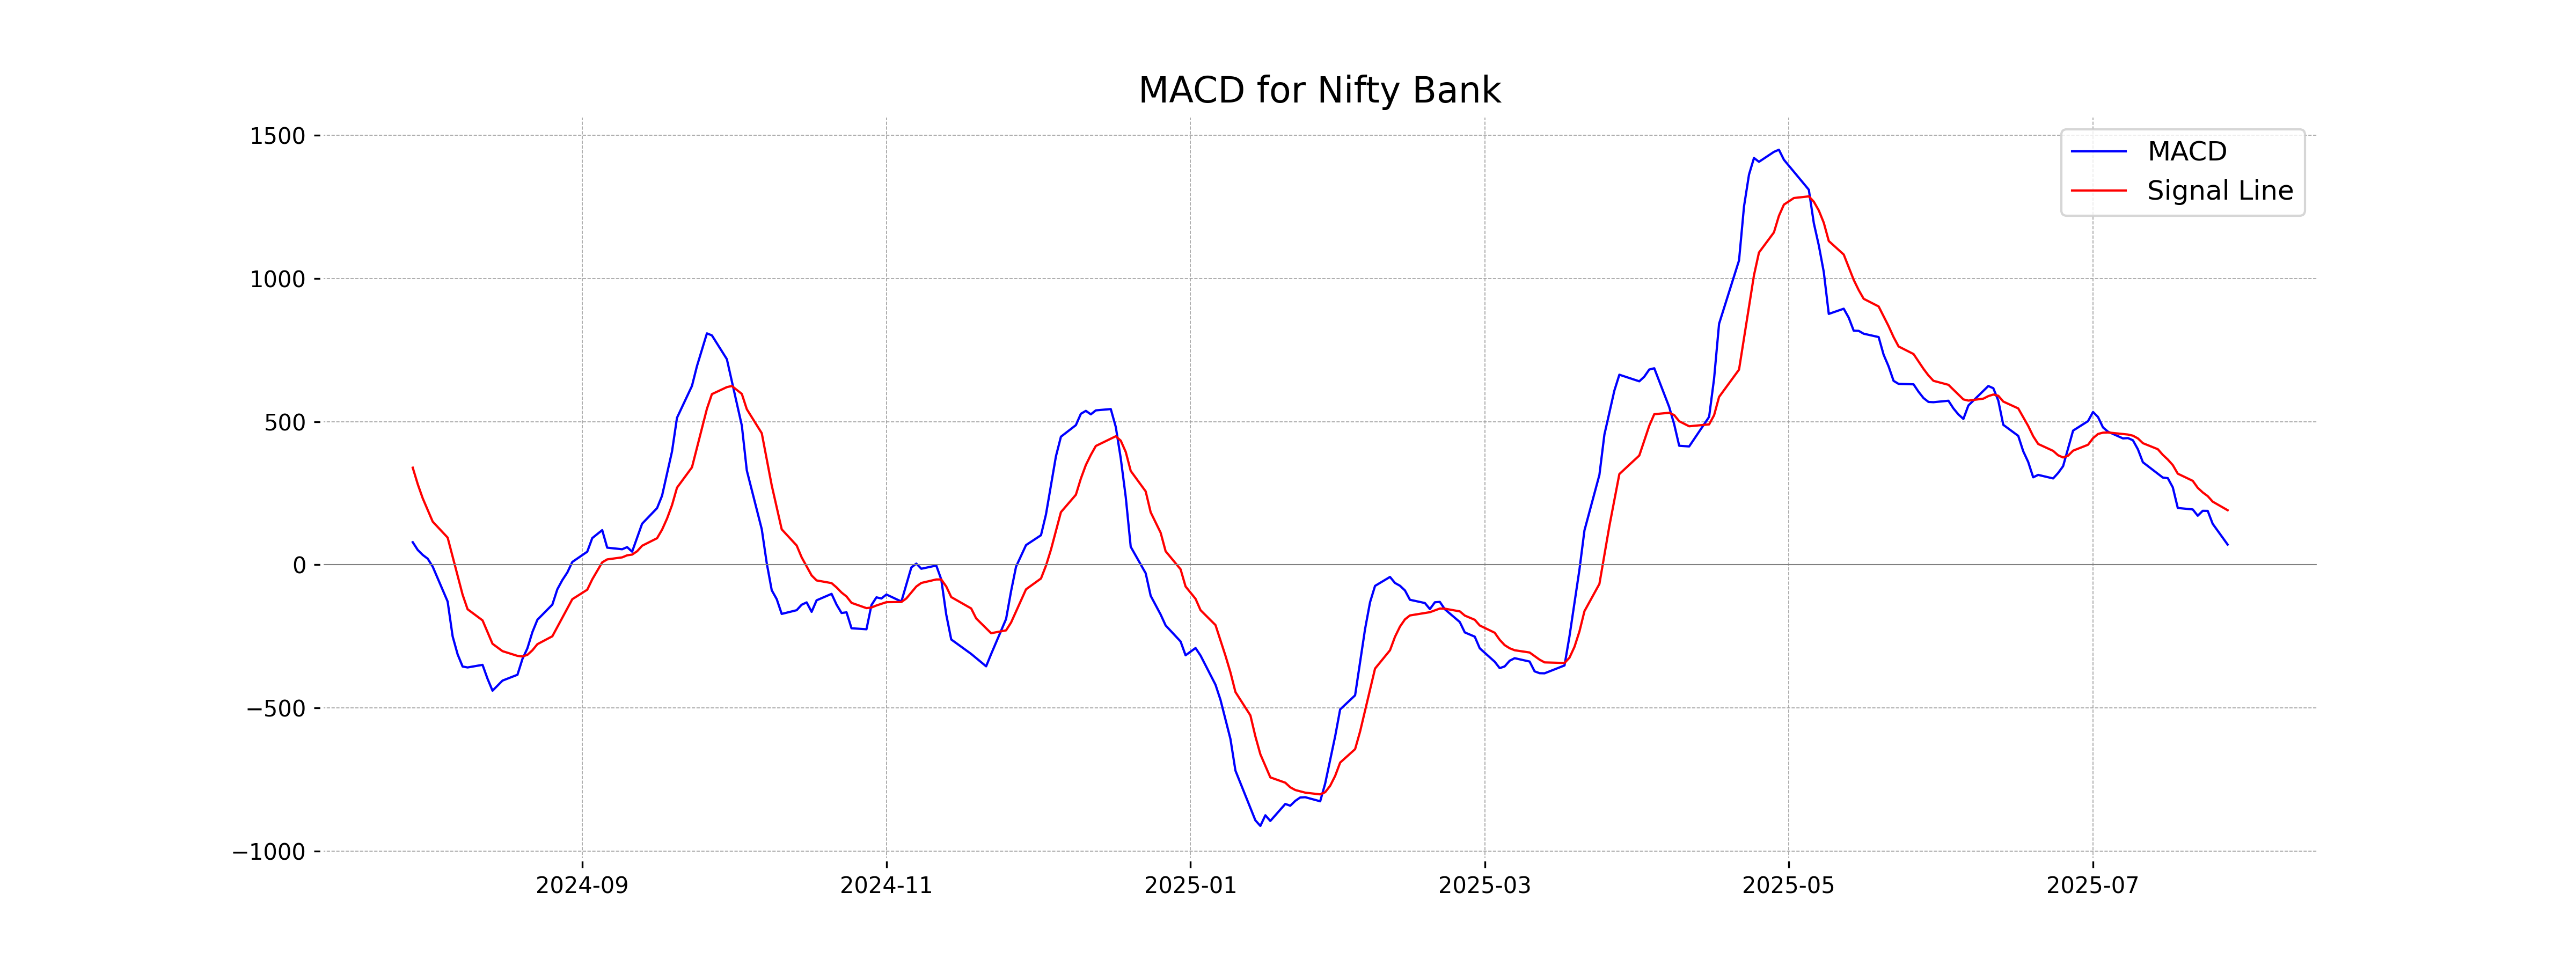
Moving Averages Trend (MACD)
MACD Analysis for Nifty Bank: The MACD value for Nifty Bank is 70.68, which is below the signal line value of 190.58. This indicates a bearish signal as the MACD has crossed below the signal line, suggesting potential downward momentum in the short term.
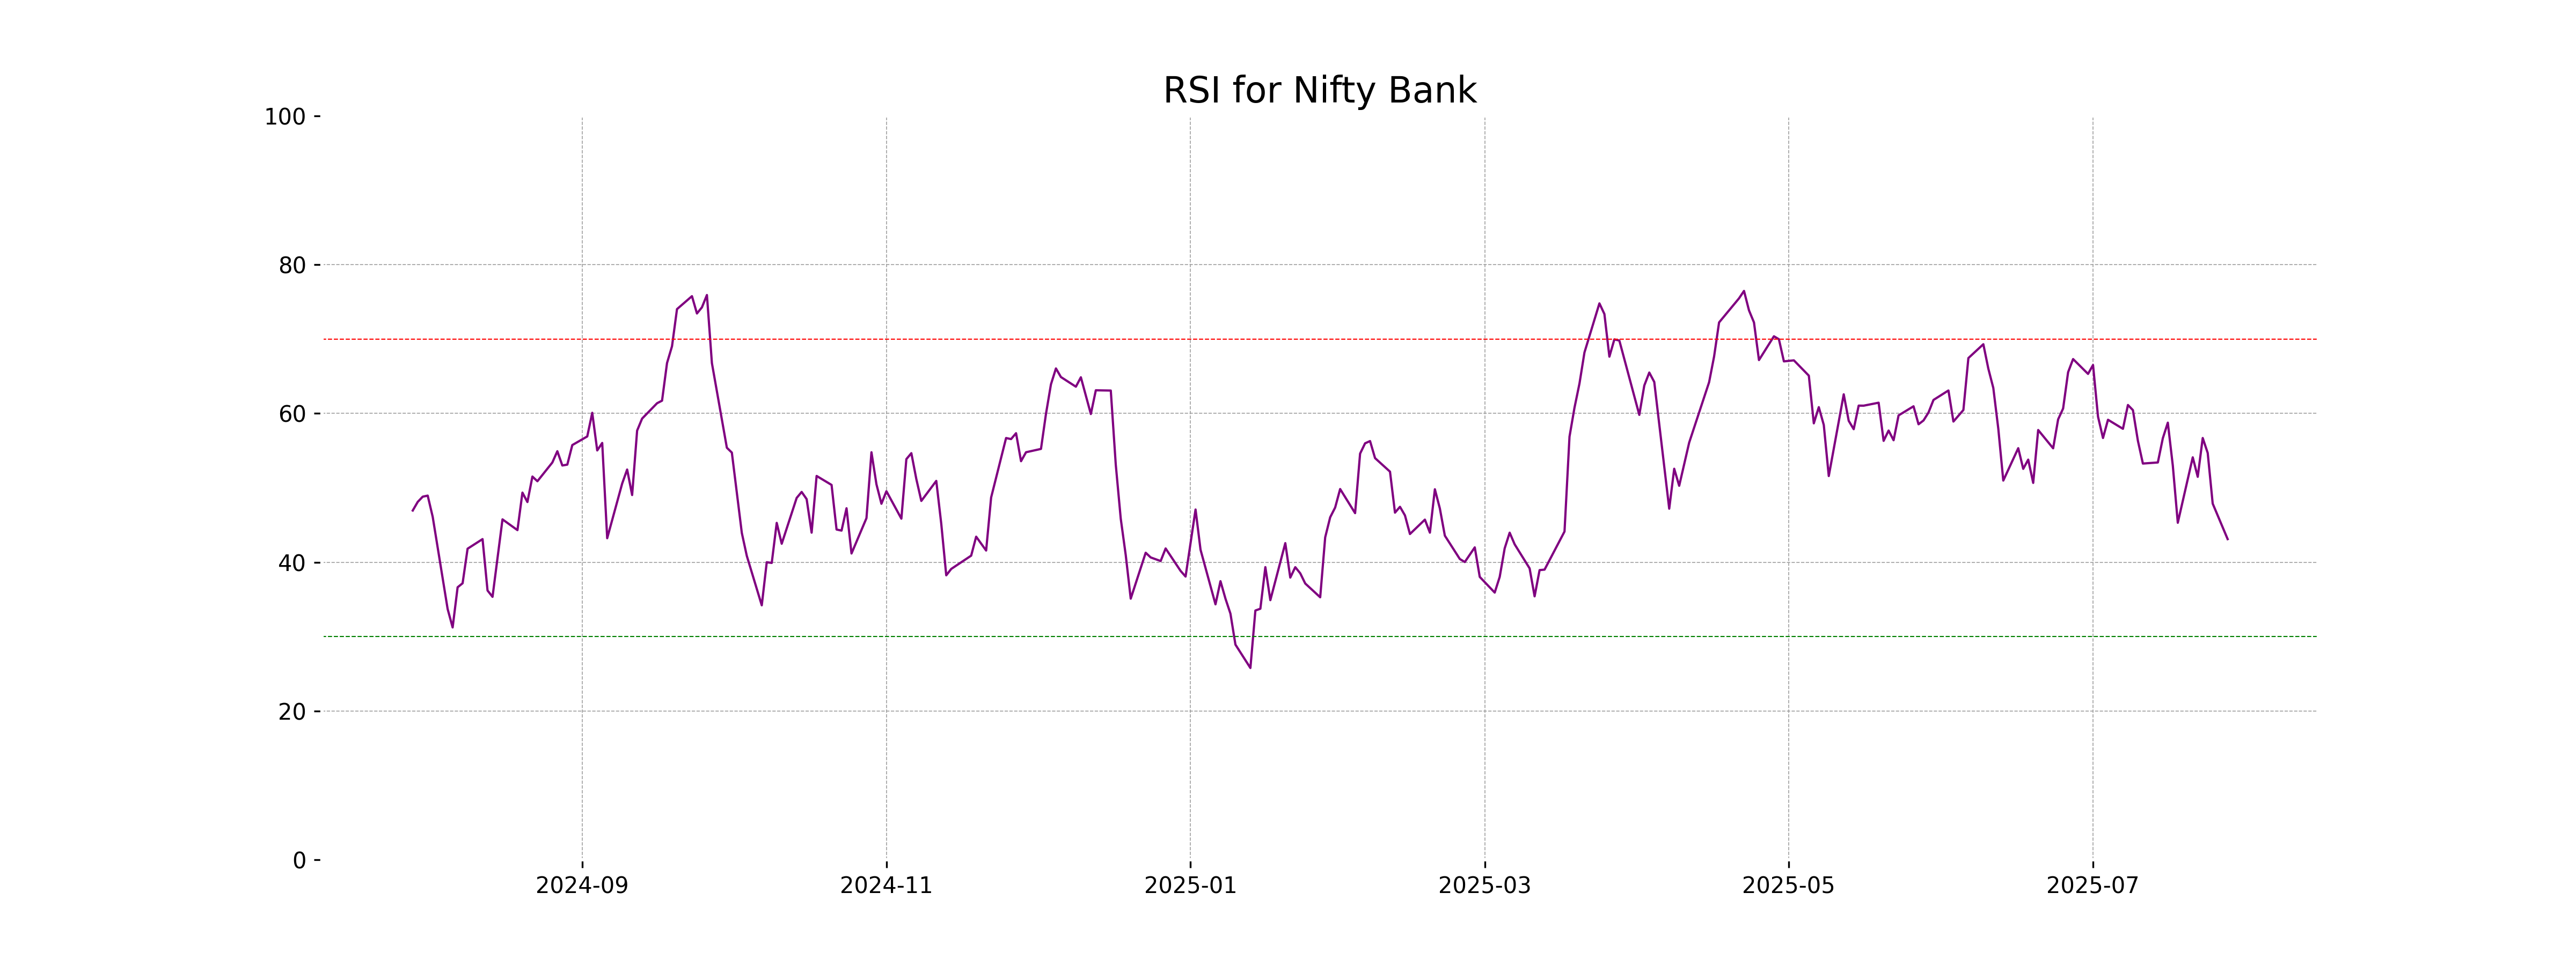
RSI Analysis
The Relative Strength Index (RSI) for Nifty Bank is 43.10, which suggests that the stock is nearing the oversold territory, as RSI values below 30 typically indicate oversold conditions. This may imply potential for price stabilization or a rebound if the current trend continues.
Analysis for Nifty 50 - July 28, 2025

The Nifty 50 opened at 24,782.45 and closed at 24,680.90, witnessing a decrease of 156.10 points, which is a percentage change of -0.63% from the previous close of 24,837. The technical indicators such as RSI at 36.92 and a negative MACD value suggest bearish market sentiment.
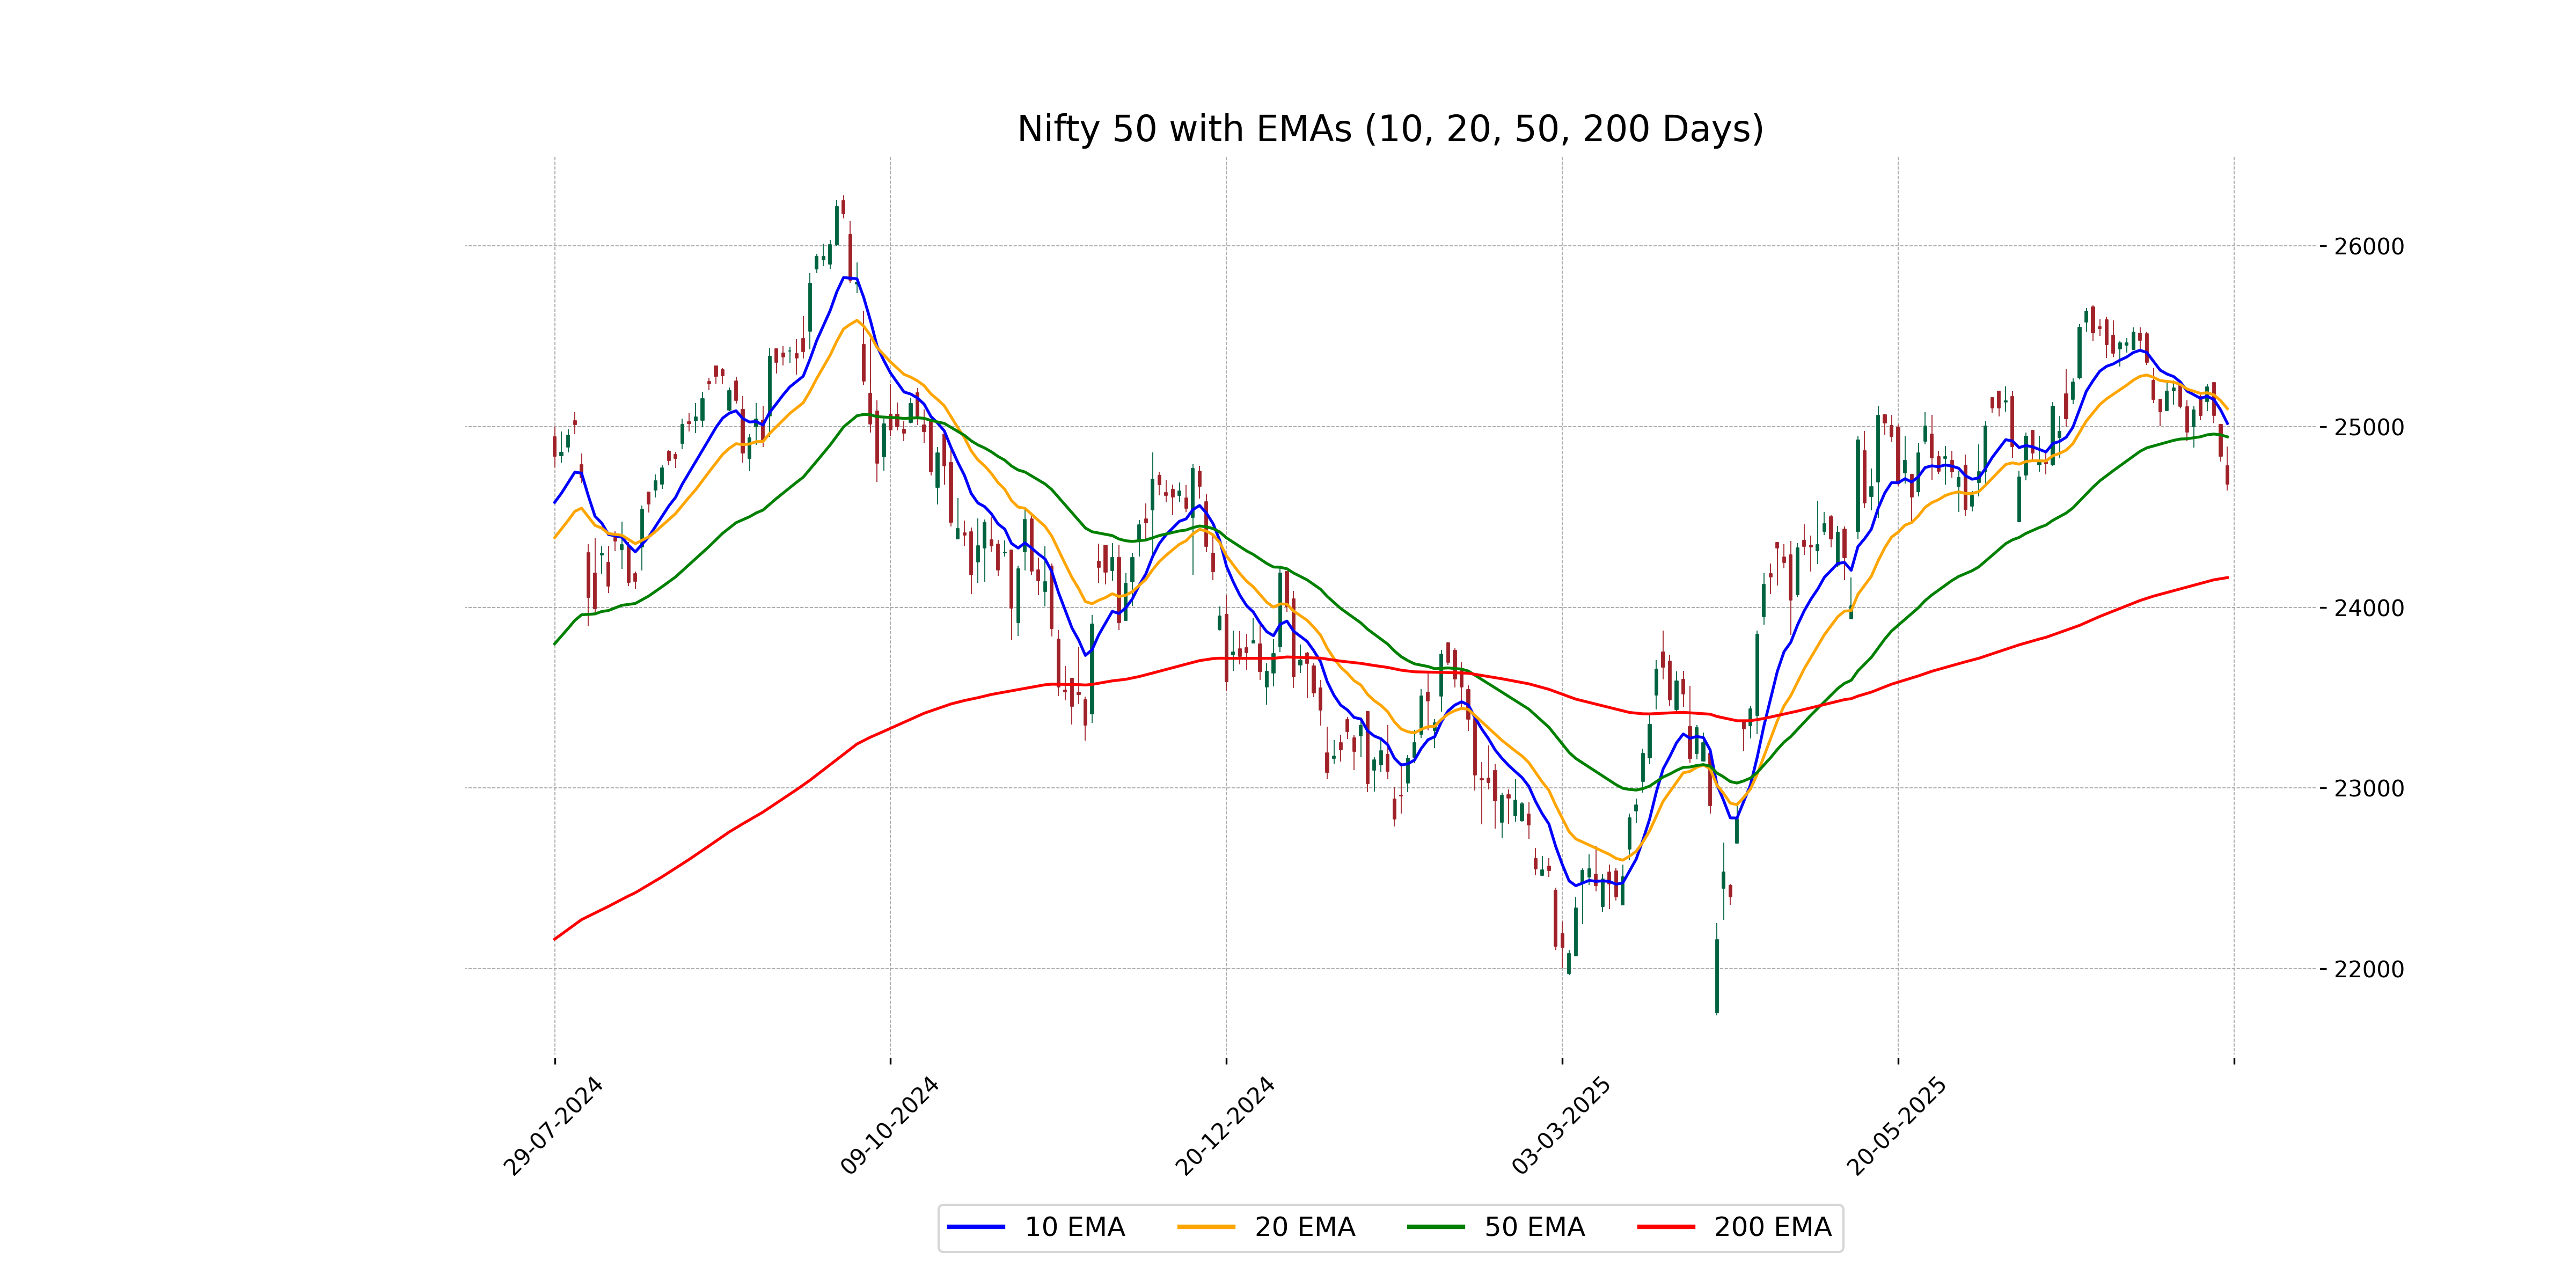
Relationship with Key Moving Averages
Nifty 50 is trading below its key moving averages, with the close price of 24,680.90 being below the 50 EMA (24,942.73), 10 EMA (25,016.88), and 20 EMA (25,098.58), indicating a bearish sentiment. Additionally, the RSI value of 36.92 suggests that the index might be approaching oversold conditions.
Moving Averages Trend (MACD)
The MACD value for Nifty 50 is -52.74, which is below the MACD Signal of 20.95, suggesting a bearish trend. This indicates that the market momentum is currently negative, and there could be further downside movement unless the trend reverses.

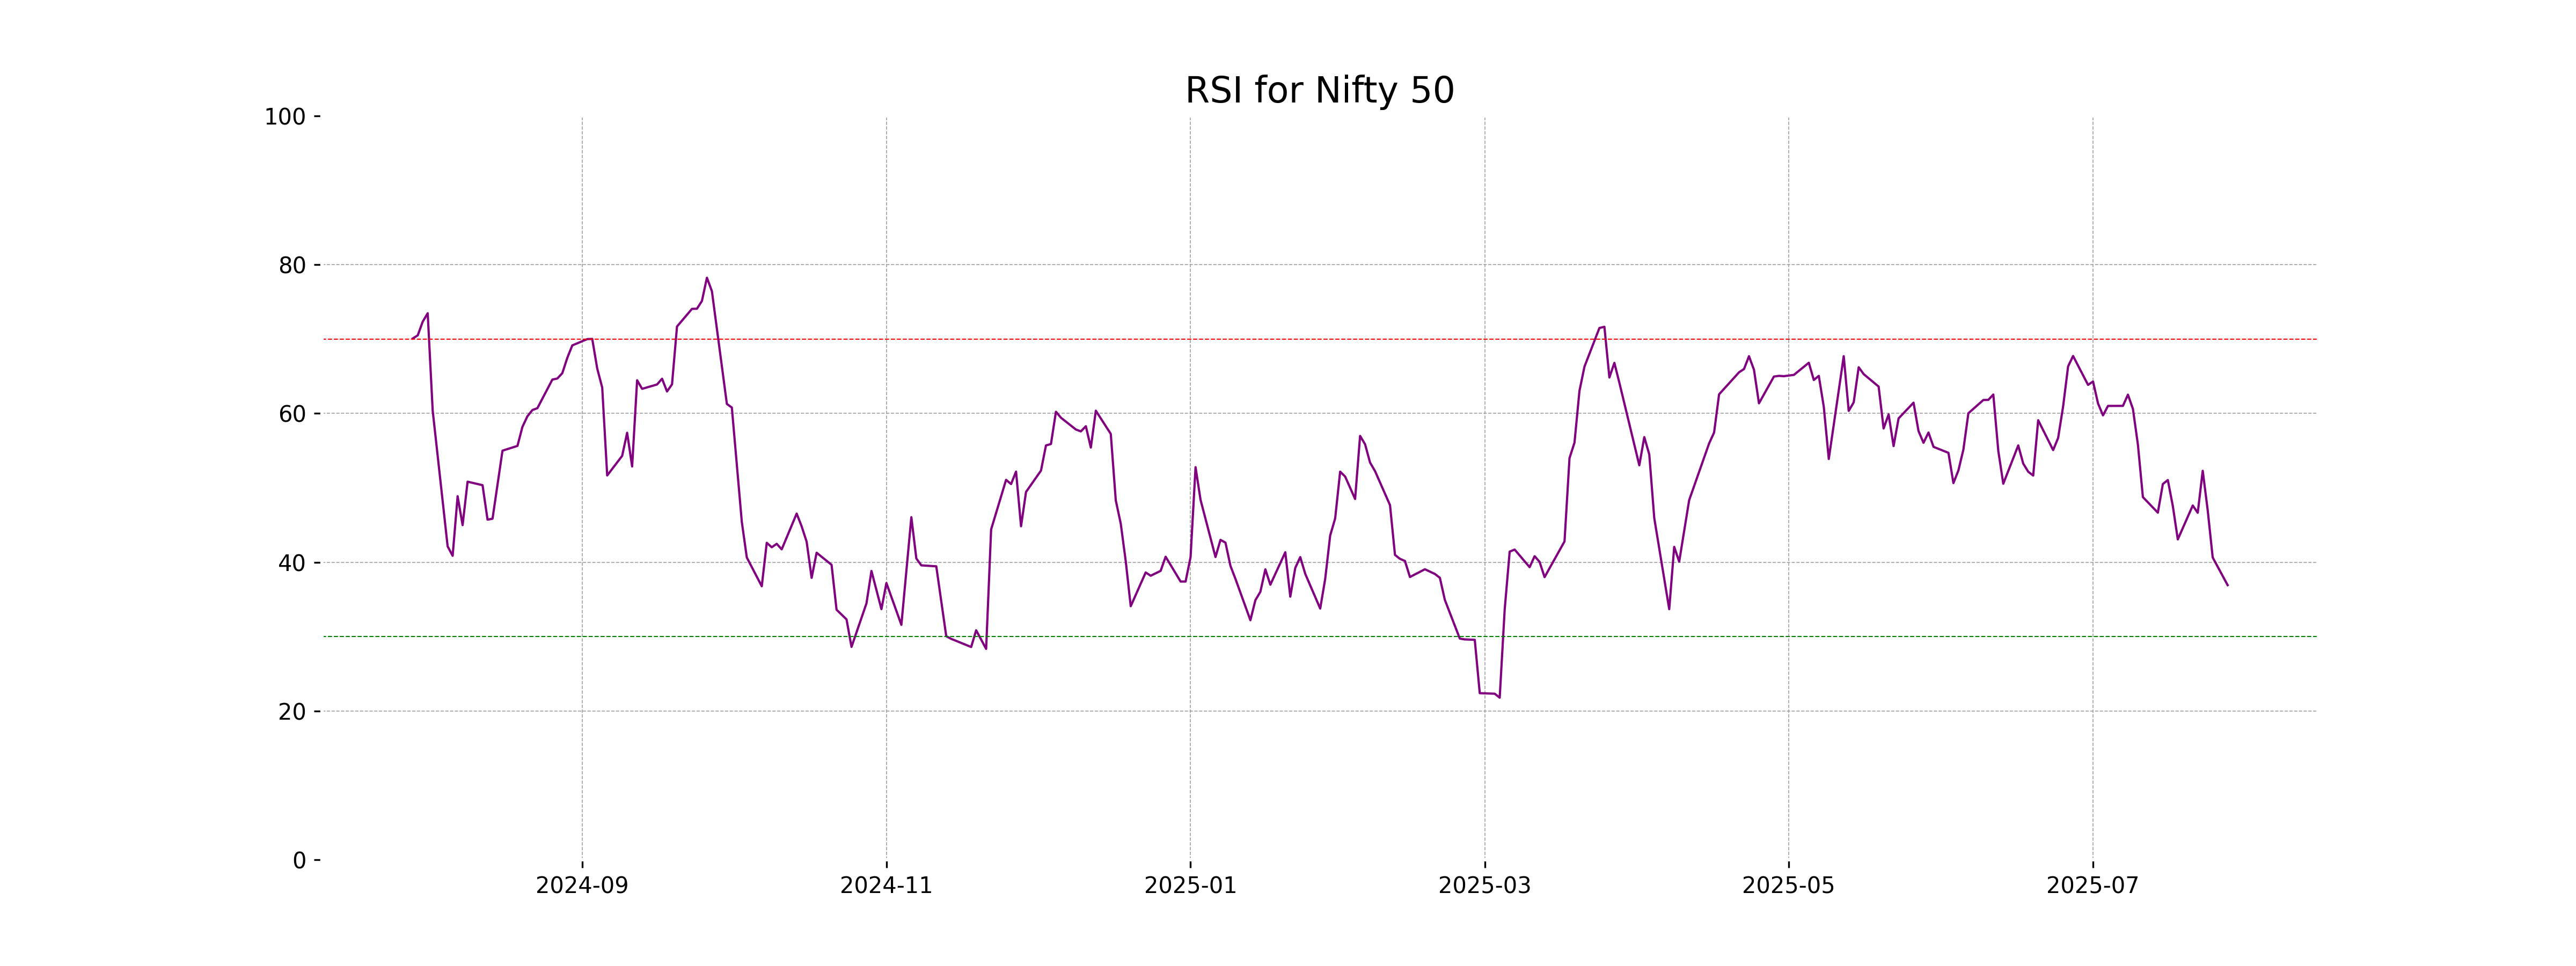
RSI Analysis
The RSI for Nifty 50 is currently at 36.92, indicating the market is nearing an oversold condition. Generally, an RSI below 30 suggests that an asset might be undervalued, which could signal a buying opportunity. However, with the RSI close to this level, it suggests caution should any further decline occur.
Up Next

Indian stock market sector-wise performance today - July 28, 2025

How much does a ULIP plan really cost? A break-down of all charges

Centre plans to borrow Rs 8.20 lakh cr from market in first half of FY27

Reliance denies buying Iranian oil amid US sanctions waiver

Premium petrol price up Rs 2, industrial diesel up Rs 22; no change in normal petrol, diesel rates

India's GDP expected to register over 8 pc growth in Sep-Dec: Report

More videos

Govt announces seven measures to help boost exports

RBI keeps interest rates on hold after US trade deal boosts outlook

RBI proposes to compensate customers up to Rs 25,000 loss due to fraud

RBI raises GDP growth projection of Q1, Q2 of FY27

RBI pauses rate cuts, retains interest rate at 5.25 pc

Rupee jumps 122 paise to close at 90.27 against US dollar on India-US trade deal

Stock markets cheer India-US trade deal: Sensex, Nifty surge 2.5 pc

UPI transactions hit record high of Rs 230 lakh crore in 2025-26 till Dec: Govt

Explained: India-US trade deal, tariffs and trade benefits

Trade deal with US adds momentum to India's growth ambition: Industry leaders