


Highlights
- Bearish trends across key indices
- Declining momentum in several stocks
- RSI approaching oversold territories for many
Latest news

Sensex moves in unison with rising FII flows and stronger Rupee: Bank of Baroda report

Journeys N Tales Elevates Bespoke Luxury Travel with Curated Global Experiences for Discerning Indian Travelers

"A great achievement for us": Carnatic vocalist duo Ranjani and Gayatri celebrate Padma Shri honour

Krunal Pandya Launches Phoenix Shopping League 2026 at Phoenix Citadel; EOSS Turns into a Season of Rewards, Entertainment and Celebration

New Data Shows Big Tech Lock-In Is Limiting Consumer Choice

Samsung's HBM4 sales cross USD 1 billion milestone within four months

Supreme Court on Company Law - Compendium of Cases Third Edition - Another Landmark Publication by Aseem Chawla, Senior Advocate

UPI, Aadhaar banking drive 61% of MSME transactions; AI adoption rises: Report
Indian stock market sector-wise performance today - January 28, 2025


The national stock market indices showed varied performances on January 28, 2025, reflecting the economic sentiment.
In this article, we analyze the performance of key national indices including the Nifty 50,Nifty Bank,Nifty IT,Nifty Auto,Nifty Pharma,Nifty FMCG,Nifty Infra,Nifty Energy and Nifty Metal.

^BSESN Stock Performance for January 28, 2025:
The opening price of ^BSESN was 75,659.0, with a high of 76,512.96 and a low of 75,622.88. The stock closed at 75,901.41, down from the previous close of 76,190.46. The percentage change was -0.38%, with a total point loss of 289.05.


Moving Averages and Stock Trend:
The 10-EMA (76,551.12) is above the current close, indicating short-term resistance. The 20-EMA (77,197.27) and the 50-EMA (78,428.15) are also above the current price, suggesting a potential bearish trend. The 200-EMA (77,883.57) is closer to the 50-EMA, solidifying the long-term resistance and supporting a bearish outlook for ^BSESN.
RSI:
The Relative Strength Index (RSI) is at 36.46, which places it in the oversold territory, suggesting potential undervaluation or weakness in the stock. This indicates a possibility of a reversal or consolidation.

MACD:
The Moving Average Convergence Divergence (MACD) is at -840.42, while the Signal line is at -799.01. The MACD line below the signal line confirms the bearish momentum presently dominating the stock trend.

Stock Performance for ^CNXAUTO on January 28, 2025:
The stock opened at 22,061.20 and closed at 22,264.15. It experienced a high of 22,506.60 and a low of 21,867.80. This resulted in a percentage change of 0.42% and a points change of 93.10. The previous close was at 22,171.05.


Relationship with Key Moving Averages:
The stock is trading below the 10-EMA (22,518.07), the 20-EMA (22,756.87), the 50-EMA (23,256.26), and the 200-EMA (23,283.89). This indicates a bearish trend as the price is below all critical moving averages, suggesting downward pressure.
Technical Indicators Analysis:
Moving Average Convergence Divergence (MACD) is at -290.80 with a signal line at -233.99, indicating a bearish momentum where the MACD is below the signal line, suggesting selling pressure.
Relative Strength Index (RSI) is at 39.50, which is below the neutral 50 mark, indicating that the stock is approaching the oversold territory. This could suggest potential buying interest if the downtrend continues.
^CNXENERGY Stock Performance on January 28, 2025:
The stock opened at 32,499.10, reached a high of 32,582.90, and a low of 31,511.70, closing at 31,966.10. This is a decrease of approximately 3.90% from the previous close of 33,263.55, with a points change of -1,297.45. Please refer to the stock performance table below for more details:


Moving Averages Analysis:
The 10-EMA at 33,671.93 and the 20-EMA at 34,258.36 are both above the current stock price, indicating that the stock may continue its bearish trend. Moreover, the stock is also trading below the 50-EMA (35,785.84) and the 200-EMA (37,906.00), reinforcing the bearish outlook as these averages serve as resistance levels.
MACD Analysis:
The MACD, at -778.81, is below the MACD Signal line, which is -704.22, suggesting a bearish momentum in the stock. This indicates that recent trading activity is more in line with a downward trend.

RSI Analysis:
The Relative Strength Index (RSI) is at 29.83, which is below the typical threshold of 30. This suggests that the stock is currently in the oversold territory, potentially indicating a possibility of a short-term reversal or consolidation.

Technical Analysis for ^CNXFMCG as of January 28, 2025:

Performance Overview:
The stock opened at 55,742.25, and after reaching a high of 55,799.15 and a low of 55,269.25, it closed at 55,441.95. This was down from the previous close of 56,069.35, reflecting a decrease of 1.12%, equating to a loss of 627.40 points.

Relationship with Key Moving Averages:
The current stock price of 55,441.95 is below the 10-EMA (55,842.66), 20-EMA (56,118.75), 50-EMA (57,004.06), and 200-EMA (57,868.47). This indicates a bearish trend, as the stock is trading below all key moving averages, suggesting downward momentum. The crossing of shorter EMAs below the longer ones further supports this bearish outlook.
Technical Indicators:
RSI: The current RSI is 40.60, placing it in the neutral to bearish zone. This suggests that the stock is not currently oversold or overbought, but closer to being oversold.

MACD: The MACD is currently -372.07, while the signal line is at -347.58. The MACD being below the signal line indicates a bearish momentum, suggesting that the stock may continue its downward trend unless there is a reversal signal.

Stock Performance for ^CNXINFRA on January 28, 2025:
On January 28, 2025, the stock ^CNXINFRA opened at 8149.05, reached a high of 8179.85, and a low of 8033.35, closing at 8116.05. This marked a decrease of 1.55% from the previous close of 8243.65 with a point change of -127.60.


Moving Averages Overview:
The ^CNXINFRA closed below all its key moving averages: 10-EMA (8276.99), 20-EMA (8350.87), 50-EMA (8532.77), and 200-EMA (8564.75). This positions the stock in a bearish trend as it is trading below these averages, indicating downward momentum.
RSI Analysis:
The Relative Strength Index (RSI) for ^CNXINFRA is at 36.65, which suggests the stock is approaching oversold conditions. A value below 30 typically indicates that a stock might be undervalued, so it is nearing this territory.

MACD Trend:
The MACD is at -101.21, with a signal line at -100.77, indicating a bearish crossover. Typically, a negative MACD value means that the stock could be in a downward trend, confirming the bearish sentiment with the closing below key averages.

Stock Performance for ^CNXIT on January 28, 2025

The stock symbol "^CNXIT" opened at 42097.05, reaching a high of 42463.14 and a low of 41731.25, before closing at 41820.65. Compared to its previous close of 43524.10, the stock showed a decrease, with a percent change of -3.91% and a points change of -1703.45.

Relationship with Key Moving Averages
The stock "^CNXIT" is trading below its 10-EMA (42796.58) and 20-EMA (43129.25), suggesting a bearish short-term trend. It is also below the 50-EMA (43254.09), indicating a potential continuation of this trend in the medium-term. However, it remains above the 200-EMA (40493.95), which may offer some long-term support.
Technical Indicators
RSI Analysis: The RSI for "^CNXIT" stands at 40.77, which is in the lower range but above the oversold territory, indicating some potential room for reversal if upward momentum increases.

MACD Analysis: The MACD value is -368.03, which is below its signal line of -286.28, suggesting a bearish movement. This divergence indicates increasing negative momentum.

Stock Performance for ^CNXMETAL on January 28, 2025:
The stock opened at 8218.05, reached a high of 8259.15, and a low of 8055.15 before closing at 8157.45. It experienced a decrease from its previous close of 8438.80, with a percentage change of -3.33% and a points change of -281.35.


Relationship with Key Moving Averages:
The closing price of ^CNXMETAL is below all key moving averages (10-EMA: 8413.40, 20-EMA: 8508.08, 50-EMA: 8778.48, and 200-EMA: 8911.55). This indicates a bearish trend as the stock is consistently trading below its average prices over different timeframes, which often points to a continued downward momentum.
RSI Analysis:
The RSI is at 35.84, which is below the typical neutral level of 50. This suggests that the stock is approaching the oversold territory, which might indicate a potential for a price reversal, though it doesn't guarantee it.

MACD Analysis:
The MACD indicator is at -141.92 with a signal line at -158.11. The negative values indicate bearish momentum, and the MACD line being above the signal line suggests that the downward momentum is decreasing, though the overall sentiment remains bearish.

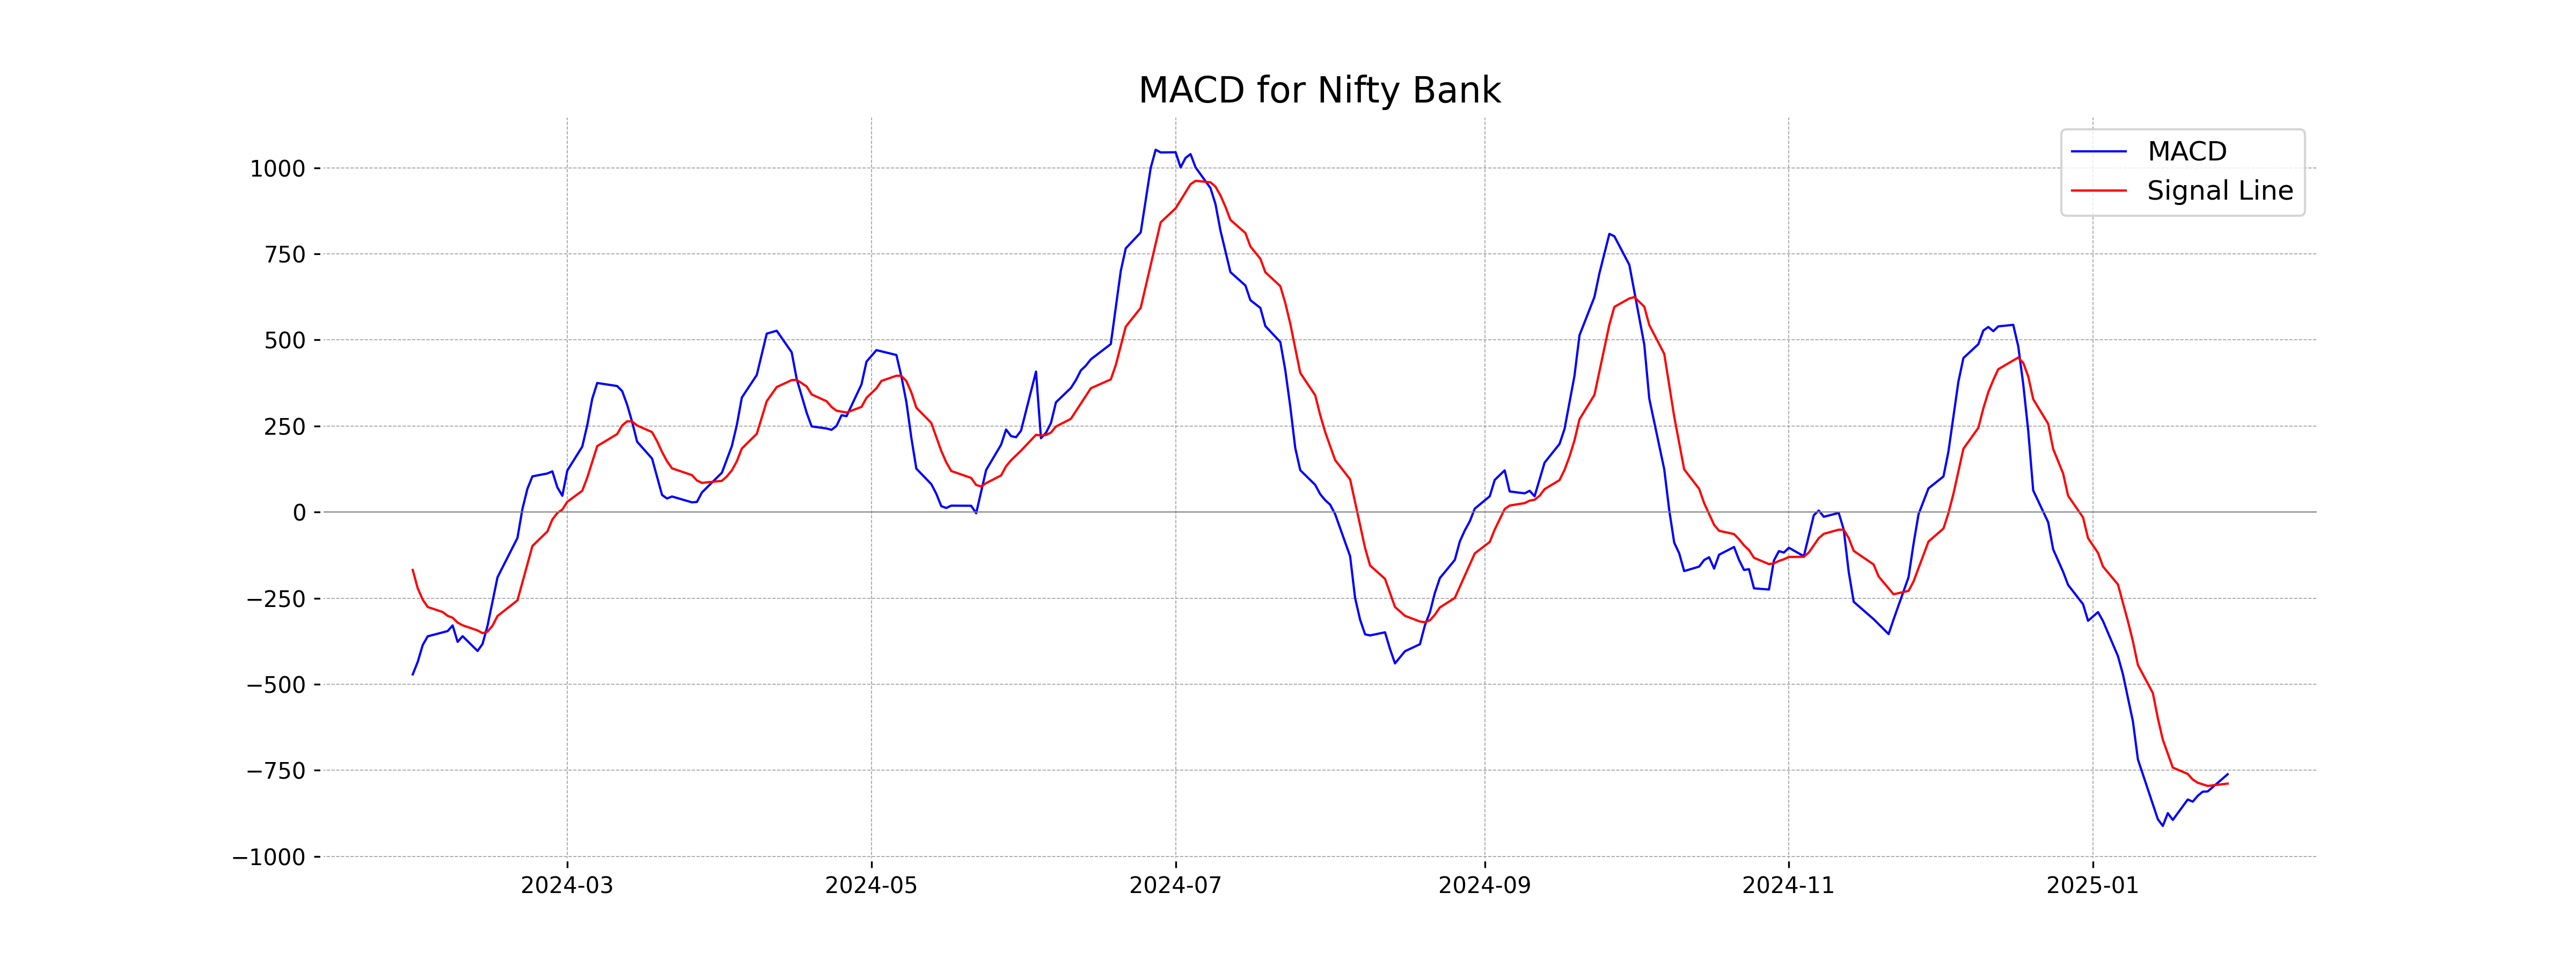
Stock Performance for ^NSEBANK on January 28, 2025
The stock ^NSEBANK opened at 48,642.50 and closed at 48,866.85. The highest price during the day was 49,247.15, while the lowest was 48,449.05. The previous close was 48,367.80, marking a percentage change of 1.03% with a point change of 499.05.


Relationship with Key Moving Averages
On January 28, 2025, the ^NSEBANK closed below its 50-EMA (50,480.54) and 200-EMA (50,272.81), while being close to its 10-EMA (48,871.91) but below the 20-EMA (49,434.64). This positioning suggests a bearish trend, as the stock price remains below significant longer-term EMAs.
Moving Averages and Trend Indicators
The MACD value is -761.44, with the MACD Signal at -788.51. The values indicate that the MACD line is above the signal line. However, both being negative suggests a bearish momentum.
Relative Strength Index (RSI)
The RSI for ^NSEBANK is at 42.14, which is below the neutral 50 level, indicating weaker momentum and suggesting that the stock could be in a bearish phase.

Technical Analysis for Stock: ^NSEI - January 28, 2025

Stock Performance:
The stock opened at 22,960.45 and closed at 22,957.25 on January 28, 2025, with a previous close of 23,092.20. This represents a percentage change of -0.58% and a points change of -134.95, indicating a slight downturn over the day.

Relationship with Key Moving Averages:
The stock's close is below the 10-EMA (23,188.52), 20-EMA (23,378.02), 50-EMA (23,763.48), and 200-EMA (23,641.44), which suggests a bearish trend. The fact that the 10-EMA and the 20-EMA are below the 50-EMA and 200-EMA aligns with the overall downward momentum.
Moving Averages and MACD Analysis:
The MACD of -247.79, which is below the signal line of -235.18, indicates bearish momentum as the MACD is moving away from the signal line in the negative territory.

RSI Analysis:
The RSI at 35.89 suggests that the stock is nearing oversold conditions. Generally, an RSI below 30 is considered oversold, which might attract some buying in the short term.

Up Next
Indian stock market sector-wise performance today - January 28, 2025

Honda Activa 6G: Everything You Need to Know Before Buying

How much does a ULIP plan really cost? A break-down of all charges

Centre plans to borrow Rs 8.20 lakh cr from market in first half of FY27

Reliance denies buying Iranian oil amid US sanctions waiver

Premium petrol price up Rs 2, industrial diesel up Rs 22; no change in normal petrol, diesel rates

More videos

India's GDP expected to register over 8 pc growth in Sep-Dec: Report

Govt announces seven measures to help boost exports

RBI keeps interest rates on hold after US trade deal boosts outlook

RBI proposes to compensate customers up to Rs 25,000 loss due to fraud

RBI raises GDP growth projection of Q1, Q2 of FY27

RBI pauses rate cuts, retains interest rate at 5.25 pc

Rupee jumps 122 paise to close at 90.27 against US dollar on India-US trade deal

Stock markets cheer India-US trade deal: Sensex, Nifty surge 2.5 pc

UPI transactions hit record high of Rs 230 lakh crore in 2025-26 till Dec: Govt

Explained: India-US trade deal, tariffs and trade benefits