


Highlights
- Sensex falls 1.32%, closing below key averages
- Nifty Auto, Energy, FMCG indices show bearish trends
- RSI, MACD signals indicate weakening market momentum
Latest news

Nitin Gadkari reveals how he met Hamas chief Ismail Haniyeh hours before assassination in Tehran

BNP acting chairman Tarique Rahman returns to Dhaka after 17 years in exile

India revamps tax regime in 2025, new I-T Act to take effect from April 1

BNP's acting chief Tarique Rahman set to return to Bangladesh after 17-year exile

Navi Mumbai International Airport starts commercial flight operations

PM Modi attends Christmas service at Delhi church, greets citizens

Gujarat AAP MLA Chaitar Vasava refutes Rs 75 lakh extortion claims by BJP MP

AAP MLA Gopal Italia alleges bullying, extortion at Visavadar groundnut centre
Indian stock market sector-wise performance today - February 11, 2025


The national stock market indices showed varied performances on February 11, 2025, reflecting the economic sentiment.
In this article, we analyze the performance of key national indices including the Nifty 50,Nifty Bank,Nifty IT,Nifty Auto,Nifty Pharma,Nifty FMCG,Nifty Infra,Nifty Energy and Nifty Metal.

Analysis for Sensex - February 11, 2025

The Sensex experienced a decline with a closing value of 76,293.60, which is a drop of 1.32% or 1,018.20 points from the previous close of 77,311.80. The Relative Strength Index (RSI) is at 41.92, indicating a weaker momentum. The Moving Average Convergence Divergence (MACD) shows a negative trend at -163.98, suggesting bearish market sentiment.

Relationship with Key Moving Averages
The closing value of Sensex (76,293.60) is below its key moving averages, including the 50-day EMA (78,023.63) and the 20-day EMA (77,289.14), indicating a bearish trend. The 10-day EMA (77,260.05) is also above the closing value, further suggesting downward momentum in the short term.
Moving Averages Trend (MACD)
Sensex is currently displaying a bearish signal as MACD is negative at -163.98, indicating downward momentum. Furthermore, the MACD line is above the MACD Signal line, suggesting the bearish trend might continue unless there's a reversal.

RSI Analysis
For Sensex, the RSI value is 41.92, which indicates a neutral position but trending towards the lower end of the range. This suggests that the index is neither overbought nor oversold, but it may be weakening.

Analysis for Nifty Auto - February 11, 2025

Nifty Auto opened at 23053.80 and closed at 22573.90, marking a significant decrease of 538.75 points, equivalent to a -2.33% change. The RSI stands at 44.25, suggesting a slightly bearish momentum, while the MACD of 25.49 indicates potential volatility with no clear directional trend. The 50-day and 200-day EMAs are both above the current close, also pointing to a bearish outlook.

Relationship with Key Moving Averages
Nifty Auto's closing price of 22573.90 is below its 50 EMA of 23167.80 and 200 EMA of 23254.17, indicating a bearish trend. The close is also slightly below the 10 EMA of 23007.12 and the 20 EMA of 22947.29, reinforcing short-term downward pressure.
Moving Averages Trend (MACD)
**MACD Analysis for Nifty Auto:** The MACD value of 25.49 is higher than the MACD Signal of -34.44, indicating a bullish momentum in the stock's price movement. However, given the recent percentage change of -2.33%, it is essential to monitor further to see if the bullish crossover results in sustained upward momentum.

RSI Analysis
**Nifty Auto RSI Analysis:** The RSI (Relative Strength Index) for Nifty Auto is currently at 44.25, which suggests that the index is approaching oversold conditions. An RSI below 50 typically indicates weakening momentum, implying potential bearish behavior, but it is not yet in the oversold territory. Continuous monitoring is suggested for potential trend reversals.

Analysis for Nifty Energy - February 11, 2025

Nifty Energy experienced a decline in performance, closing at 31,436.75 which is a drop of 2.10% compared to the previous close. The Relative Strength Index (RSI) stands at 35.85, indicating a bearish trend, while the Moving Average Convergence Divergence (MACD) is negative, further supporting the downward momentum. The stock traded within a range of 32,157.75 (high) and 31,217.70 (low).

Relationship with Key Moving Averages
The Nifty Energy index is currently trading below key moving averages, with the close at 31,436.75 being under the 10 EMA (32,630.33), 20 EMA (33,162.36), 50 EMA (34,678.34), and 200 EMA (37,364.35). This suggests a bearish trend as the index is below all major moving averages.
Moving Averages Trend (MACD)
The Nifty Energy index has a MACD of -730.0234 with a MACD Signal of -698.0034. This negative MACD, along with an RSI below 40, suggests a bearish momentum and potential further downside in the short term.

RSI Analysis
The Relative Strength Index (RSI) for Nifty Energy is 35.85, indicating that the index is nearing the oversold territory (typically below 30 is considered oversold). This suggests that the index may be experiencing downward pressure, but it could potentially be poised for a rebound if conditions change.

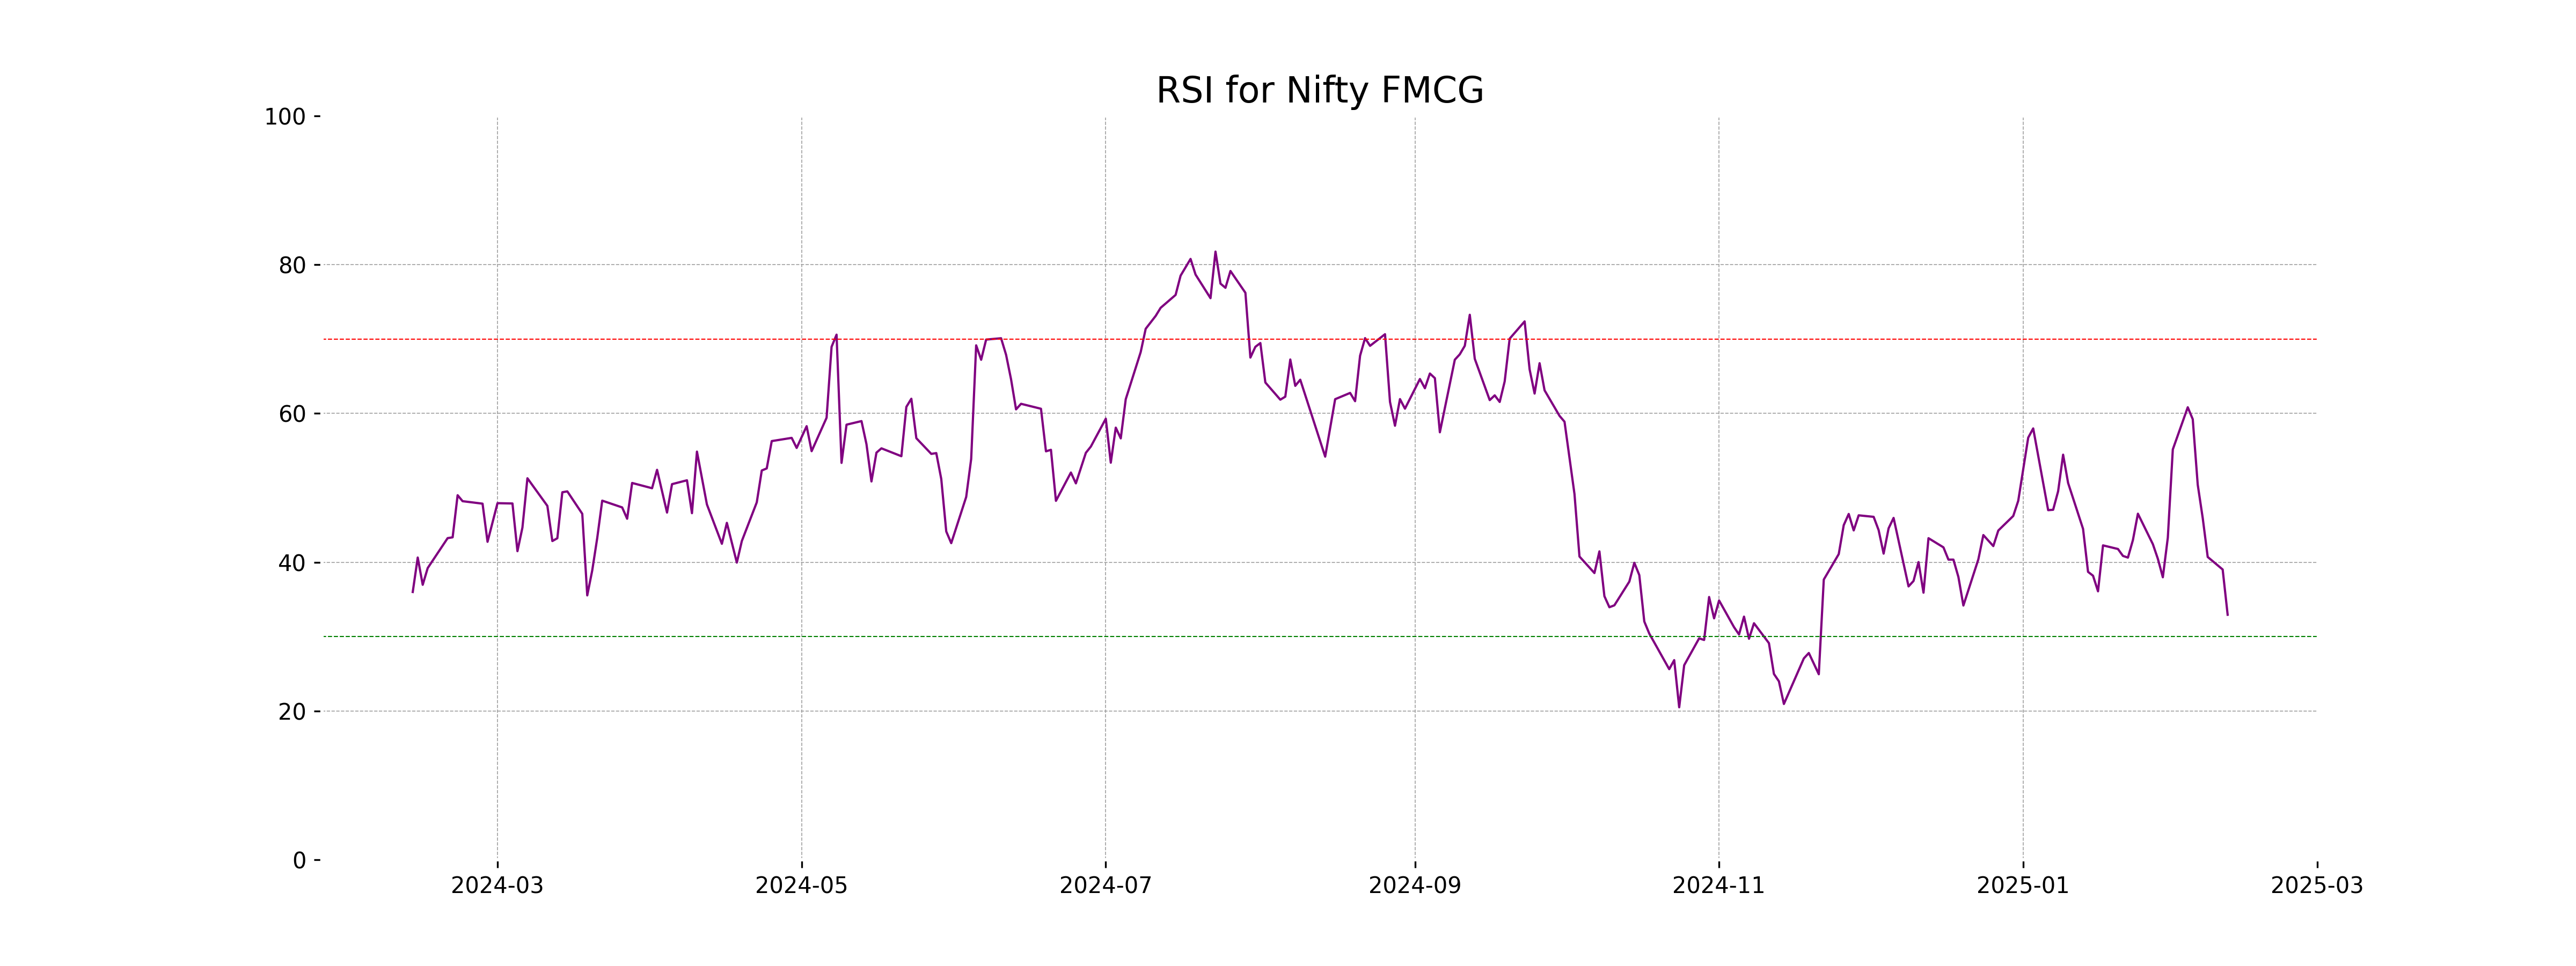
Analysis for Nifty FMCG - February 11, 2025

The Nifty FMCG index opened at 55012.10 and closed at 53794.25, marking a decline with a percentage change of -1.94% and a points change of -1062.40. The RSI is at 32.94, indicating that the index is nearing oversold conditions, while the MACD is -375.72, below the signal line, suggesting bearish momentum.

Relationship with Key Moving Averages
The Nifty FMCG index closed at 53,794.25, which is below its 10-day EMA of 55,461.94, 20-day EMA of 55,791.52, 50-day EMA of 56,552.72, and 200-day EMA of 57,653.21. This indicates that the index is in a bearish trend, trading below significant moving averages. The negative MACD further supports this bearish momentum.
Moving Averages Trend (MACD)
The MACD for Nifty FMCG is at -375.72, which is below its signal line at -218.32, indicating bearish momentum. Additionally, the negative value further suggests a potential downward trend in the short term.

RSI Analysis
The RSI for Nifty FMCG is 32.94, indicating that the stock is approaching oversold territory. This suggests a potential buying opportunity if the trend shows signs of reversal, as RSI values below 30 often reflect stronger oversold conditions. Investors might consider monitoring the stock for any positive momentum changes.
Analysis for Nifty Infra - February 11, 2025

**Nifty Infra Performance:** Nifty Infra opened at 8205.0 and closed lower at 8029.85, experiencing a decline of approximately 1.71%. The index witnessed a points drop of 140.0, with Relative Strength Index (RSI) at 38.27, indicating weakness. The closing is below its 50 EMA and 200 EMA, signaling bearish momentum.

Relationship with Key Moving Averages
Nifty Infra is trading below its 10, 20, 50, and 200 EMA, indicating a bearish trend in the market. The RSI value of 38.27 suggests the index is nearing oversold territory, and the negative MACD further supports the current downward momentum.
Moving Averages Trend (MACD)
Based on the data provided, Nifty Infra's MACD is slightly below its MACD Signal, suggesting a bearish momentum. This indicates potential further downside pressure, corroborated by the negative MACD value.

RSI Analysis
The RSI for Nifty Infra is at 38.27, indicating that it is approaching the oversold territory, as an RSI below 30 is generally considered oversold. This suggests the index might be undervalued, and a potential reversal could occur if it continues to decline.

Analysis for Nifty IT - February 11, 2025

Nifty IT opened at 42,616.90 and closed at 41,968.30, experiencing a drop of -1.47% with a points change of -628.25. The RSI is 42.26, indicating a weak momentum, and the MACD is negative, showing bearish signals. It is trading below important EMAs, suggesting a downtrend.

Relationship with Key Moving Averages
The Nifty IT index closed below its 50 EMA (43022.90) and 10 EMA (42604.19), indicating short-term bearish sentiment, while it is above the 200 EMA (40715.14), suggesting longer-term bullish trends. The current close (41968.30) is also below the 20 EMA (42776.86), supporting a short-term bearish perspective.
Moving Averages Trend (MACD)
The MACD for Nifty IT is currently at -242.57, which is slightly above the MACD Signal line at -257.04. This indicates that the bearish momentum is present, but there are signs of a potential weakening in downtrend pressure. The RSI at 42.26 suggests that the stock is approaching oversold conditions.

RSI Analysis
The RSI for Nifty IT is 42.26, suggesting the index is nearing the oversold territory as it is below 50. This implies a possible weakening of the current downtrend, but further observation is needed to confirm a reversal.

Analysis for Nifty Metal - February 11, 2025

**Nifty Metal Performance:** Nifty Metal opened at 8302.15 and closed at 8213.55, reflecting a decrease of 1.74% from the previous close of 8359.25. The current RSI is at 43.12, indicating a potential bearish momentum. Both the 50-day and 200-day EMAs, at 8619.62 and 8851.14 respectively, are higher than the current price, suggesting a possible downtrend.

Relationship with Key Moving Averages
The Nifty Metal index closed below its 10-day EMA of 8351.11 and significantly below its 50-day EMA of 8619.62, indicating a short-term bearish trend. Additionally, the index is trading below its 200-day EMA of 8851.14, further suggesting a longer-term bearish outlook.
Moving Averages Trend (MACD)
The MACD value for Nifty Metal is -80.77, which is higher than the MACD Signal of -103.78. This suggests a recent momentum shift towards a possible bullish crossover, even though both are negative. Investors may look for further confirmation before making bullish decisions.

RSI Analysis
The RSI for Nifty Metal is 43.12, indicating that the index is approaching the oversold territory, as values below 30 typically suggest such conditions. However, it is currently within a neutral range, suggesting neither heavily oversold nor overbought conditions at the moment.

Analysis for Nifty Bank - February 11, 2025

Nifty Bank opened at 49,812.15 and closed at 49,403.40, marking a decline with a percentage change of -1.16% and a points change of -577.60. The stock experienced a high of 49,906.75 and a low of 49,177.40. The Relative Strength Index (RSI) is at 46.66, indicating slightly bearish momentum, while the Moving Average Convergence Divergence (MACD) shows a value of -63.35, below its signal line.

Relationship with Key Moving Averages
The current close price of Nifty Bank at 49,403.40 is below the 50-day EMA (50,191.89) and the 200-day EMA (50,207.52), indicating a potential bearish trend. It is also below the 10-day EMA (49,705.23) and 20-day EMA (49,636.35), suggesting short-term weakness.
Moving Averages Trend (MACD)
The MACD value for Nifty Bank is -63.35, while the MACD Signal is -251.24, indicating a potential bearish movement. The negative MACD suggests that the short-term momentum is weaker compared to the long-term trend.

RSI Analysis
The RSI for Nifty Bank is 46.66, which suggests that the stock is currently neither overbought nor oversold and is in a neutral zone. A reading below 30 typically indicates oversold conditions, while above 70 indicates overbought conditions.

Analysis for Nifty 50 - February 11, 2025

The Nifty 50 opened at 23,383.55, reached a high of 23,390.05, and closed lower at 23,071.80, marking a decline of 1.32% from the previous close. The index has faced a notable dip, with a points change of -309.80, amidst RSI levels indicating a bearish momentum.

Relationship with Key Moving Averages
The Nifty 50 index has closed below its 10-day EMA of 23377.56, indicating short-term bearish sentiment. It is also trading below both the 50-day EMA of 23630.54 and the 200-day EMA of 23615.16, suggesting a bearish trend in both the medium and long term.
Moving Averages Trend (MACD)
The MACD for Nifty 50 is negative at -55.91, indicating a bearish trend, as it is below the MACD Signal value of -90.21. This suggests that the downward momentum may continue in the short term.

RSI Analysis
The RSI for Nifty 50 is 41.42, indicating that it is in the lower range and might be approaching oversold conditions. This suggests that there could be potential buying opportunities if the index continues to trend lower and the RSI drops further below 30. However, it is crucial to consider other technical indicators and market conditions before making a decision.

Up Next
Indian stock market sector-wise performance today - February 11, 2025

New Zealand commits USD 20 bn investment in India under FTA in 15 yrs; on lines of EFTA pact

India, New Zealand conclude FTA talks; pact to offer duty-free access, USD 20 bn FDI

FTA with New Zealand to significantly deepen bilateral economic engagement: Govt

Rupee breaches 91-mark against US dollar for first time in intra-day trade

Microsoft commits USD 17.5 billion investment in India: CEO Satya Nadella

More videos

CBI books Anil Ambani's son, Reliance Home Finance Ltd. in Rs 228 crore bank fraud case

RBI raises FY26 GDP growth projection to 7.3 pc

RBI trims policy interest rate by 25bps to 5.25pc, loans to get cheaper

Rupee slumps to all-time low of 90.25 against US dollar in intra-day trade

Reliance completes merger of Star Television Productions with Jiostar

India to lead emerging market growth with 7pc GDP rise in 2025: Moody’s

Nifty hits record high after 14 months; Sensex nears all-time peak

Reliance stops Russian oil use at its only-for-export refinery to comply with EU sanctions

ED attaches fresh assets worth over Rs 1,400 cr in case against Anil Ambani's Reliance Group

India signs one-year deal to import 2.2 million tonnes of LPG from US