


Highlights
- Overall market present mixed signals
- Market leaning towards bearishness
- Tech and banking sectors offered glimpses of positive potential
Latest news

Nitin Gadkari reveals how he met Hamas chief Ismail Haniyeh hours before assassination in Tehran

BNP acting chairman Tarique Rahman returns to Dhaka after 17 years in exile

India revamps tax regime in 2025, new I-T Act to take effect from April 1

BNP's acting chief Tarique Rahman set to return to Bangladesh after 17-year exile

Navi Mumbai International Airport starts commercial flight operations

PM Modi attends Christmas service at Delhi church, greets citizens

Gujarat AAP MLA Chaitar Vasava refutes Rs 75 lakh extortion claims by BJP MP

AAP MLA Gopal Italia alleges bullying, extortion at Visavadar groundnut centre
Indian stock market sector-wise performance today - February 6, 2025


The national stock market indices showed varied performances on February 06, 2025, reflecting the economic sentiment.
In this article, we analyze the performance of key national indices including the Nifty 50,Nifty Bank,Nifty IT,Nifty Auto,Nifty Pharma,Nifty FMCG,Nifty Infra,Nifty Energy and Nifty Metal.

Analysis for Sensex - February 06, 2025

**Sensex Performance**: The Sensex opened at 78,513.36 and closed slightly lower at 78,058.16. It experienced a decline of 213.13 points from the previous close of 78,271.28, equating to a decrease of approximately 0.27%. The Relative Strength Index (RSI) stands at 54, indicating near-neutral momentum, while the Moving Average Convergence Divergence (MACD) shows a negative value, suggesting bearish trends. The volumes traded were notably low.

Relationship with Key Moving Averages
The Sensex closed below its 50-day EMA of 78,137.04 and slightly above its 200-day EMA of 77,840.73. This suggests a possible short-term bearish trend, as the closing price is lower than the 50-day EMA, while hovering near the 200-day EMA could indicate a level of support.
Moving Averages Trend (MACD)
The Sensex shows a MACD value of -125.00, indicating a bearish momentum since the MACD is below the zero line. However, the MACD is approaching the signal line value of -463.00, which could suggest a potential decrease in bearish momentum. It's important to monitor if the MACD crosses above the signal line for a potential trend reversal.

RSI Analysis
The RSI value for Sensex is 54, indicating a neutral momentum. As the RSI is between 30 and 70, it suggests that the index is neither overbought nor oversold, implying a balanced trading environment.

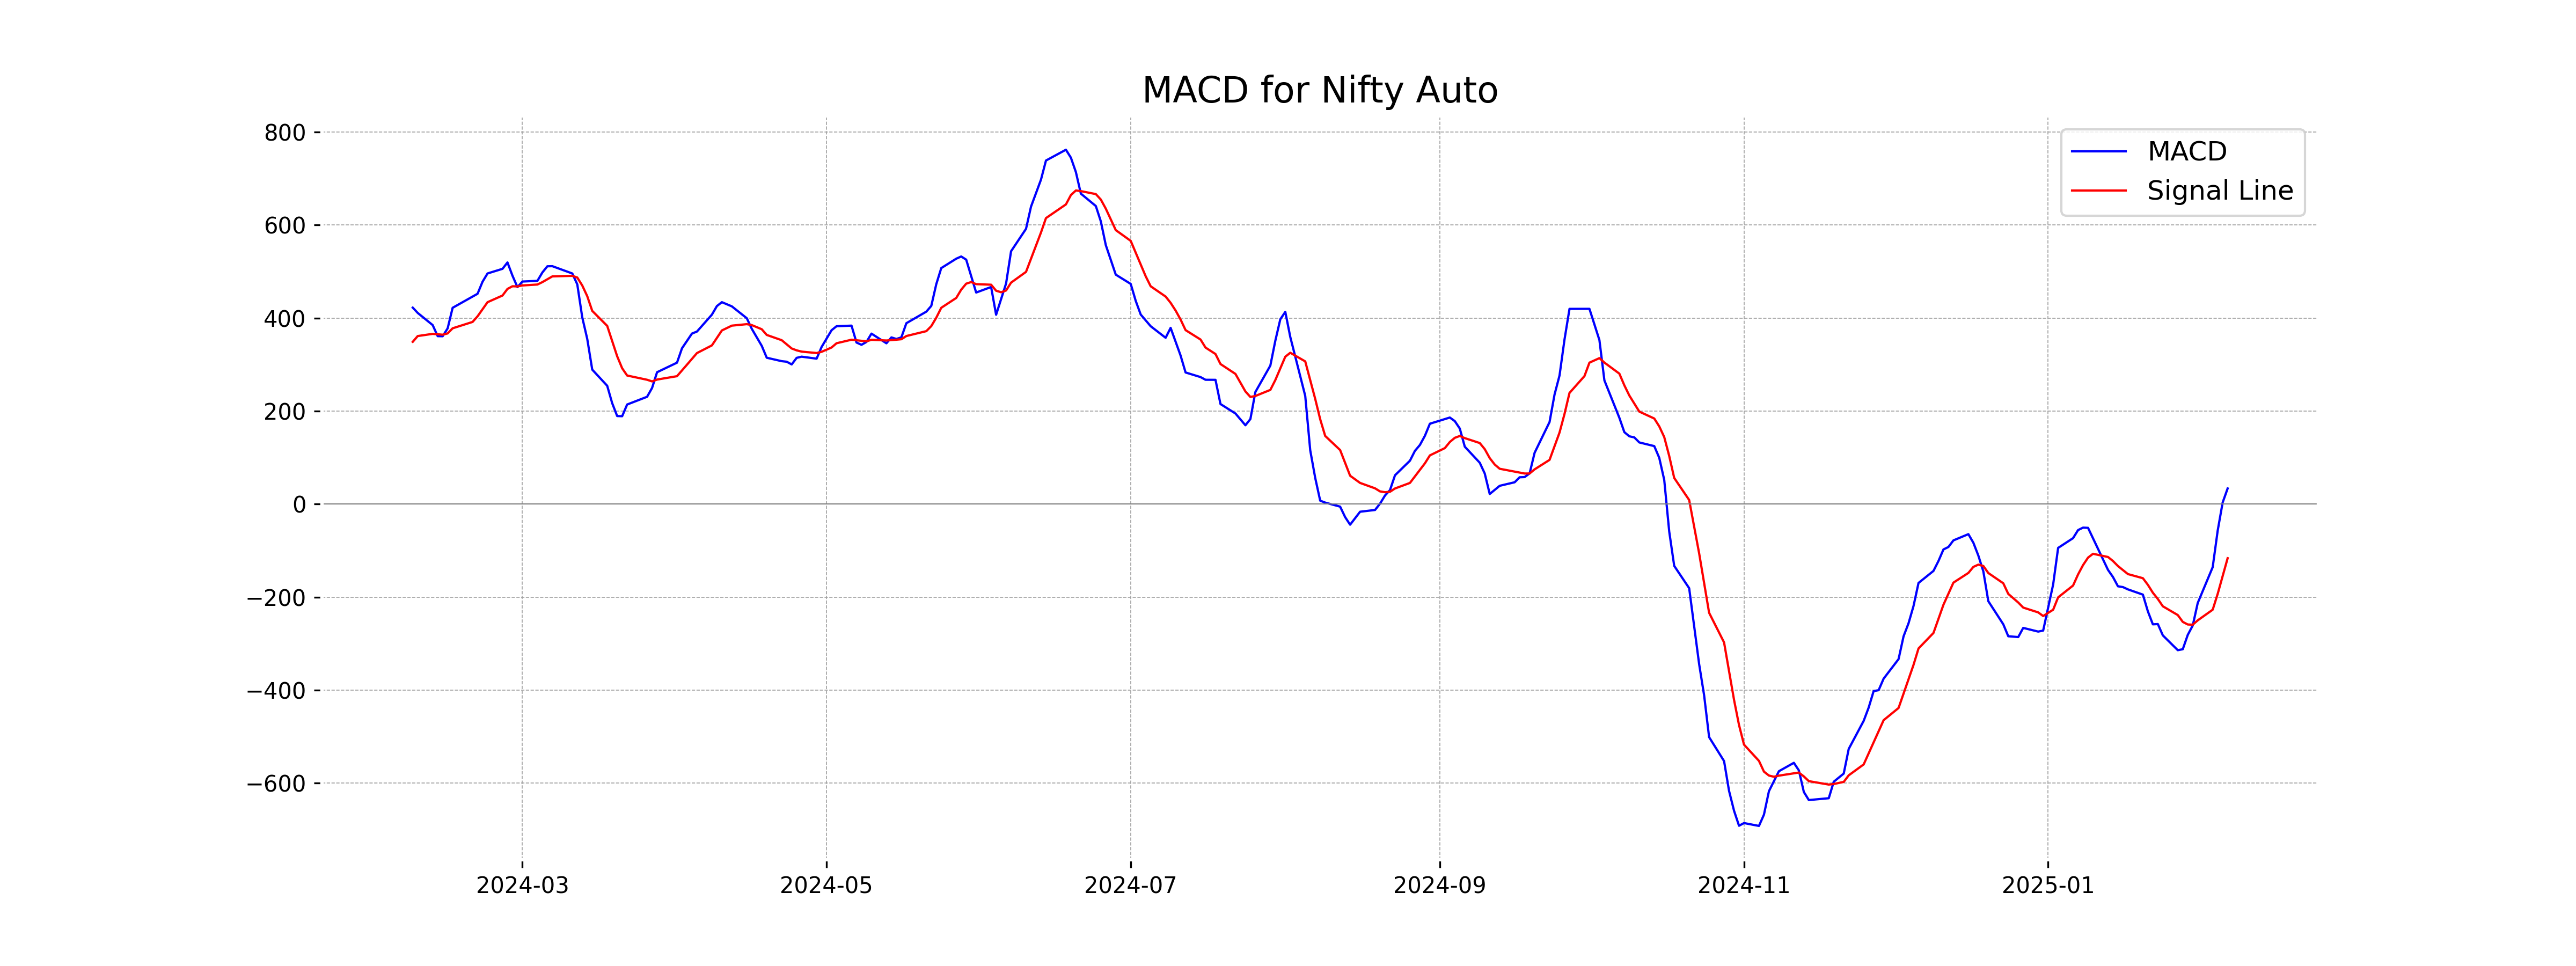
Analysis for Nifty Auto - February 06, 2025

Nifty Auto saw a slight decline, with a closing value at 23,298.85 points, down by 0.93% or 218.25 points from the previous close of 23,517.10. Despite this drop, the Relative Strength Index (RSI) indicates moderate momentum at 55.68, and the MACD suggests positive sentiment with a value of 33.63 against a signal of -116.35.

Relationship with Key Moving Averages
The closing price of Nifty Auto at 23,298.85 is above the 50-day EMA of 23,184.47 and the 20-day EMA of 22,922.11, indicating potential short-term strength, but it is below the 10-day EMA of 23,021.64. The price is also slightly below the 200-day EMA of 23,260.07, suggesting potential long-term consolidation or weakness.
Moving Averages Trend (MACD)
The MACD for Nifty Auto stands at 33.63 with a signal line of -116.35, indicating a bullish crossover as the MACD is above the signal line. This suggests potential upward momentum, although the percentage change is slightly negative. Keep an eye on volume and RSI alongside other indicators for a more comprehensive analysis.
RSI Analysis
The Relative Strength Index (RSI) for Nifty Auto is 55.68, which indicates that the stock is neither overbought nor oversold. RSI values typically below 30 suggest an asset is oversold, and above 70 suggest it is overbought. Therefore, Nifty Auto appears to be in a neutral range with no immediate trend reversal signals.

Analysis for Nifty Energy - February 06, 2025

Nifty Energy opened at 33,492.40 and closed at 33,059.75, experiencing a decline of approximately 0.86% with a points change of -285.70. The index's RSI is at 44.47, indicating slightly bearish sentiment, while the MACD is below the signal line, suggesting downward momentum. The current price is below the 50 EMA (35,006.74) and 200 EMA (37,523.94), reflecting potential weakness in the medium to long term trend.

Relationship with Key Moving Averages
The closing price of Nifty Energy is below its key moving averages: 50 EMA (35006.74), 200 EMA (37523.94), and 20 EMA (33543.03) but slightly above the 10 EMA (33126.36). This position indicates a bearish trend in the short term possibly strengthening over time if the movement below the longer moving averages continues.
Moving Averages Trend (MACD)
The MACD for Nifty Energy is -636.35, with the MACD Signal at -718.42. This indicates a bearish trend, as the MACD line is above the signal line, showing potential for a negative momentum in the near term.

RSI Analysis
The RSI for Nifty Energy is 44.47, which indicates that the stock is nearing the oversold zone but is not yet there. Values below 30 typically suggest an oversold condition, while values above 70 indicate overbought conditions. Thus, the current RSI suggests potential room for further downside before reaching oversold levels.

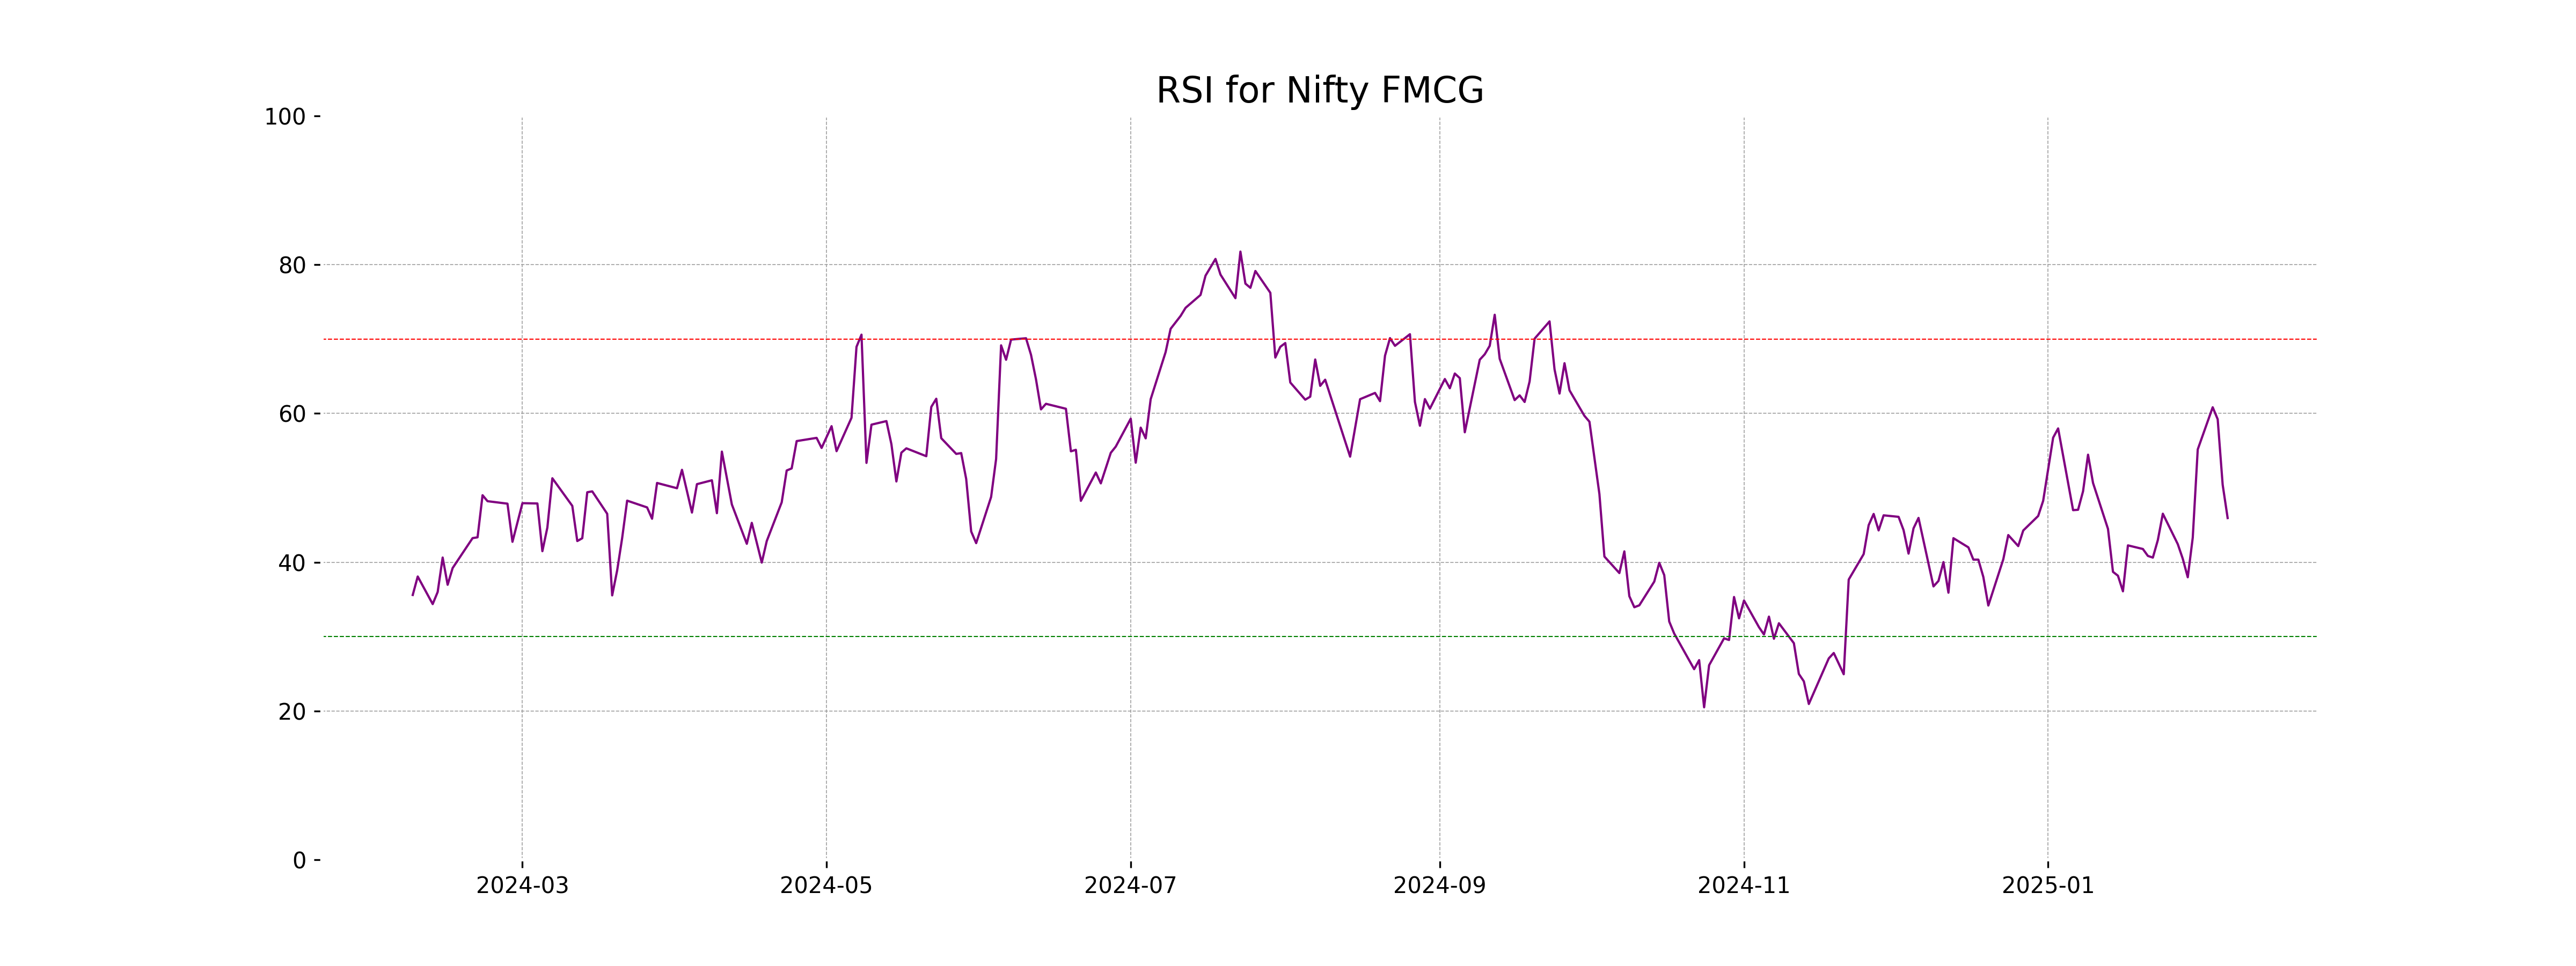
Analysis for Nifty FMCG - February 06, 2025

Nifty FMCG opened at 56,592.90 and closed at 55,841.80, showing a decrease of approximately 0.96% or 541.95 points from the previous close of 56,383.75. The relative strength index is at 45.94, indicating a neutral position, while the MACD shows a negative value, suggesting a bearish trend.

Relationship with Key Moving Averages
The closing price of Nifty FMCG is 55,841.80, which is below the 50 EMA of 56,805.50 and far below the 200 EMA of 57,746.06, indicating a bearish trend in both the short-term and long-term. Additionally, it is slightly below the 10 EMA of 56,257.42 and the 20 EMA of 56,228.51, supporting a downward momentum as the market trends below these critical moving averages.
Moving Averages Trend (MACD)
**MACD Analysis for Nifty FMCG:** The MACD value of -55.74 is above the MACD Signal of -173.62, suggesting a potential bullish crossover. However, both values are negative, indicating an overall bearish momentum.

RSI Analysis
**Nifty FMCG RSI Analysis:** The RSI value for Nifty FMCG is 45.94, which suggests that the stock is in the neutral zone. This indicates that it is neither overbought nor oversold, suggesting a balance between buying and selling pressures.
Analysis for Nifty Infra - February 06, 2025

The Nifty Infra index opened at 8354.05 and closed at 8249.45, experiencing a decline of 0.82% from the previous close of 8317.25, with a points change of -67.80. The index's RSI stands at 46.59, indicating a slightly bearish sentiment, while the MACD of -63.34 is above the signal line of -83.68, suggesting a potential positive momentum, despite trading below its 50-day and 200-day EMAs.

Relationship with Key Moving Averages
The Nifty Infra index closed at 8249.45, below the 50-day and 200-day EMAs of 8451.17 and 8539.41 respectively, indicating a potential bearish sentiment. It is similarly below its 10-day and 20-day EMAs (8254.99 and 8290.24), further suggesting downward pressure in the short term.
Moving Averages Trend (MACD)
Based on the data provided, Nifty Infra's MACD is at -63.34, while the MACD Signal is at -83.68, indicating a potentially bullish divergence as the MACD is higher than the signal line. This suggests a slowing in bearish momentum, but with RSI at 46.59, the stock is still in a neutral zone.

RSI Analysis
The Relative Strength Index (RSI) for Nifty Infra is 46.59, indicating that the stock is currently in the neutral range. An RSI below 30 is typically considered oversold, while above 70 is overbought. Therefore, Nifty Infra is neither overbought nor oversold at this level.

Analysis for Nifty IT - February 06, 2025

The Nifty IT index opened at 43197.30 and closed at 43020.95, showing a slight increase of 0.31% from the previous close of 42888.30. The index experienced a high of 43431.80 and a low of 42838.15, with technical indicators like the RSI indicating a neutral momentum at 50.20 and the MACD suggesting a bearish signal.

Relationship with Key Moving Averages
The closing price of Nifty IT is above its 10 EMA and 20 EMA, indicating short-term bullish momentum. It is slightly below the 50 EMA, suggesting some resistance might be present. However, the significant gap between the 50 EMA and the 200 EMA implies a generally positive long-term trend.
Moving Averages Trend (MACD)
Based on the data, Nifty IT's MACD value of -222.86 is higher than the MACD Signal value of -298.25, which indicates a potential bullish crossover. This suggests that the stock may experience upward momentum if the trend continues.

RSI Analysis
The RSI for Nifty IT is 50.20, indicating a neutral position as it is close to the midway point of 50. This suggests that the stock is neither overbought nor oversold, reflecting a balance in buying and selling pressures at the moment.

Analysis for Nifty Metal - February 06, 2025

Nifty Metal opened at 8449.55 and closed at 8363.65, marking a decrease of 0.75% with a points change of -63.45 from the previous close of 8427.10. The movement suggests a slight bearish trend with the current RSI at 46.66, indicating mild selling pressure. Key EMAs show that the 10 EMA is below both the 50 and 200 EMAs, suggesting a short-term bearish sentiment.

Relationship with Key Moving Averages
Nifty Metal closed at 8363.65, which is below both its 50 EMA of 8650.02 and 200 EMA of 8865.23, indicating a bearish trend in the longer term. However, it's slightly above its 10 EMA of 8342.40, suggesting short-term support around this level. The RSI at 46.66 indicates a neutral momentum, not favoring either overly bullish or bearish conditions.
Moving Averages Trend (MACD)
MACD for Nifty Metal shows a value of -102.66, which is above the signal line at -129.36, indicating a potential bullish crossover. This suggests that momentum might be shifting upwards, although the overall trend may still be bearish considering the negative MACD value.

RSI Analysis
The RSI for Nifty Metal is 46.66, which is below the midpoint of 50, indicating a slightly bearish sentiment. An RSI between 30 and 50 often suggests that the index could be relatively weak and may continue to experience downward pressure unless it turns upwards.

Analysis for Nifty Bank - February 06, 2025

Nifty Bank opened at 50,468.35 and closed slightly higher at 50,382.10, with a minor positive change of 0.08% from the previous close of 50,343.05. The Relative Strength Index (RSI) indicates a moderate strength at 56.29, while the Moving Average Convergence Divergence (MACD) suggests a slightly bearish sentiment with a value of -130.47.

Relationship with Key Moving Averages
Nifty Bank closed at 50,382.10, which is above its 50-day EMA of 50,237.06 and 200-day EMA of 50,217.97, indicating a positive trend. However, it is still below the 10-day EMA of 49,629.72 and 20-day EMA of 49,571.20, suggesting short-term bearishness.
Moving Averages Trend (MACD)
Nifty Bank's MACD of -130.47 indicates a negative momentum, though it is still above the MACD Signal of -434.38. This suggests the index may be experiencing a potential reversal or consolidation period as the MACD is moving towards the signal line, indicative of reduced bearish momentum.

RSI Analysis
Based on the provided data, the RSI (Relative Strength Index) for Nifty Bank stands at 56.29. This indicates a neutral to moderately bullish momentum, as it is above the mid-point of 50 but still below the overbought level of 70.

Analysis for Nifty 50 - February 06, 2025

The Nifty 50 opened at 23,761.95 and closed lower at 23,603.35, resulting in a drop of 92.95 points or a negative change of approximately 0.39%. The Relative Strength Index (RSI) is at 53.30, indicating a relatively neutral momentum, while the Moving Average Convergence Divergence (MACD) is negative, suggesting bearish sentiment. The 50-day EMA is above the closing price, confirming the downward trend compared to the previous close.

Relationship with Key Moving Averages
The close value of Nifty 50 at 23603.35 is below the 50-day EMA of 23668.71 and the 200-day EMA of 23623.40, indicating a possible bearish sentiment in the short term. However, it is slightly above the 10-day EMA of 23437.44 and the 20-day EMA of 23418.18, suggesting some short-medium term strength.
Moving Averages Trend (MACD)
Based on the provided data, the MACD for Nifty 50 is -41.35, which is above the MACD Signal value of -138.41. This suggests a potential bullish crossover, indicating that upward momentum may be building. However, the negative MACD still reflects a currently weak trend.

RSI Analysis
The RSI value for Nifty 50 is 53.30, indicating that the index is in a neutral zone where it is neither overbought nor oversold. Generally, an RSI above 70 suggests overbought conditions, and below 30 indicates oversold conditions. Therefore, the current RSI suggests a balanced momentum without any strong directional bias.

Up Next
Indian stock market sector-wise performance today - February 6, 2025

New Zealand commits USD 20 bn investment in India under FTA in 15 yrs; on lines of EFTA pact

India, New Zealand conclude FTA talks; pact to offer duty-free access, USD 20 bn FDI

FTA with New Zealand to significantly deepen bilateral economic engagement: Govt

Rupee breaches 91-mark against US dollar for first time in intra-day trade

Microsoft commits USD 17.5 billion investment in India: CEO Satya Nadella

More videos

CBI books Anil Ambani's son, Reliance Home Finance Ltd. in Rs 228 crore bank fraud case

RBI raises FY26 GDP growth projection to 7.3 pc

RBI trims policy interest rate by 25bps to 5.25pc, loans to get cheaper

Rupee slumps to all-time low of 90.25 against US dollar in intra-day trade

Reliance completes merger of Star Television Productions with Jiostar

India to lead emerging market growth with 7pc GDP rise in 2025: Moody’s

Nifty hits record high after 14 months; Sensex nears all-time peak

Reliance stops Russian oil use at its only-for-export refinery to comply with EU sanctions

ED attaches fresh assets worth over Rs 1,400 cr in case against Anil Ambani's Reliance Group

India signs one-year deal to import 2.2 million tonnes of LPG from US