


Highlights
- Nifty FMCG gained 1.78% with a 964.5 points rise
- Nifty IT dropped 2.19%, losing 727.05 points
- Nifty Energy decreased by 0.97%, down 307.8 points
Latest news

Samsung Galaxy Z Fold 8, Fold 8 Ultra & Z Flip 8: A More Mature Foldable Family

Dell Launches New Alienware 16X Aurora, 16 Area-51 and 18 Area-51 Gaming Laptops in India

Samsung Takes on Premium Home Audio With New Music Studio Series

The End of OxygenOS: OnePlus Confirms Shift to Oppo's ColorOS

Fujifilm Instax Mini Evo Cinema Review: A Hybrid Camera That Prints Memories Differently

iQOO Teases Z11 Lite With AI Tools, Military-Grade Durability and a 6500mAh Battery

Editorji Launches Hook Global, Its International Digital News Brand

Samsung's Bespoke AI ACs Focus on Humidity, Hygiene and Smarter Cooling
Indian stock market sector-wise performance today - April 9, 2025


The stock market on Wednesday (April 9, 2025) experienced a mixed performance across various sectors and indices, with some notable movements that caught the attention of investors.
An overview of the significant percentage changes among the indices provides insight into the market dynamics for the day.
One of the most prominent changes was observed in the Nifty FMCG sector, which recorded a remarkable increase of 1.78%. The strong performance in this sector suggests a potential positive sentiment surrounding consumer goods and indicates robust underlying demand or favorable earnings announcements.
In contrast, the Nifty IT sector faced the most significant decline, suffering a decrease of 2.19%. This downturn highlights possible challenges faced by technology companies, which could be attributed to factors such as global tech regulation tensions, unfavorable macroeconomic conditions, or profit booking by investors after a previous rally.
The Nifty Energy sector also saw a decline of 0.97%. This may reflect concerns over fluctuating oil prices or regulatory changes affecting the energy markets. The broader indices exhibited varied performances.
The SENSEX index experienced a decline of 0.51%, indicating a general cautious sentiment among investors, possibly driven by macroeconomic factors or international market influences.
Similarly, the Nifty Index decreased by 0.61%, indicating a slight bearish sentiment in the market.
Despite these declines, the Nifty Bank sector showed a relatively moderate decrease of 0.54%, suggesting resilience in the banking industry, which might be benefiting from stable interest rates or improved credit growth.
An analysis of the day's trading activity suggests that external economic factors or sector-specific developments could have driven the observed market movements. The pronounced dip in the Nifty IT sector is likely an outcome of investor concerns regarding the impact of geopolitical tensions on the global technology industry.
Additionally, evolving technology policies might have contributed to the sell-off in this sector.
Overall, the day's market performance underscores the variability in investor sentiment across different sectors, with certain industries showing growth potential while others grapple with external pressures or operational challenges.

Analysis for Sensex - April 09, 2025

### Sensex Performance: The Sensex opened at 74,103.83 and closed at 73,847.15, marking a decline of 0.51% or 379.93 points from the previous close of 74,227.08. Technical indicators show a bearish sentiment with an RSI value around 39.98 and the MACD at -241.97 indicating a negative momentum in the market.

Relationship with Key Moving Averages
The closing value of Sensex is 73,847.15, which is below its 50-day EMA of 75,956.17, 20-day EMA of 75,473.65, and 10-day EMA of 75,180.72, indicating a bearish trend. The longer-term 200-day EMA stands at 77,033.83, suggesting a significant bearish divergence with the current closing value.
Moving Averages Trend (MACD)
The MACD value for Sensex is -241.97 with a signal line of 80.19, indicating a bearish trend as the MACD is below the signal line. This suggests potential continued downside momentum in the index.

RSI Analysis
The RSI value for Sensex is 39.98, indicating that the index is approaching the oversold territory, as RSI values below 30 typically suggest oversold conditions. This could imply potential upcoming buying opportunities if the trend continues downward.

Analysis for Nifty Auto - April 09, 2025

Nifty Auto Performance The Nifty Auto index opened at 20,188.30 and closed slightly higher at 20,140.40, with a minuscule percentage change of 0.01%. The index is trading below several of its Exponential Moving Averages (EMAs), such as the 50, 200, 10, and 20 EMA, indicating bearish sentiments. The Relative Strength Index (RSI) is at 35.07, which suggests the index might be nearing oversold territory.

Relationship with Key Moving Averages
Nifty Auto's current close of 20140.40 is below the 50 EMA of 21552.16 and the 200 EMA of 22607.65, indicating a potential bearish trend. Additionally, it is also below the 10 EMA of 20695.08 and the 20 EMA of 20978.50, suggesting short-term weakness.
Moving Averages Trend (MACD)
The MACD for Nifty Auto is -327.03, which is below the MACD Signal of -204.75. This indicates a bearish momentum, suggesting that the stock is experiencing downward pressure and may continue to decline in the short-term.

RSI Analysis
Based on the provided data, Nifty Auto has an RSI of 35.07, suggesting it is in the lower range of the RSI scale. This indicates that the stock may be nearing oversold conditions, which could potentially signal a buying opportunity if the trend reverses. However, it is important to consider additional factors before making investment decisions.

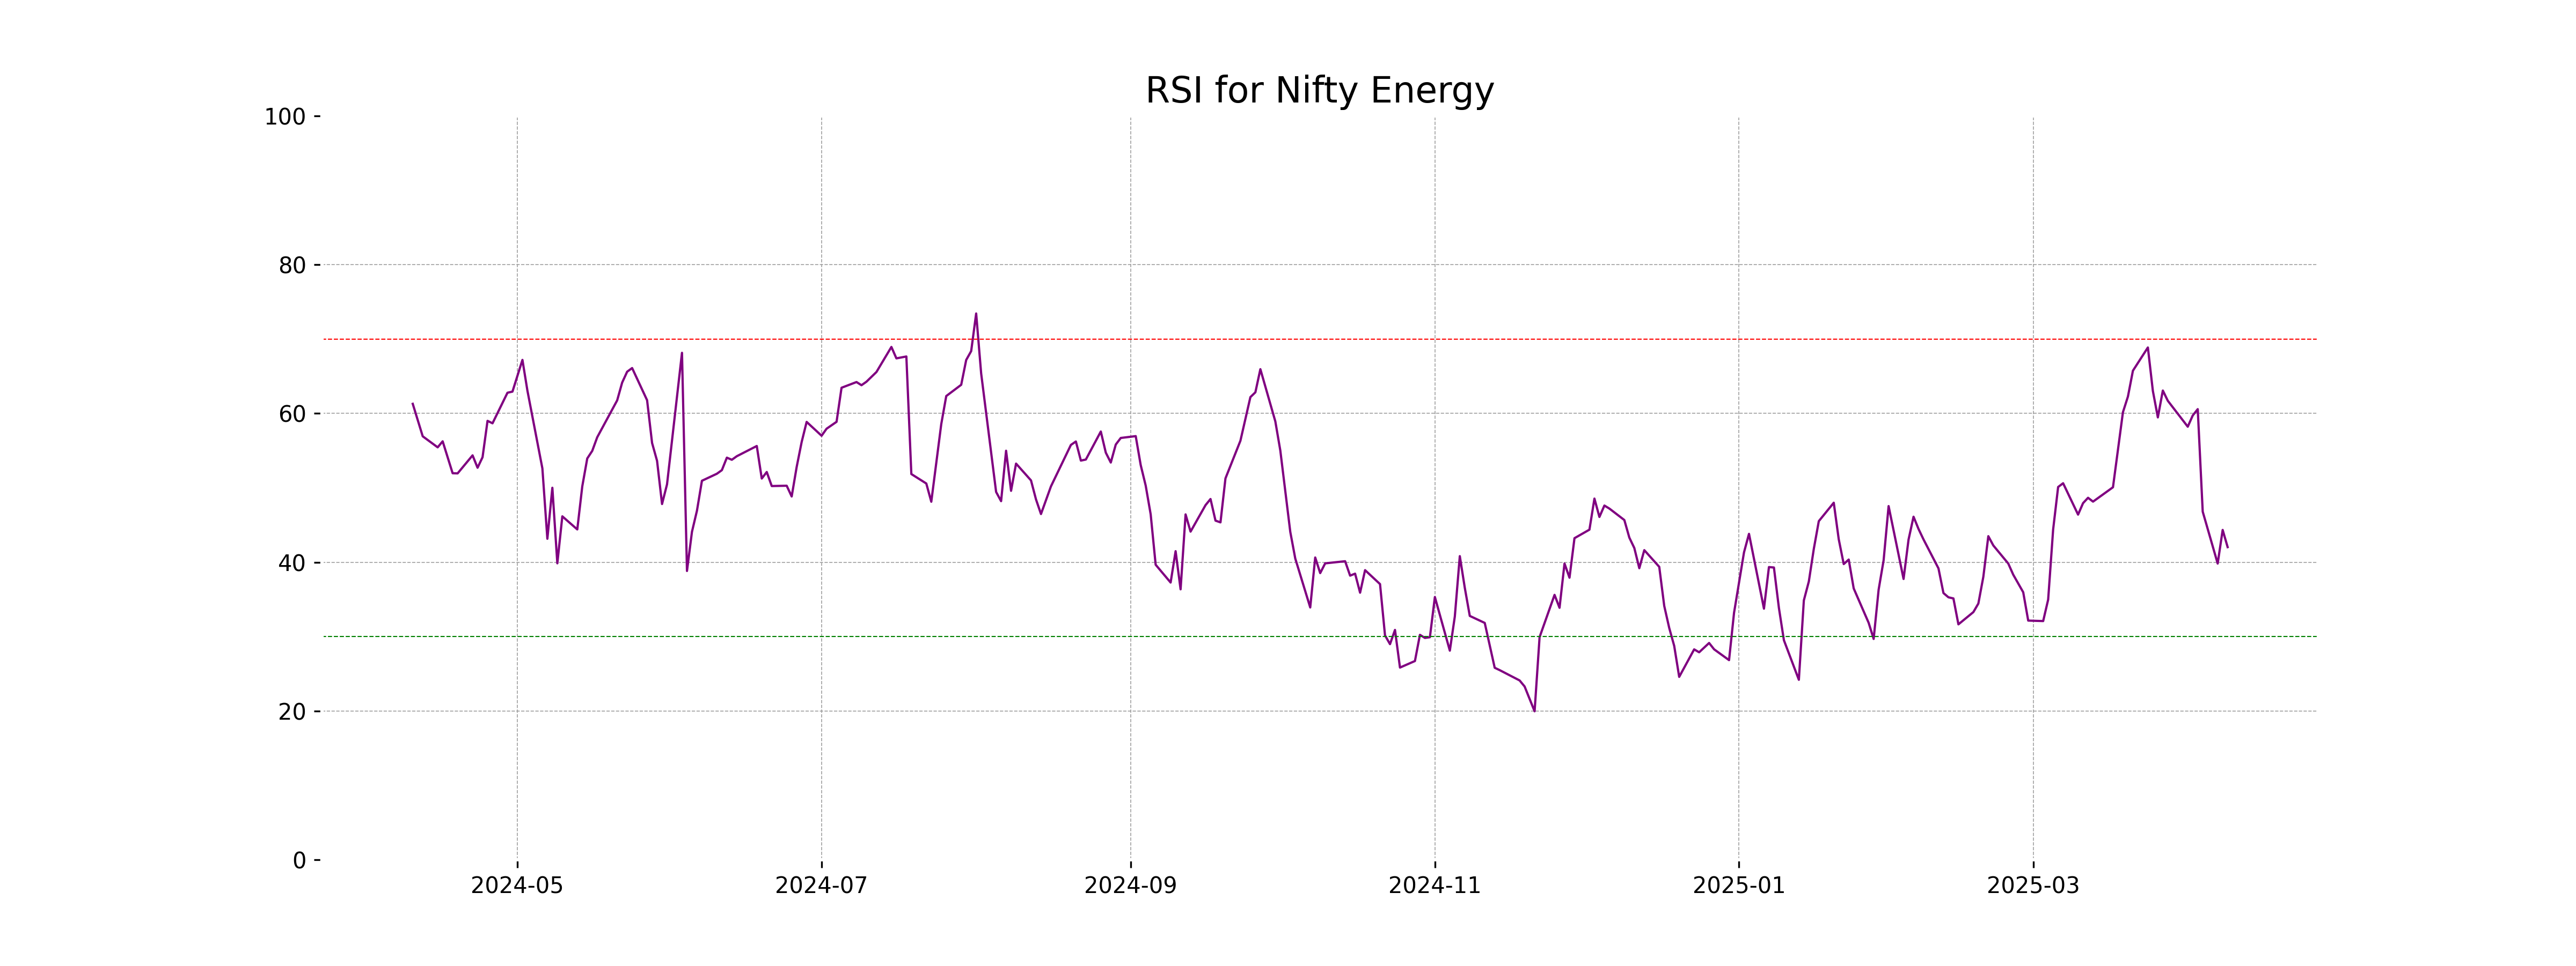
Analysis for Nifty Energy - April 09, 2025

Nifty Energy opened at 31,788.90, reaching a high of 31,824.15 and a low of 31,422.65, before closing at 31,558.95. The index experienced a decline of 0.97% from the previous close of 31,866.75, with a points change of -307.80. The 50-day EMA stands at 32,727.07, while the RSI is 42.03, indicating weakening momentum.

Relationship with Key Moving Averages
Nifty Energy closed below its 10 EMA, 20 EMA, and 50 EMA, indicating a short-term bearish trend. The current close of 31,558.95 is significantly below the 200 EMA of 35,658.23, suggesting weakness compared to its longer-term average. The RSI is at 42.03, showing that the index is nearing the oversold territory.
Moving Averages Trend (MACD)
Based on the data, Nifty Energy's MACD is significantly lower than the MACD Signal, indicating a bearish momentum. The current MACD value of 31.26, compared to the MACD Signal of 230.47, suggests a potential continuation of the downward trend.

RSI Analysis
The RSI (Relative Strength Index) for Nifty Energy stands at 42.03, indicating that the stock is approaching the lower end of the neutral range. This suggests a potential buying opportunity may arise if the downtrend continues and the RSI approaches oversold levels.
Analysis for Nifty FMCG - April 09, 2025
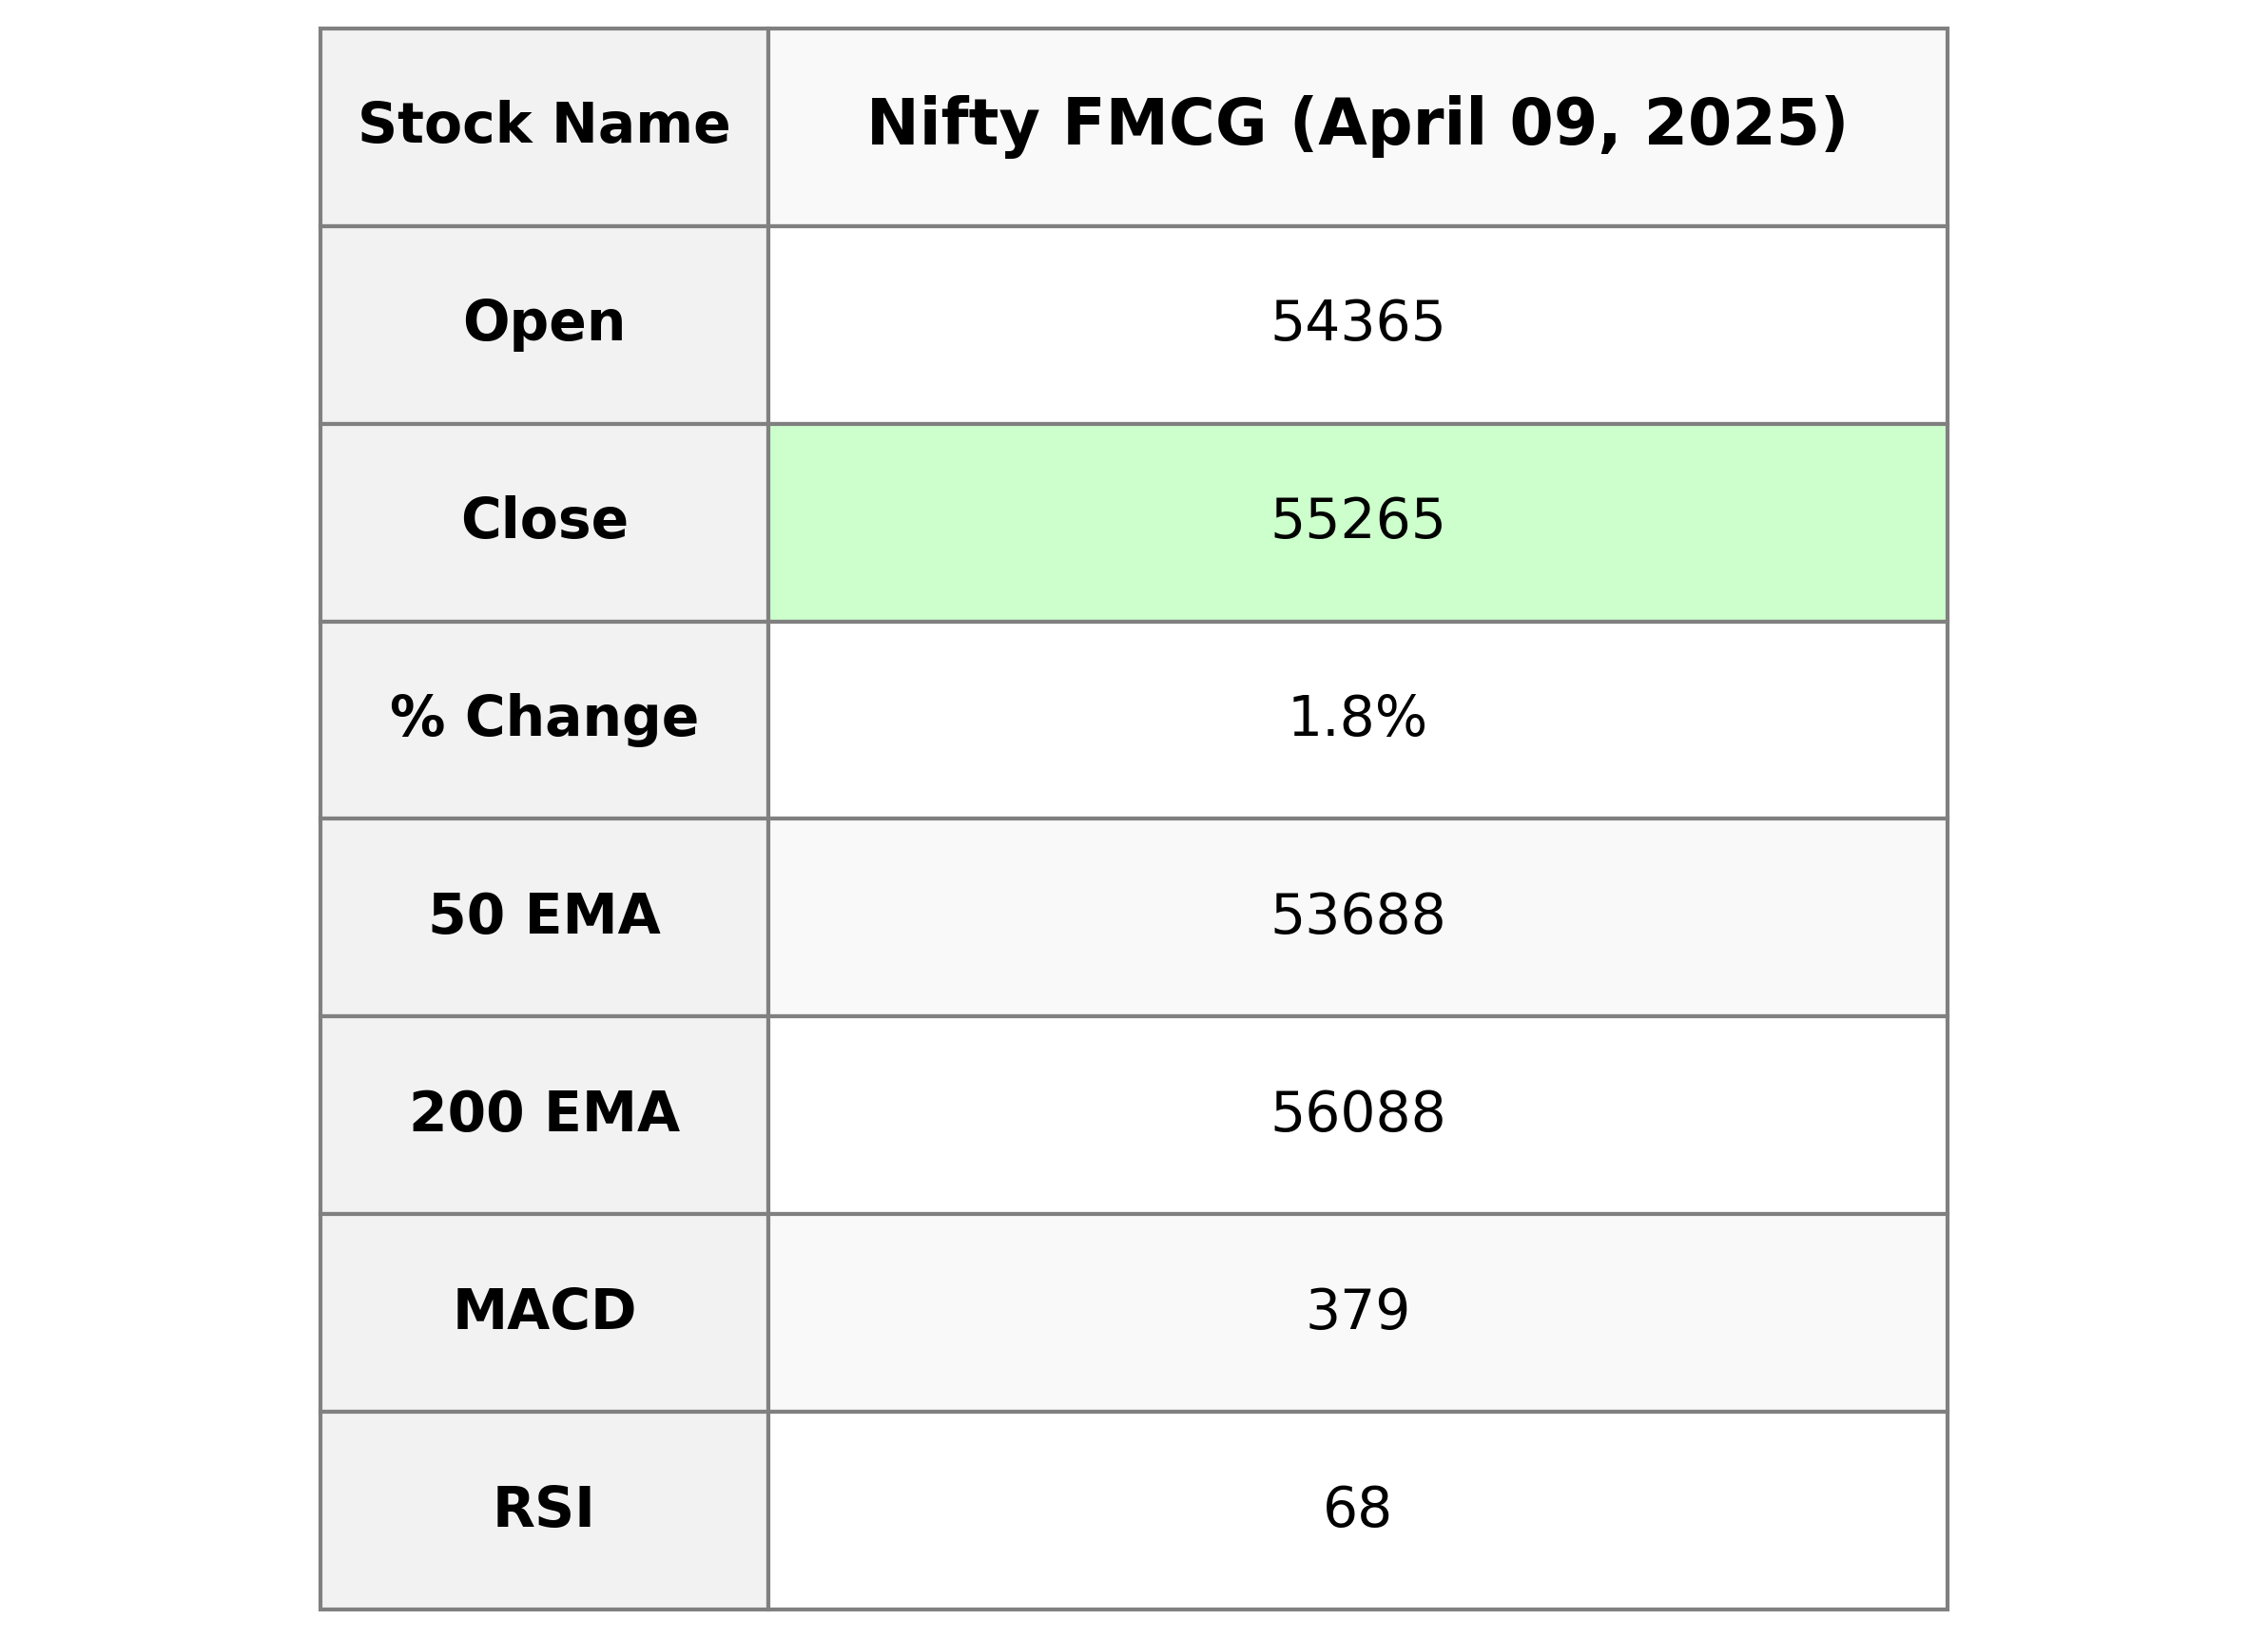
Nifty FMCG opened at 54,365.25 and closed at 55,264.75, marking a gain of 1.78% with a points change of 964.5. The RSI value of 68.29 suggests that the index is approaching overbought territory. Meanwhile, the MACD value indicates positive momentum, reinforcing the bullish sentiment for Nifty FMCG.

Relationship with Key Moving Averages
The Nifty FMCG index closed at 55264.75, which is above its 50 EMA (53688.37) and 10 EMA (53817.01), indicating a short-term bullish trend. However, it remains below the 200 EMA (56087.97), suggesting a potential long-term resistance. With an RSI of 68.29, the index is approaching overbought levels.
Moving Averages Trend (MACD)
The MACD for Nifty FMCG is 379.26, which is above the MACD Signal of 118.23. This indicates a bullish momentum, suggesting that the stock index may experience further upward movement. However, caution is advised as the RSI is nearing the overbought threshold at 68.29.

RSI Analysis
The RSI value for Nifty FMCG is 68.29, indicating that it is approaching the overbought zone, typically marked at a level of 70. This suggests that the stock may be overvalued in the short term, and traders might anticipate a potential pullback or consolidation.

Analysis for Nifty Infra - April 09, 2025

Nifty Infra opened at 8093.0 and closed slightly lower at 8086.25, showing a percentage change of -0.28% compared to the previous close. The index's Relative Strength Index (RSI) indicates a neutral trend at 45.19, while the Moving Average Convergence Divergence (MACD) is below its signal line, suggesting a bearish sentiment. The index struggled to surpass its short-term exponential moving averages.

Relationship with Key Moving Averages
Nifty Infra closed below its 10-day, 20-day, and 50-day EMAs, indicating a bearish sentiment as short-term trends are also below key moving averages. The index's RSI at 45.19 suggests consolidation around a neutral zone.
Moving Averages Trend (MACD)
The Nifty Infra index shows a negative MACD divergence as the MACD value (28.38) is below the MACD signal line (66.73), indicating a potential bearish trend. This may suggest a weakening momentum for the index, but the overall RSI of 45.19 hints at neither overbought nor oversold conditions.

RSI Analysis
The RSI value for Nifty Infra is 45.19, indicating that the index is currently in the neutral range. It is not in the overbought or oversold territory, suggesting a balanced momentum. Traders may interpret this as a signal to monitor for potential trend changes or continuation.

Analysis for Nifty IT - April 09, 2025

Nifty IT opened at 32710.25 with a high of 32762.30 and a low of 32200.25, closing at 32517.35, indicating a decline of -2.19% or a loss of 727.05 points from the previous close of 33244.40. The index is under pressure with a low RSI of 24.84, indicating oversold conditions, and the MACD is below the signal line, suggesting bearish momentum.

Relationship with Key Moving Averages
The current closing price of Nifty IT at 32517.35 is below its 10 EMA (34502.83), 20 EMA (35738.18), 50 EMA (38057.88), and 200 EMA (39656.01), indicating a bearish trend. The stock is trading significantly lower than these key moving averages, highlighting potential downward momentum.
Moving Averages Trend (MACD)
The MACD value for Nifty IT is -1519.70, and the MACD Signal is -1214.75, indicating a bearish trend as the MACD line is below the signal line. The negative MACD suggests downward momentum in the stock's price.

RSI Analysis
The RSI value for Nifty IT is 24.84, which indicates that the index is in the oversold territory. This could signal potential for an upward correction, but traders should exercise caution and consider other factors before making decisions.

Analysis for Nifty Metal - April 09, 2025

Nifty Metal opened at 7924.85 and closed at 7847.5, experiencing a percentage change of -1.48% with a points change of -118.10. The Relative Strength Index (RSI) is at 29.24, indicating oversold conditions, while the MACD value of -136.57, compared to the MACD Signal value of 32.95, suggests a bearish trend. The current trading level is below the 50, 10, and 20 EMAs, pointing to potential downward momentum.

Relationship with Key Moving Averages
The Nifty Metal index is trading below its 10-day, 20-day, 50-day, and 200-day EMAs, indicating a bearish trend. The close of 7847.5 is below all these key EMAs, which suggests that the index is under selling pressure and lacks upward momentum.
Moving Averages Trend (MACD)
The Nifty Metal's MACD value of -136.57, which is significantly lower than the MACD Signal of 32.95, suggests strong bearish momentum. This indicates potential continued downward pressure on the index, as momentum appears to be in favor of the bears.

RSI Analysis
RSI Analysis for Nifty Metal: The Relative Strength Index (RSI) for Nifty Metal stands at 29.24, which indicates that the stock is currently in the oversold territory. An RSI value below 30 generally suggests that the stock may be undervalued and could experience a potential upward price correction or rally in the near term.

Analysis for Nifty Bank - April 09, 2025

Nifty Bank opened at 50,487.10, reached a high of 50,496.89, and closed at 50,240.15. The index experienced a decline from the previous close of 50,511.00, with a percentage change of approximately -0.54%, reflecting a decrease of 270.85 points. RSI is at 50.27, indicating a neutral momentum, while the MACD shows a bearish signal as it is below the MACD Signal line.

Relationship with Key Moving Averages
The Nifty Bank index closed at 50240.15, which is above the 50 EMA of 50004.17 and the 200 EMA of 50045.36, indicating short to medium-term strength. However, it is below the 10 EMA of 50687.22 and the 20 EMA of 50391.79, suggesting some recent downward pressure.
Moving Averages Trend (MACD)
The MACD for Nifty Bank is currently 415.63, which is below the MACD Signal of 501.26. This indicates a bearish signal, suggesting that the stock may be experiencing a downward trend. Keeping an eye on further movements could be useful for identifying any changes in momentum.

RSI Analysis
The RSI value for Nifty Bank is 50.27, indicating a neutral market condition. This suggests that the index is neither overbought nor oversold. Monitoring for any changes in momentum or trend in subsequent sessions would be advisable.

Analysis for Nifty 50 - April 09, 2025
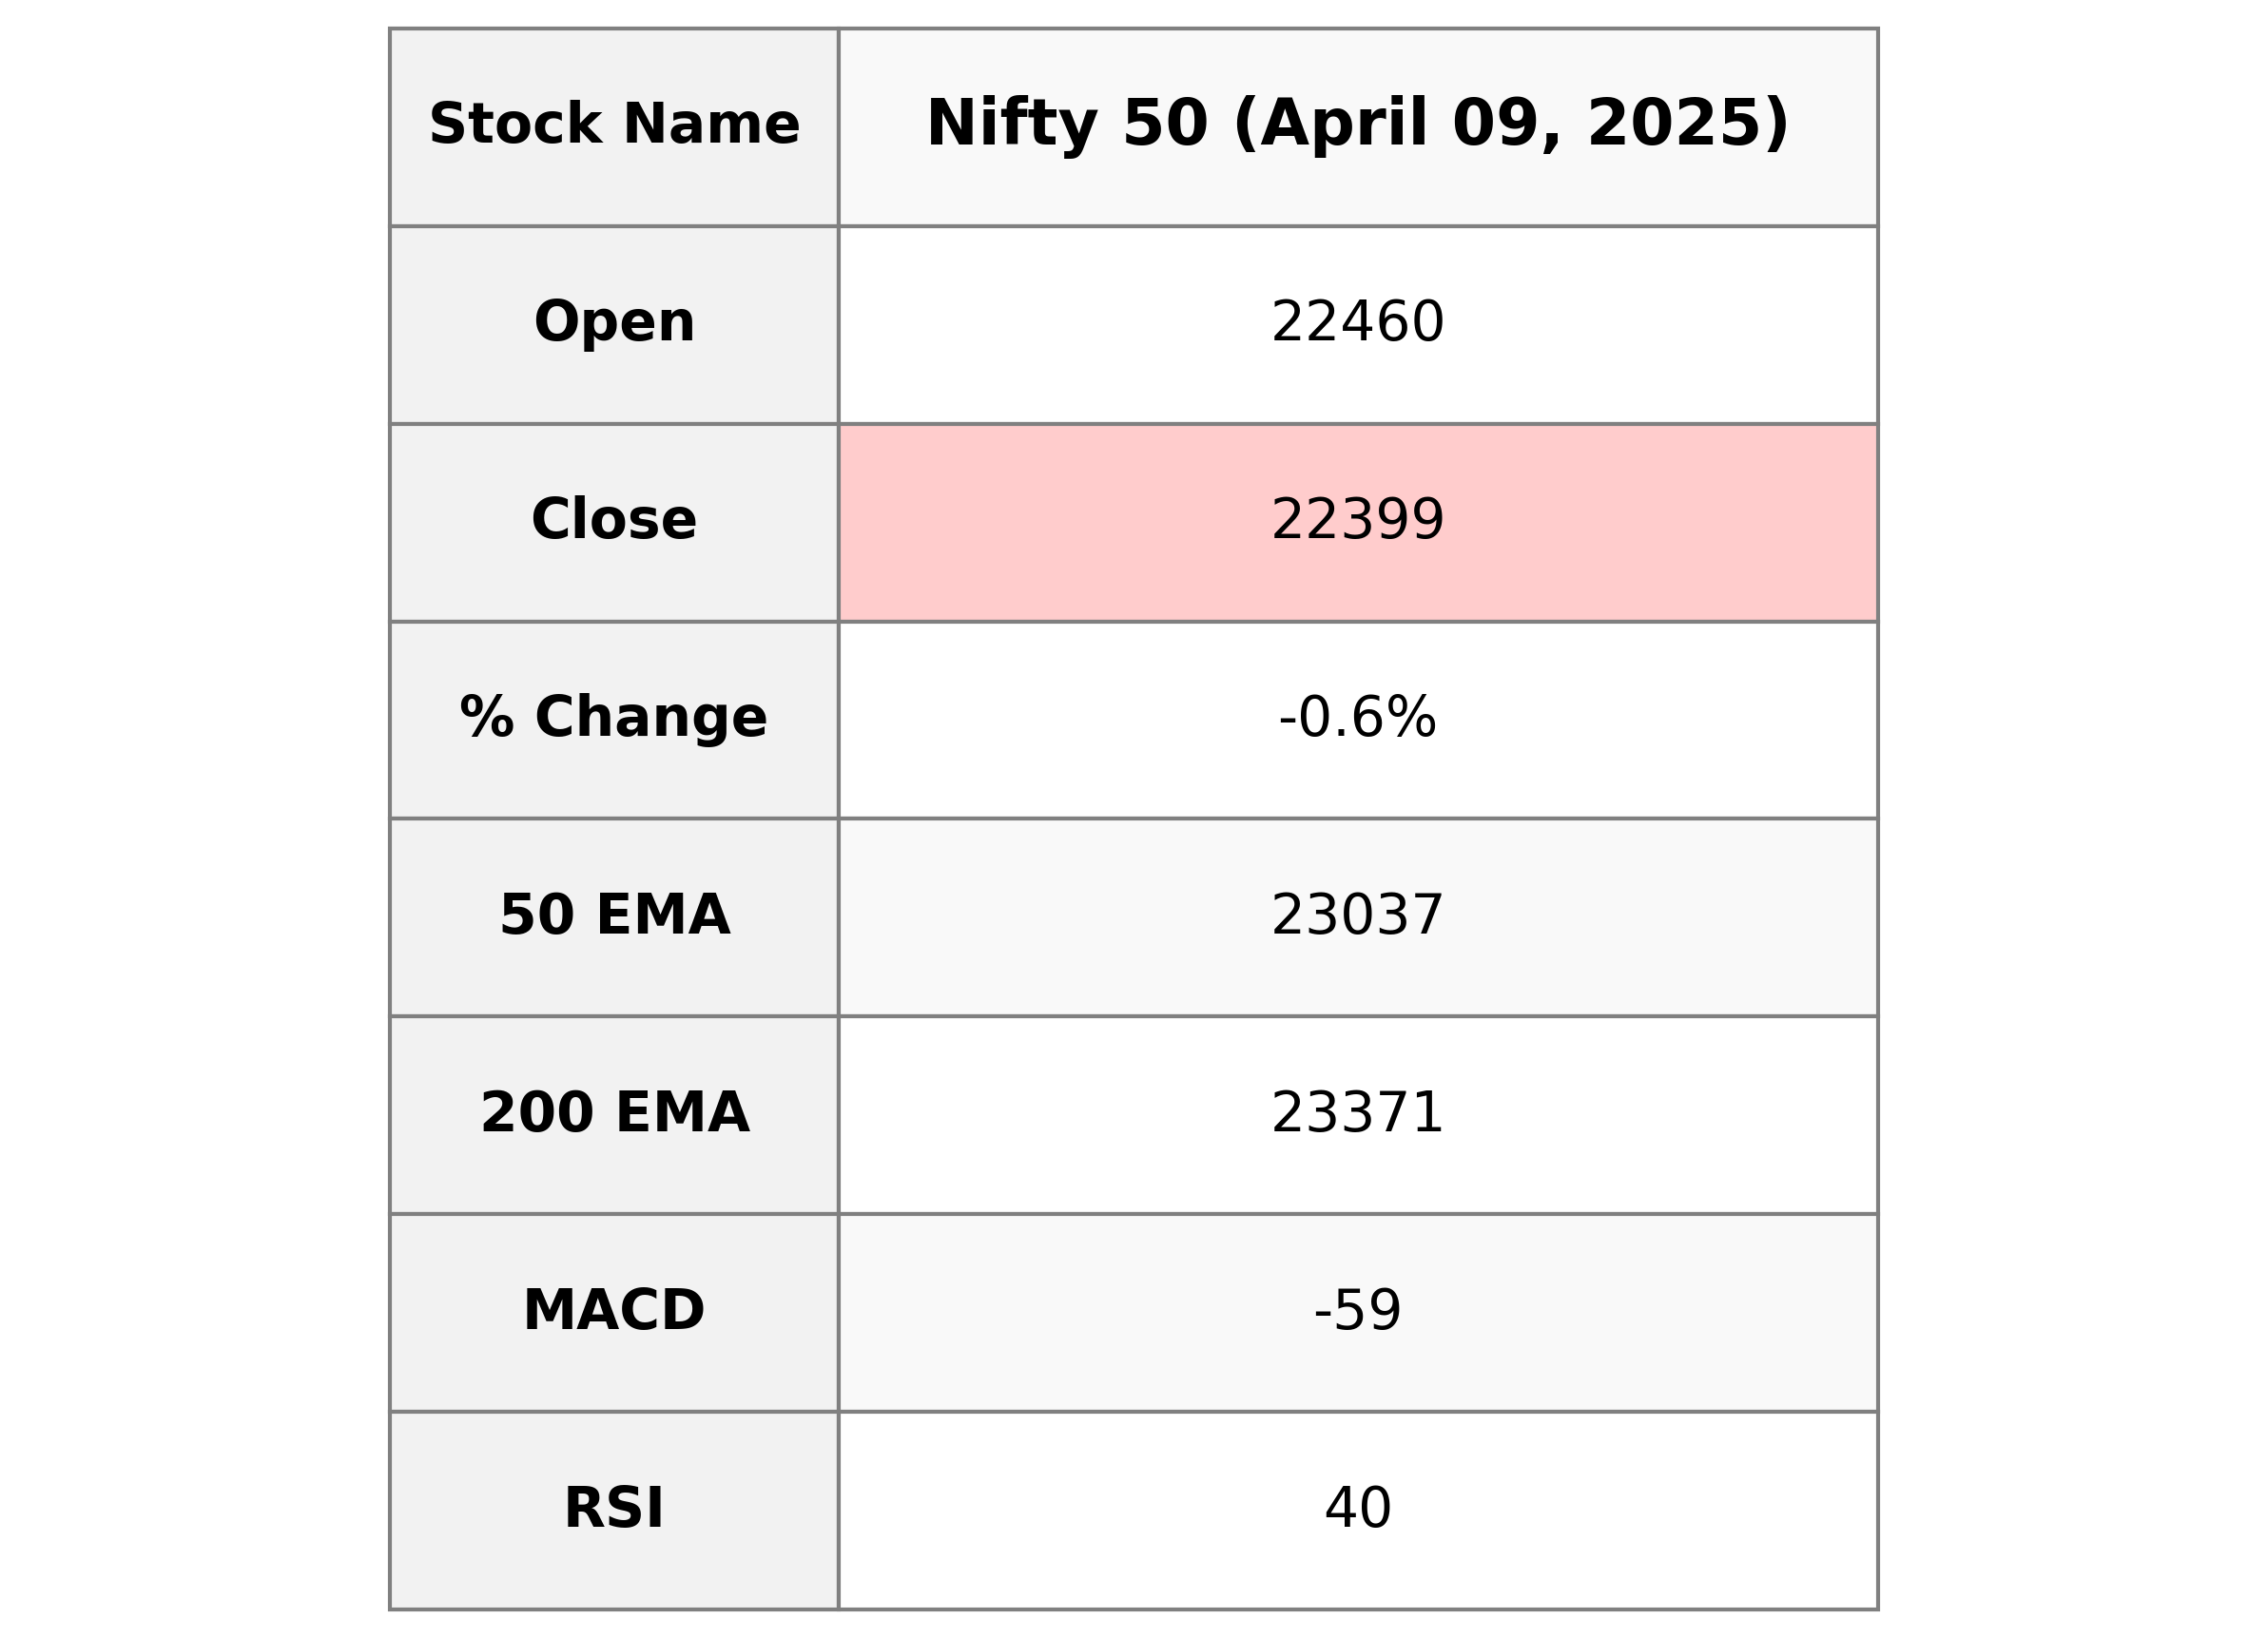
Nifty 50 opened at 22460.30 and closed at 22399.15, marking a decline of 136.70 points from the previous close of 22535.85. The percentage change stood at -0.61%, with a Relative Strength Index (RSI) of 40.10 indicating a weak momentum. The Moving Average Convergence Divergence (MACD) was significantly negative at -58.57, suggesting bearish sentiment, while the 50 EMA and 200 EMA were above the current closing, further emphasizing the downward trend.

Relationship with Key Moving Averages
The closing price for Nifty 50, at 22,399.15, is below key moving averages, indicating a bearish trend. It is below the 10-EMA (22,835.18), 20-EMA (22,916.13), 50-EMA (23,037.05), and 200-EMA (23,371.13), suggesting downward momentum. The RSI value of 40.10 further indicates potential weakness in the market.
Moving Averages Trend (MACD)
Nifty 50 MACD Analysis: The MACD value of -58.57 suggests a bearish sentiment as it is below the signal line value of 46.63. This indicates that the recent price action is negative, and the selling pressure may continue in the short term.

RSI Analysis
Based on the provided data for Nifty 50, the Relative Strength Index (RSI) stands at 40.10. This suggests that the index is closer to the oversold territory, indicating potential selling pressure. Typically, an RSI below 30 is considered oversold, but at 40, it may hint at a weakening trend or bearish sentiment.

Up Next
Indian stock market sector-wise performance today - April 9, 2025

Step-by-step guide to apply for a mortgage loan online with minimal documentation

Honda Activa 6G: Everything You Need to Know Before Buying

How much does a ULIP plan really cost? A break-down of all charges

Centre plans to borrow Rs 8.20 lakh cr from market in first half of FY27

Reliance denies buying Iranian oil amid US sanctions waiver

More videos

Premium petrol price up Rs 2, industrial diesel up Rs 22; no change in normal petrol, diesel rates

India's GDP expected to register over 8 pc growth in Sep-Dec: Report

Govt announces seven measures to help boost exports

RBI keeps interest rates on hold after US trade deal boosts outlook

RBI proposes to compensate customers up to Rs 25,000 loss due to fraud

RBI raises GDP growth projection of Q1, Q2 of FY27

RBI pauses rate cuts, retains interest rate at 5.25 pc

Rupee jumps 122 paise to close at 90.27 against US dollar on India-US trade deal

Stock markets cheer India-US trade deal: Sensex, Nifty surge 2.5 pc

UPI transactions hit record high of Rs 230 lakh crore in 2025-26 till Dec: Govt