


Highlights
- Sensex struggles below key moving averages, indicating weakness
- Dow Jones sees short-term recovery but remains in downtrend
- Hang Seng enters overbought zone, signaling potential correction
Latest news

Step-by-step guide to apply for a mortgage loan online with minimal documentation

Hansika Motwanni seeks blessings at Tirumala temple, shares morning glimpse

Former New York IT Professional Builds Wellness Brand in Telangana, Creating Employment Through Small-Town Manufacturing

Sand2Sky Launches as Bhubaneswar's Premier Luxury Real Estate Consultancy, Redefining High-End Property Advisory in Odisha

Eros Music Worlds announces AI-powered music platform, partnership with Mohammed Rafi family

LTM Joins Athena, a Chainguard-led Industry Coalition to Help Secure Open Source Software in the AI Era

DOT School of Design Hosts Tamil Nadu's Biggest Design Graduation Show in Chennai

Bell Techlogix India Earns 2026 Great Place To Work Certification™ for Second Consecutive Year
Global stock market indices: How the world markets performed today - 06 March 2025


The international stock market indices showed varied performances on March 06, 2025, reflecting the economic sentiment across different regions.
In this article, we analyze the performance of key global indices including the S&P 500, Dow Jones Industrial Average, NASDAQ Composite, FTSE 100, DAX, CAC 40, IBEX 35, Nikkei 225, Hang Seng, Nifty 50, and BSE Sensex.

Analysis for Sensex - March 06, 2025

The BSESN opened at 74,308.30 and closed at 74,340.09, showing a rise of 0.83% with a points change of 609.87. The Relative Strength Index (RSI) is at 40.12, indicating a weak momentum. The MACD is -951.55, suggesting a bearish trend.

Relationship with Key Moving Averages
Based on the given data for Sensex, the closing price of 74340.09 is below both the 50-day EMA (76454.95) and the 200-day EMA (77384.32), indicating a bearish trend relative to these key moving averages. Additionally, the 10-day EMA (74255.80) is slightly below the closing price, suggesting some short-term strength relative to the very short-term trend. Overall, this data implies a potential continuation of the downtrend unless reversed by significant market movements.
Moving Averages Trend (MACD)
MACD Analysis for Sensex: The MACD value of -951.55 indicates a bearish trend for the Sensex, as it is below the signal line of -825.45. This suggests potential downward momentum and investors should be cautious.

RSI Analysis
The RSI value for Sensex is 40.12, indicating it is in the lower half of the scale and possibly nearing oversold conditions. An RSI below 30 typically suggests that a stock might be undervalued, so it's worth monitoring for a potential rebound.

Analysis for Dow Jones Industrial Average (US) - March 06, 2025

The Dow Jones Industrial Average opened at 42,518.37 and closed higher at 43,006.59, marking a 1.14% increase with a points change of 485.60. Despite the positive close, the RSI at 41.16 indicates a neutral momentum, and the MACD value suggests continued bearish sentiment. The trading volume stood at approximately 582.35 million.

Relationship with Key Moving Averages
Dow Jones Industrial Average is trading below its 50-day and 20-day EMAs but above the 200-day EMA, suggesting a short-term downtrend within a longer-term uptrend. The close price is above the 10-day EMA, indicating a potential short-term recovery.
Moving Averages Trend (MACD)
The current MACD for the Dow Jones Industrial Average indicates a bearish sentiment, as it is negative at -271.59 and is below the MACD Signal line at -95.13. This suggests potential for further downward momentum unless a positive crossover occurs.

RSI Analysis
The RSI (Relative Strength Index) for the Dow Jones Industrial Average is 41.16, indicating it is in a neutral range, suggesting neither overbought nor oversold conditions. Thus, the index may experience sideways trading before signaling a more definitive trend direction.

Analysis for CAC 40 (France) - March 06, 2025

CAC 40 (France) Performance: The CAC 40 opened at 8226.19 and closed slightly lower at 8143.34, marking a decrease of 30.41 points from the previous close. This resulted in a percentage change of -0.37%. The RSI stands at 57.33, suggesting moderate market strength, while the MACD is at 79.04, indicating a potential downward momentum compared to the MACD Signal of 96.87.

Relationship with Key Moving Averages
The CAC 40 index closed at 8143.34, which is above its 50-day EMA of 7891.79 and its 200-day EMA of 7649.13, indicating a bullish trend in the longer term. However, it remains close to its 10-day EMA of 8124.62 and 20-day EMA of 8078.33, suggesting potential near-term consolidation or minor fluctuations.
Moving Averages Trend (MACD)
The MACD for CAC 40 indicates a negative movement as the MACD (79.04) is below the MACD Signal line (96.87). This suggests a potential bearish trend in the market.

RSI Analysis
RSI Analysis: The RSI (Relative Strength Index) for the CAC 40 is currently at 57.33. This value suggests that the index is in a neutral zone, indicating neither overbought nor oversold conditions. A value between 30 and 70 typically signifies a stable market environment.

Analysis for FTSE 100 (UK) - March 06, 2025

The FTSE 100 (UK) opened at 8755.84 and closed lower at 8673.05, reflecting a percentage change of -0.95% and a points change of -82.75. The market is showing signs of bearish momentum with an RSI of 49.37 and the MACD below its signal line, indicating potential weakness.

Relationship with Key Moving Averages
The FTSE 100 closed at 8673.05, which is below its 10 EMA (8739.96) and 20 EMA (8710.74) but above its 50 EMA (8583.20) and 200 EMA (8303.18). This indicates short-term weakness as it remains beneath the shorter-term moving averages, yet it holds a longer-term bullish trend by staying above the 50 and 200 EMAs.
Moving Averages Trend (MACD)
MACD Analysis for FTSE 100 (UK): The MACD value of 51.77 is below the MACD Signal value of 65.86, suggesting a potential bearish trend. The RSI of 49.37 implies a market that is relatively neutral, hovering near the 50 mark, indicating neither strong upward nor downward momentum.

RSI Analysis
FTSE 100 (UK) RSI Analysis: The Relative Strength Index (RSI) for FTSE 100 is at 49.37, indicating a neutral market condition. This value suggests that the index neither shows overbought nor oversold signals, implying that the market may not be due for a significant reversal or continuation pattern based on RSI alone.

Analysis for DAX (Germany) - March 06, 2025

The DAX (Germany) opened at 23,245.34 and closed at 23,168.97, reflecting a slight increase from the previous close. The percent change was 0.38%, indicating a modest upward movement. The RSI at 63.62 suggests the index is nearing overbought levels, while the MACD indicates a declining momentum.

Relationship with Key Moving Averages
The close price of DAX (Germany) at 23168.97 is above the 50 EMA of 21682.99 and the 20 EMA of 22456.53, indicating a potential upward trend. However, it is below the 10 EMA of 22738.12 and close to it, suggesting possible short-term pressure. With an RSI of 63.62, the index is approaching overbought conditions.
Moving Averages Trend (MACD)
The MACD for DAX (Germany) is currently at 396.68, which is slightly below its MACD Signal of 398.83. This suggests a potential bearish signal, as the MACD line is crossing below the signal line. However, further confirmation is advised as the difference is marginal.

RSI Analysis
The Relative Strength Index (RSI) for DAX (Germany) is 63.62, indicating a moderately bullish momentum. An RSI above 50 suggests that the index is gaining strength, but it hasn't reached the overbought threshold of 70, suggesting room for further upward movement before a potential pullback.

Analysis for S&P 500 (US) - March 06, 2025

S&P 500 (US) Performance: On the latest trading day, the S&P 500 opened at 5781.36, closed at 5842.63, marking a percentage change of 1.12% or a points change of 64.48 from the previous close of 5778.15. Despite the rise, the index remains below its 50-day EMA of 5980.08 and 20-day EMA of 5965.14, indicating a downward trend with an RSI of 39.45 and a MACD of -47.14. Volume traded was 5.29 billion, reflecting active market participation.

Relationship with Key Moving Averages
The S&P 500 is currently trading below its 10-day EMA of 5914.73 and its 50-day EMA of 5980.08, suggesting a potential bearish trend. However, it is above its 200-day EMA of 5711.10, indicating a longer-term uptrend may still be in play.
Moving Averages Trend (MACD)
S&P 500 MACD Analysis: The MACD value is -47.14 and the MACD signal is -16.91, indicating that the MACD line is below the signal line. This suggests a bearish trend in the S&P 500, as the MACD is in negative territory and moving further away from the signal line.

RSI Analysis
The Relative Strength Index (RSI) for the S&P 500 indicates a value of 39.45, suggesting that the index is approaching oversold territory. An RSI below 30 typically signals that the market is oversold, while a reading above 70 indicates overbought conditions. Therefore, the current RSI suggests some weakness, but not yet an extreme level.

Analysis for Hang Seng Index (Hong Kong) - March 06, 2025

The Hang Seng Index in Hong Kong opened at 23,987.09 and closed at 24,369.71, marking a significant increase of approximately 3.29%, which translates to a rise of 775.5 points from the previous close of 23,594.21. The index's RSI is 71.56, indicating overbought conditions, and there is a slight convergence between MACD (797.94) and its signal line (783.13), suggesting potential for continued upward momentum or possible correction.

Relationship with Key Moving Averages
The Hang Seng Index is trading above its key moving averages, with the current close of 24,369.71 exceeding the 10 EMA of 23,331.77, the 20 EMA of 22,731.99, the 50 EMA of 21,564.54, and the 200 EMA of 19,729.11. This suggests bullish momentum as it maintains levels higher than short-term and long-term averages.
Moving Averages Trend (MACD)
The Hang Seng Index exhibits a positive MACD value of 797.94, which is above the MACD Signal line of 783.13, suggesting bullish momentum. This indicates potential upward movement as the market demonstrates strong buying interest.

RSI Analysis
The RSI for Hang Seng Index (Hong Kong) is 71.56, indicating that the index is in the overbought territory. This suggests that the index may be due for a correction or a pullback in the near term.

Analysis for IBEX 35 (Spain) - March 06, 2025

IBEX 35 (Spain) opened at 13,276.10 and closed at 13,162.20, with a decline of -0.39% or 51.80 points compared to the previous close of 13,214.00. The day's trading saw a high of 13,319.00 and a low of 13,124.70, with a traded volume of 48,670,924. The RSI stood at 60.59, indicating a moderately strong momentum.

Relationship with Key Moving Averages
The IBEX 35 closed at 13162.20, slightly below its 10-day EMA of 13153.77 and above both its 50-day EMA of 12564.57 and 200-day EMA of 11712.95. This indicates short-term weakness but maintained longer-term uptrend support.
Moving Averages Trend (MACD)
The IBEX 35 (Spain) is showing a MACD of 237.68, which is below the MACD Signal of 265.09. This indicates a potential bearish signal, suggesting that the recent trend might be losing strength.

RSI Analysis
The RSI for IBEX 35 (Spain) is at 60.59, suggesting a neutral to slightly overbought condition. This level indicates that the index is neither in an overbought nor oversold zone, but closer monitoring is needed for potential overbought conditions.

Analysis for NASDAQ Composite (US) - March 06, 2025

The NASDAQ Composite (US) opened at 18,312.97 and closed at 18,552.73 on the latest trading day, showing a positive performance with a point change of 267.57 and a percentage increase of 1.46%. Despite closing higher than the previous close of 18,285.16, the index remains below its 50-day, 20-day, and 10-day EMAs, and the RSI indicates oversold conditions with a value of 37.35. The MACD is negative, suggesting potential bearish momentum in the near term.

Relationship with Key Moving Averages
The closing price of NASDAQ Composite at 18552.73 is below its 50-EMA at 19342.35 and 20-EMA at 19164.02, indicating a bearish trend. However, it is slightly above the 200-EMA at 18328.17 and 10-EMA at 18863.25.
Moving Averages Trend (MACD)
Based on the stock data for NASDAQ Composite, the MACD value of -305.26, which is below the MACD Signal of -160.06, suggests a bearish trend. This indicates potential downward momentum in the short term, as the MACD line is positioned lower than the signal line.

RSI Analysis
The RSI for NASDAQ Composite is 37.35, indicating that it is in the lower range, potentially reflecting oversold conditions. Typically, an RSI below 30 suggests that the index might be undervalued or experiencing strong selling pressure.

Analysis for Nikkei 225 (Japan) - March 06, 2025

Nikkei 225 (Japan) opened at 37,654.95 and closed at 37,704.93, marking a positive session with a 0.77% increase from the previous close. Despite this daily gain, the index is trading below key moving averages, with an RSI of 40.9 suggesting mild bearish momentum. The MACD is in negative territory, further indicating downward pressure.

Relationship with Key Moving Averages
Nikkei 225 closed below its 10 EMA, 20 EMA, 50 EMA, and 200 EMA, indicating a bearish trend with the current levels unable to cross key moving averages. The RSI is at 40.90, showing weak momentum in the current market conditions.
Moving Averages Trend (MACD)
Nikkei 225 (Japan) MACD Analysis: The MACD value of -432.14, lower than the Signal line at -302.89, suggests a bearish momentum in the market. This indicates potential further downside, as the MACD line is below the signal line.

RSI Analysis
The RSI for Nikkei 225 (Japan) is 40.90, indicating it is in the lower range which might suggest that the market is approaching an oversold condition. If RSI moves below 30, it could signal an even more oversold condition, potentially leading to a buying opportunity if current trends signal a market reversal.

Analysis for Nifty Bank - March 06, 2025
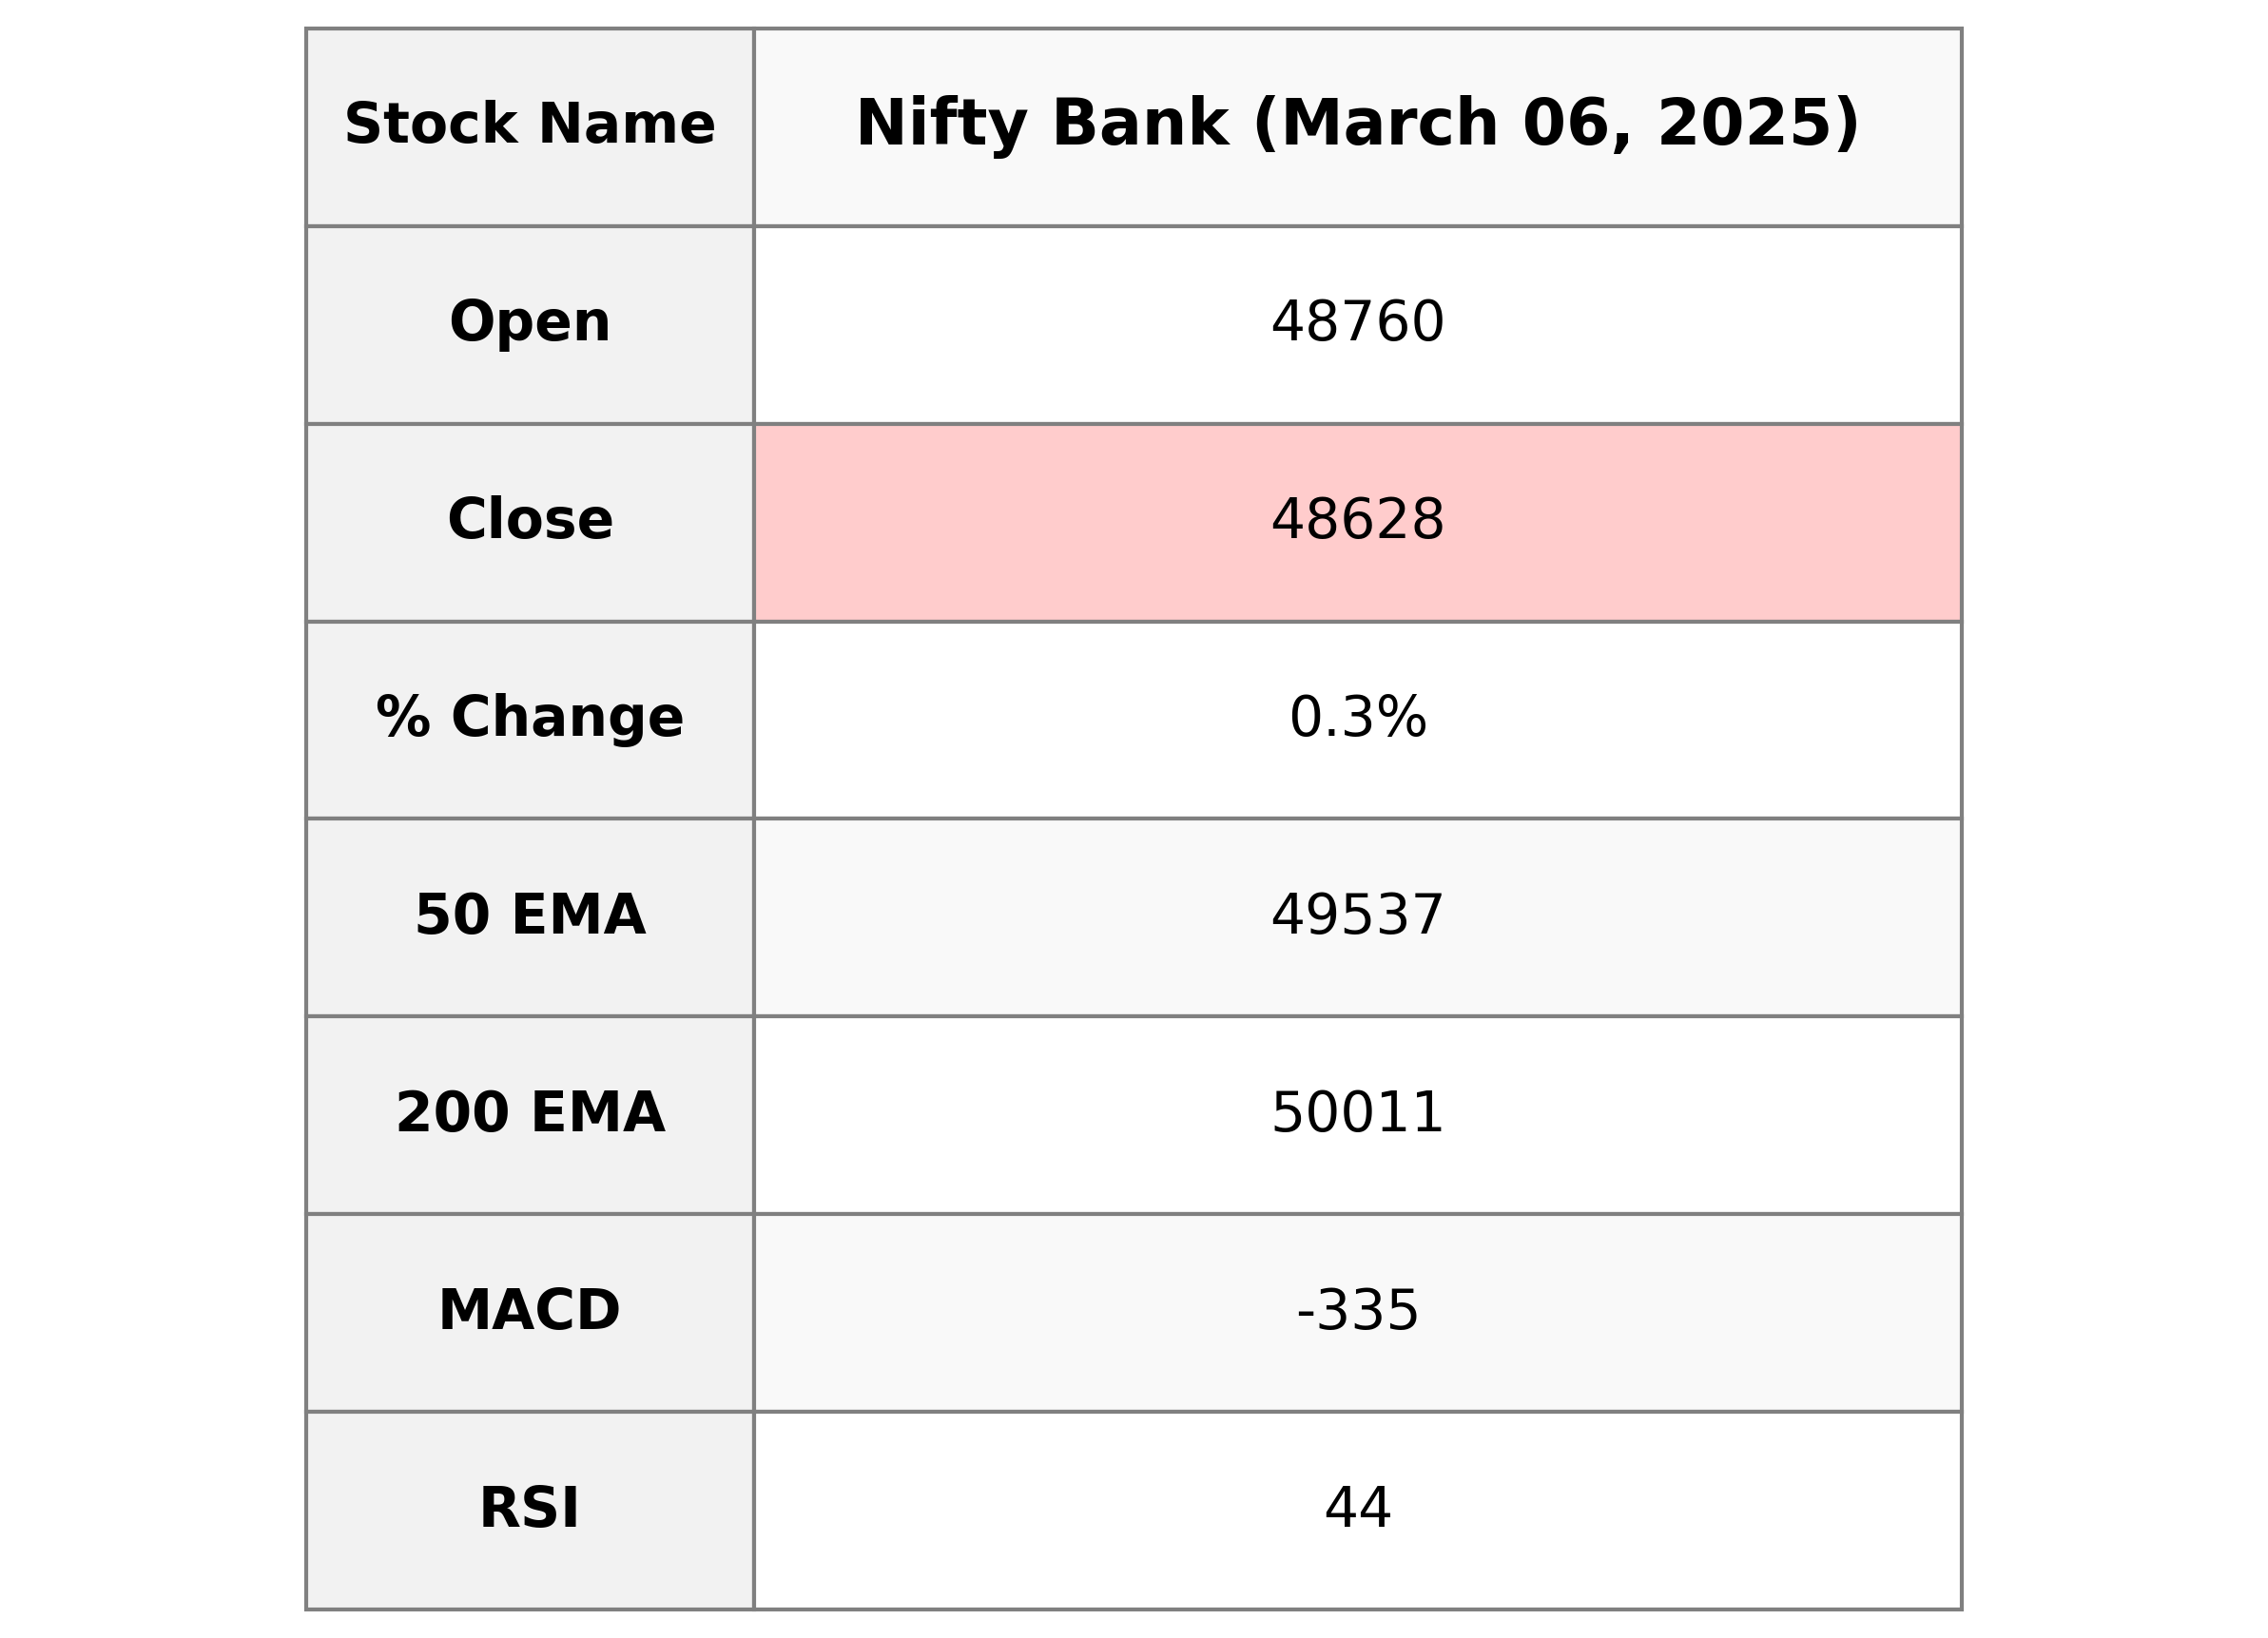
Nifty Bank opened at 48760.0 and closed at 48627.7, showing a modest percentage change of 0.28% with a points increase of 137.75. The RSI is 43.97, indicating a neutral sentiment, while the MACD is negative, suggesting a bearish trend. The stock's 50 EMA and 200 EMA are above the current price, highlighting potential resistance levels.

Relationship with Key Moving Averages
Nifty Bank closed below its 50-day and 200-day EMA, indicating a bearish trend compared to these moving averages. The closing price of 48,627.70 is roughly in line with the 10-day EMA, suggesting a short-term support level, while the 20-day EMA is slightly higher, reinforcing the resistance in the medium term.
Moving Averages Trend (MACD)
The MACD analysis for Nifty Bank indicates a bearish trend, as the MACD value (-334.82) is below the MACD Signal line (-291.24). This suggests downward momentum in the stock's price movement. Additionally, the RSI value of 43.97 suggests the stock is nearing oversold conditions, which could potentially lead to a reversal.

RSI Analysis
The Relative Strength Index (RSI) for Nifty Bank is currently at 43.97, indicating a moderately weak momentum. An RSI below 50 typically suggests declining price strength, positioning the stock closer to an oversold condition, which might attract potential buyers if the trend continues.

Analysis for Nifty 50 - March 06, 2025

The Nifty 50 opened at 22,476.35 and closed at 22,544.70, marking an increase from the previous close of 22,337.30. This represents a percentage change of approximately 0.93% and a points change of 207.40. The RSI indicates a value of 41.59, suggesting that the index is not in overbought or oversold territory.

Relationship with Key Moving Averages
The Nifty 50 closed at 22544.70, which is below both its 50-day EMA of 23142.45 and its 200-day EMA of 23471.70, indicating a bearish trend. The 10-day EMA at 22474.61 suggests near-term support, while the 20-day EMA at 22700.81 serves as immediate resistance.
Moving Averages Trend (MACD)
The MACD for Nifty 50 is negative at -284.25, indicating a bearish trend since it is below both the signal line of -253.43 and zero. This suggests that the momentum is in favor of sellers, and there might be continued downward pressure on the index.

RSI Analysis
Nifty 50's current RSI value is 41.59, indicating that the index is neither in overbought nor in oversold territory. This suggests a neutral momentum and potential for either upward or downward movement depending on other market conditions.

Up Next
Global stock market indices: How the world markets performed today - 06 March 2025

Honda Activa 6G: Everything You Need to Know Before Buying

How much does a ULIP plan really cost? A break-down of all charges

Centre plans to borrow Rs 8.20 lakh cr from market in first half of FY27

Reliance denies buying Iranian oil amid US sanctions waiver

Premium petrol price up Rs 2, industrial diesel up Rs 22; no change in normal petrol, diesel rates

More videos

India's GDP expected to register over 8 pc growth in Sep-Dec: Report

Govt announces seven measures to help boost exports

RBI keeps interest rates on hold after US trade deal boosts outlook

RBI proposes to compensate customers up to Rs 25,000 loss due to fraud

RBI raises GDP growth projection of Q1, Q2 of FY27

RBI pauses rate cuts, retains interest rate at 5.25 pc

Rupee jumps 122 paise to close at 90.27 against US dollar on India-US trade deal

Stock markets cheer India-US trade deal: Sensex, Nifty surge 2.5 pc

UPI transactions hit record high of Rs 230 lakh crore in 2025-26 till Dec: Govt

Explained: India-US trade deal, tariffs and trade benefits