


- US and European indices maintain short-term bullish momentum
- Asian markets mixed; Hang Seng shows strong upward trend
- Several indices nearing overbought RSI, caution advised
Highlights
Latest news

Samsung Galaxy A57 & A37 Review: Safe Upgrades or Missed Opportunity?

Trust-based governance, Jan Vishwas Bill will decriminalise minor offences, boosts ease of doing business: Piyush Goyal
, Marking a New Era for Inclusive Sport")
India Set to Launch Korfball Premier League (KPL), Marking a New Era for Inclusive Sport

"It belongs to all Dogras": Kathua's Thakur Khajoor Singh after receiving Sahitya Akademi Award

fischer Strengthens Production in Asia: New Production Sites in India and China

Punjab Carbonic Limited Files DRHP With SEBI, NSE and BSE

Cupid Limited Deploys Rs 82.88 crore as Strategic Investment into Baazar Style Retail Limited

Selena Gomez to direct 'Wizards Beyond Waverly Place' finale, series ends this summer
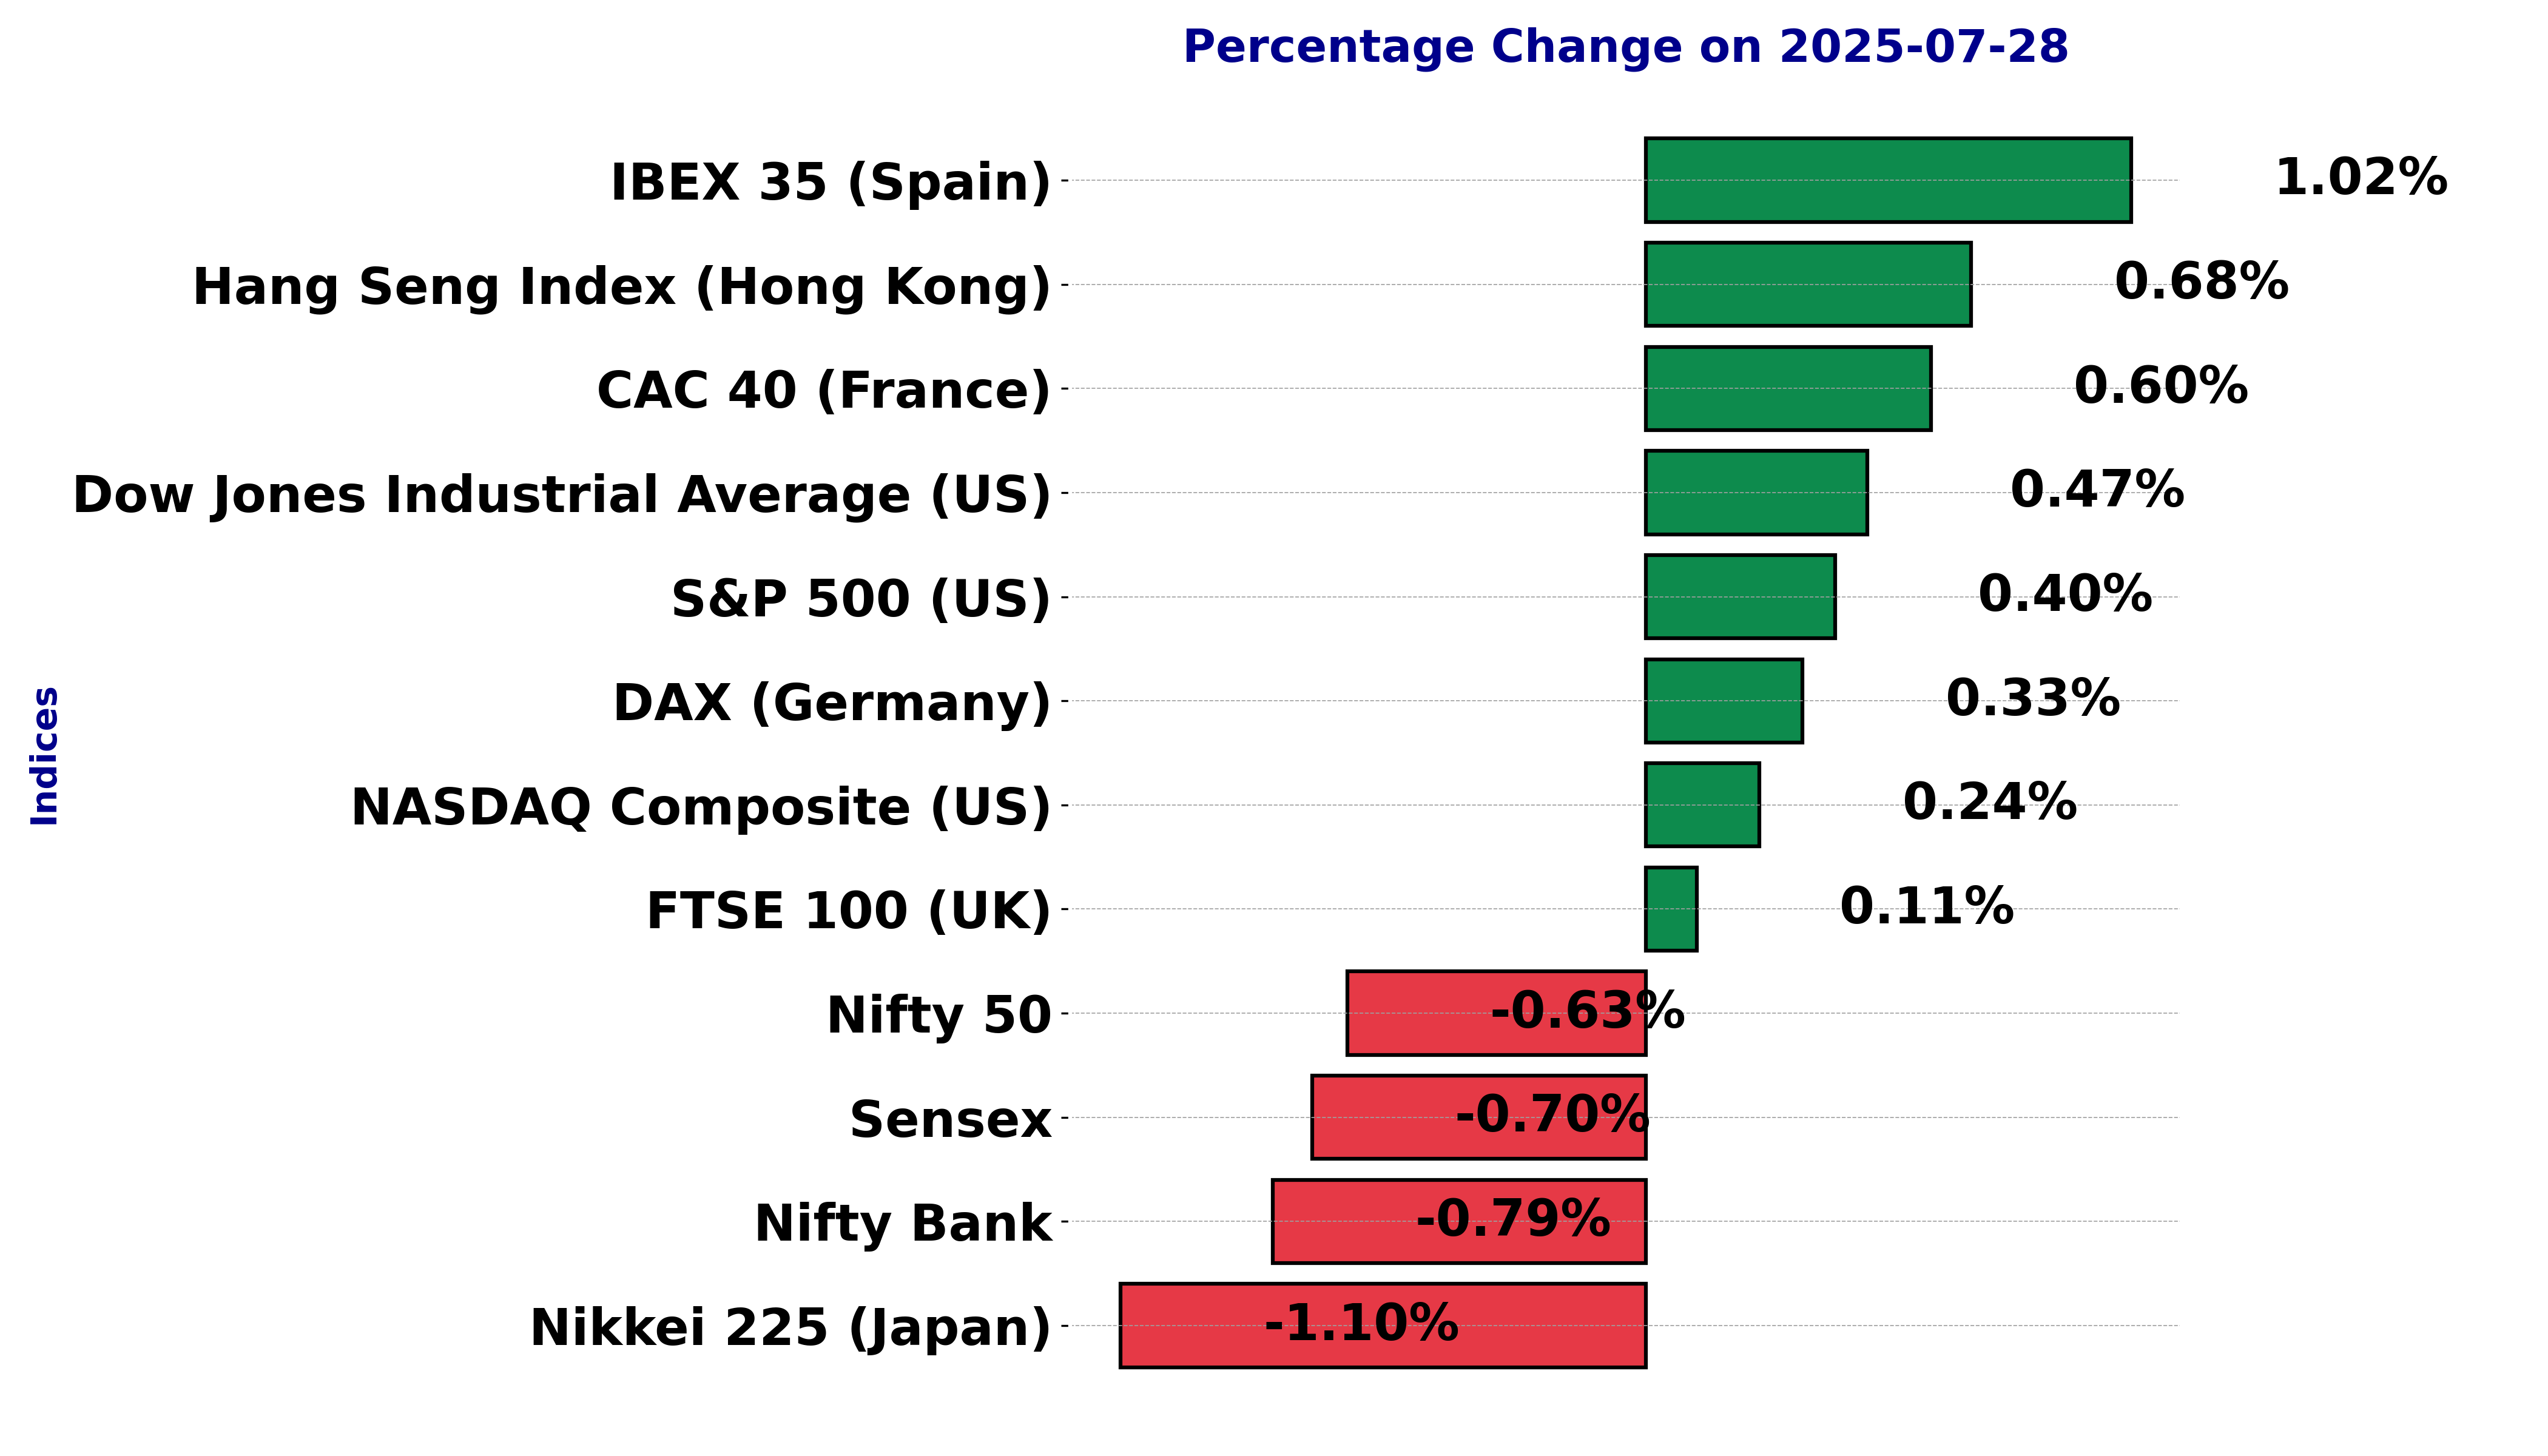
Global stock market indices: How the world markets performed today - 28 July 2025


The international stock market indices showed varied performances on July 28, 2025, reflecting the economic sentiment across different regions.
In this article, we analyze the performance of key global indices including the S&P 500, Dow Jones Industrial Average, NASDAQ Composite, FTSE 100, DAX, CAC 40, IBEX 35, Nikkei 225, Hang Seng, Nifty 50, and BSE Sensex.
Analysis for Sensex - July 28, 2025
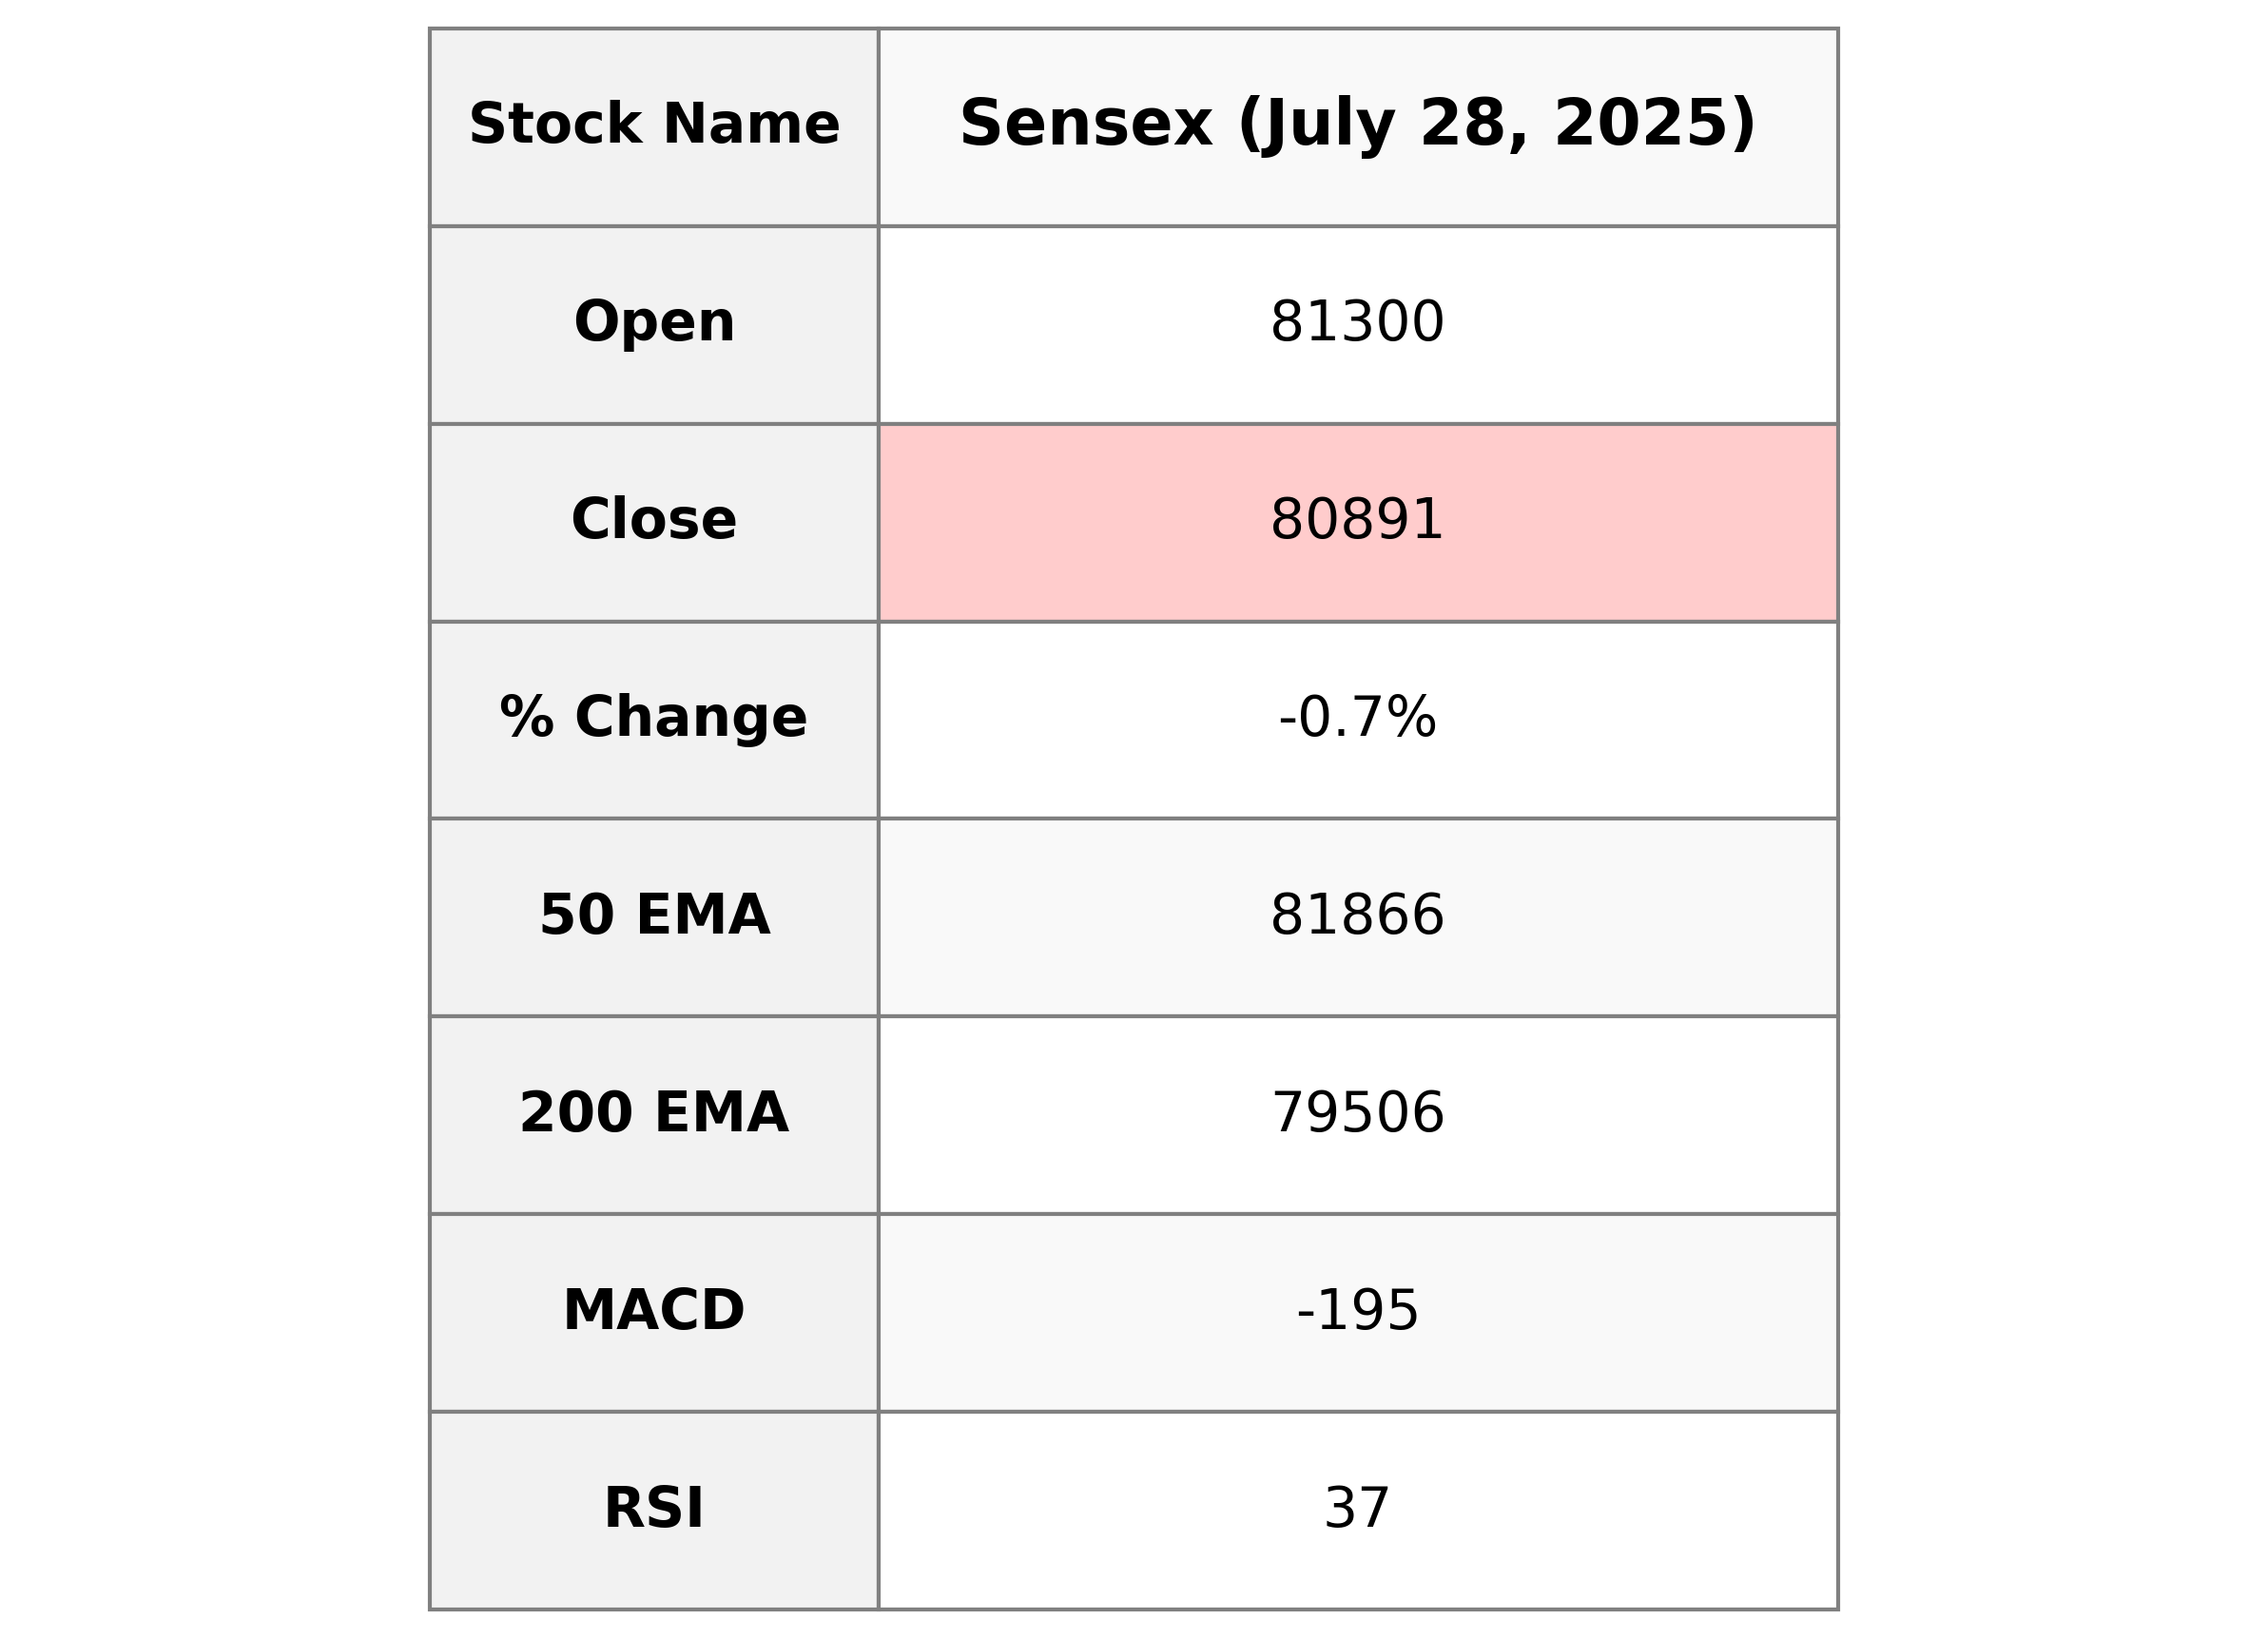
The Sensex closed at 80,891.02, experiencing a decline of 572.07 points or -0.70% from the previous close of 81,463.09. With the Relative Strength Index (RSI) at 36.73, it indicates the market is approaching oversold conditions. The MACD is showing bearish momentum with a value of -195.40 compared to the signal of 34.23.

Relationship with Key Moving Averages
The Sensex closed at 80,891.02, which is below its 50 EMA of 81,866.27, 10 EMA of 82,014.71, and 20 EMA of 82,291.01, indicating a bearish trend as the price is trading under key moving averages. Additionally, the 200 EMA is 79,506.21, which is the only moving average below the current close, suggesting the long-term average is still relatively lower.
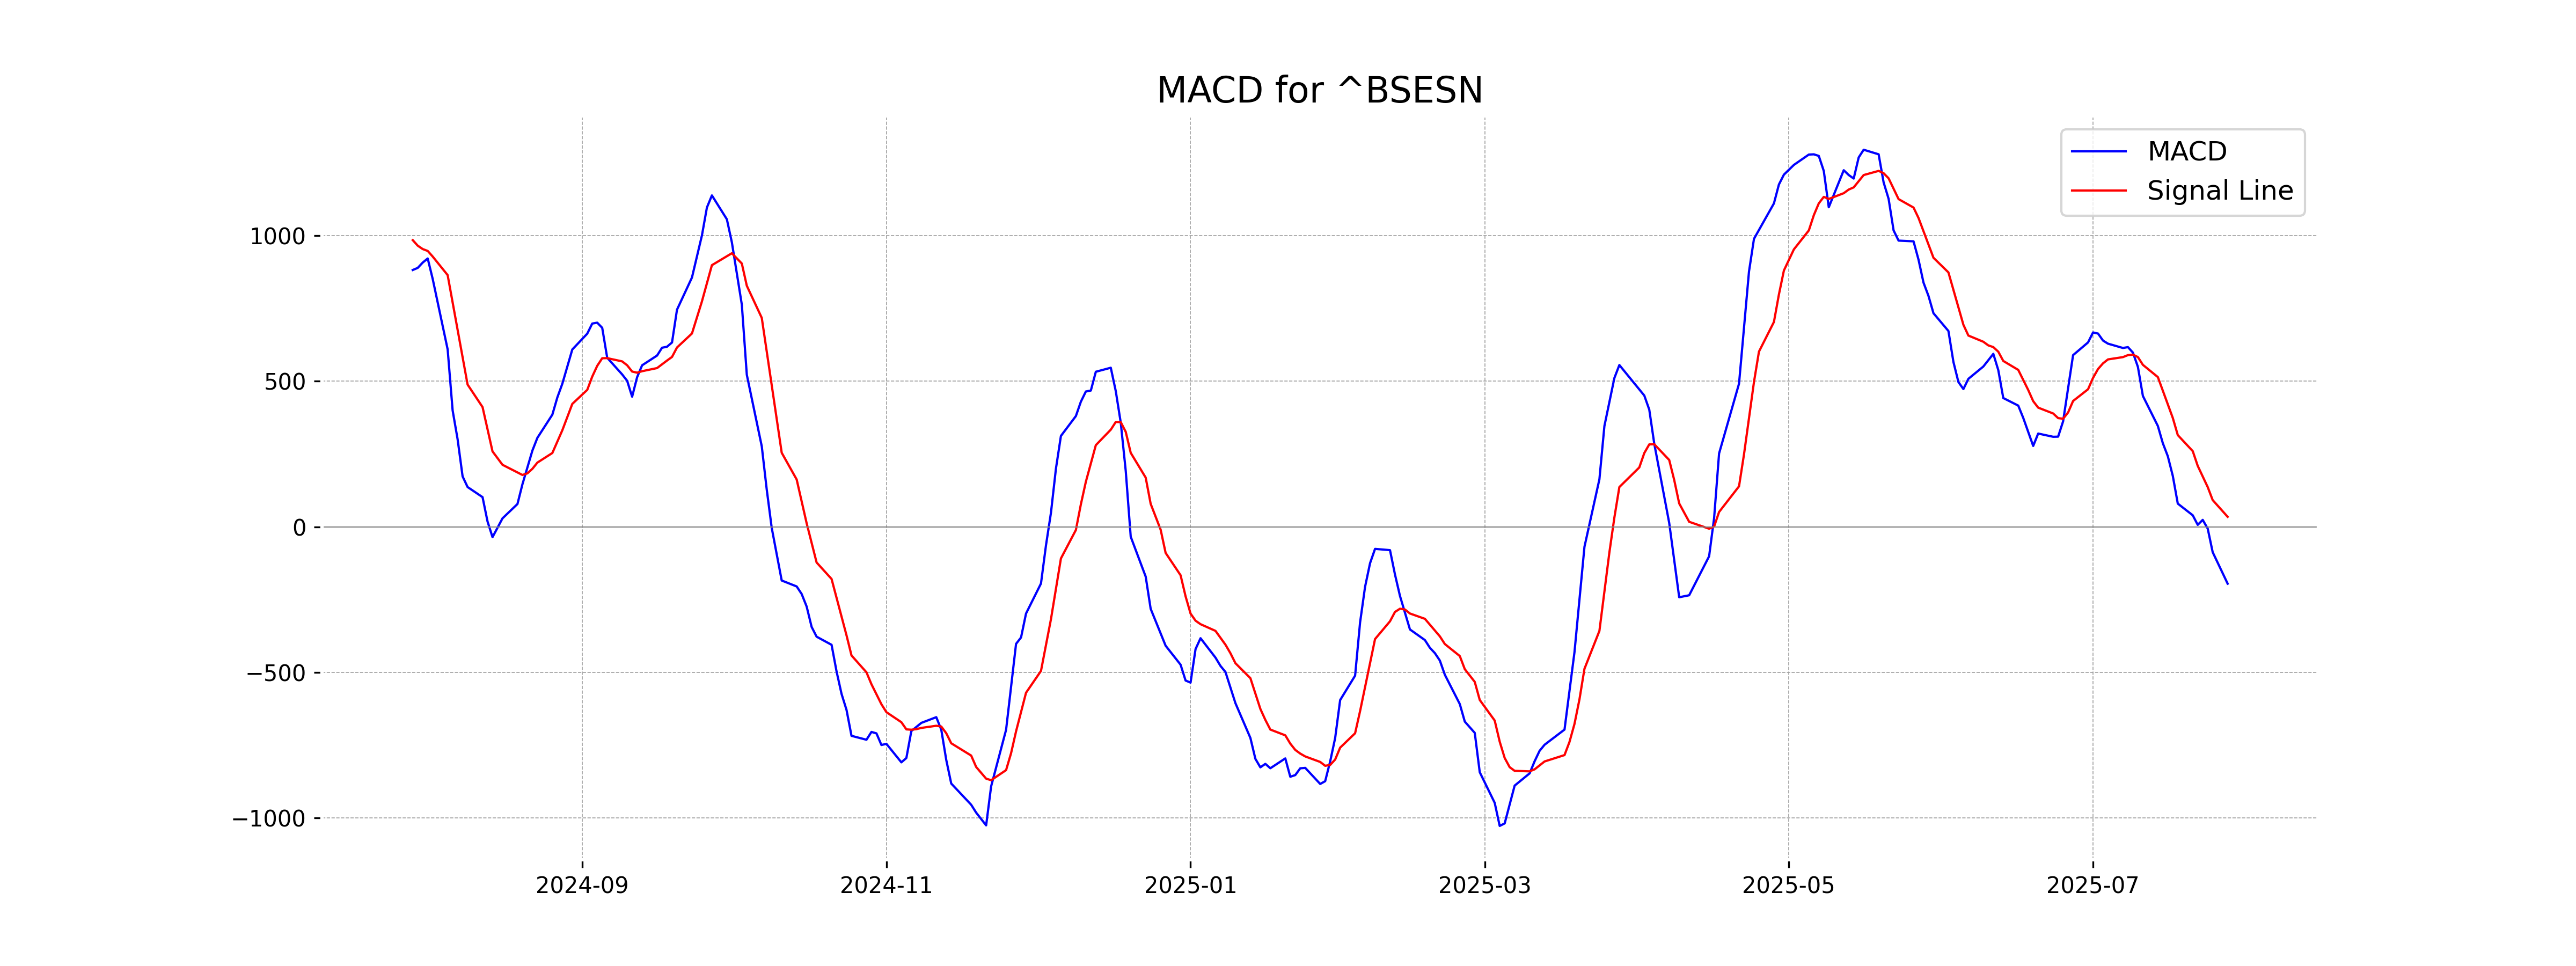
Moving Averages Trend (MACD)
The MACD value for Sensex is -195.40, indicating a bearish trend as it is below the MACD Signal of 34.23. This suggests that the bearish momentum may be strong, given the negative MACD value and RSI at 36.73, which is close to the oversold region.
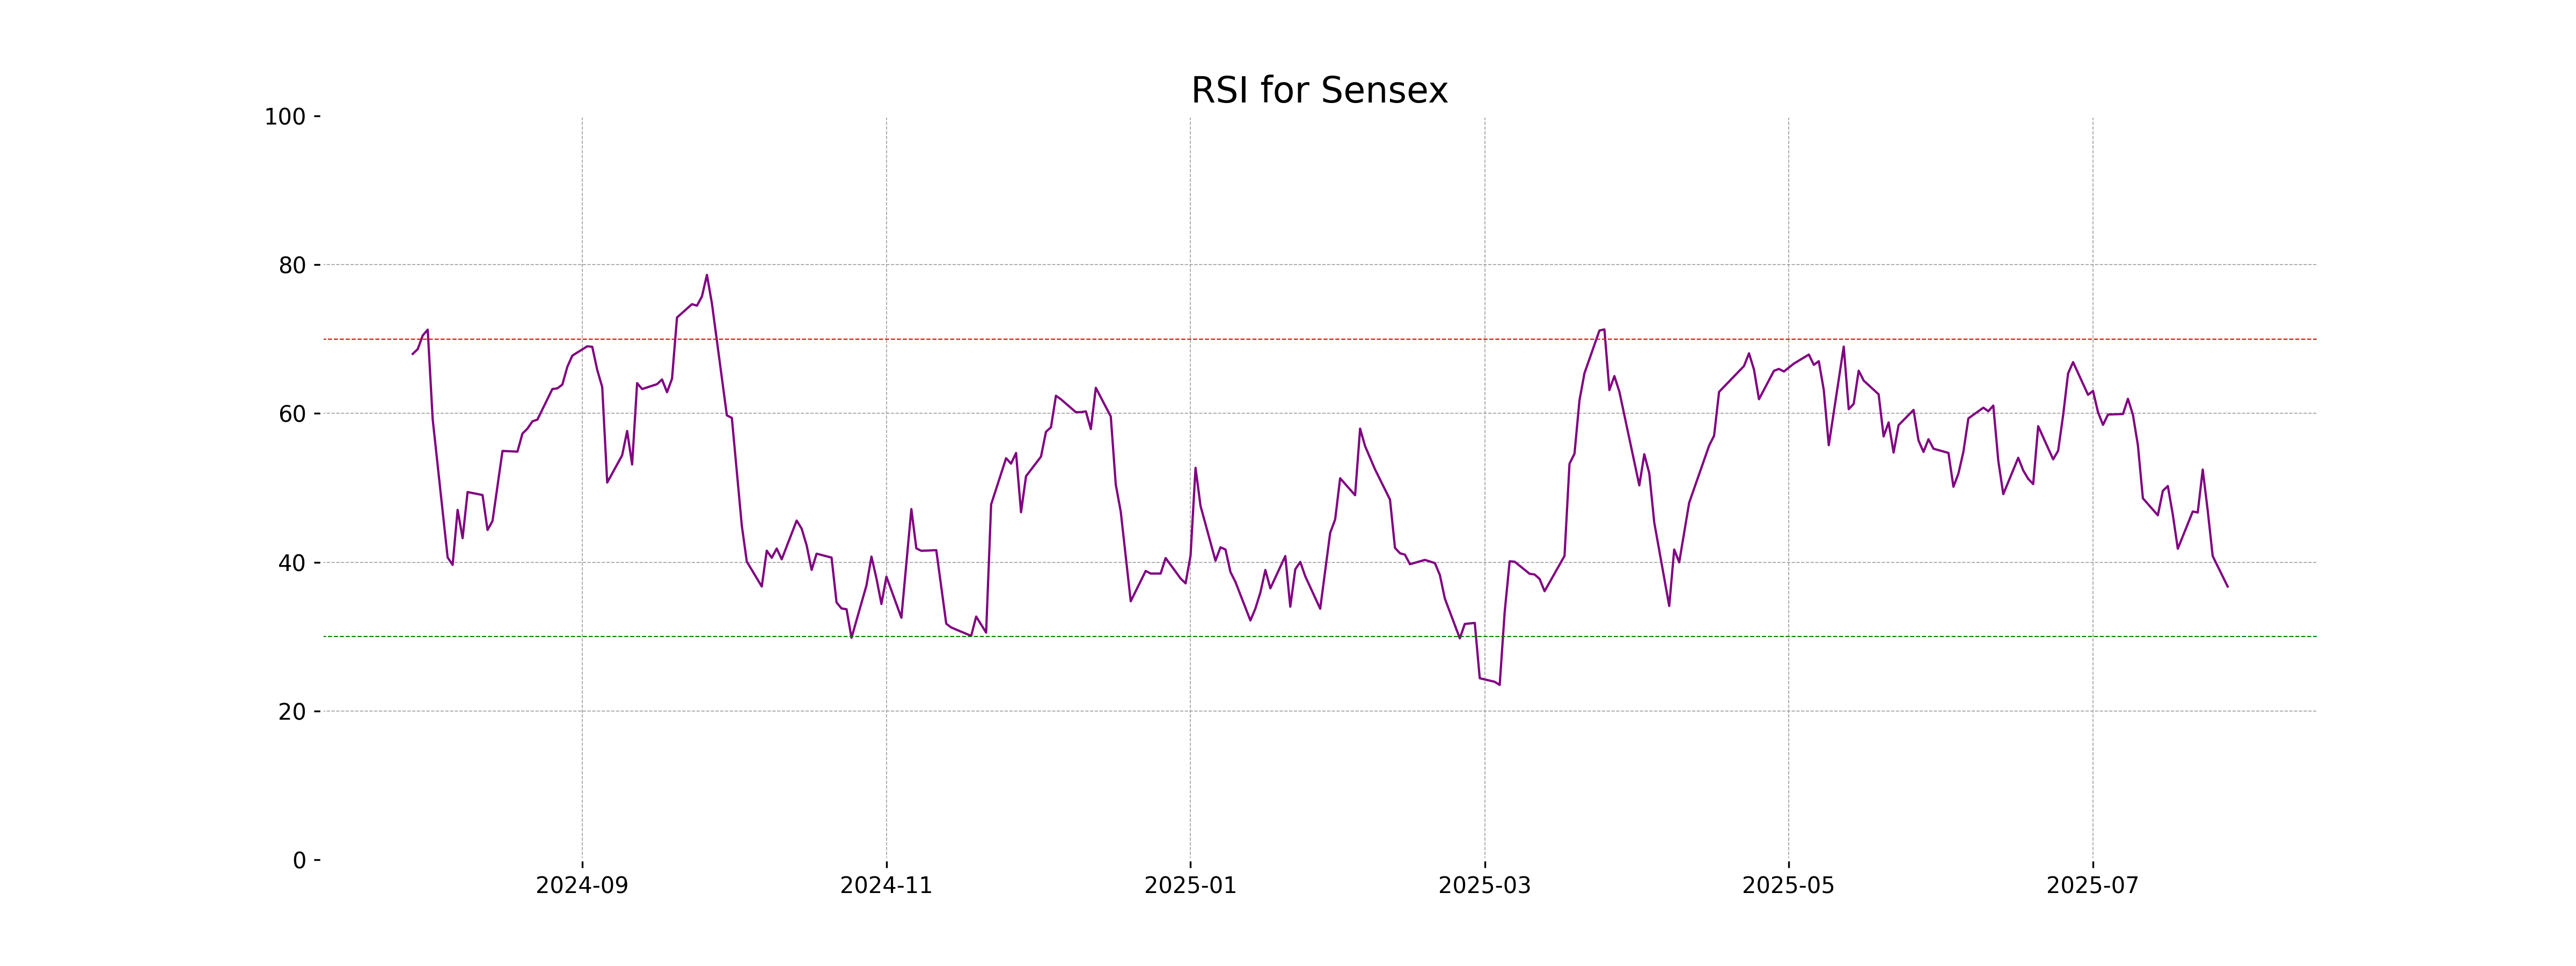
RSI Analysis
RSI Analysis for Sensex: With an RSI of 36.73, the Sensex is approaching the oversold territory, which typically indicates that the market may be undervalued and could be due for an upward correction. It suggests that selling pressure has been strong.
Analysis for Dow Jones Industrial Average (US) - July 28, 2025
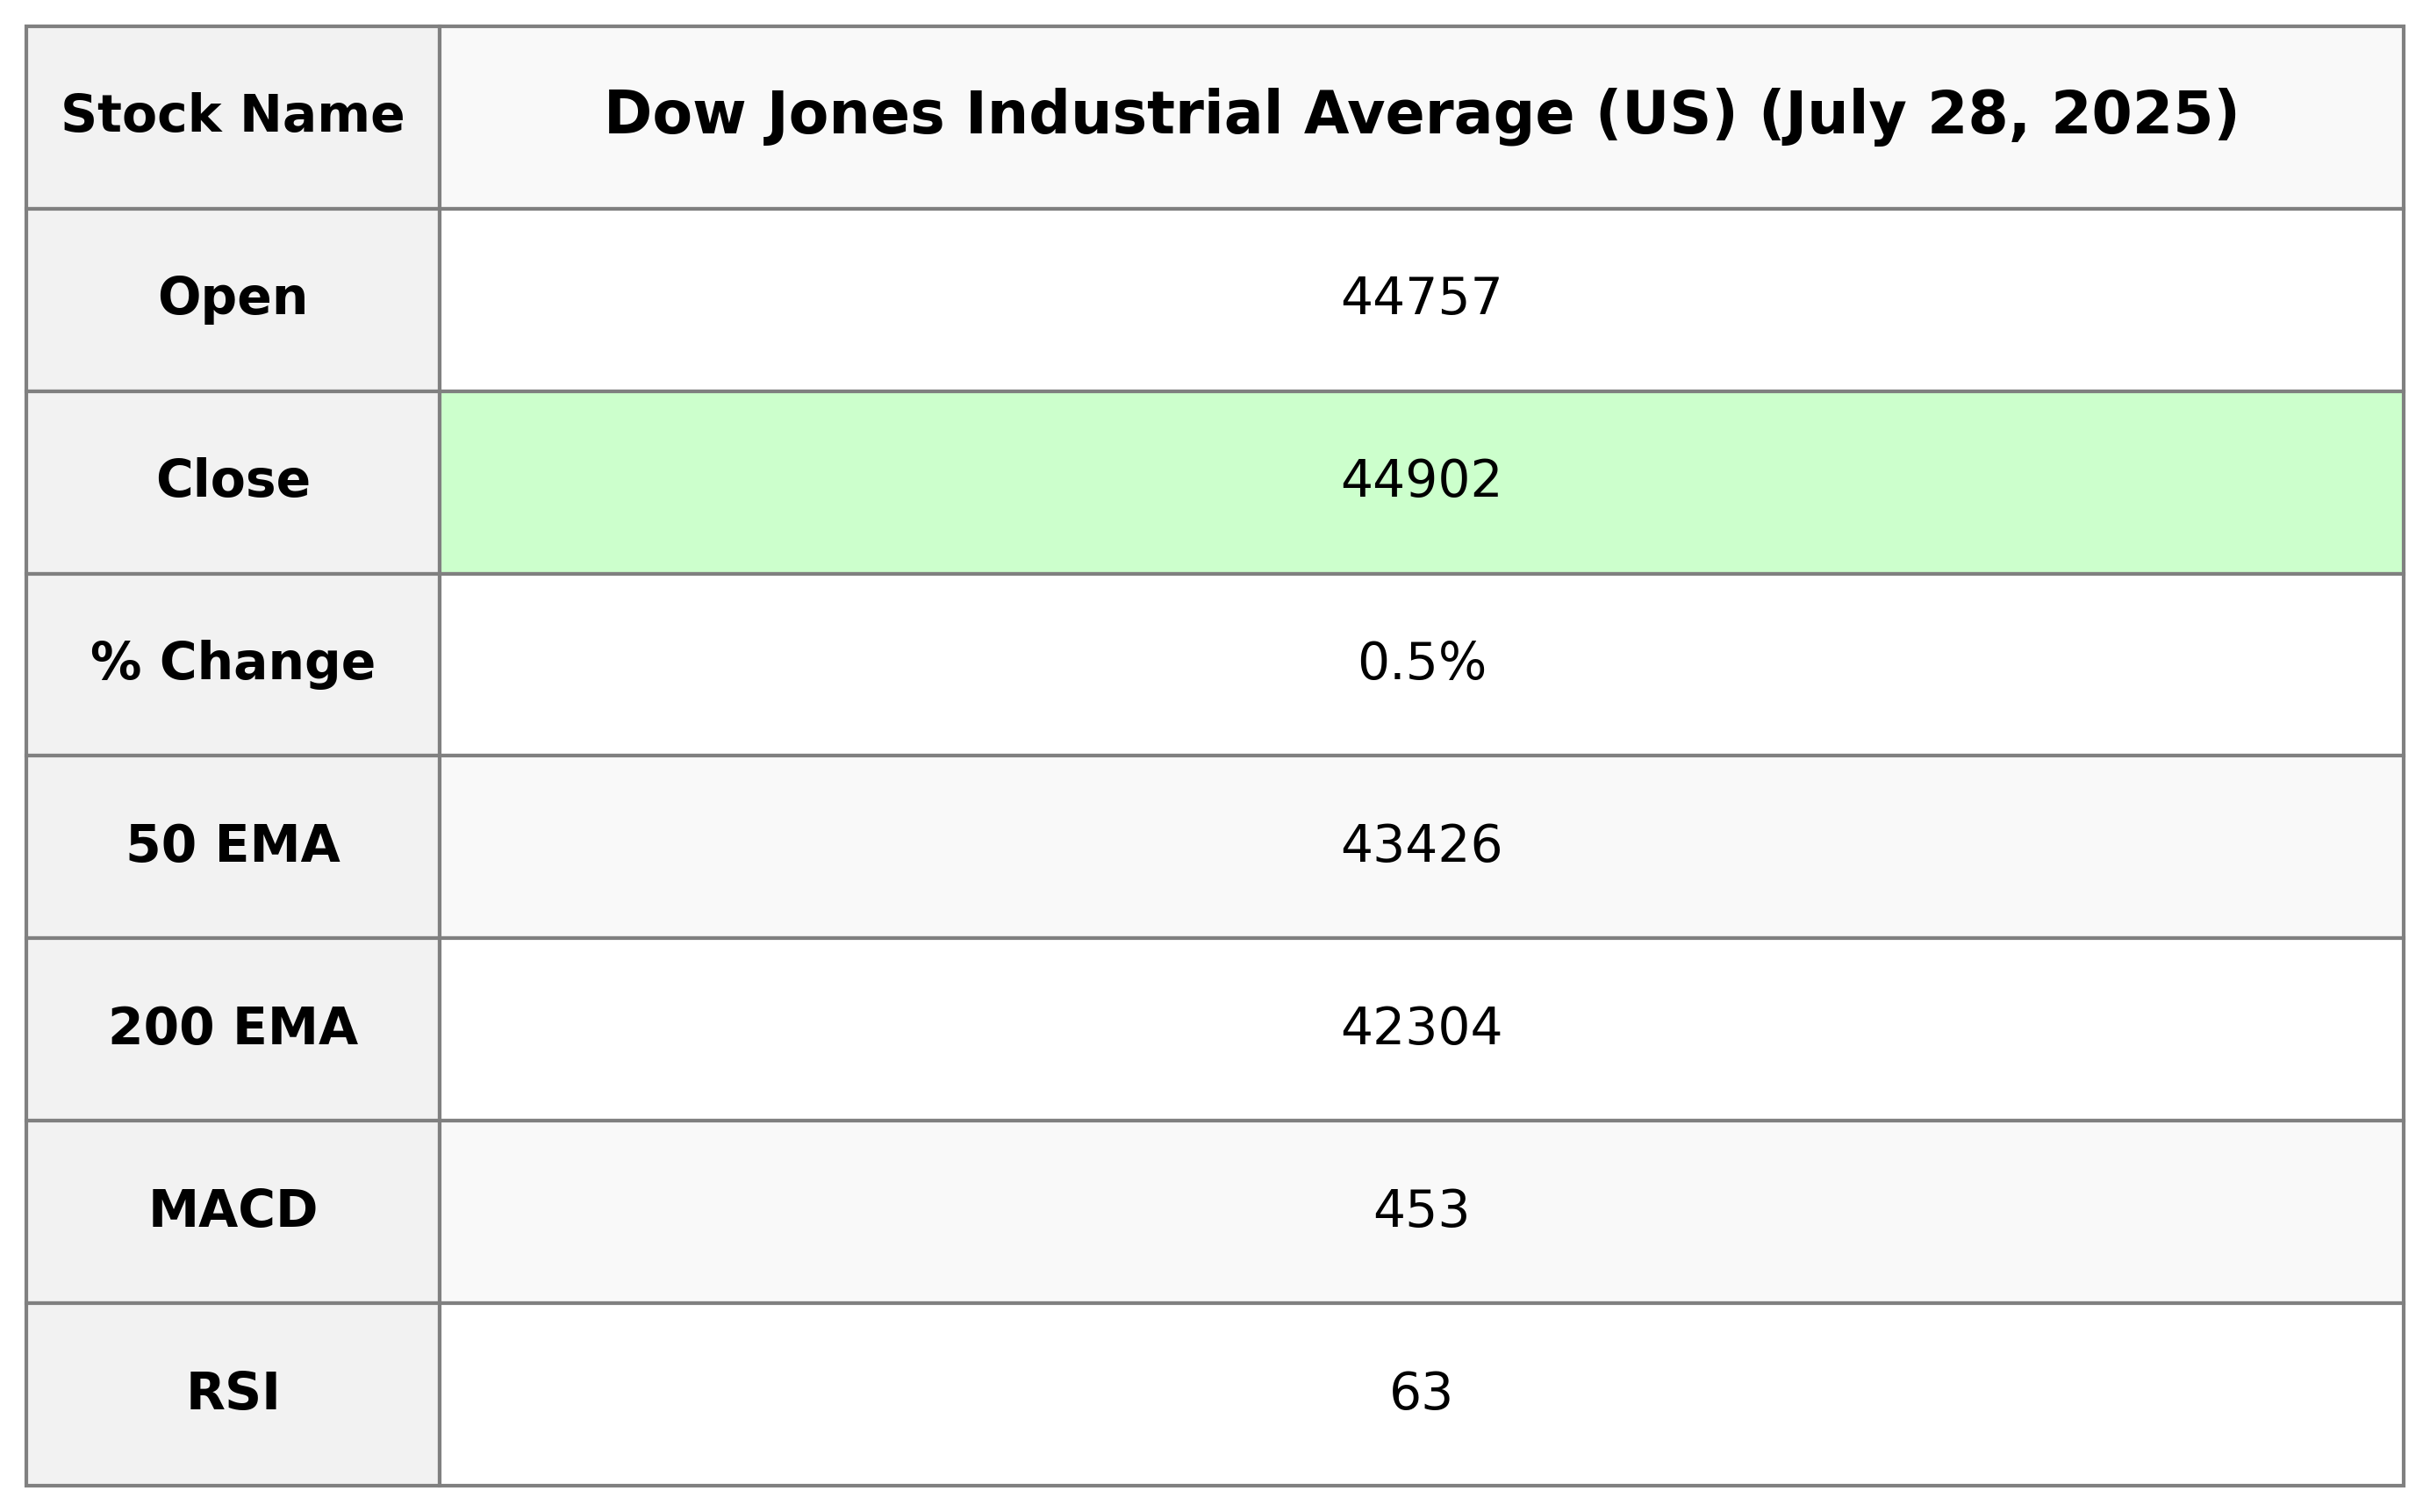
The Dow Jones Industrial Average opened at 44,757.28 and closed at 44,901.92, indicating a positive change of 0.47% with a points gain of 208.01. The RSI of 63.25 suggests the index is nearing overbought territory. Trading volume was 369.5 million, showing active market participation.

Relationship with Key Moving Averages
The Dow Jones Industrial Average is trading above its 50-day EMA of 43,425.84 and 200-day EMA of 42,304.11, indicating a bullish trend. It is also above its 10-day EMA of 44,570.36 and 20-day EMA of 44,257.46, further suggesting that the recent momentum is positive.
Moving Averages Trend (MACD)
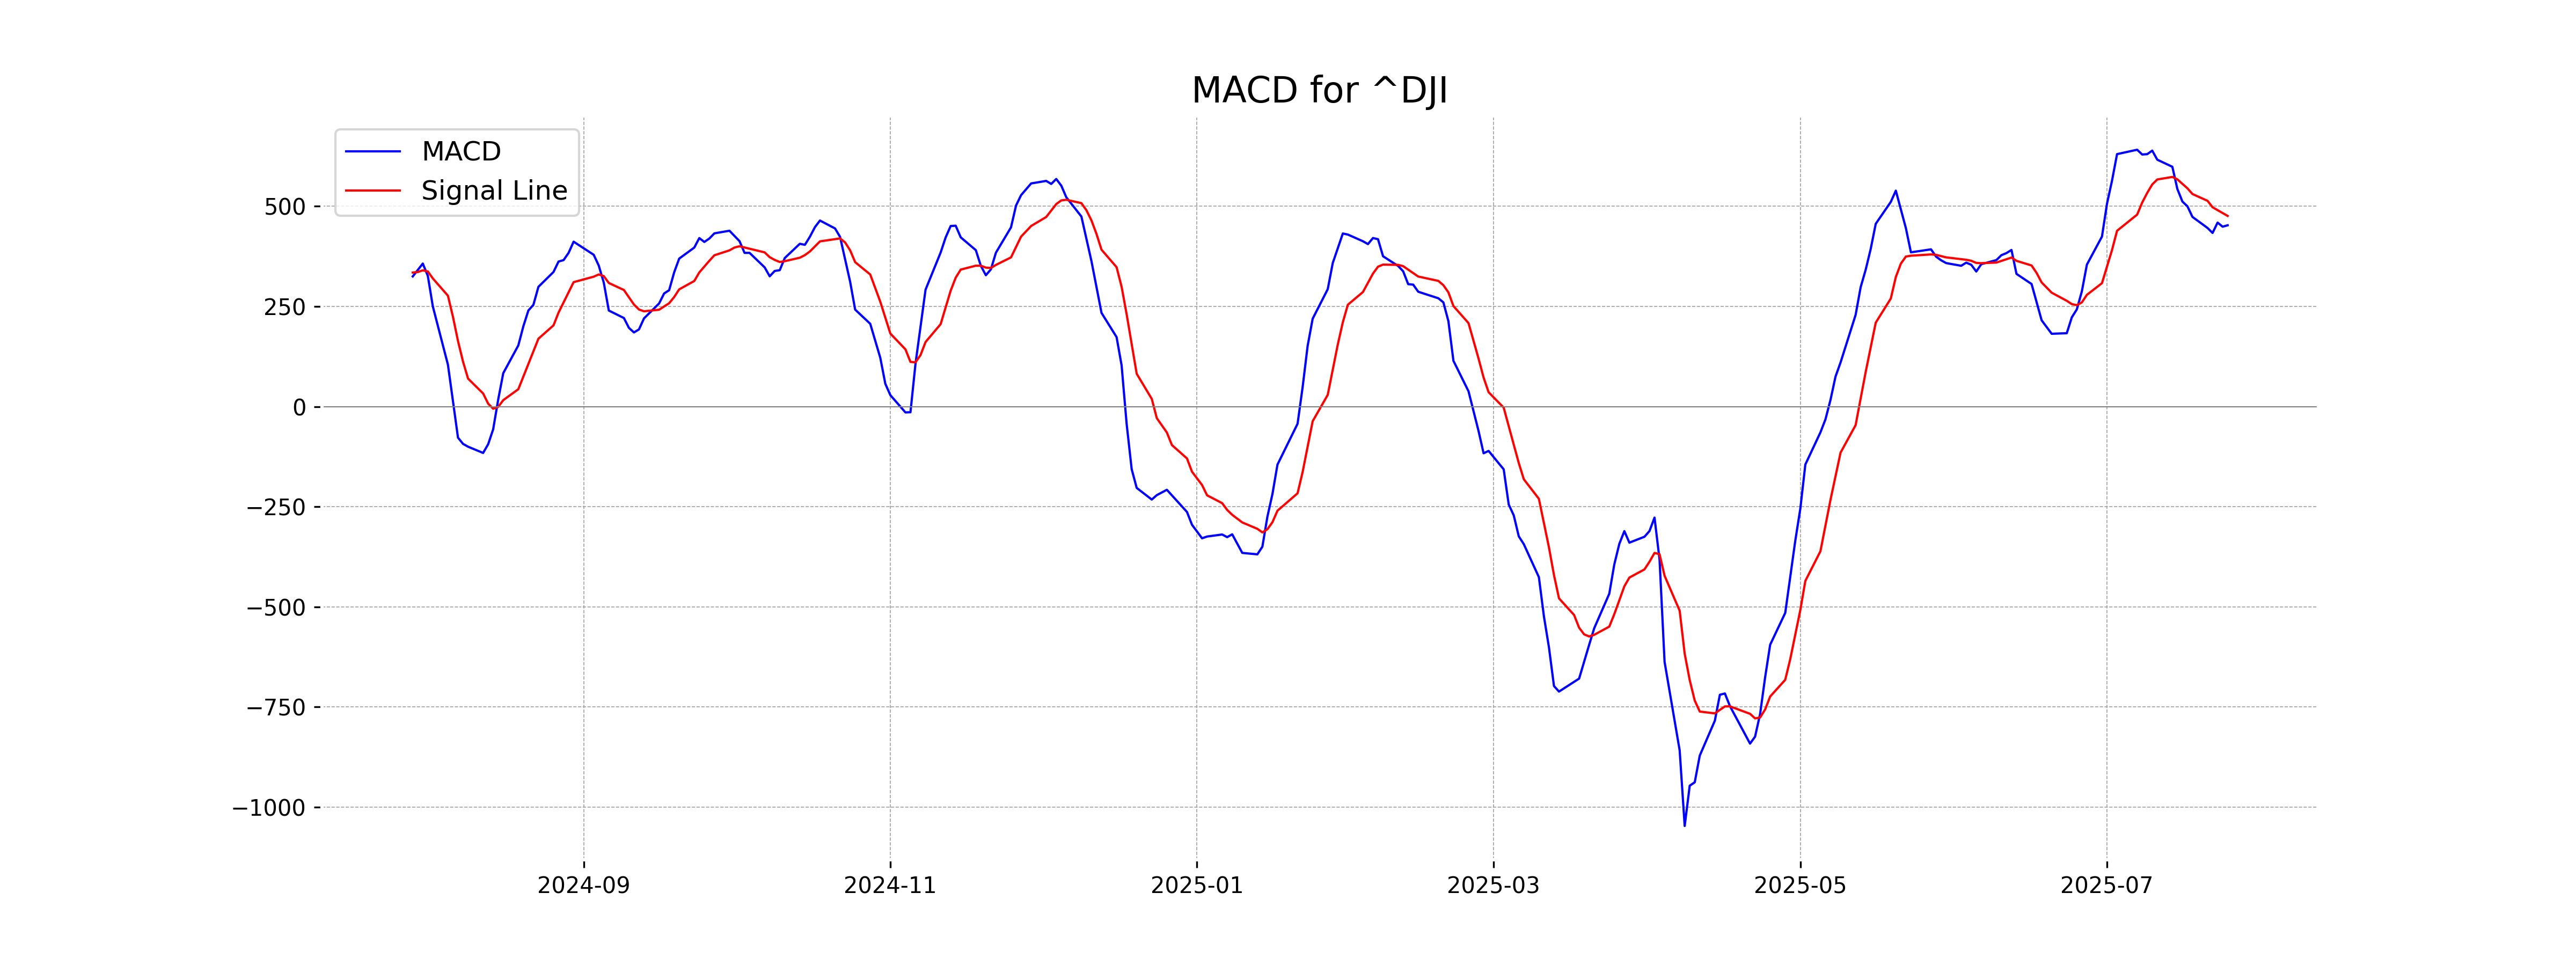
The MACD for the Dow Jones Industrial Average indicates a potential slowing of bullish momentum, as the MACD value of 452.52 is lower than the MACD Signal value of 475.91. This suggests a possible upcoming change in trend, warranting close observation for any further shifts.
RSI Analysis
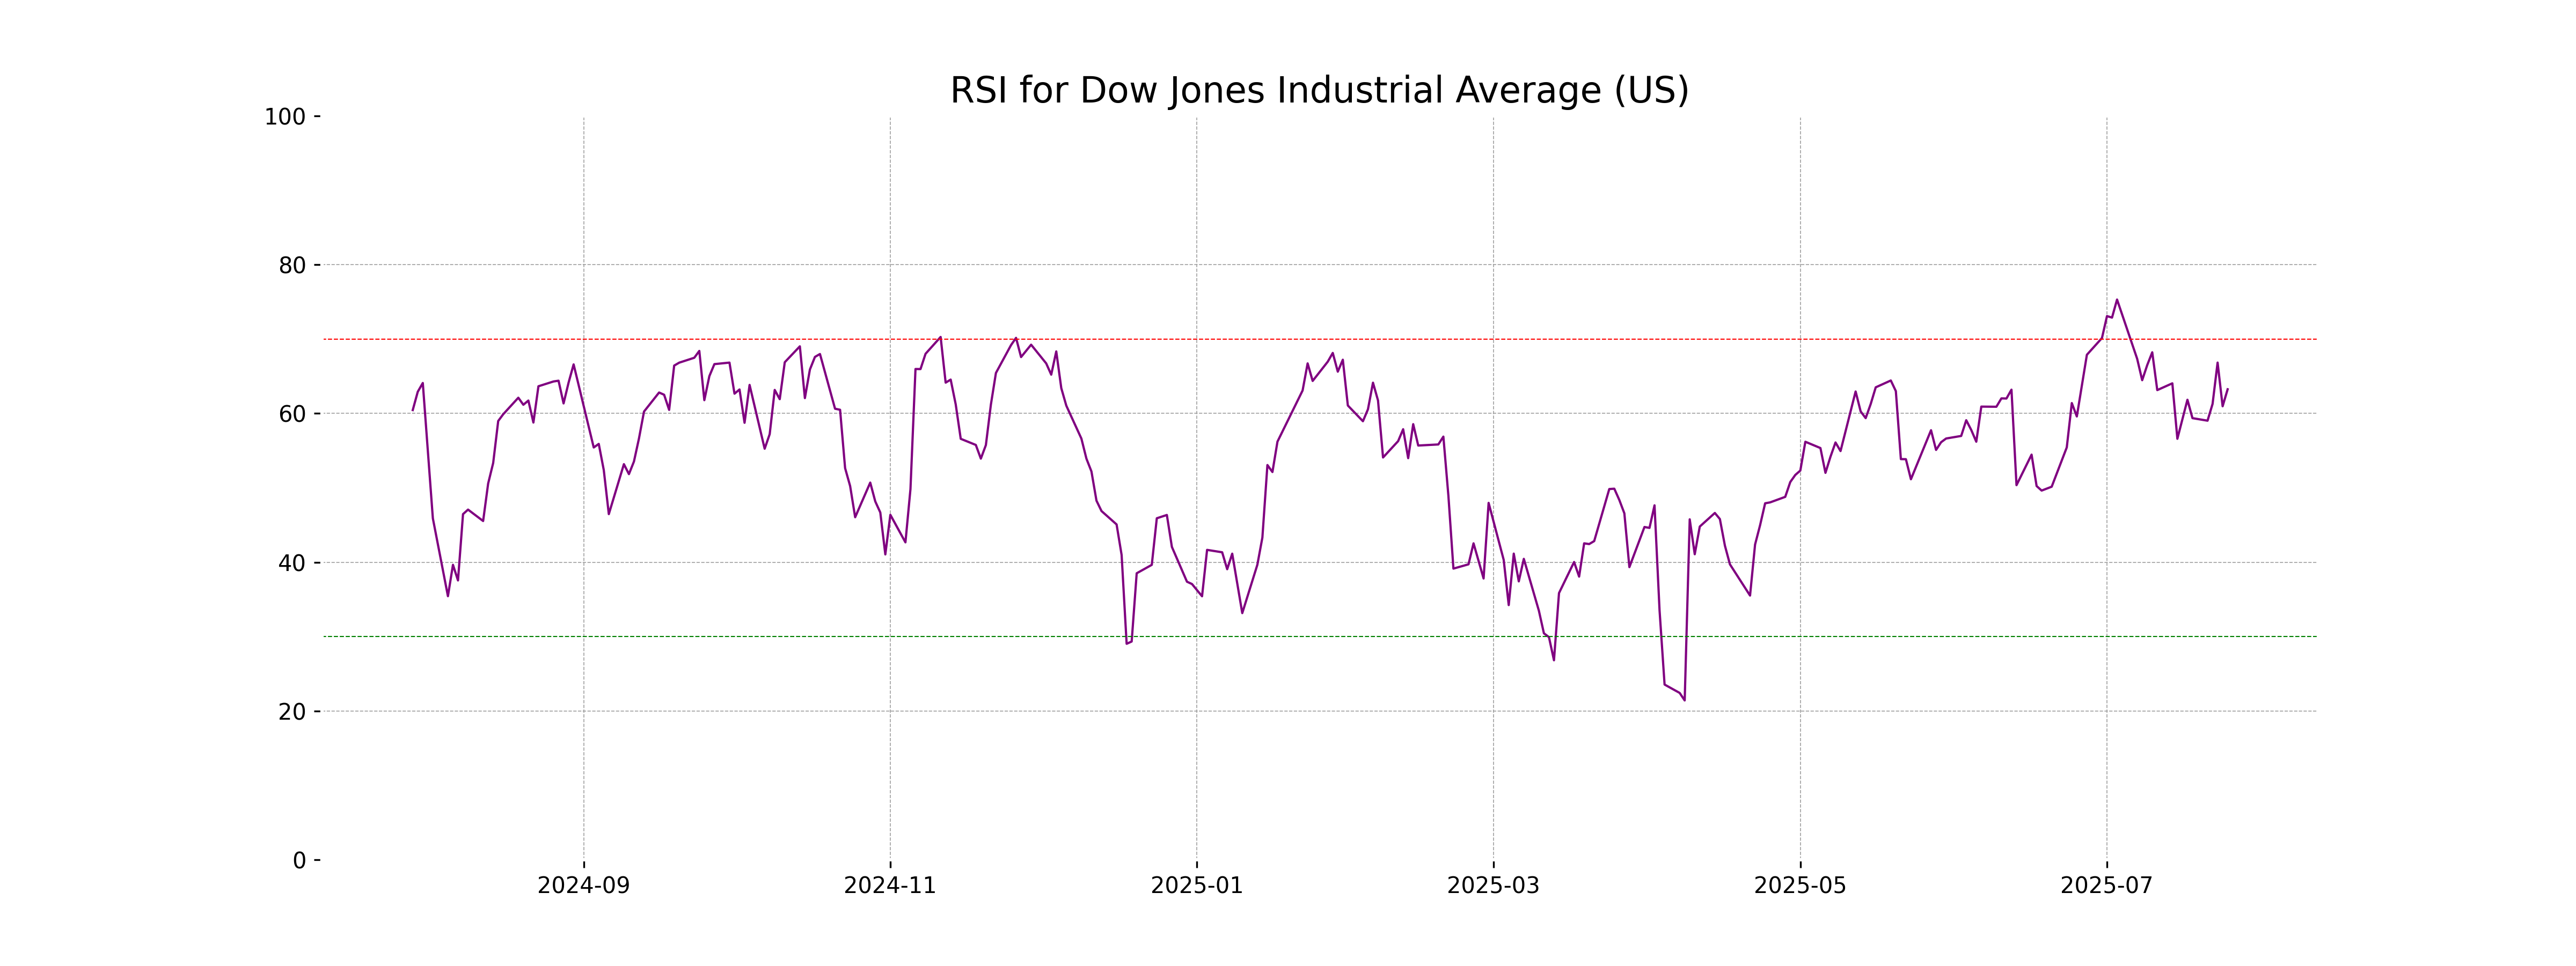
The RSI for the Dow Jones Industrial Average is 63.25, which suggests a moderately strong momentum but not yet in the overbought territory. This indicates a potential continuation of current trends without immediate risk of a reversal.
Analysis for CAC 40 (France) - July 28, 2025
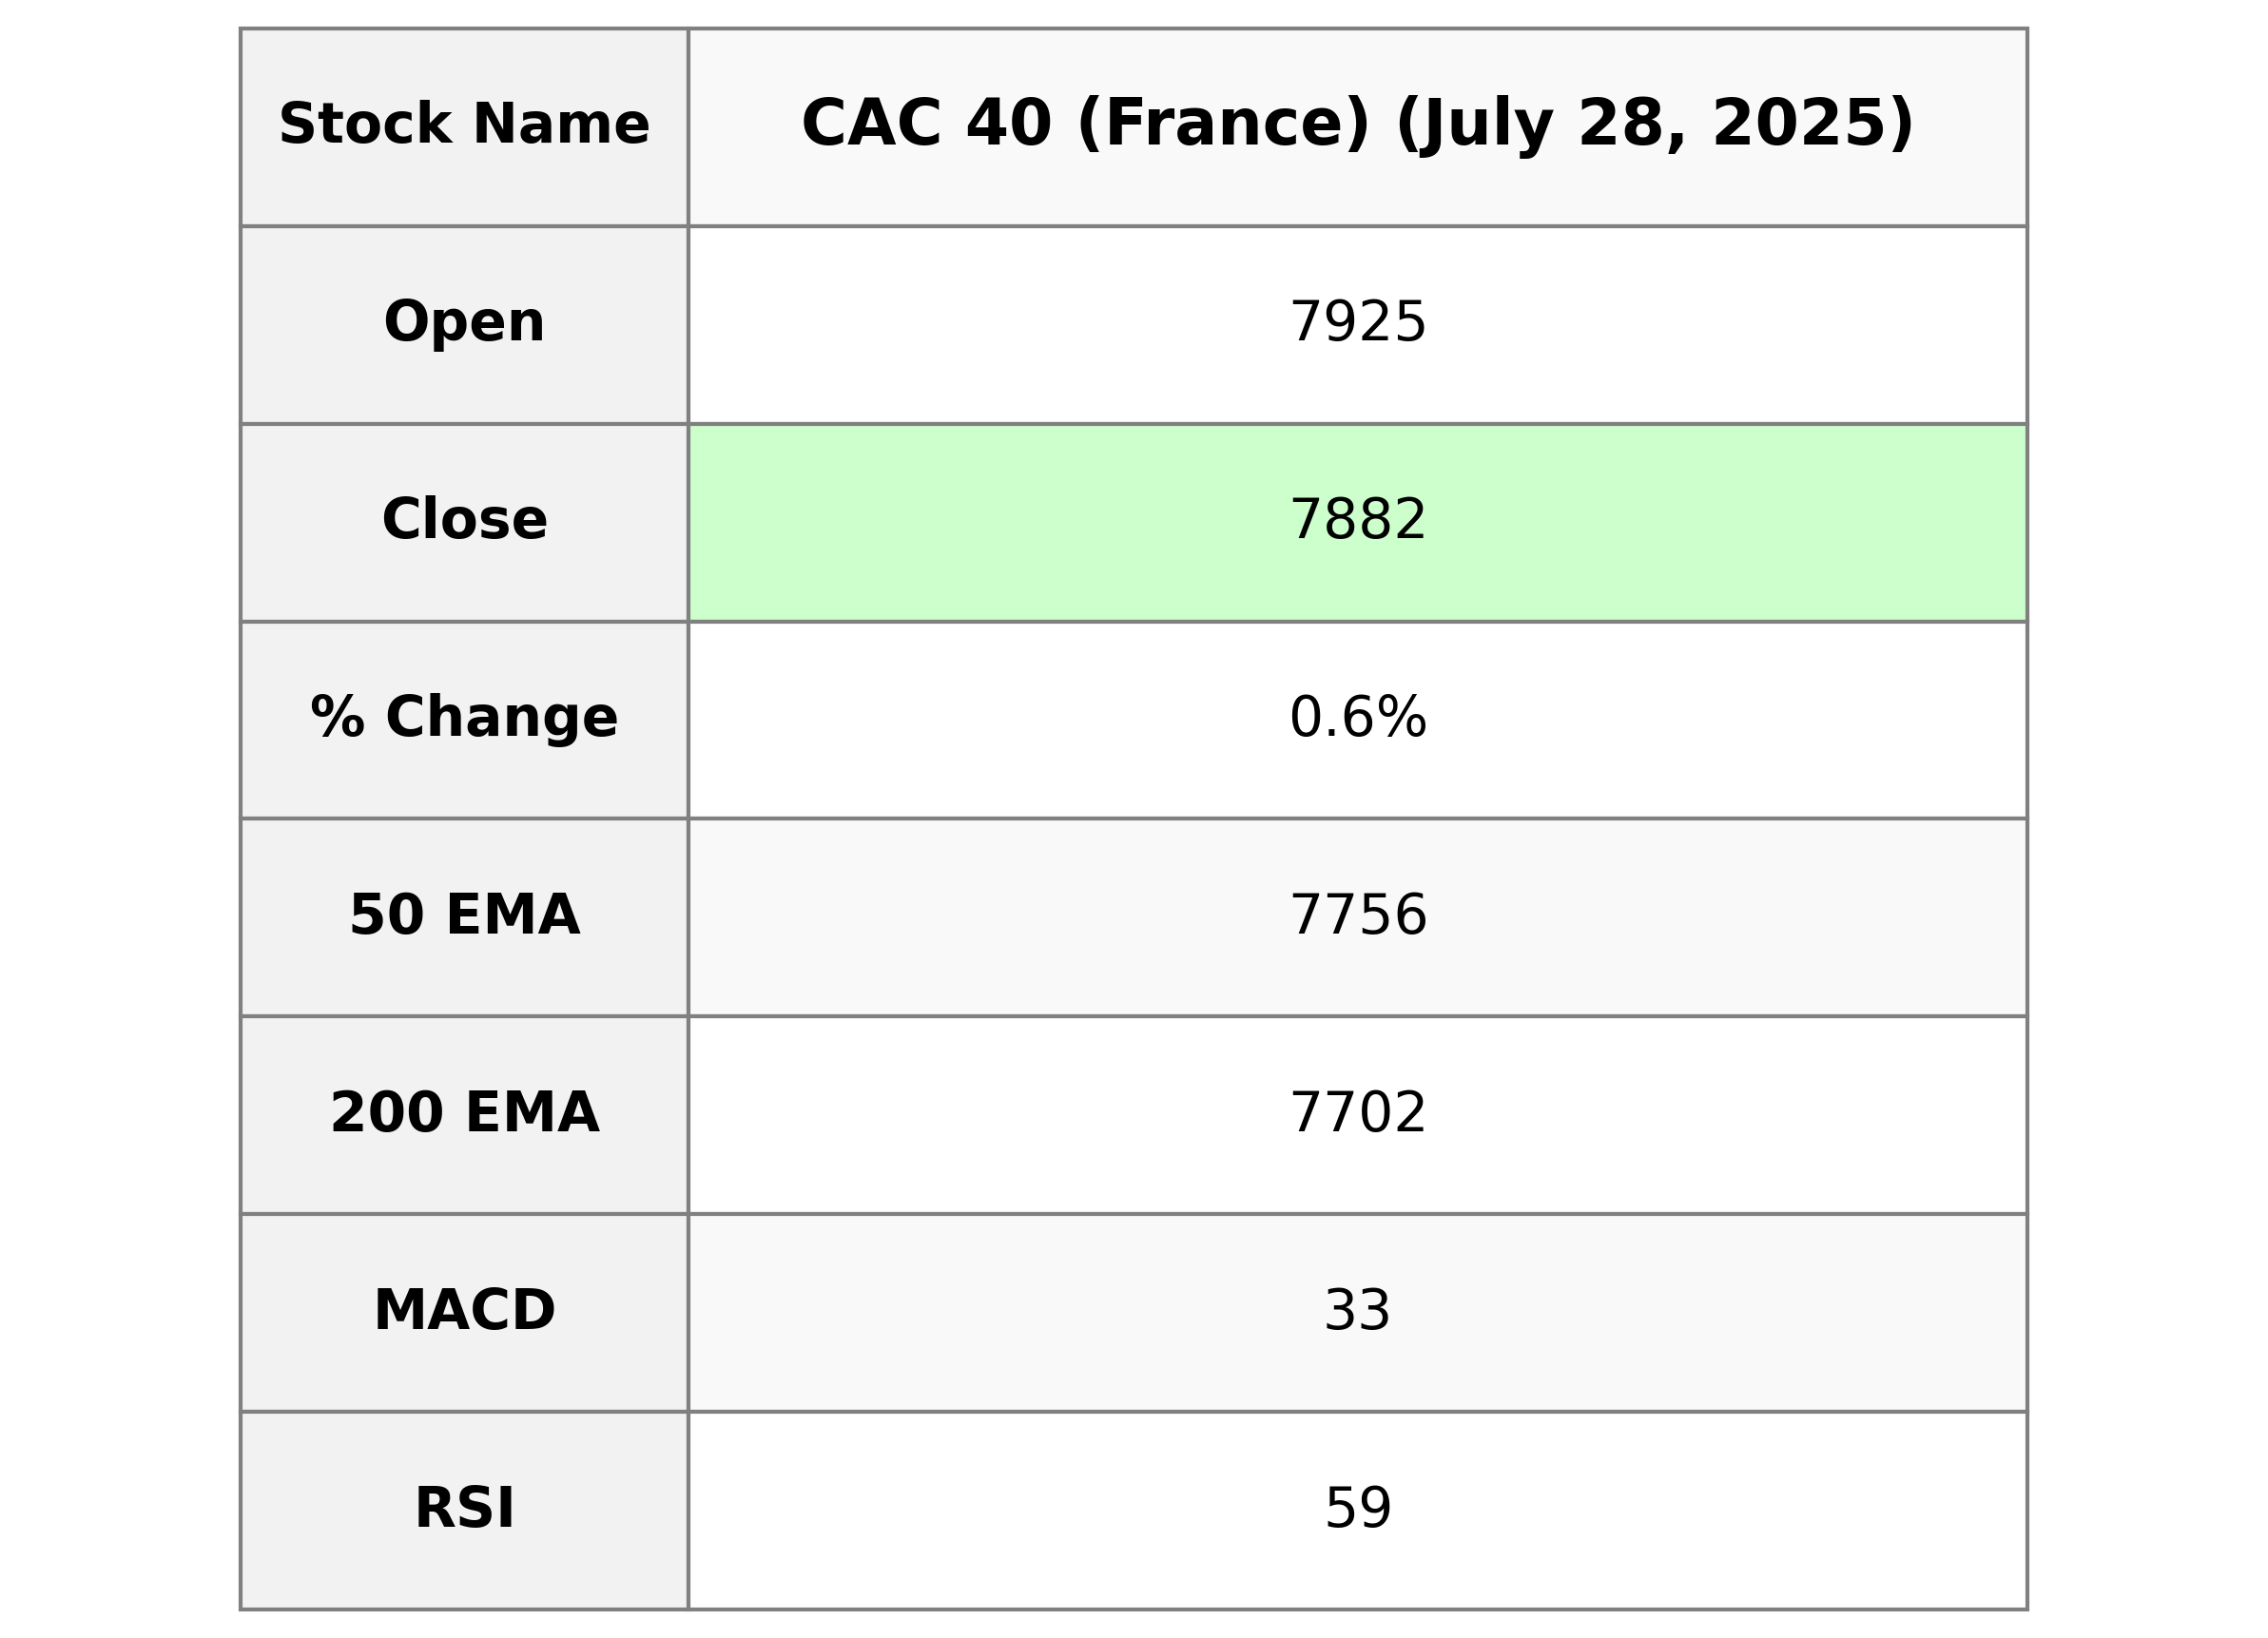
CAC 40 (France) opened at 7924.53 and closed slightly lower at 7881.54, marking a percentage change of 0.60% with a 46.96 points increase. The 50-day and 200-day EMAs stand at 7755.74 and 7701.61, respectively, indicating a bullish trend with an RSI of 58.54, alongside a positive MACD of 33.18. Volume information is missing, and metrics like Market Cap, PE Ratio, and EPS are also unavailable.
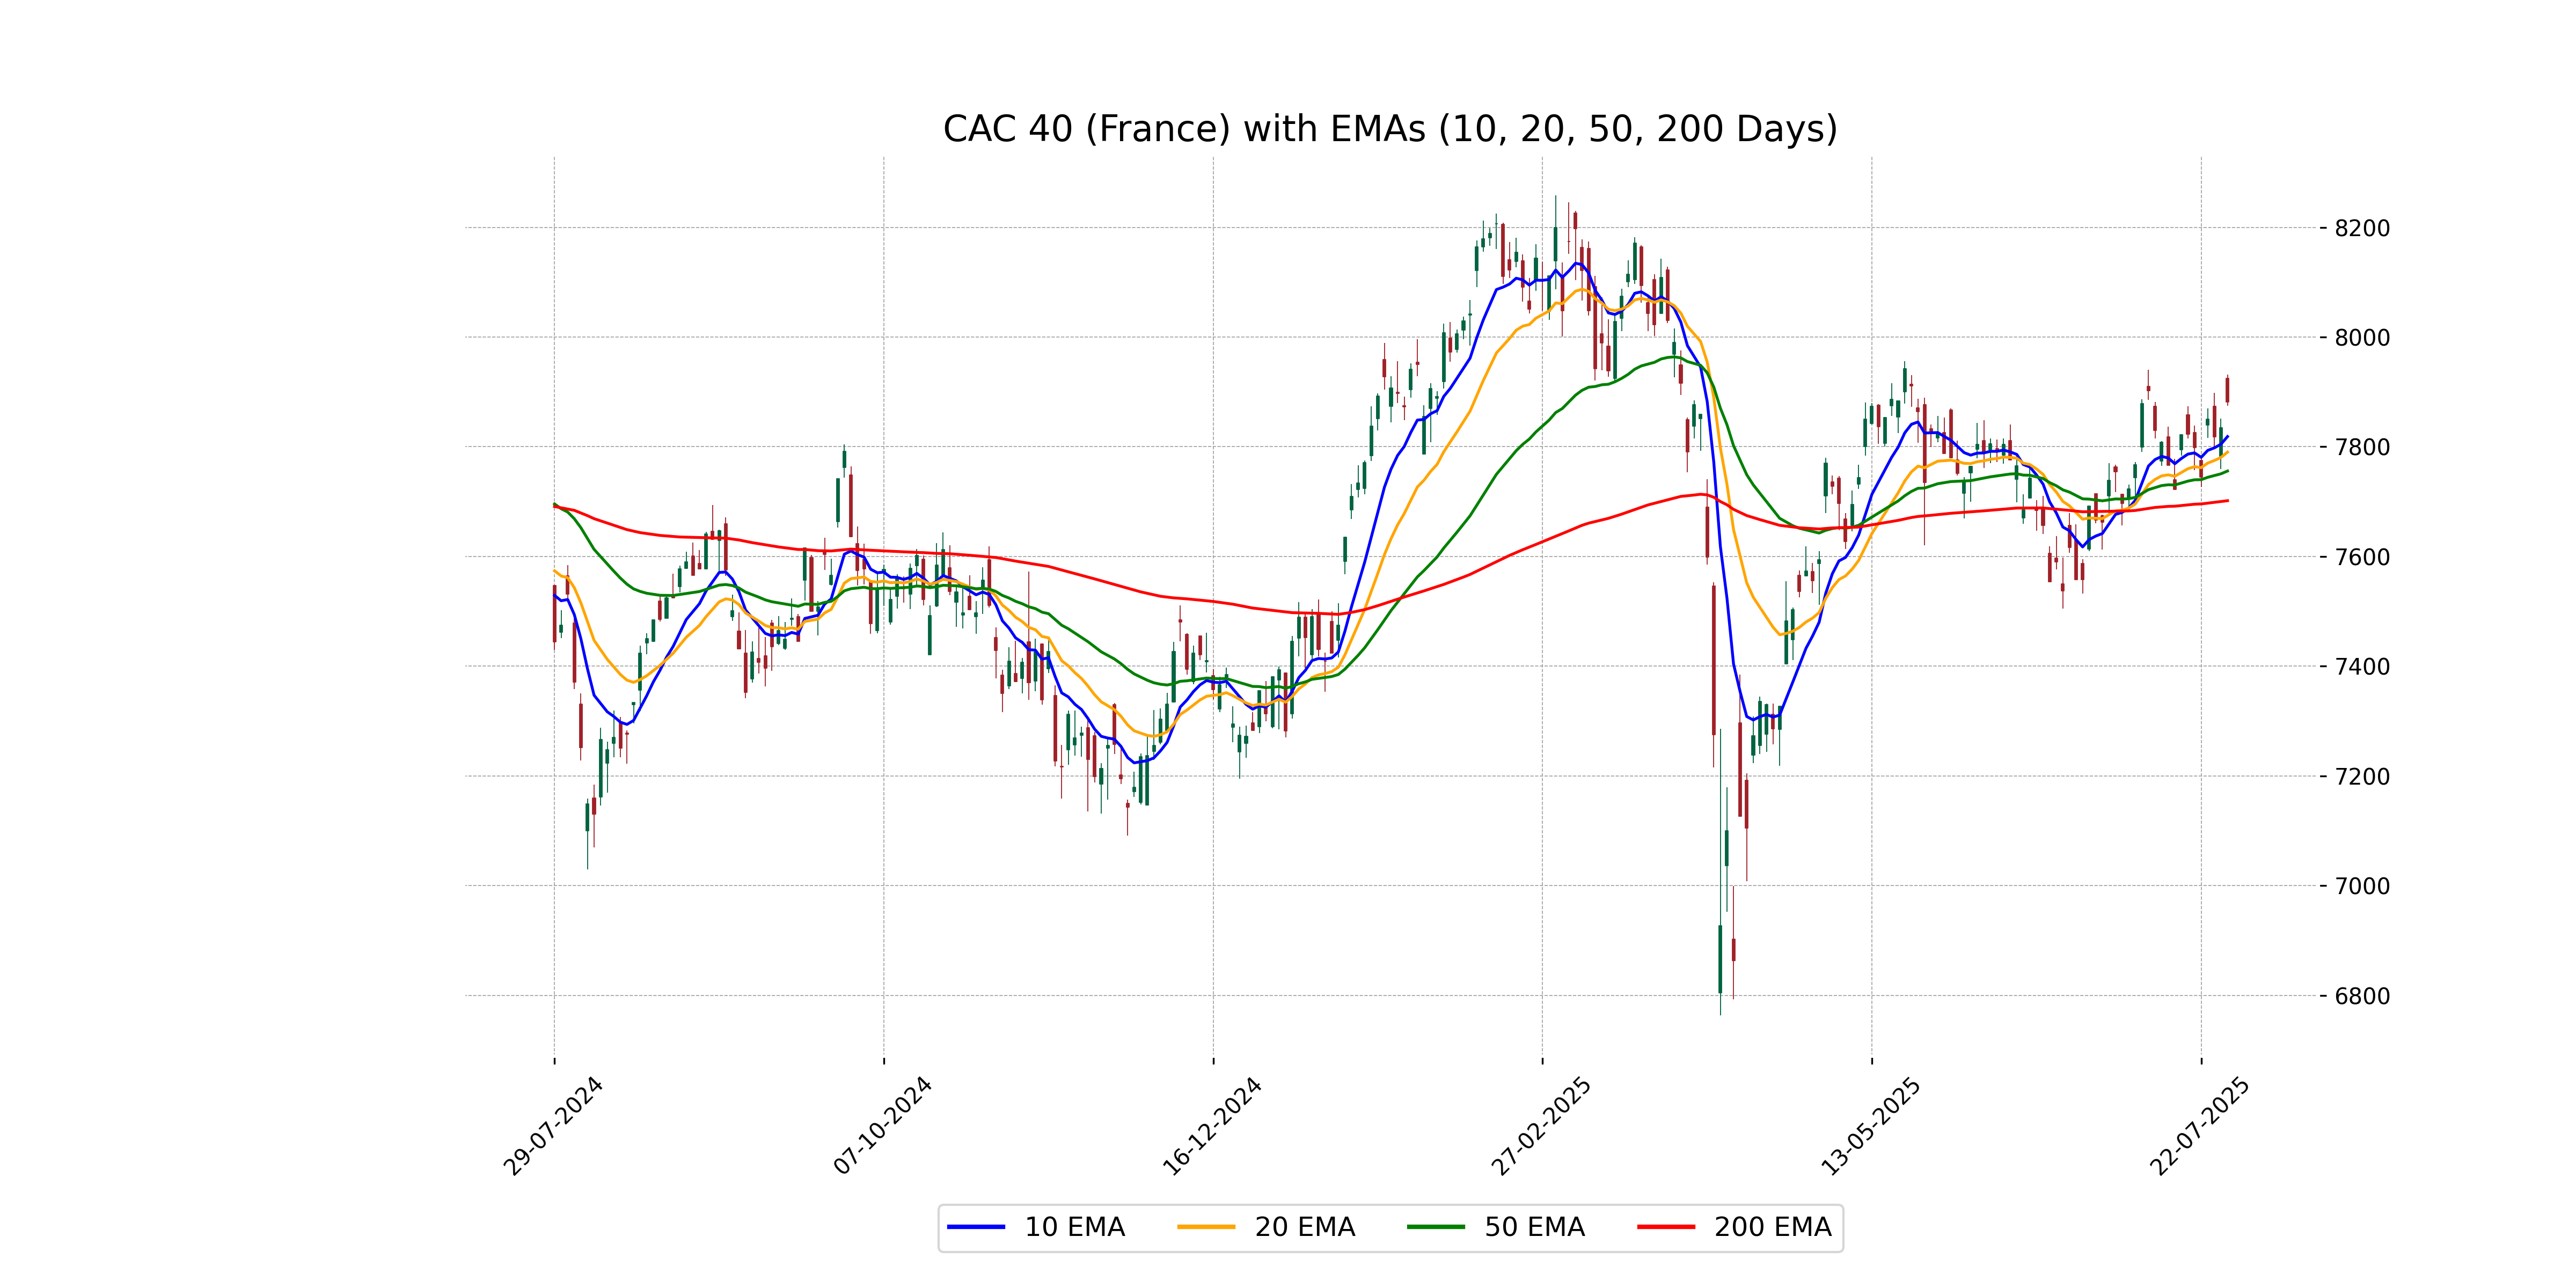
Relationship with Key Moving Averages
The CAC 40 index closed at 7881.54, which is above its 50-day EMA of 7755.74 and 200-day EMA of 7701.61, indicating a short-term bullish trend. The 10-day EMA of 7818.56 and 20-day EMA of 7790.13 suggest recent upward momentum in the index's performance.
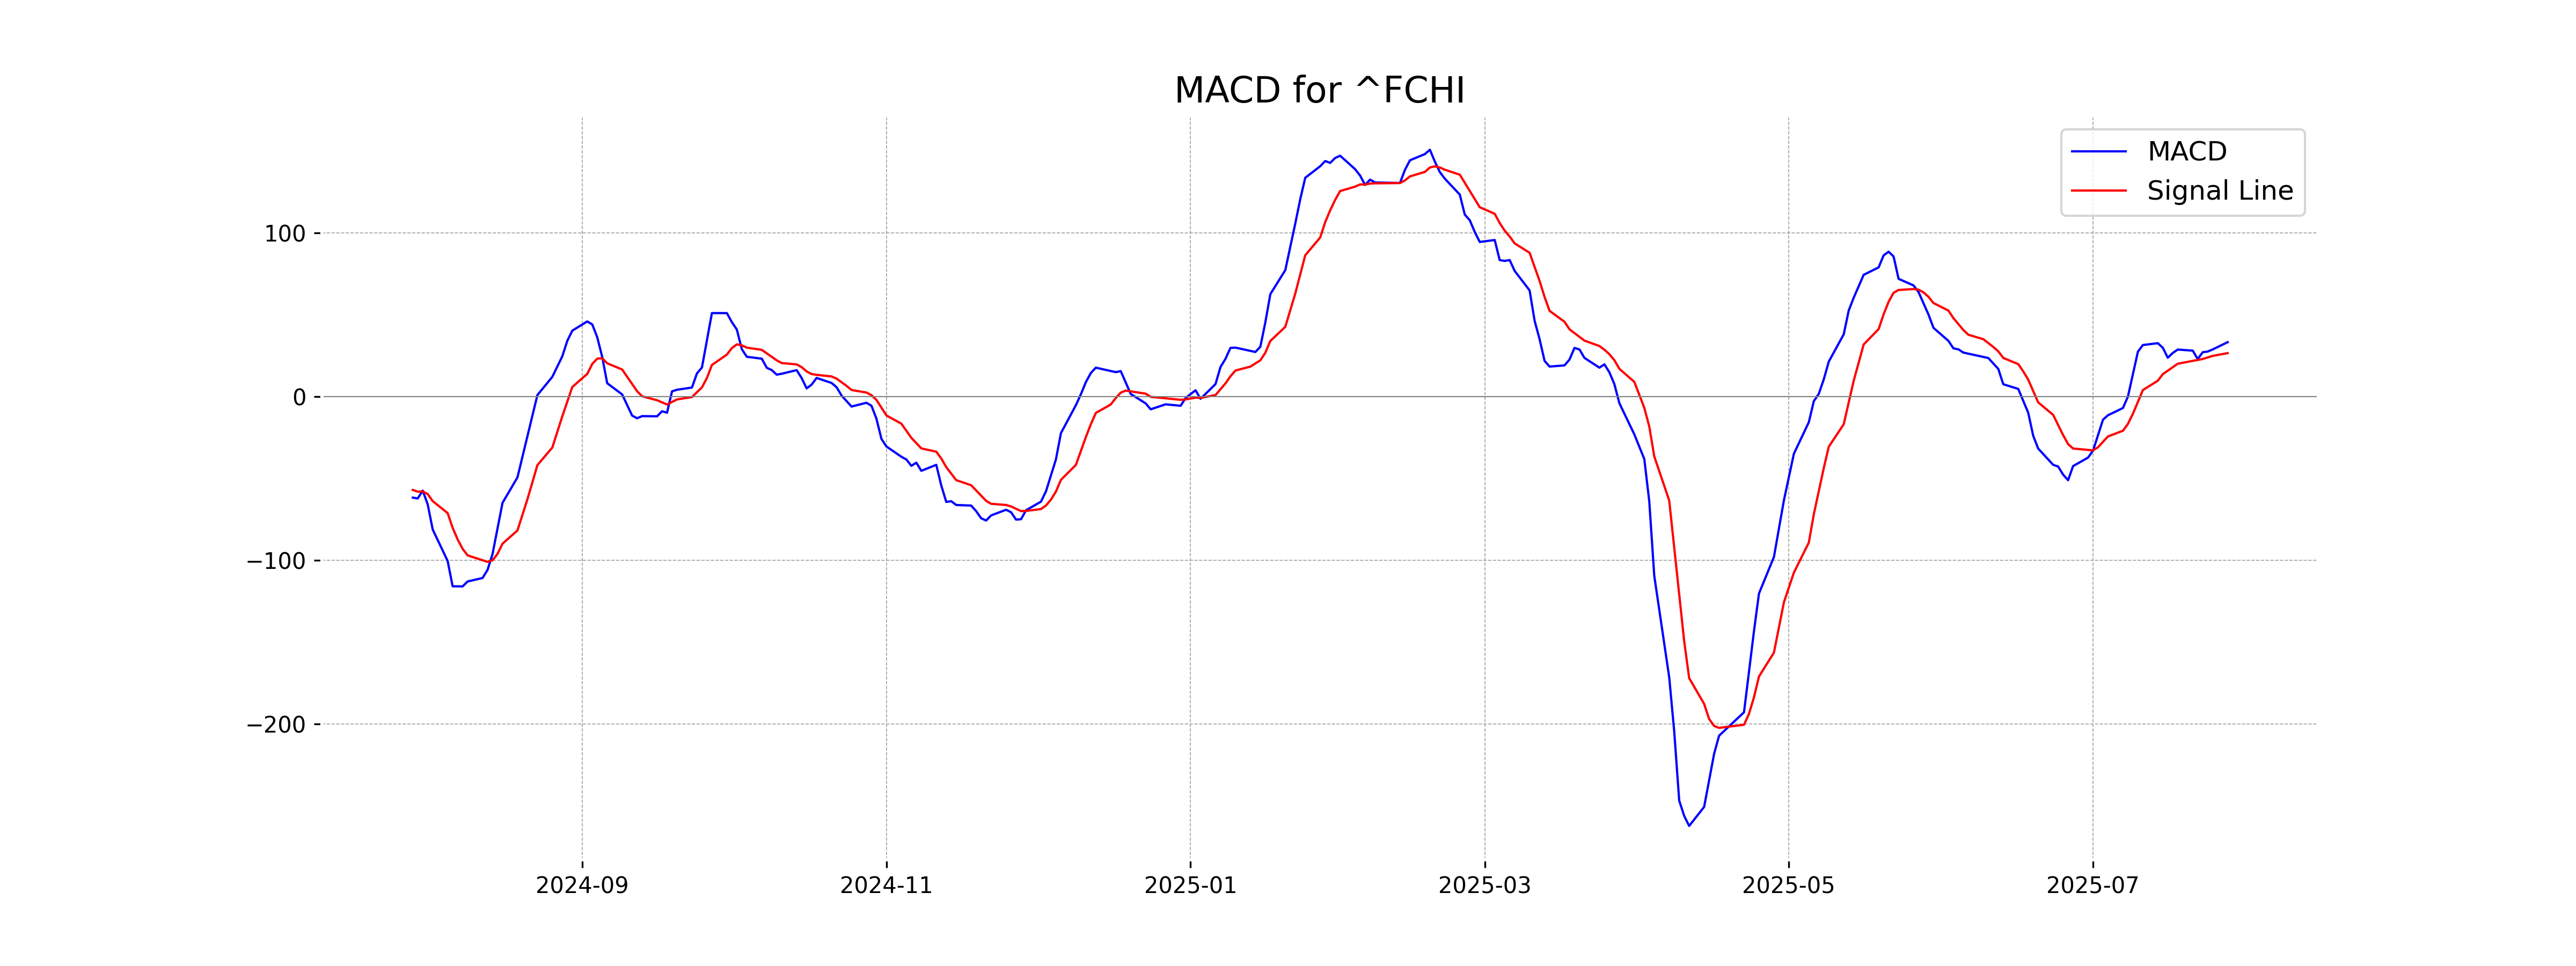
Moving Averages Trend (MACD)
The MACD value is 33.18, which is above the signal line value of 26.47. This indicates a potential bullish trend for CAC 40. The MACD suggests upward momentum in the market.
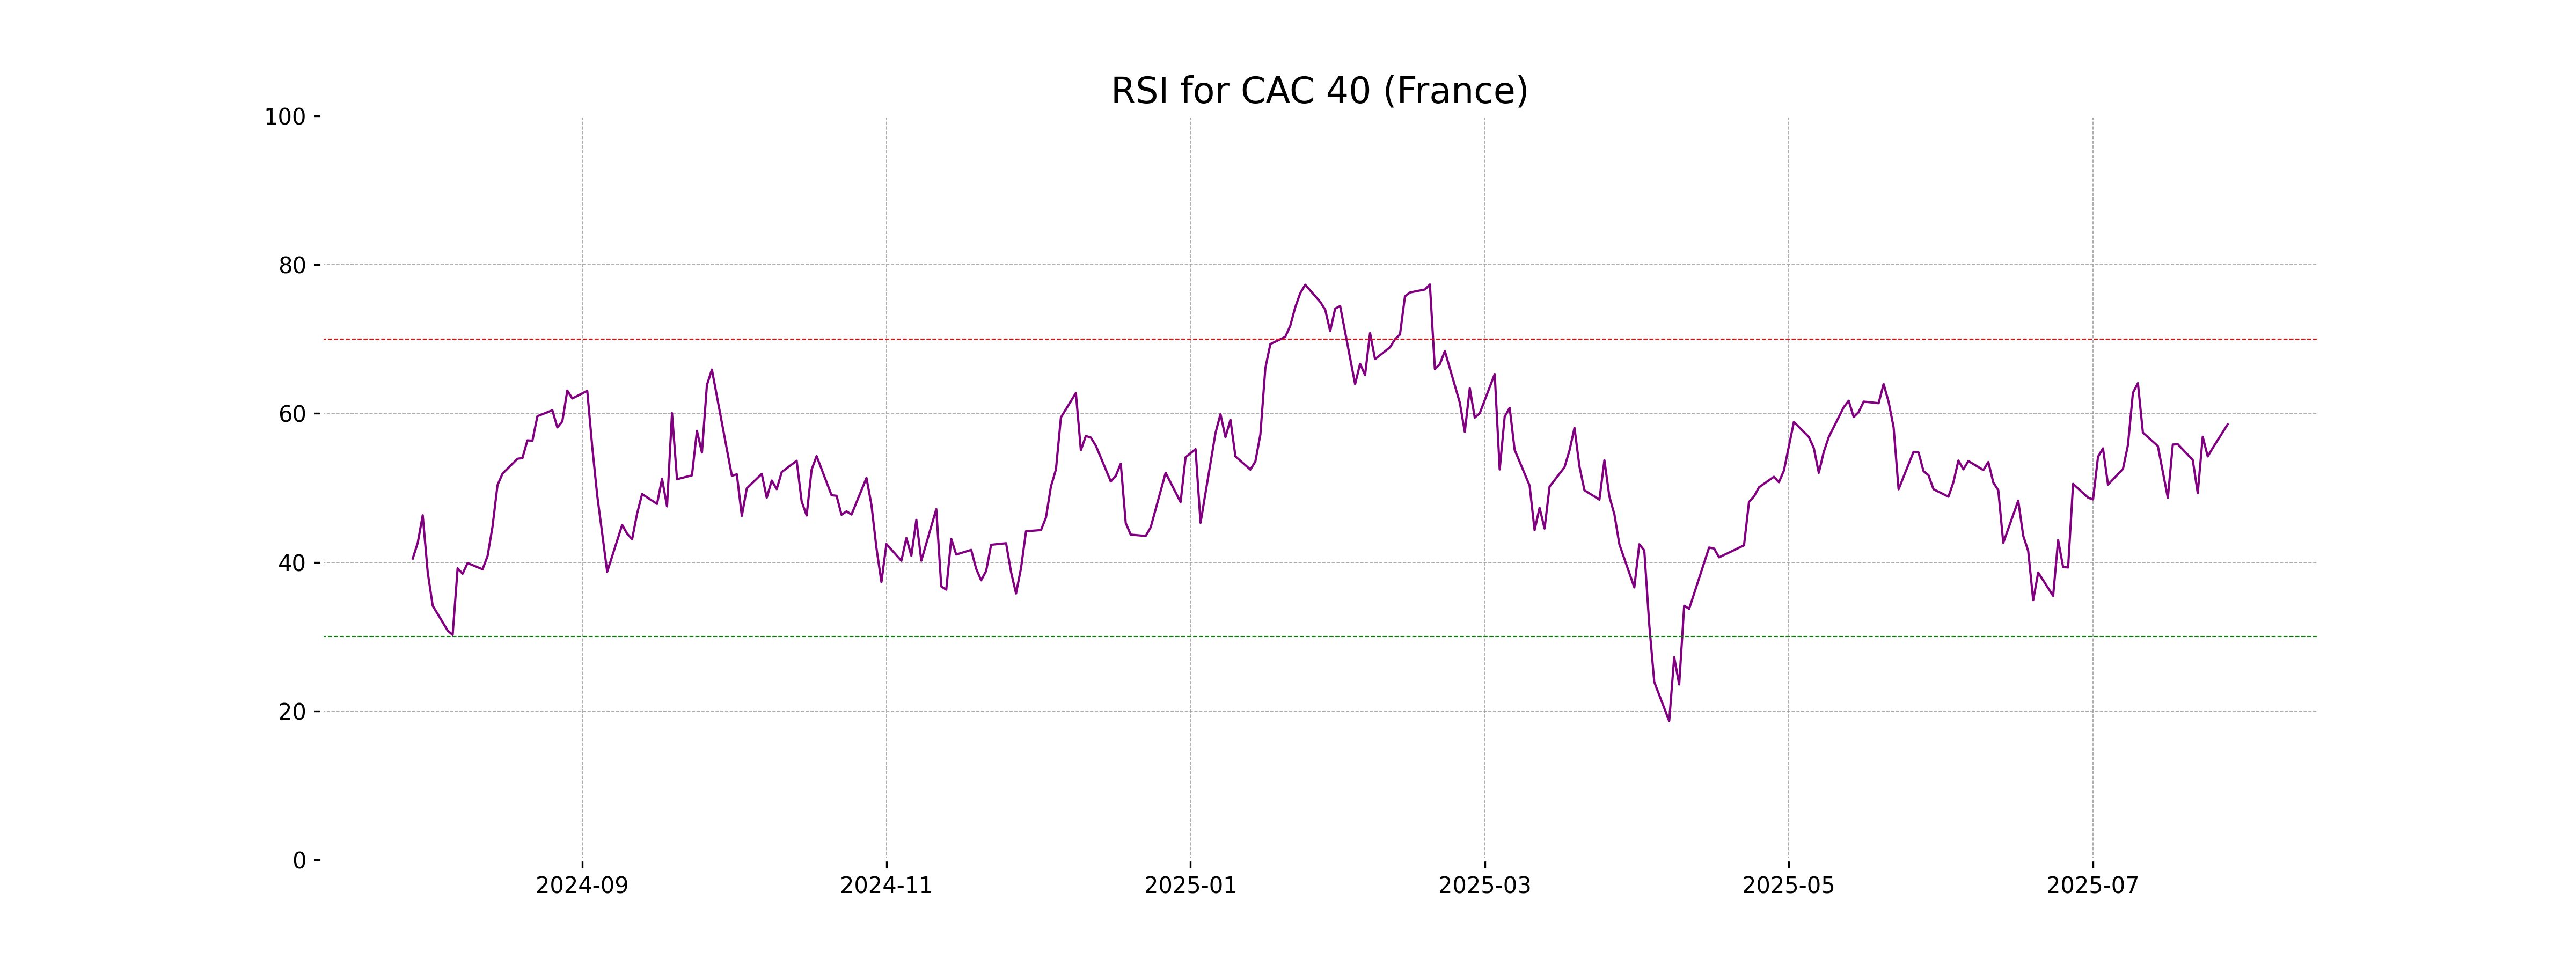
RSI Analysis
The Relative Strength Index (RSI) for CAC 40 is 58.54, indicating that the stock is currently in a neutral position, moving towards the overbought zone but not yet there. It suggests that bullish momentum is moderately strong.
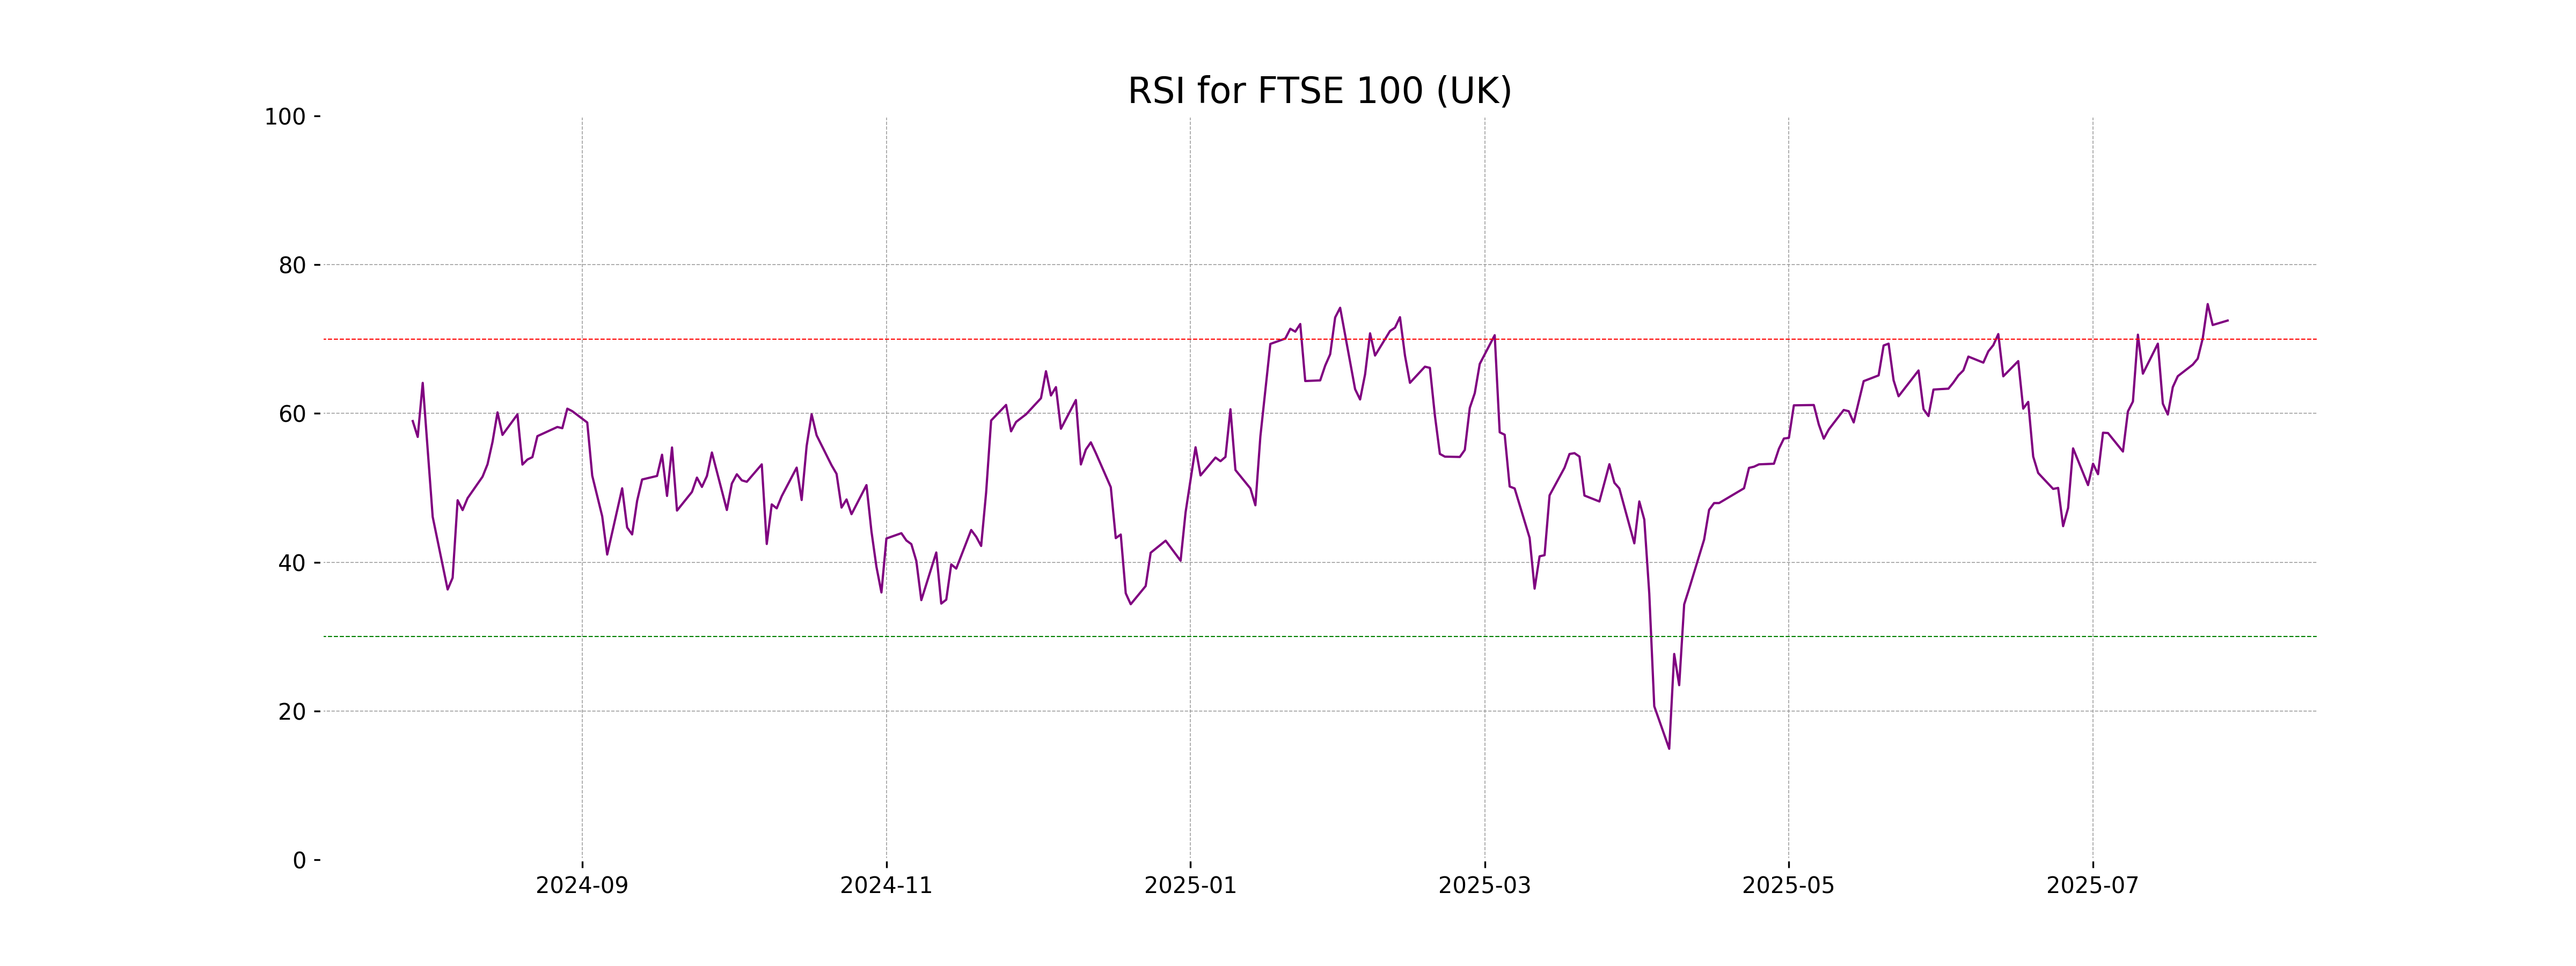
Analysis for FTSE 100 (UK) - July 28, 2025

FTSE 100 (UK) opened at 9120.31, reaching a high of 9169.01 and closing at 9130.05, showing a slight increase from the previous close of 9120.30 with a percentage change of 0.11%. The index showcases strong RSI at 72.49, indicating potential overbought conditions, while the MACD further suggests bullish momentum.

Relationship with Key Moving Averages
The FTSE 100 is trading above its key moving averages, with the current price of 9130.05 higher than the 50-day EMA of 8849.17, the 200-day EMA of 8561.03, and the 10-day EMA of 9046.04. This suggests a bullish trend in the market.
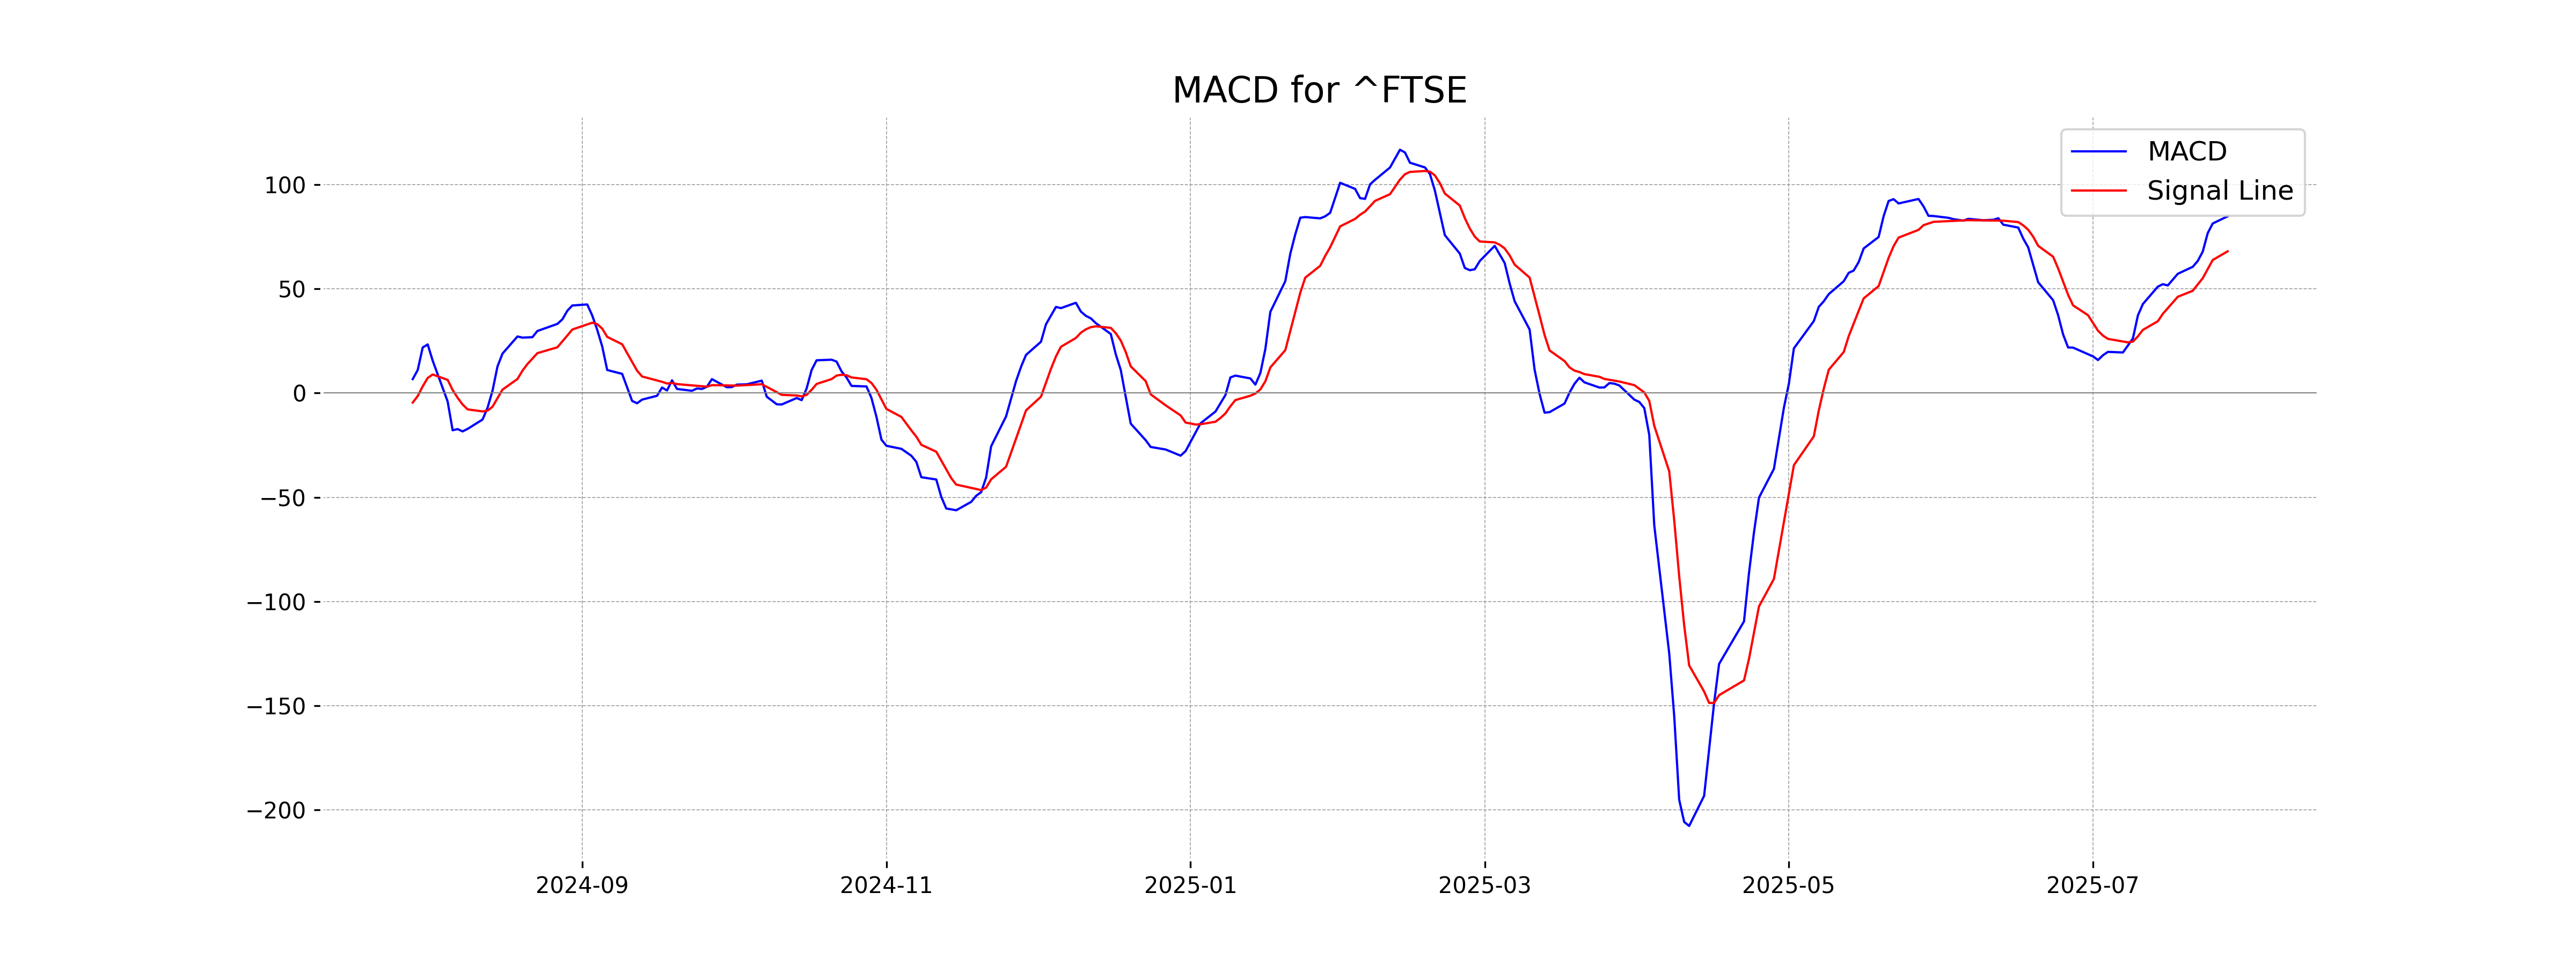
Moving Averages Trend (MACD)
The MACD for FTSE 100 is 84.81, which is above the MACD Signal line at 68.00. This indicates a bullish trend, suggesting potential upward momentum in the market. The MACD value being significantly above the Signal line often suggests strengthening momentum in the current trend.
RSI Analysis
RSI Analysis for FTSE 100 (UK): The RSI (Relative Strength Index) value for the FTSE 100 is 72.49, which indicates the stock is in overbought territory. Caution is advised as this may suggest a potential reversal or pullback.
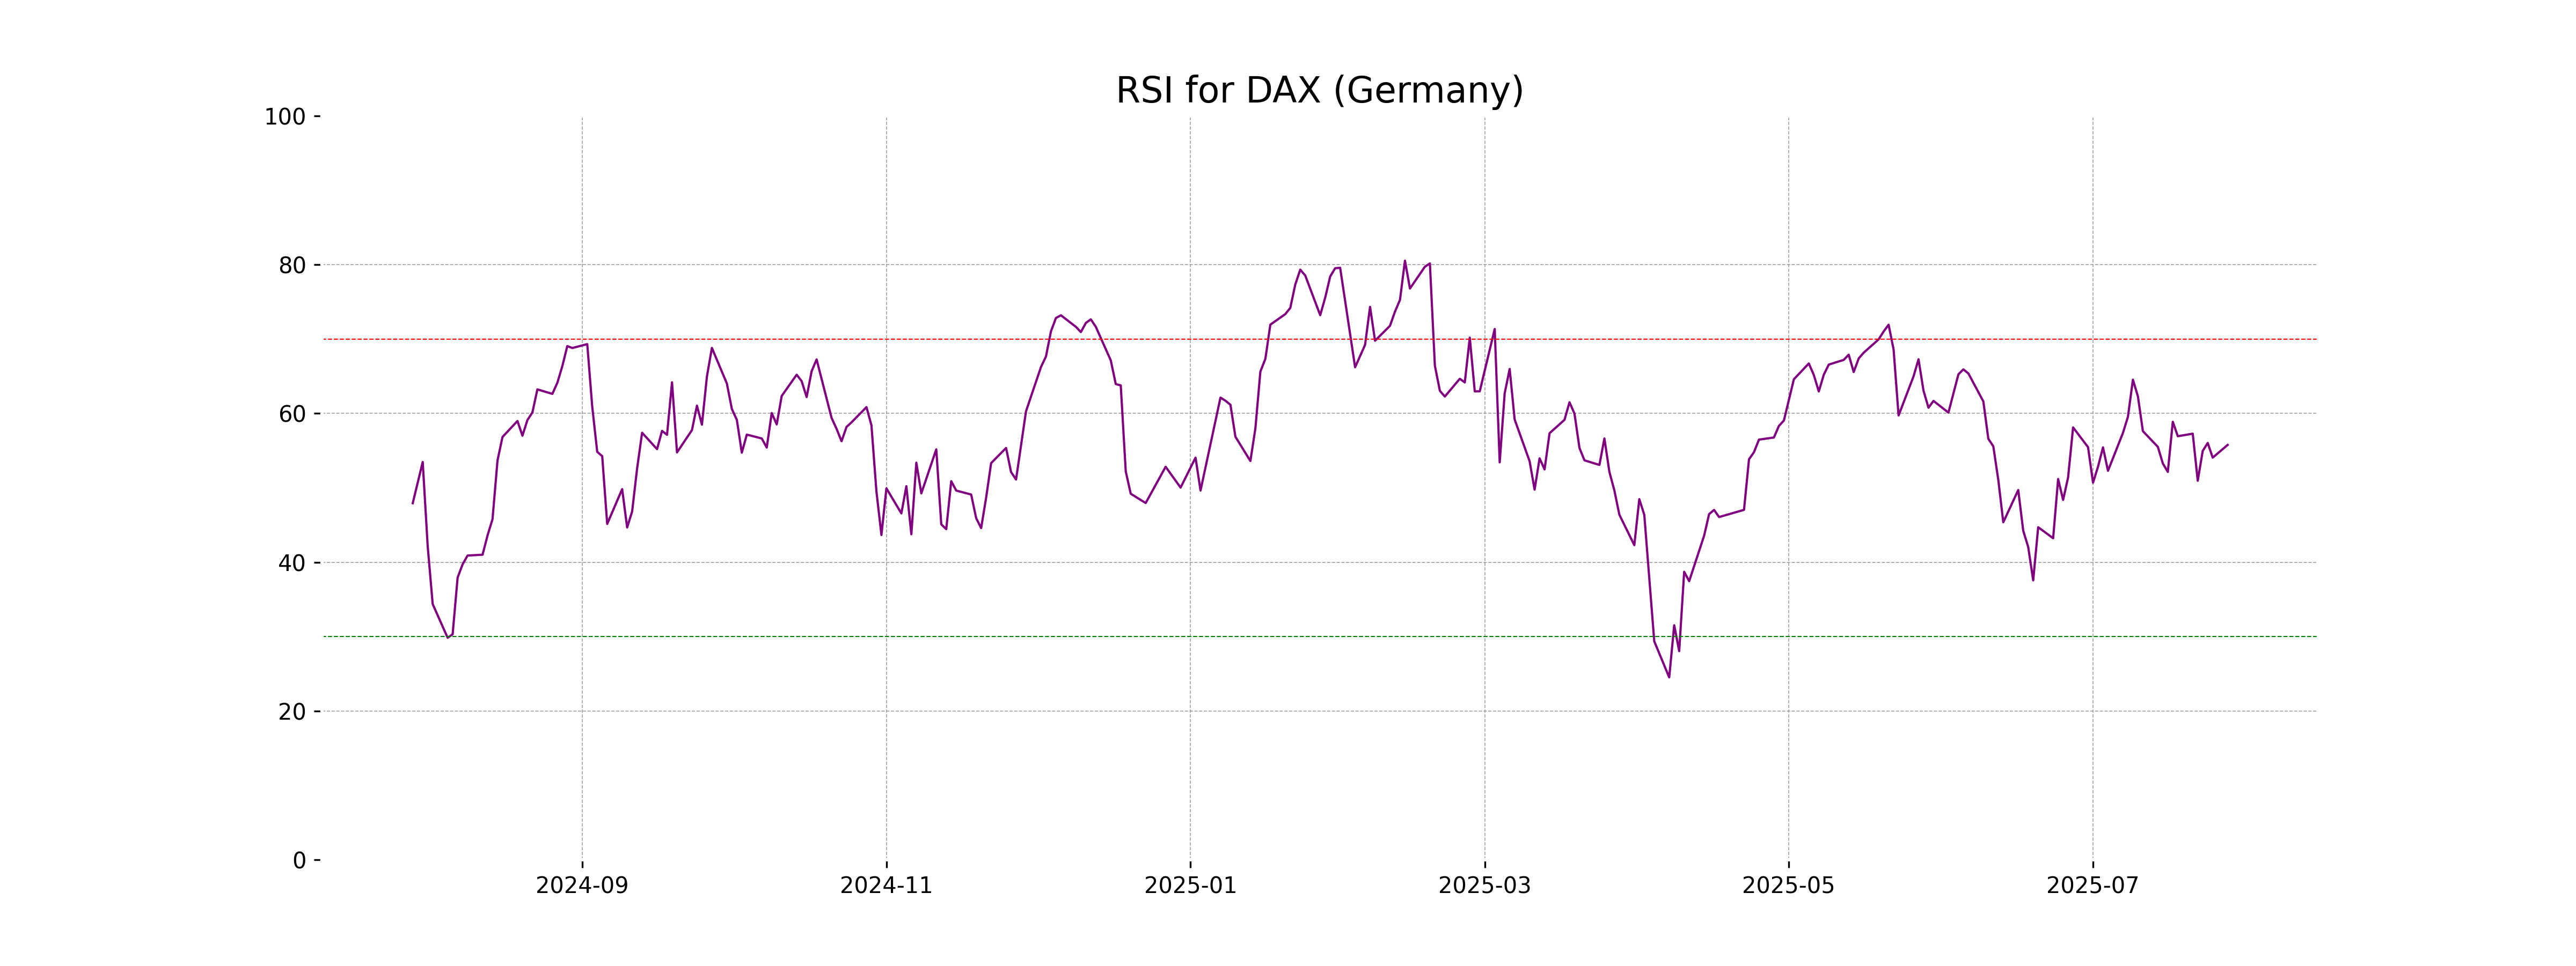
Analysis for DAX (Germany) - July 28, 2025
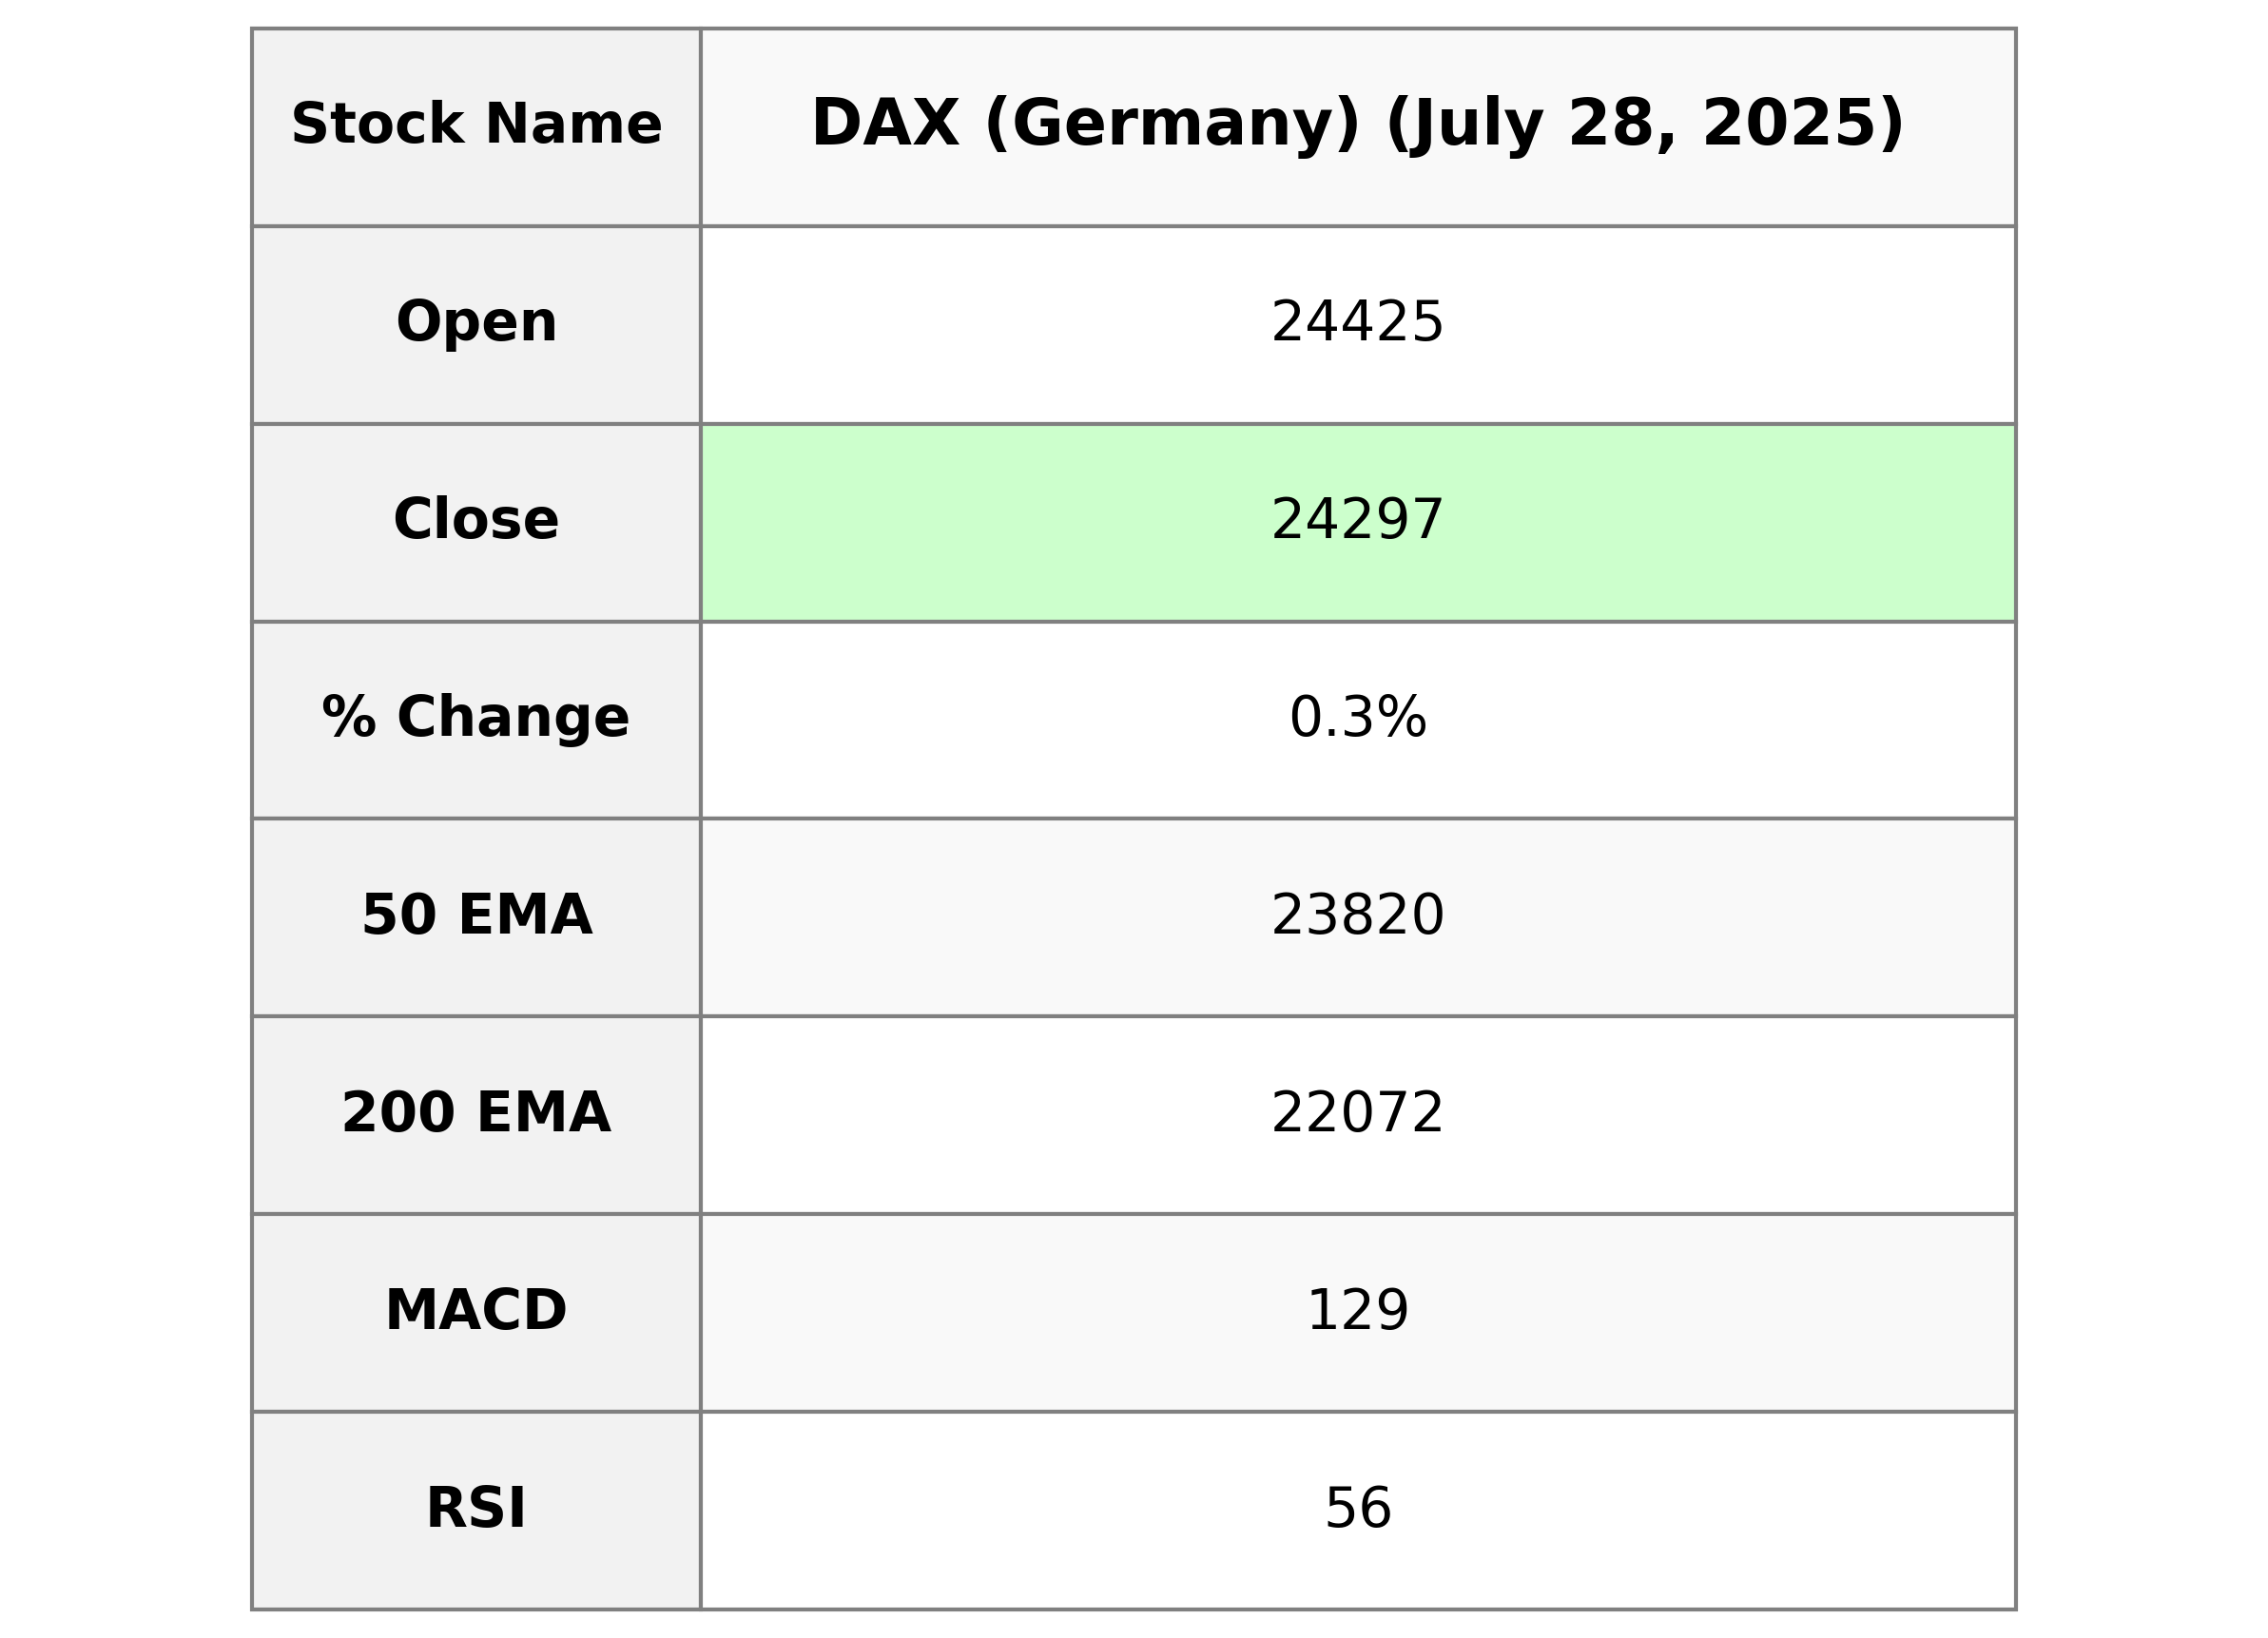
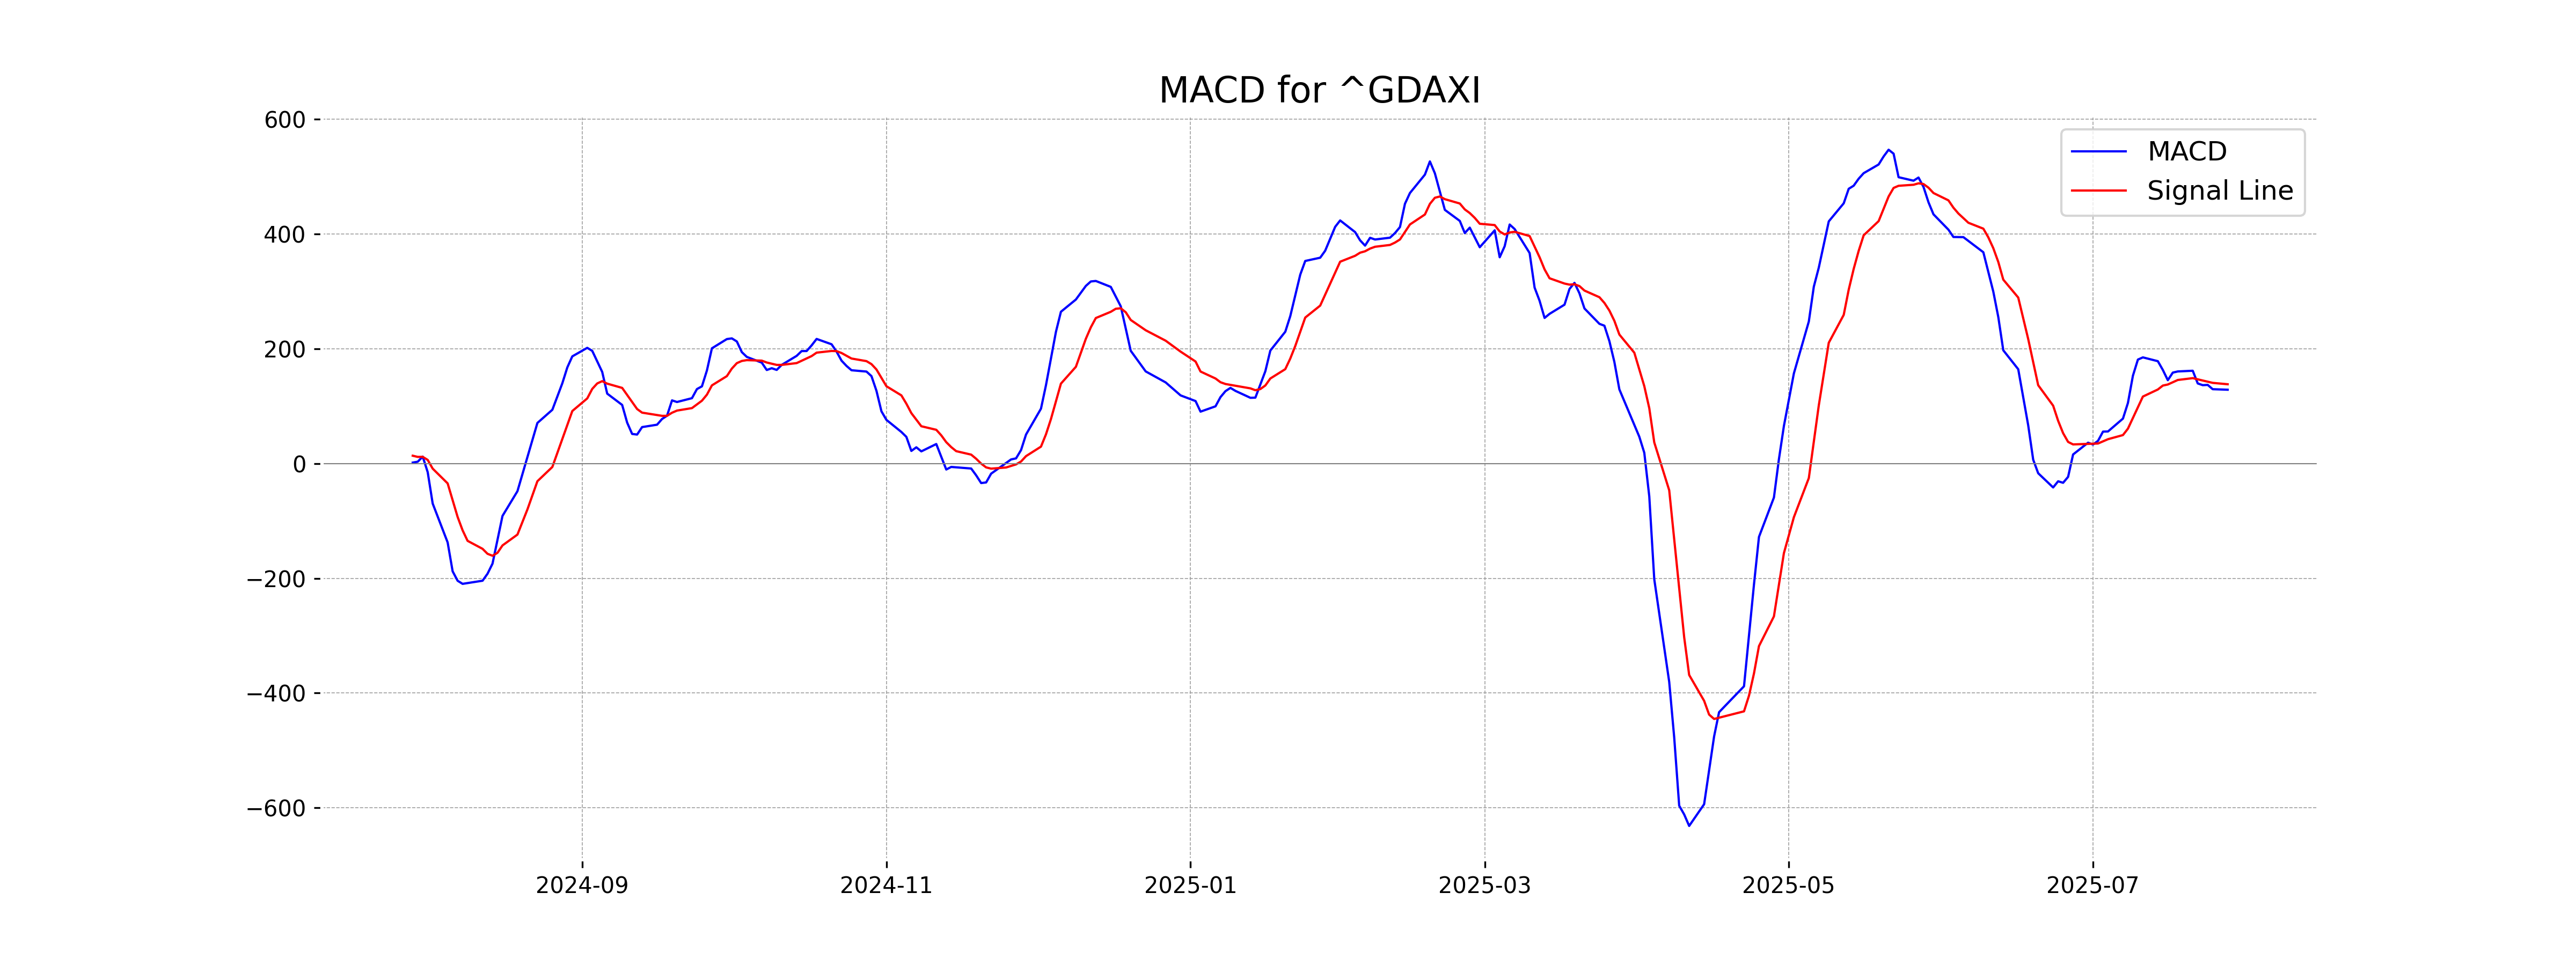
DAX Performance Summary: The DAX index, representing Germany's stock exchange, opened at 24,424.67 and closed at 24,297.36, marking a slight increase from the previous close with a 0.33% gain. The index experienced a high of 24,444.47 and a low of 24,249.20. The MACD indicator shows a value of 128.73, slightly trailing its signal line at 138.30, indicating momentum changes. The RSI stands at 55.77, suggesting a neutral position in terms of overbought or oversold conditions.
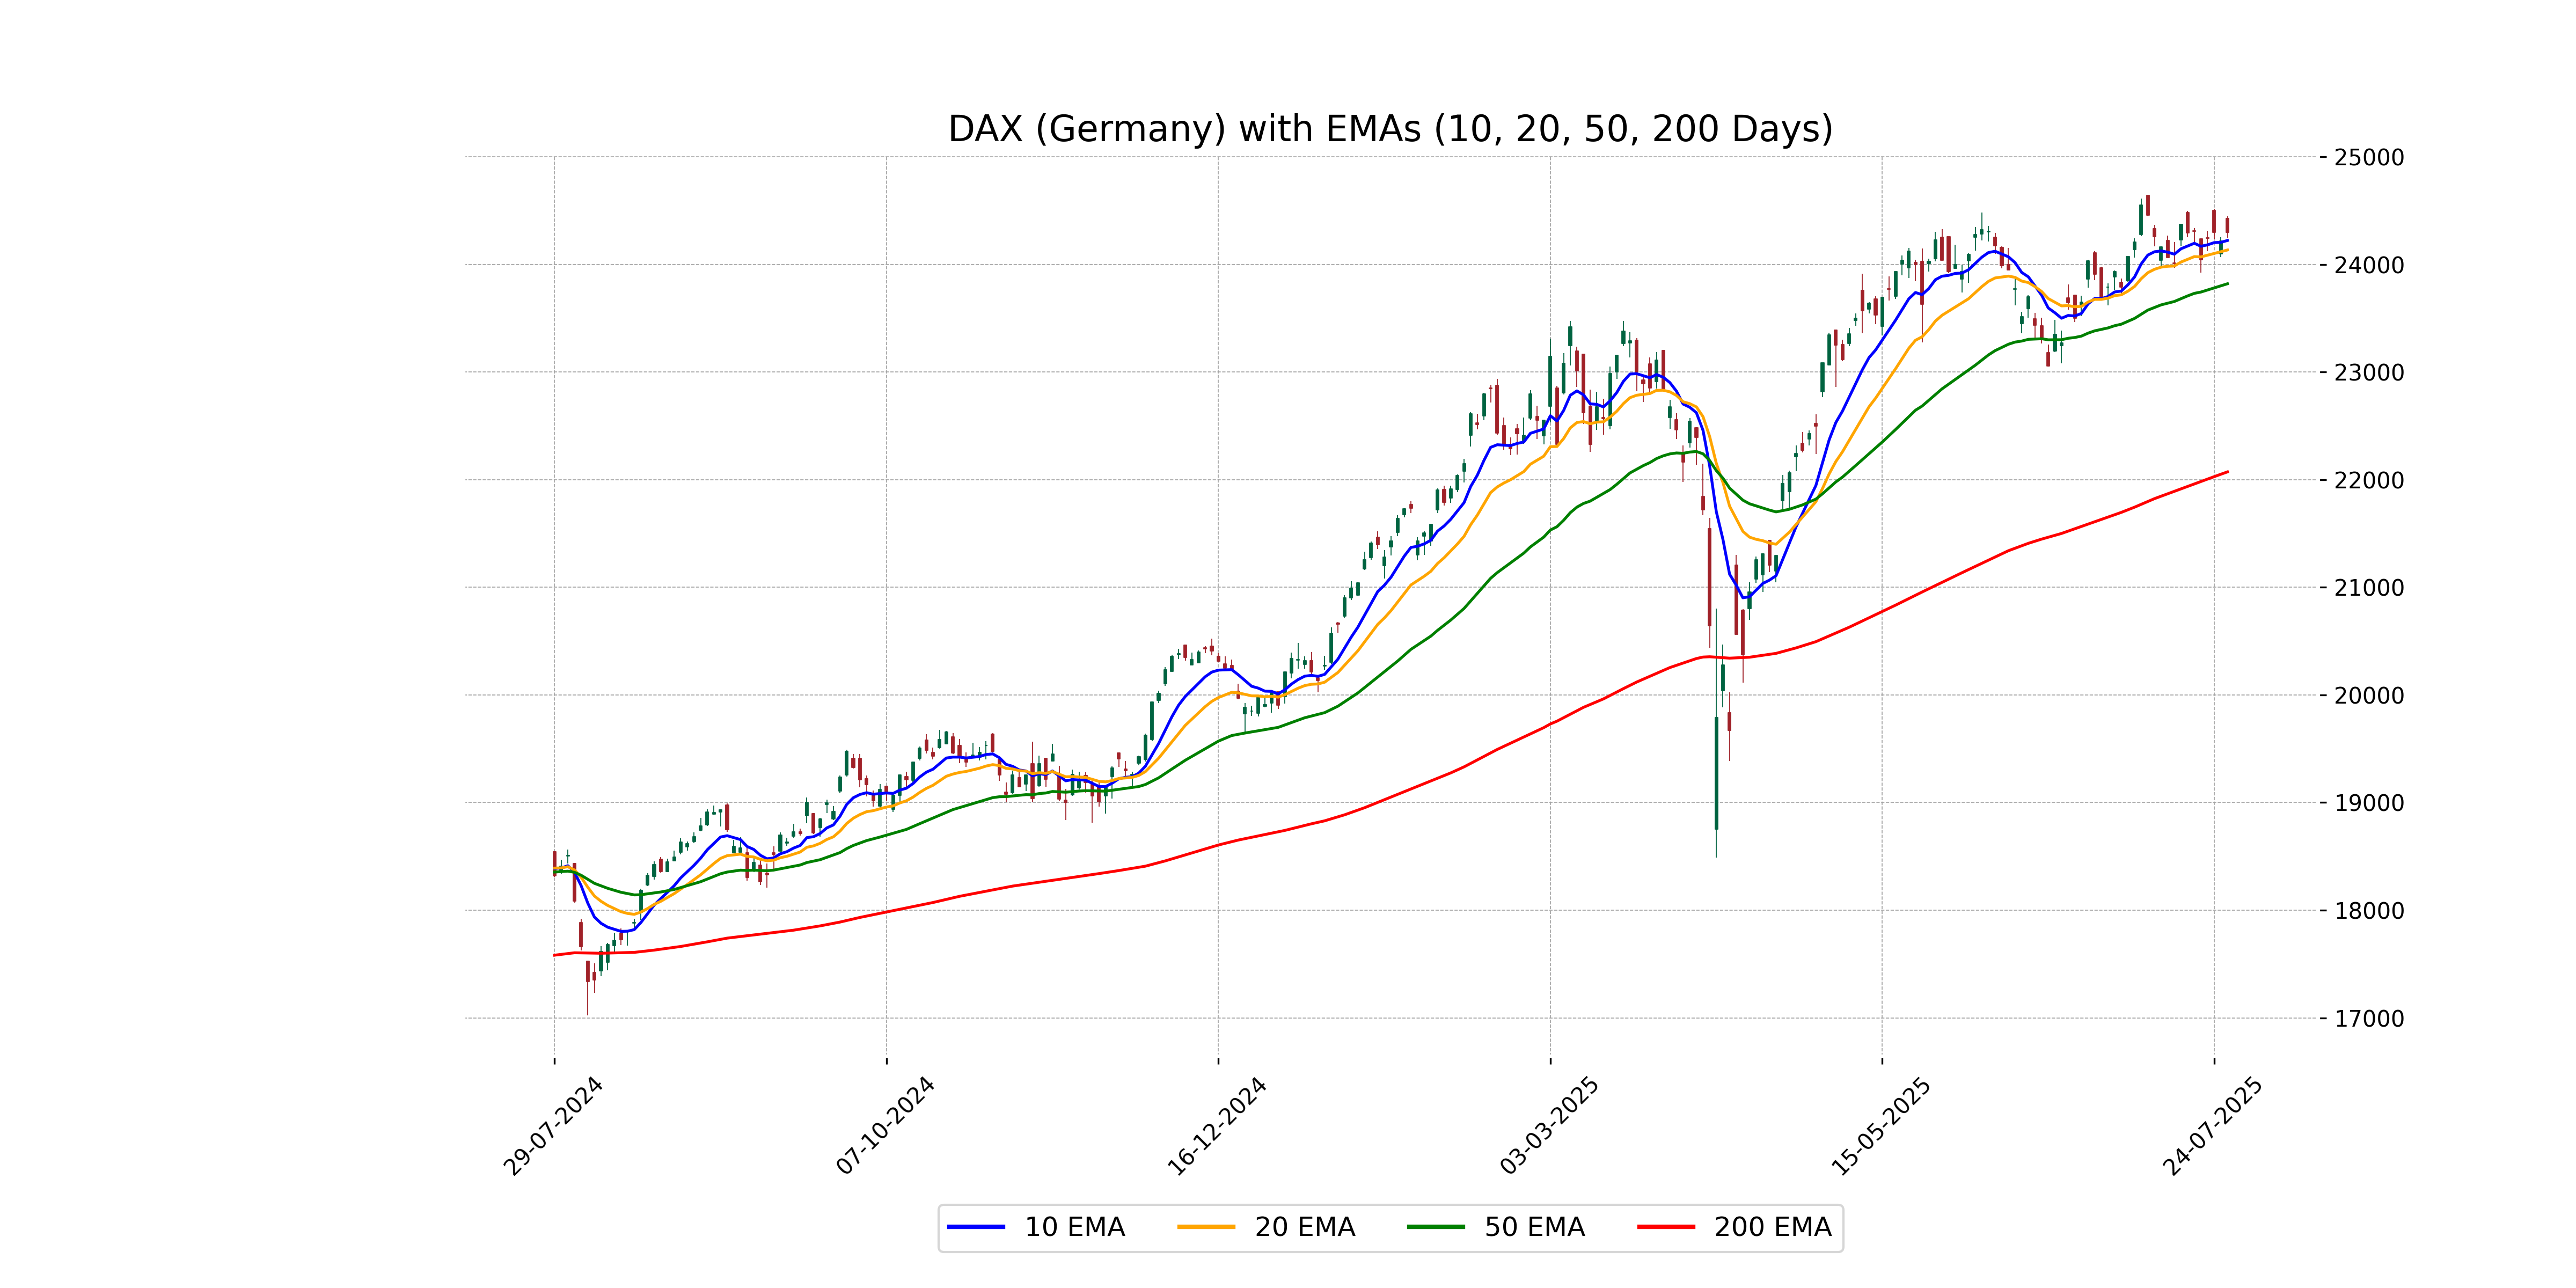
Relationship with Key Moving Averages
The DAX closed at 24,297.36, which is above both its 10-day EMA of 24,221.61 and its 20-day EMA of 24,133.30, indicating a short-term bullish trend. However, it remains significantly higher than its 50-day EMA of 23,819.60 and 200-day EMA of 22,072.02, suggesting a strong longer-term bullish momentum as well.
Moving Averages Trend (MACD)
Based on the stock data for DAX (Germany), the MACD value is 128.73 while the MACD Signal value is 138.30. This indicates a slightly bearish momentum, as the MACD is below the signal line, suggesting a potential upcoming downtrend.
RSI Analysis
The Relative Strength Index (RSI) for DAX (Germany) is 55.77, indicating a neutral position as it is within the range of 30 to 70. This suggests that the index is neither overbought nor oversold, hinting at a balanced market sentiment.
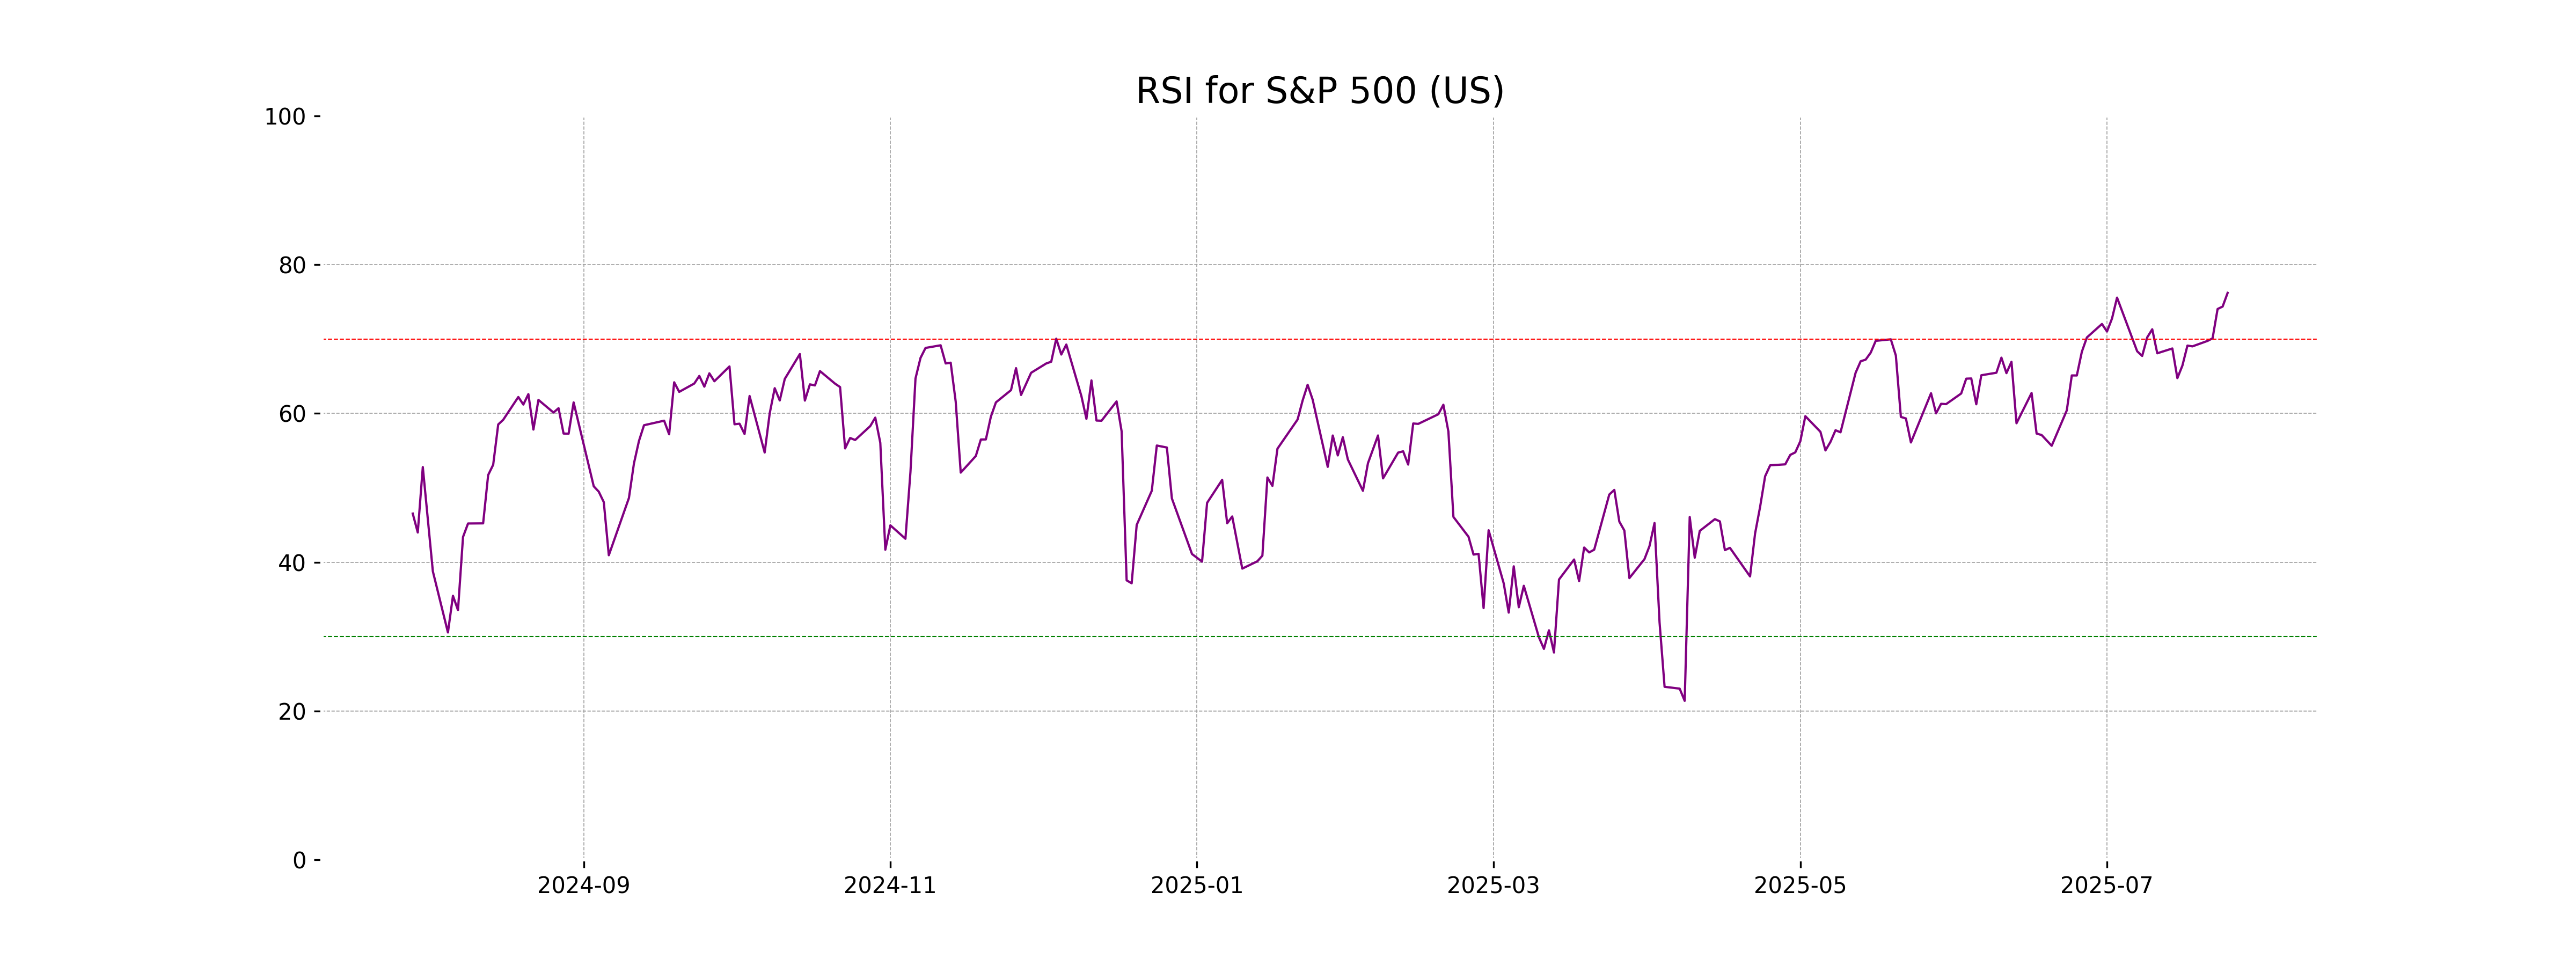
Analysis for S&P 500 (US) - July 28, 2025
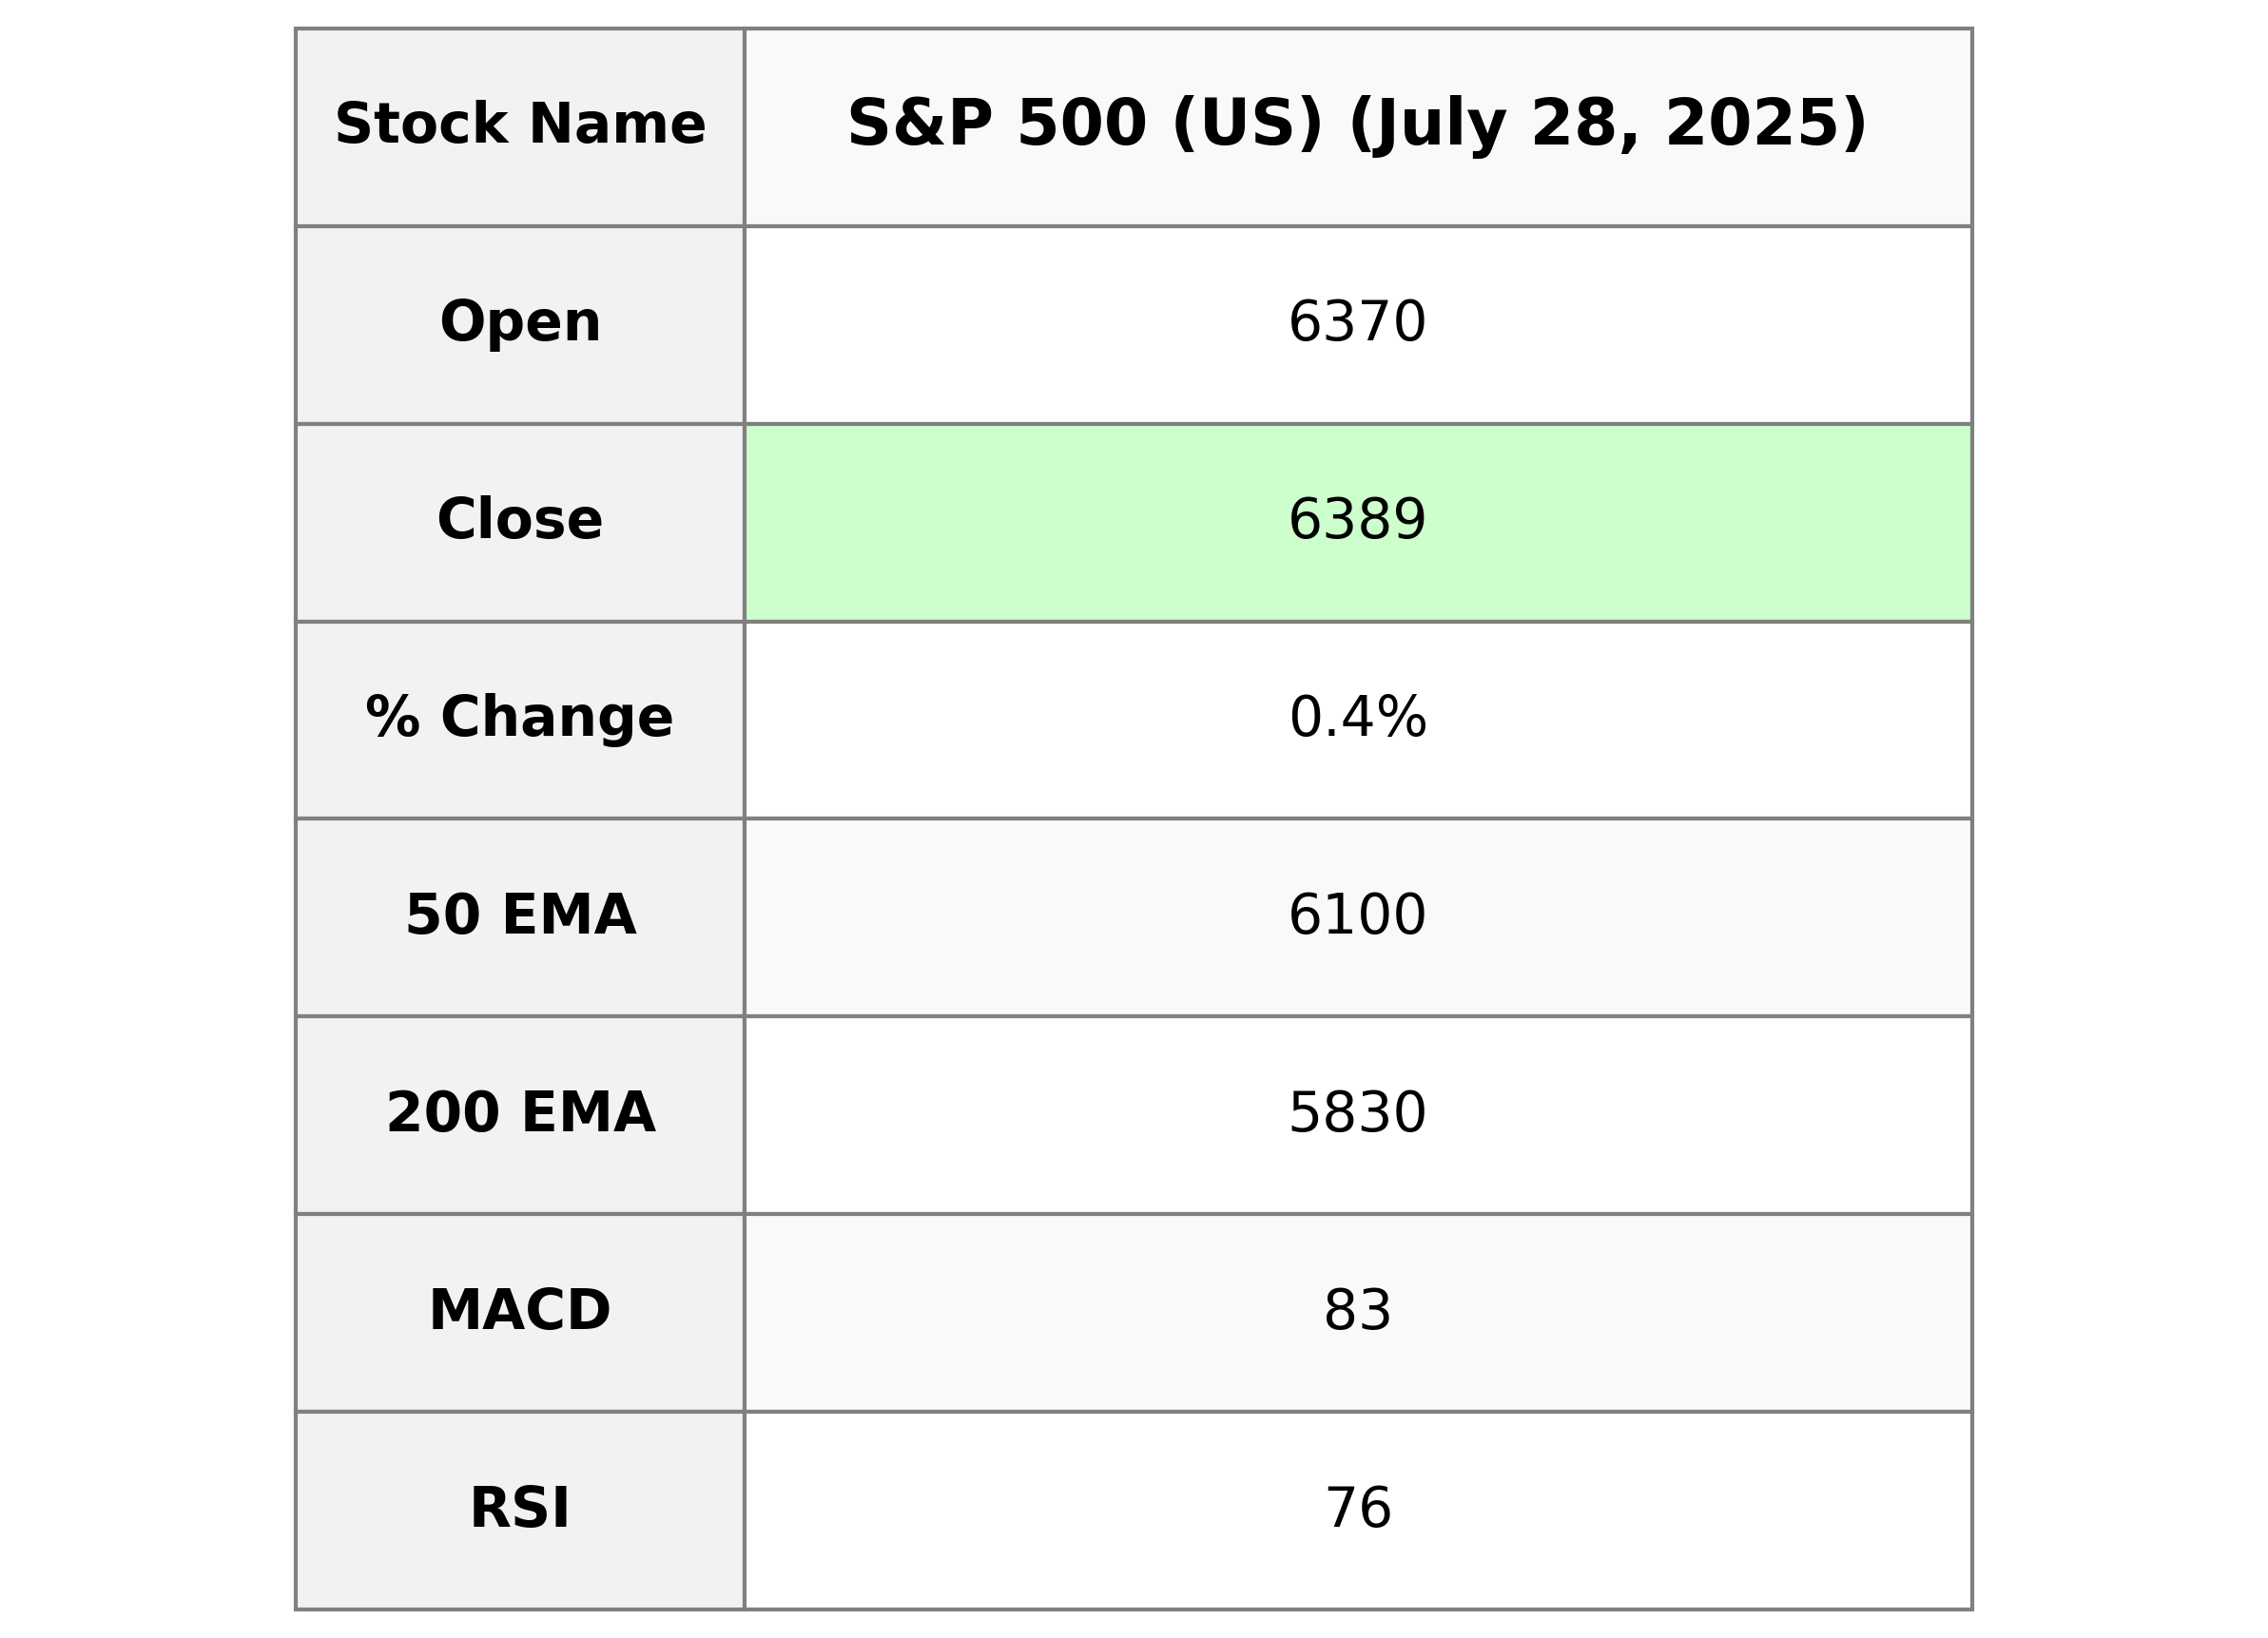
The S&P 500 (US) opened at 6370.01, reached a high of 6395.82, and closed at 6388.64, up 0.40% from the previous close. The index shows strong technical indicators, with an RSI of 76.21 suggesting it's overbought, and MACD is slightly below the signal line, indicating possible consolidation. EMAs suggest a strong uptrend in the short to medium term.
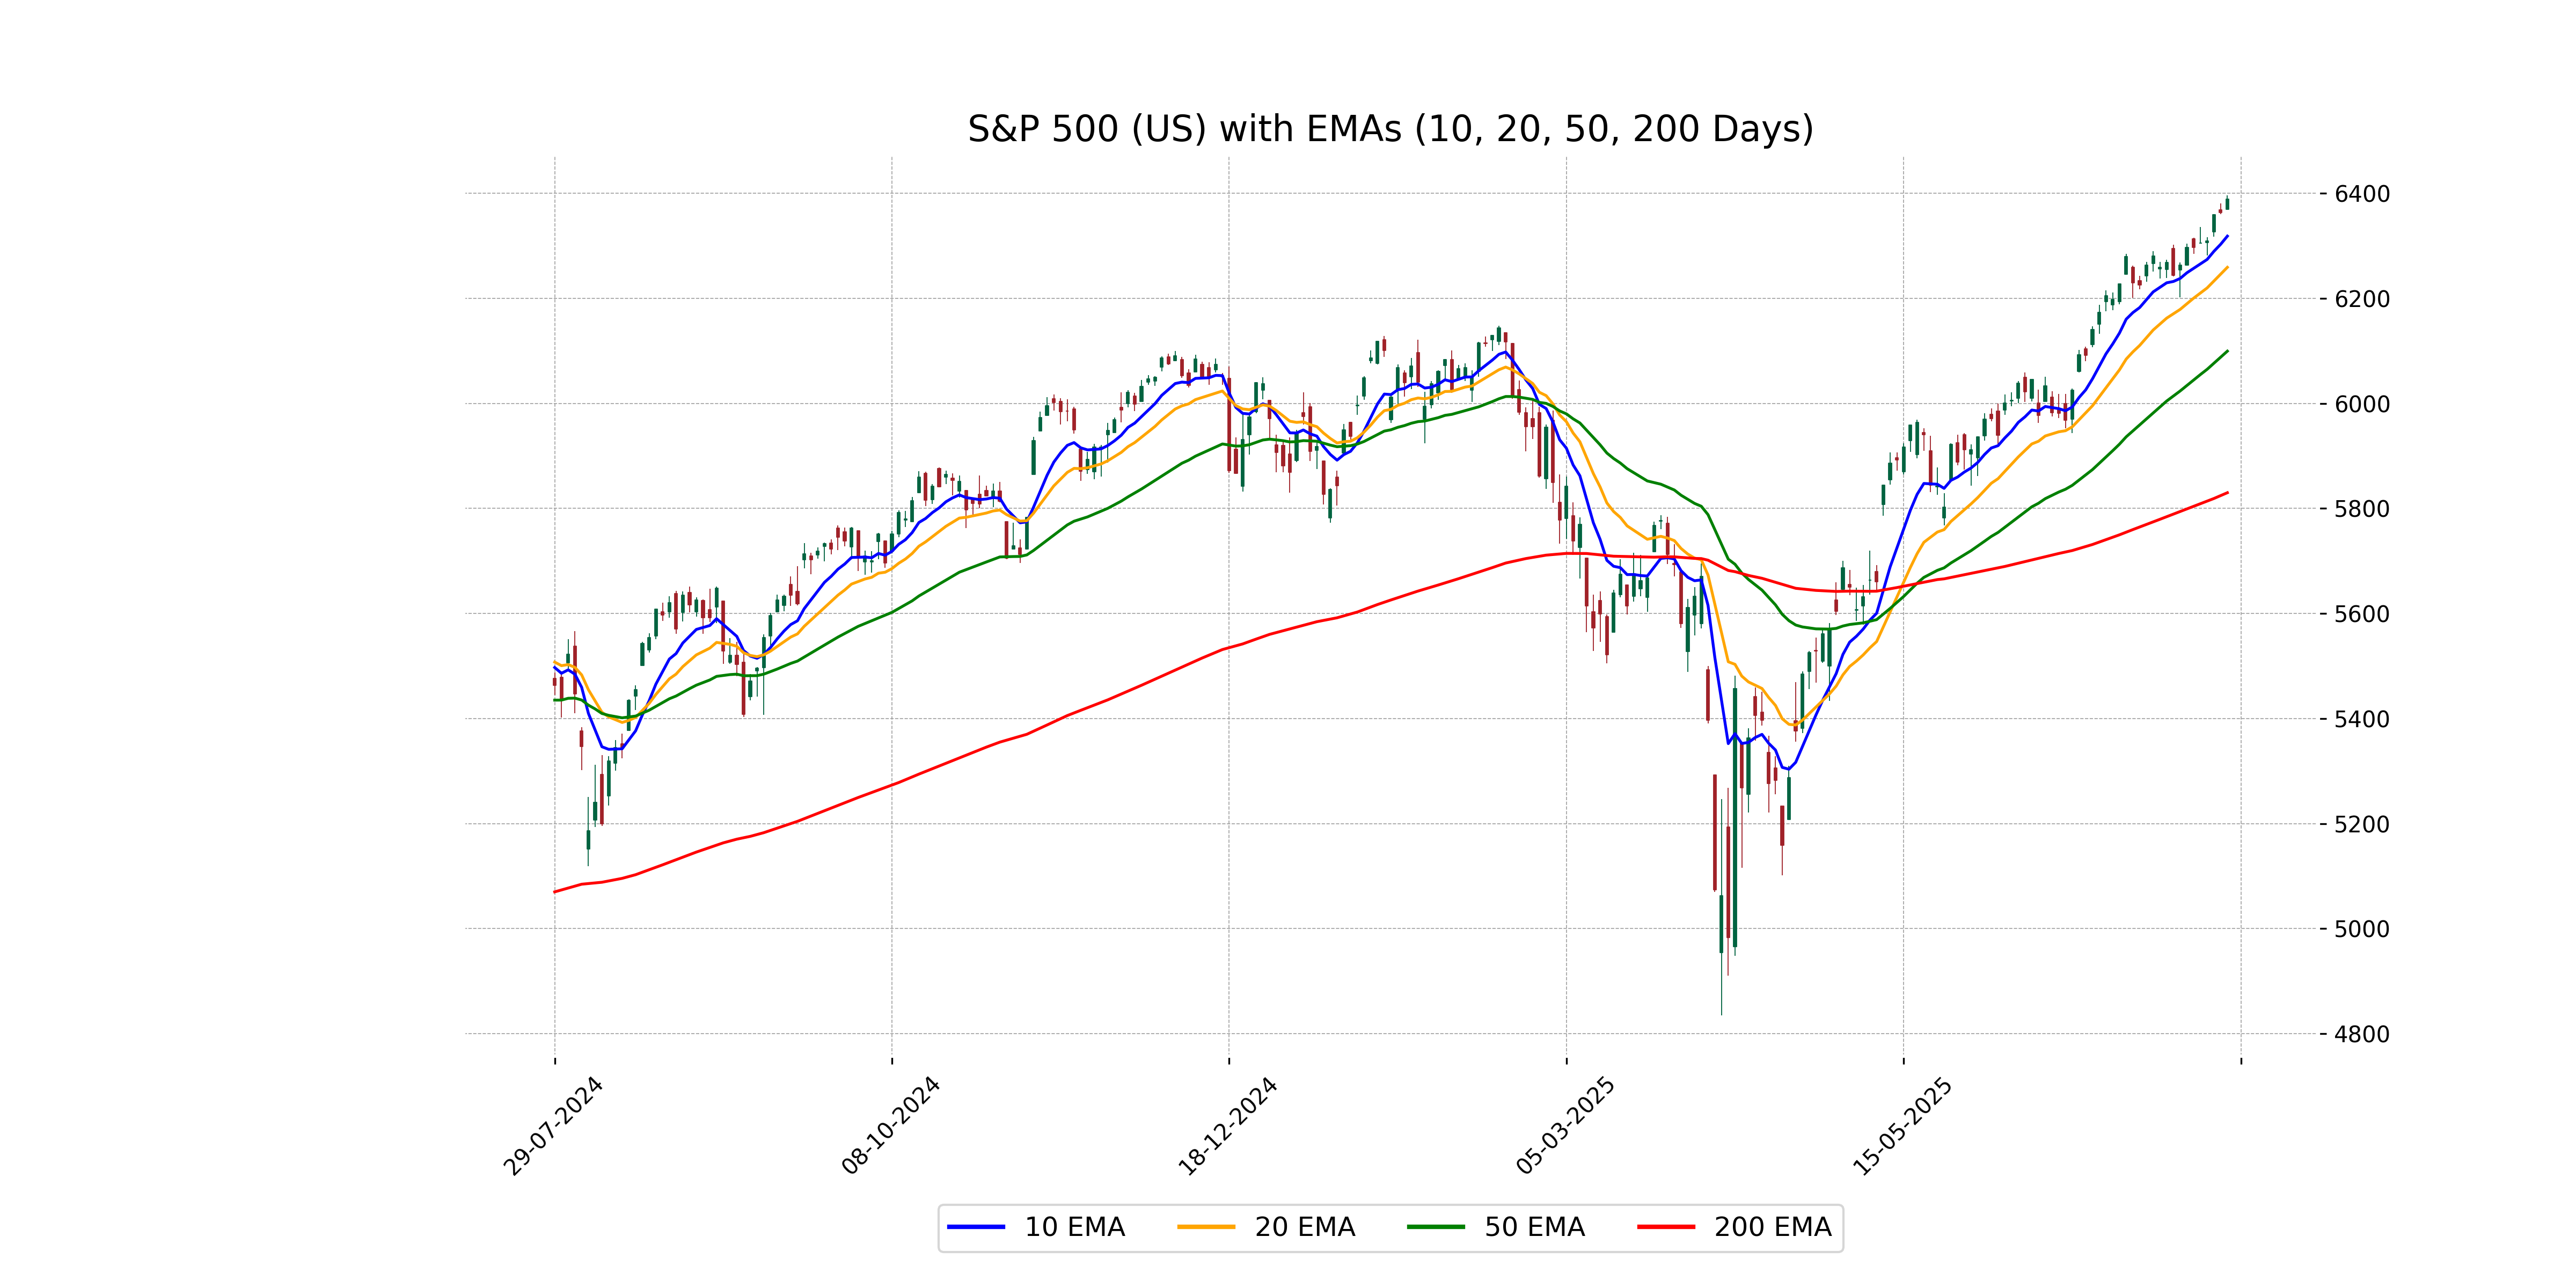
Relationship with Key Moving Averages
The S&P 500 closed at 6388.64, which is above all of its key moving averages, including the 10-day EMA at 6318.53, the 20-day EMA at 6259.17, the 50-day EMA at 6099.51, and the 200-day EMA at 5829.94. This suggests a strong upward trend in the market.
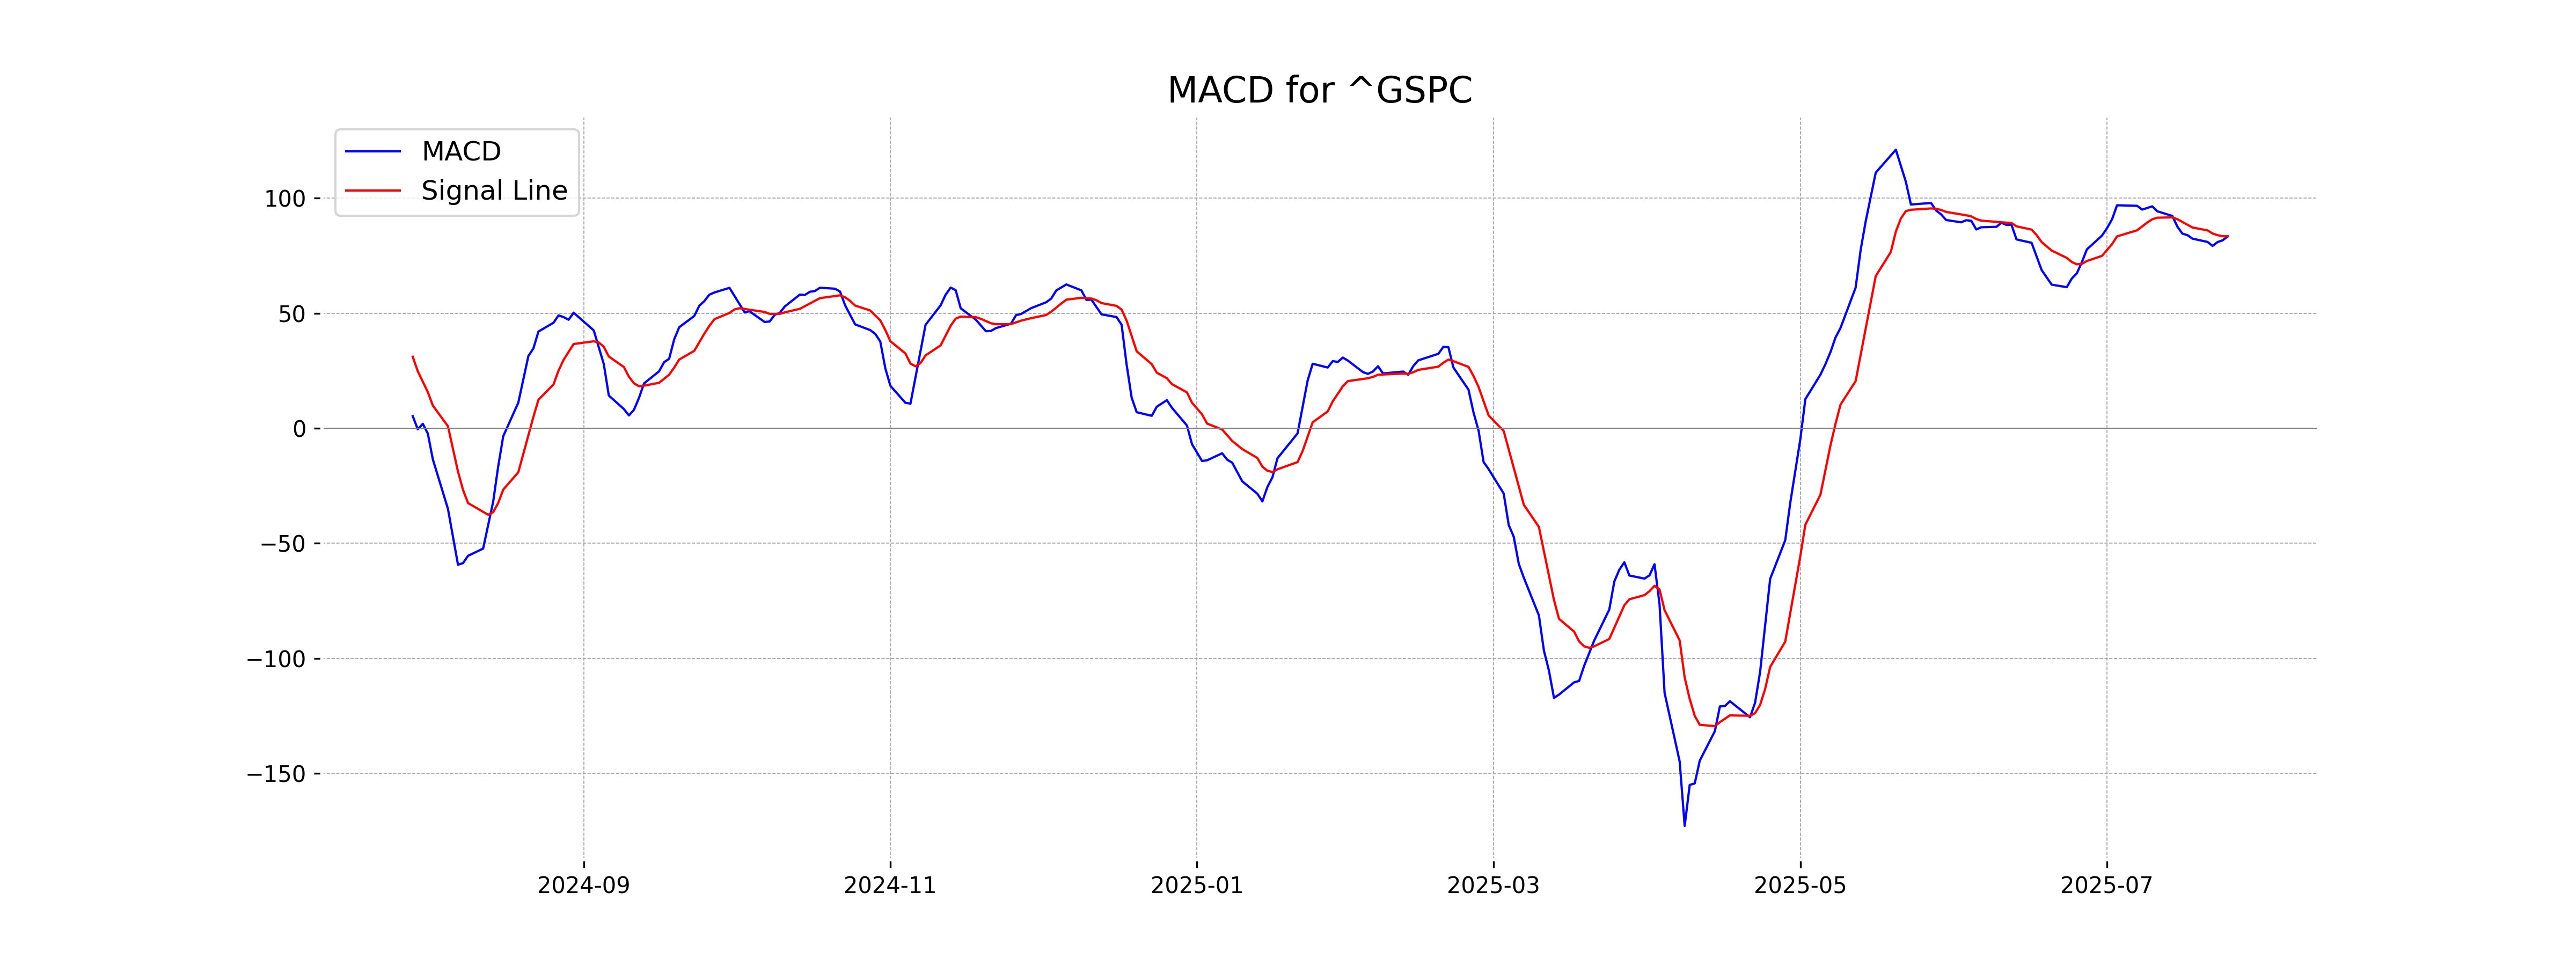
Moving Averages Trend (MACD)
The MACD for S&P 500 is 83.39, while the MACD Signal is 83.47. This close proximity suggests a potential crossover, indicating a possible shift in momentum. With the RSI at 76.21, the index is also in the overbought territory, which might signal a cautious outlook for further gains.
RSI Analysis
The S&P 500 demonstrates a Relative Strength Index (RSI) of 76.21, indicating that the index is in overbought territory. This suggests potential for a pullback or consolidation in the near term as it has crossed the typical overbought threshold of 70.
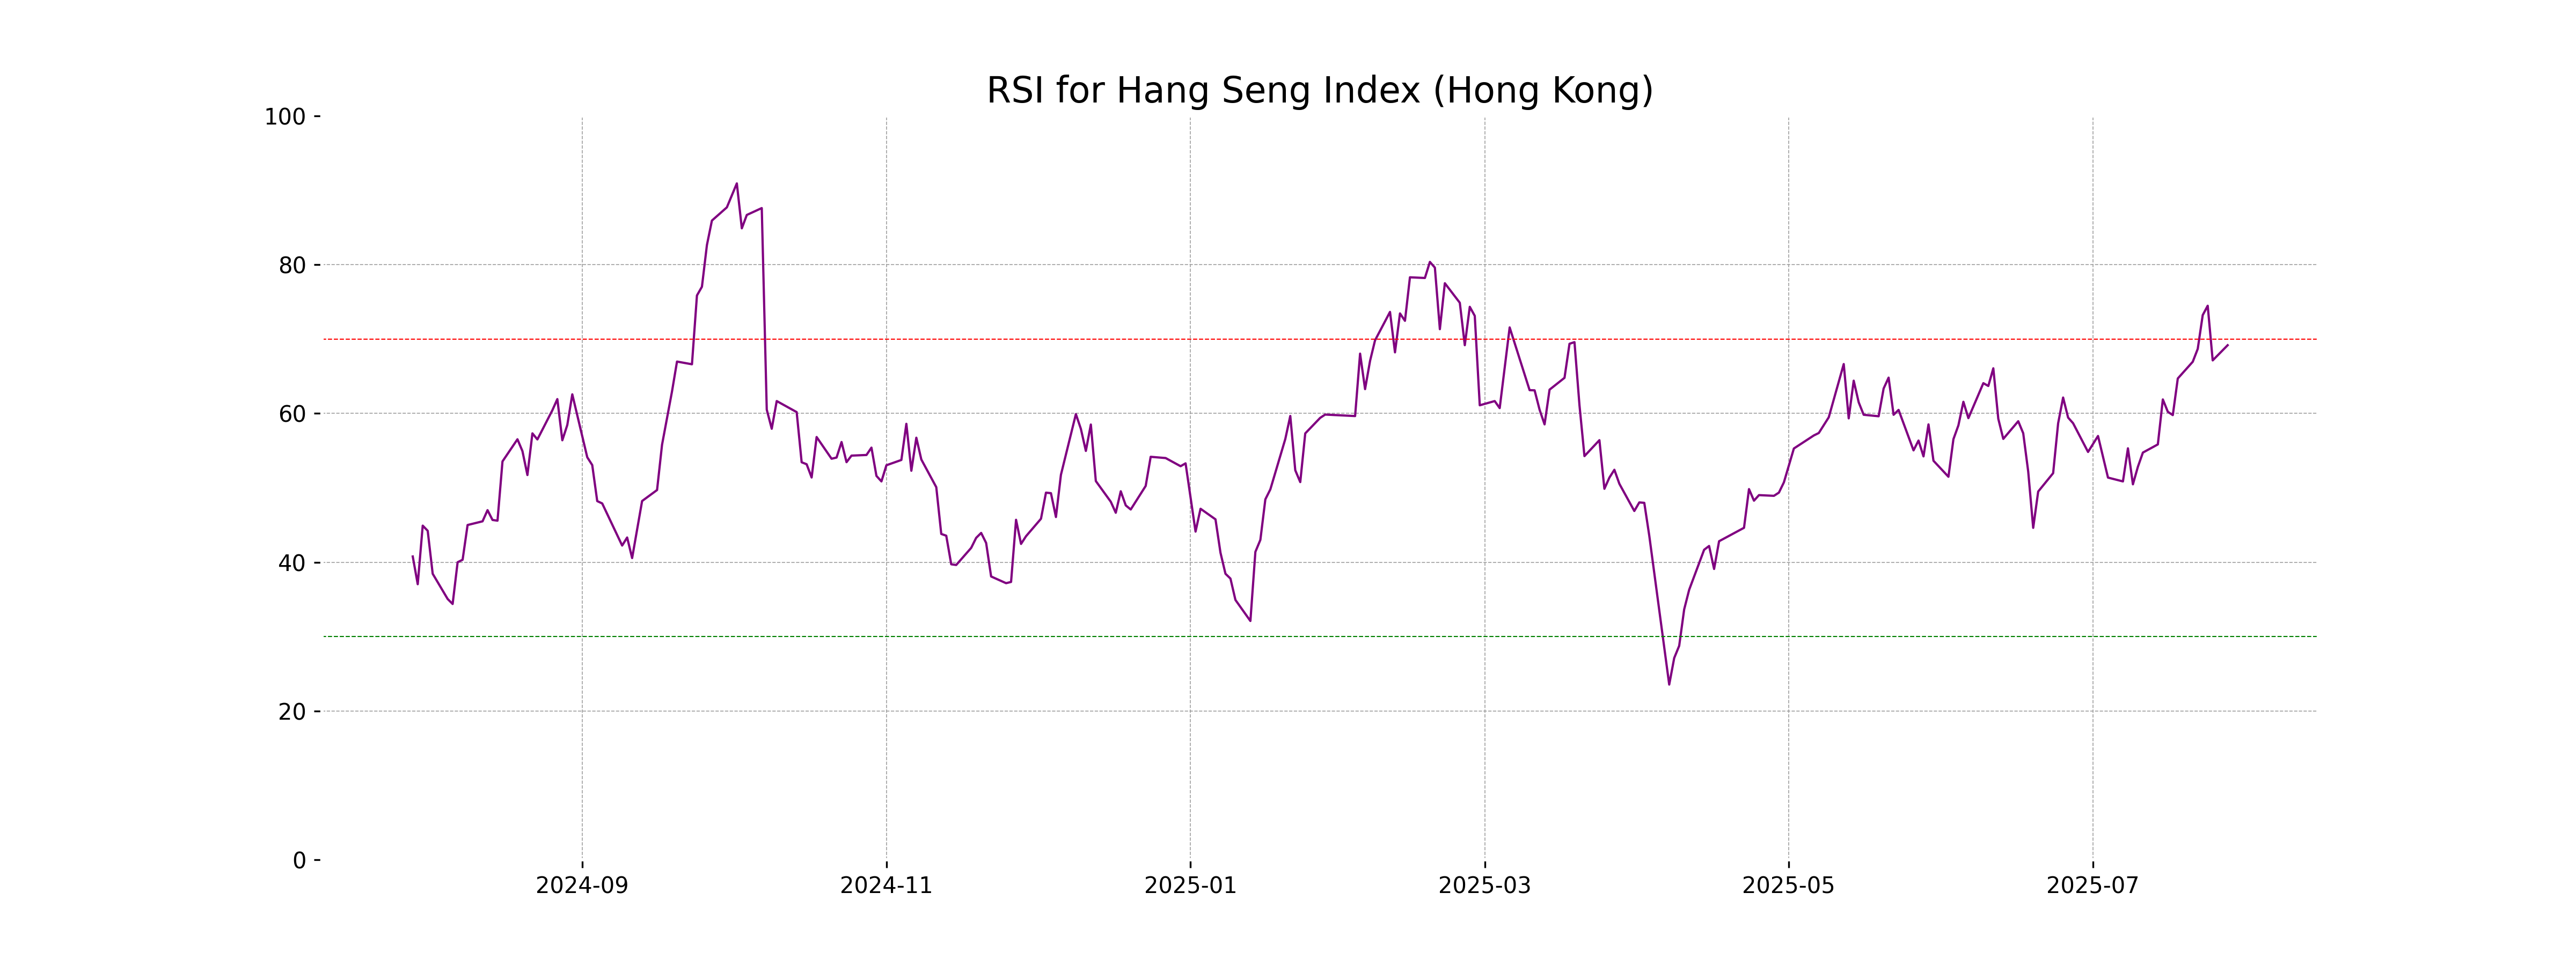
Analysis for Hang Seng Index (Hong Kong) - July 28, 2025
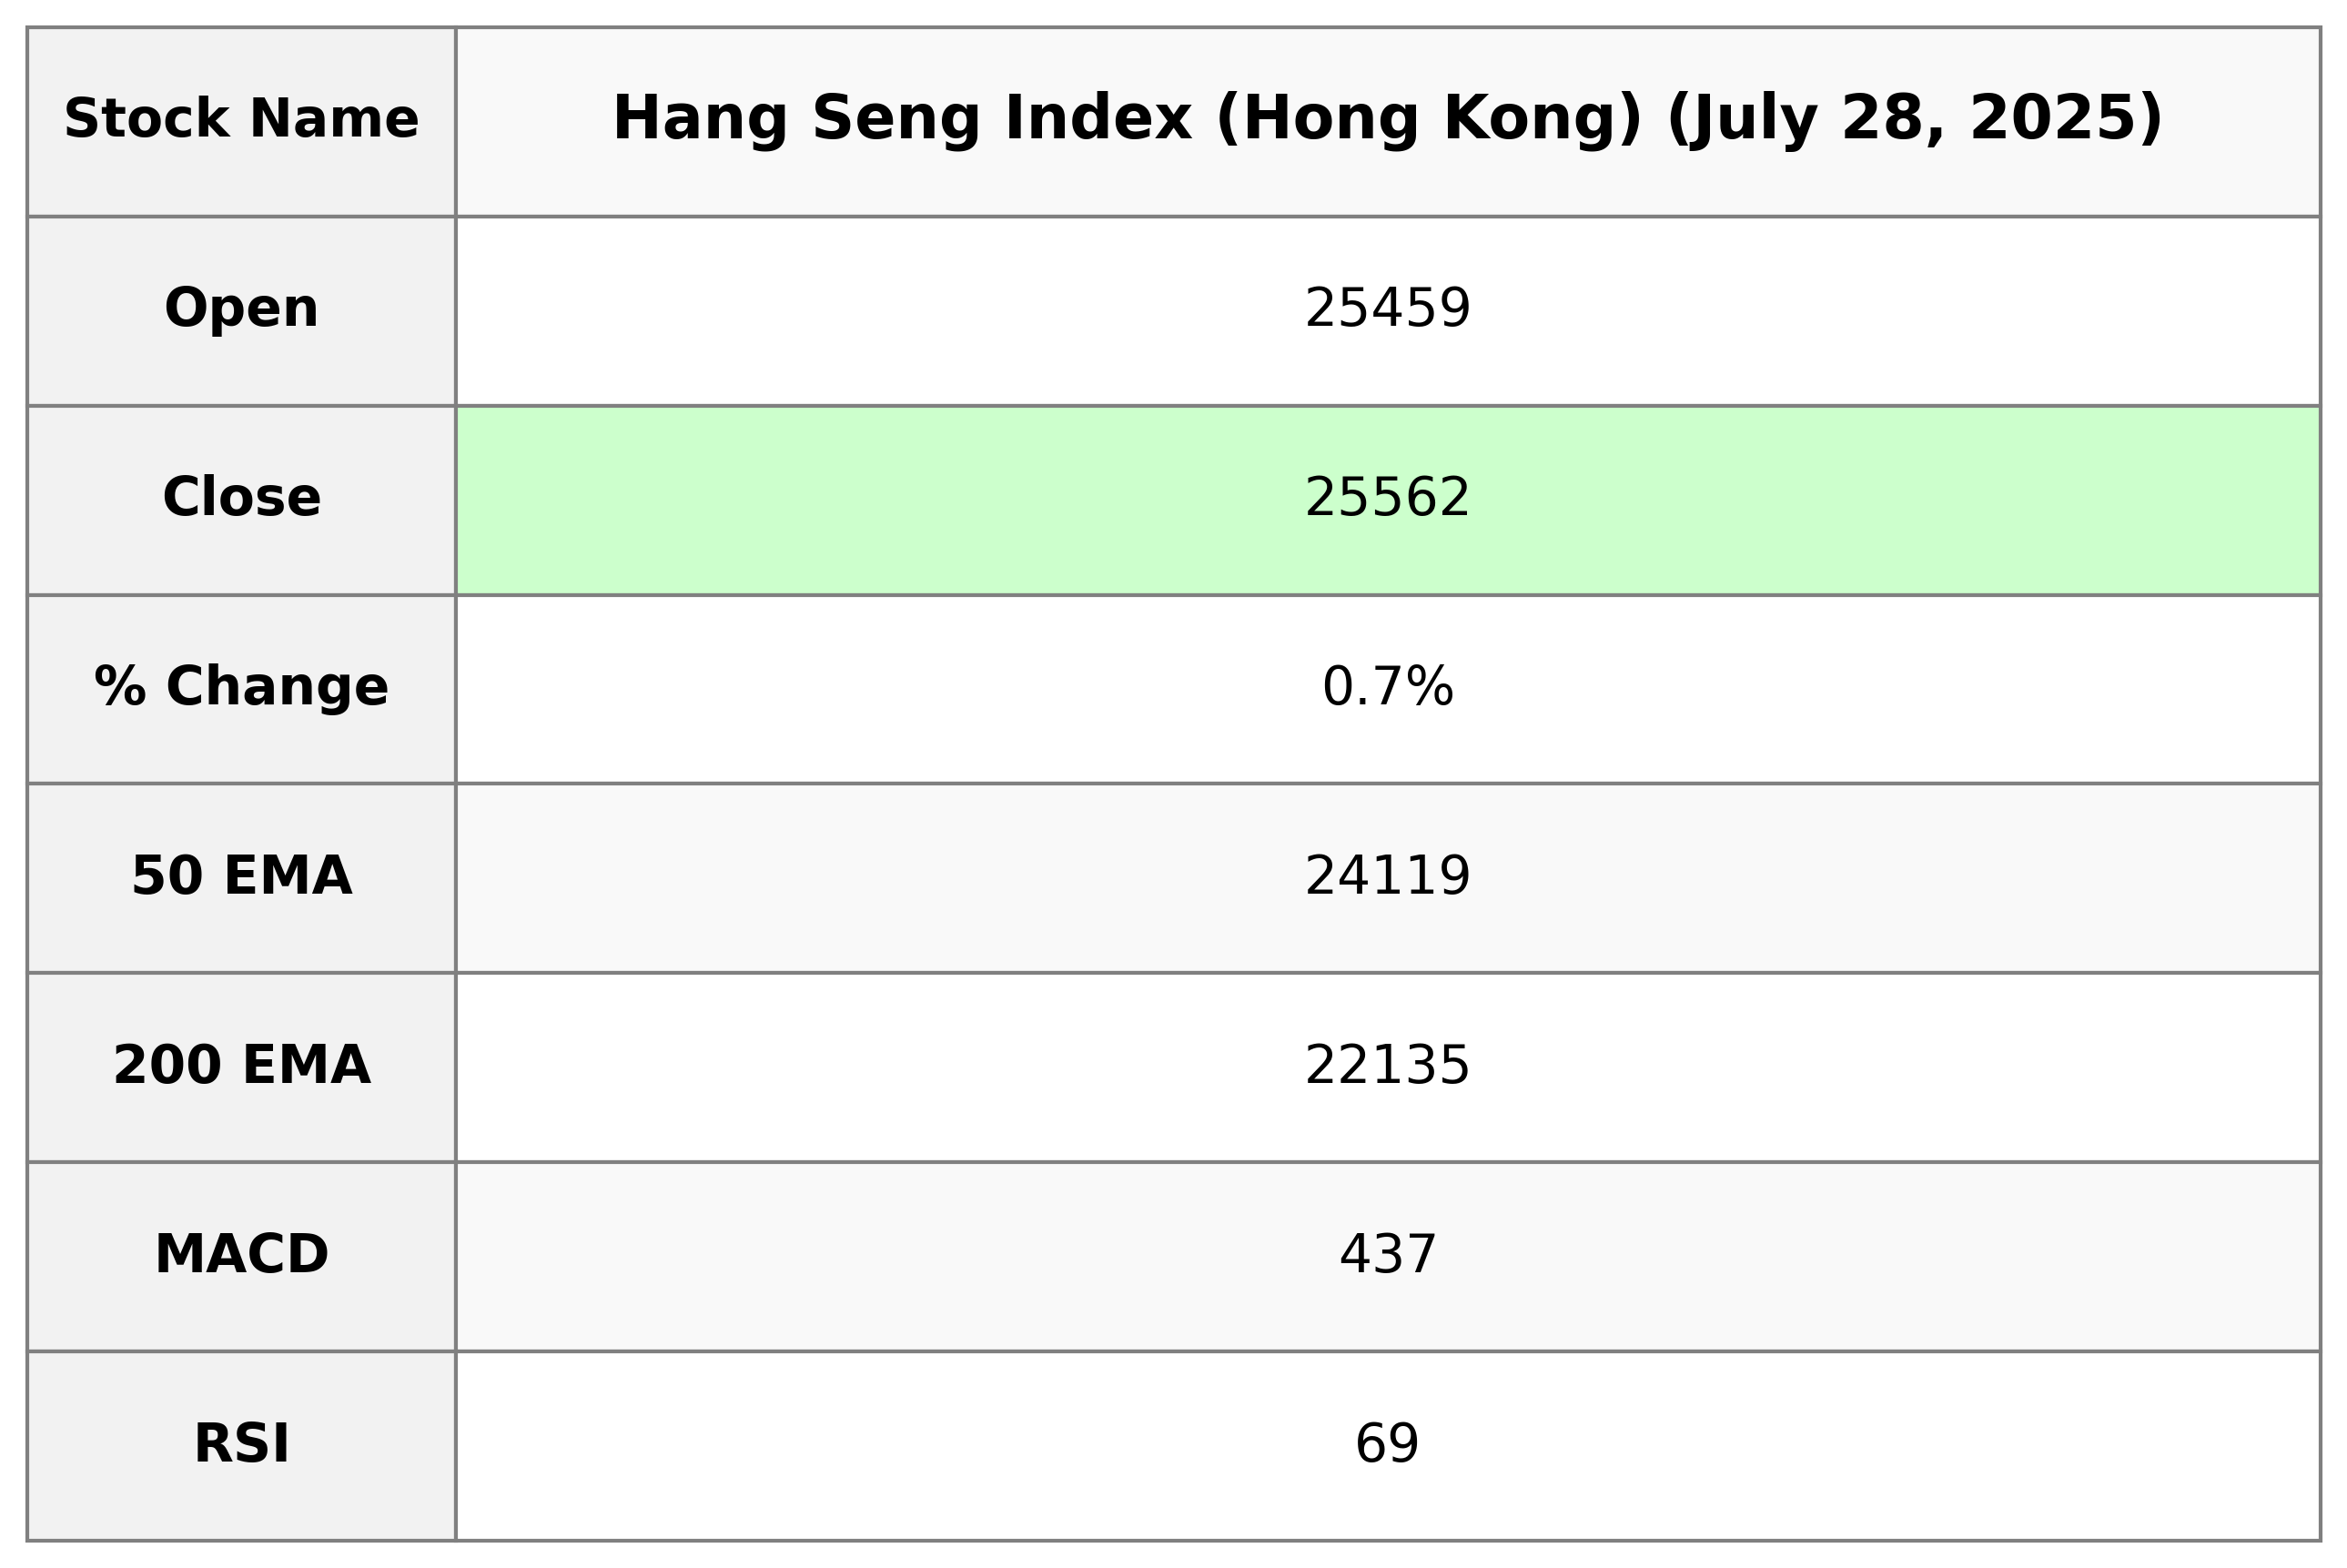
The Hang Seng Index opened at 25,458.87, reached a high of 25,667.40 and a low of 25,399.36, and closed at 25,562.13, reflecting a 0.68% increase with a points change of 173.78 from the previous close. The index shows strong momentum with an RSI of 69.17 and a positive MACD indicating bullish conditions, with its 10 EMA above the 50, 20, and 200 EMA, suggesting a short-term uptrend.
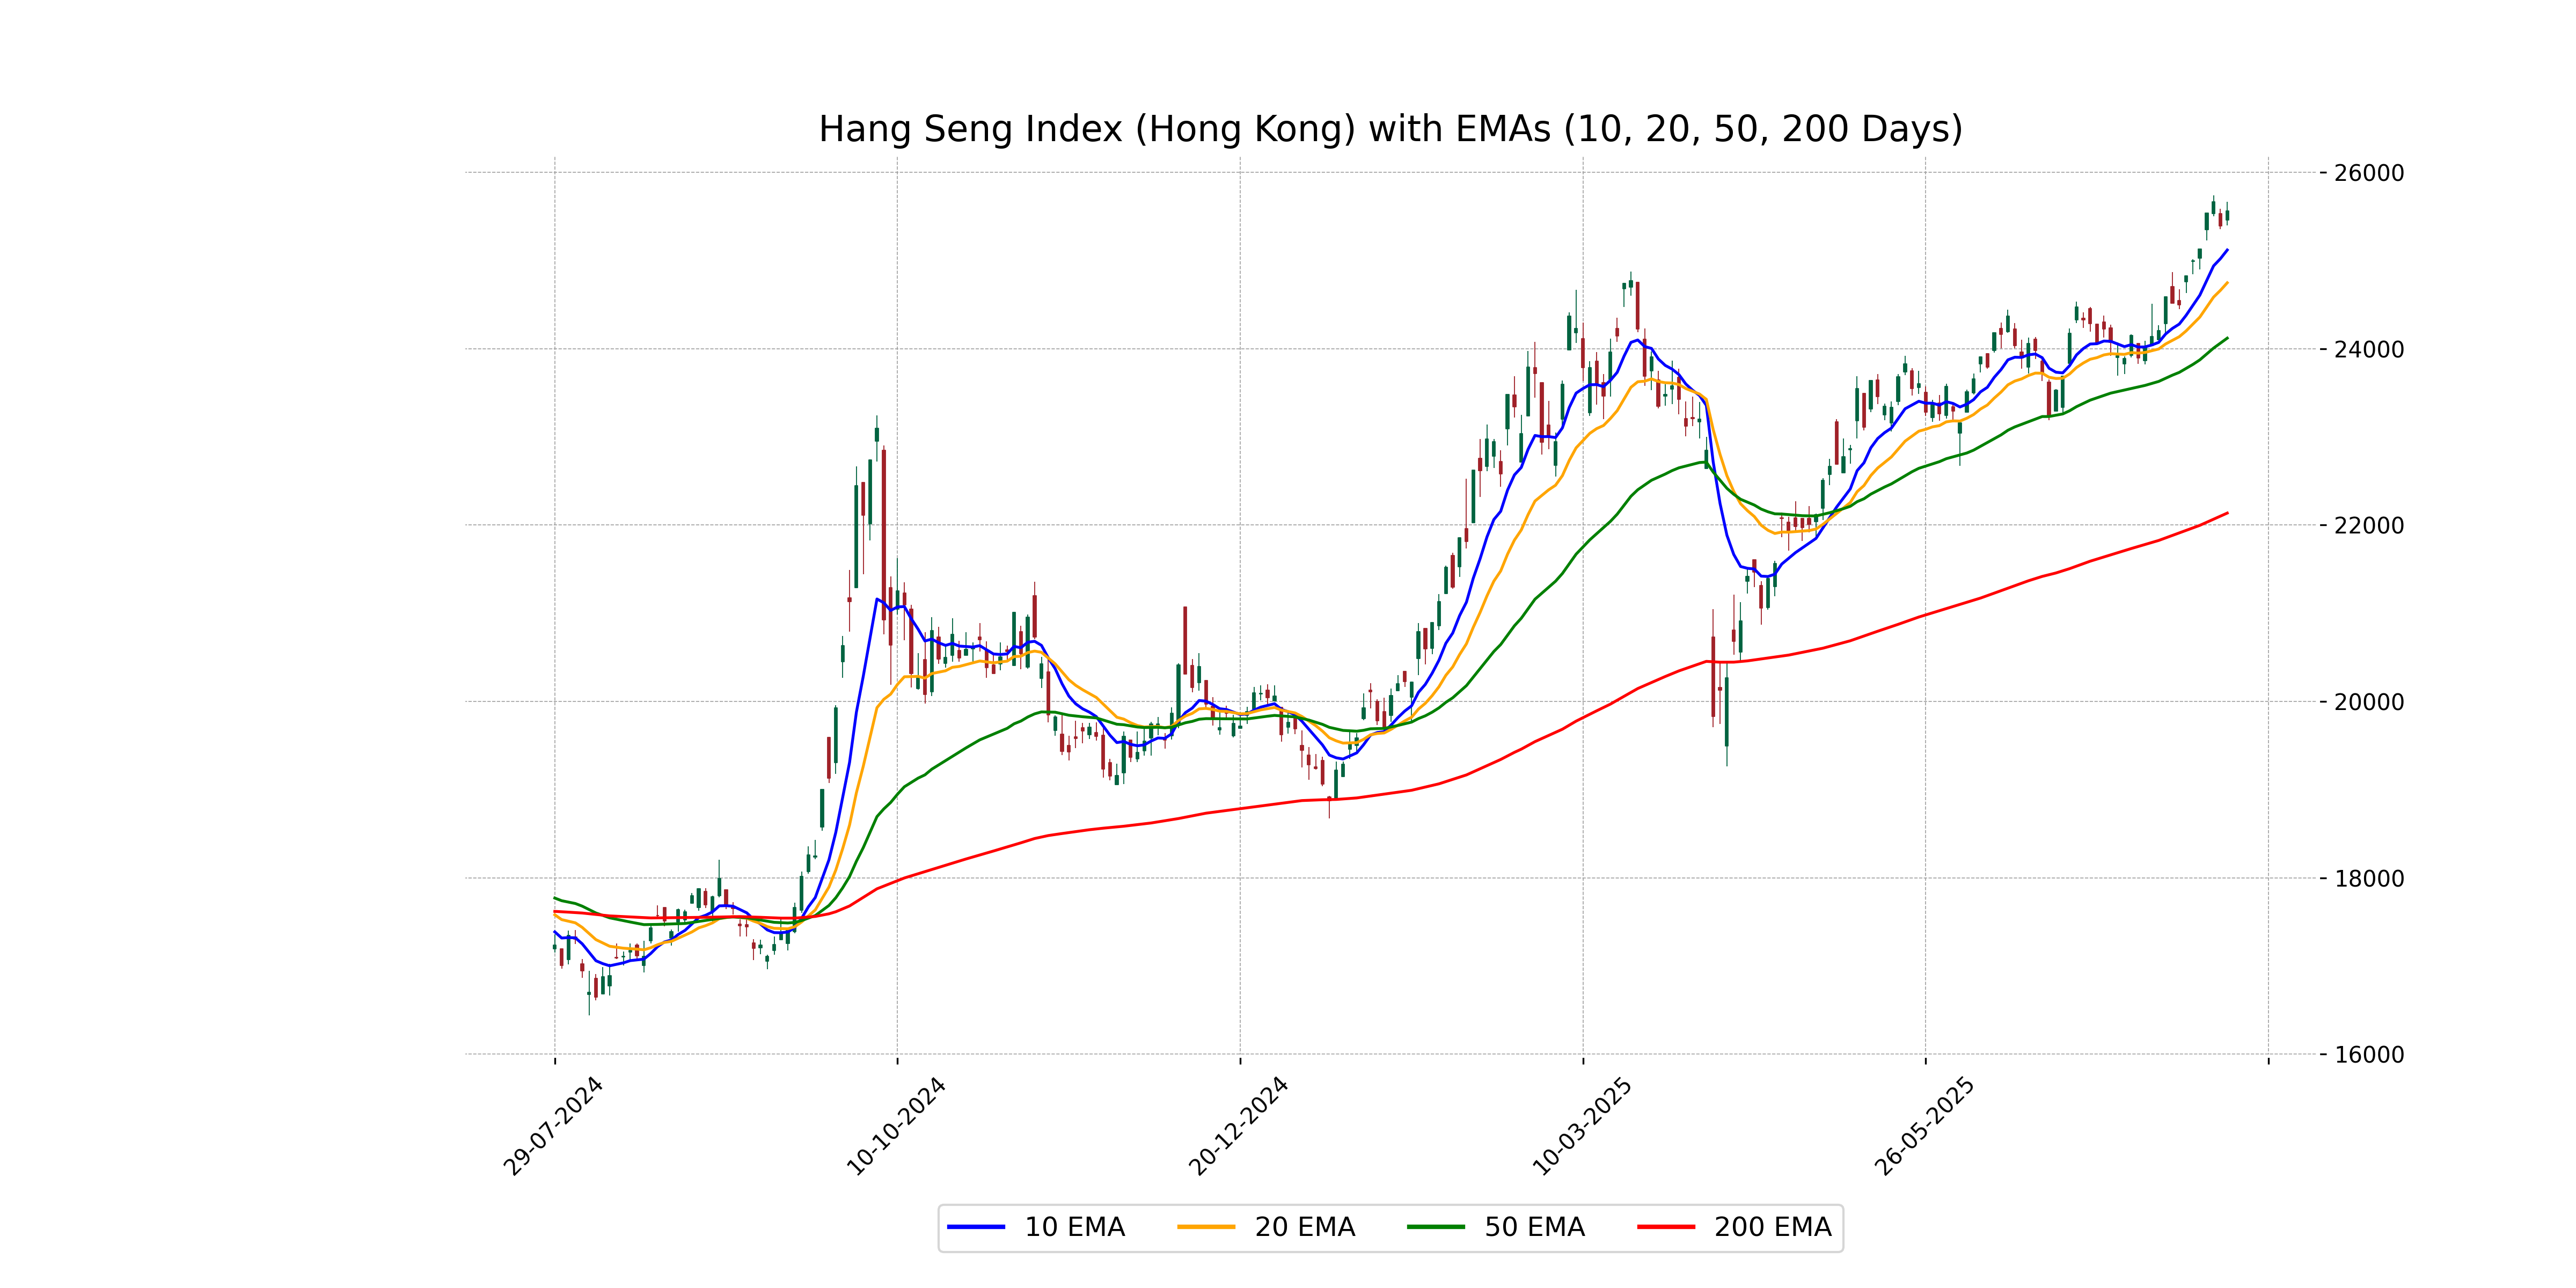
Relationship with Key Moving Averages
The Hang Seng Index is trading above its key moving averages, with the close at 25,562.13 surpassing the 10 EMA (25,118.34), 20 EMA (24,746.57), 50 EMA (24,118.87), and 200 EMA (22,135.17). This indicates a positive upward trend, supported by a high RSI value of 69.17, suggesting strong momentum.
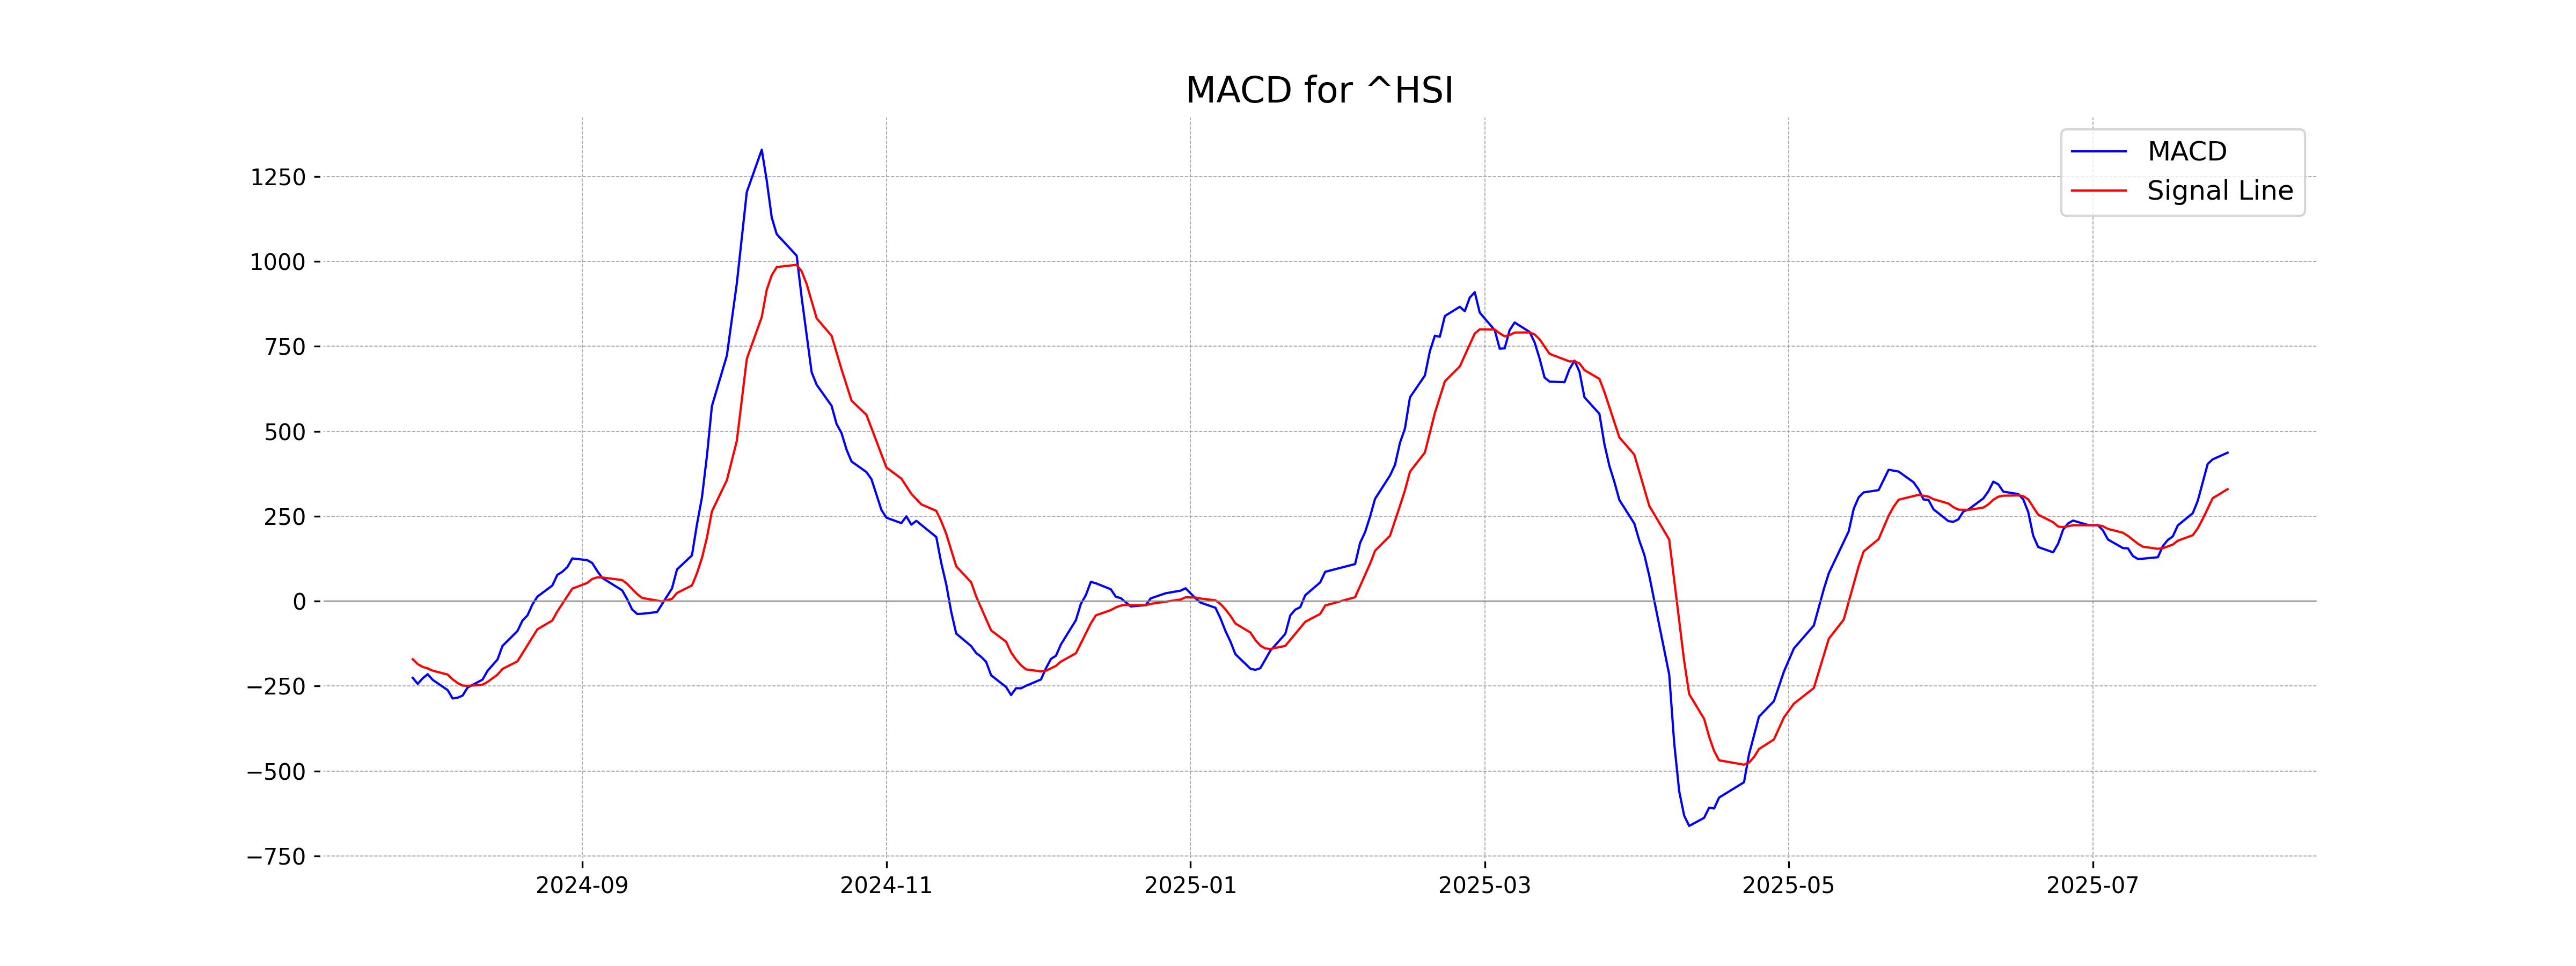
Moving Averages Trend (MACD)
The Hang Seng Index (Hong Kong) is currently exhibiting a bullish trend as indicated by the MACD, which is at 436.92, above the MACD Signal line at 329.68. This suggests a positive momentum in the market.
RSI Analysis
The Relative Strength Index (RSI) for the Hang Seng Index is currently at 69.17, which suggests that the market is nearing overbought conditions. Typically, an RSI above 70 indicates that the asset may be overvalued, and a reversal or correction might be due. Investors should monitor further movements of the index closely.
Analysis for IBEX 35 (Spain) - July 28, 2025

The IBEX 35 index opened at 14,367.60 and closed at 14,382.60, marking an increase from its previous close of 14,237.30. The index experienced a percentage change of 1.02% and a points change of 145.30 with a trading volume of 38,340,446. Key indicators such as the RSI at 64.40 suggest positive momentum, while the MACD is significantly higher than its signal line, indicating a bullish trend.
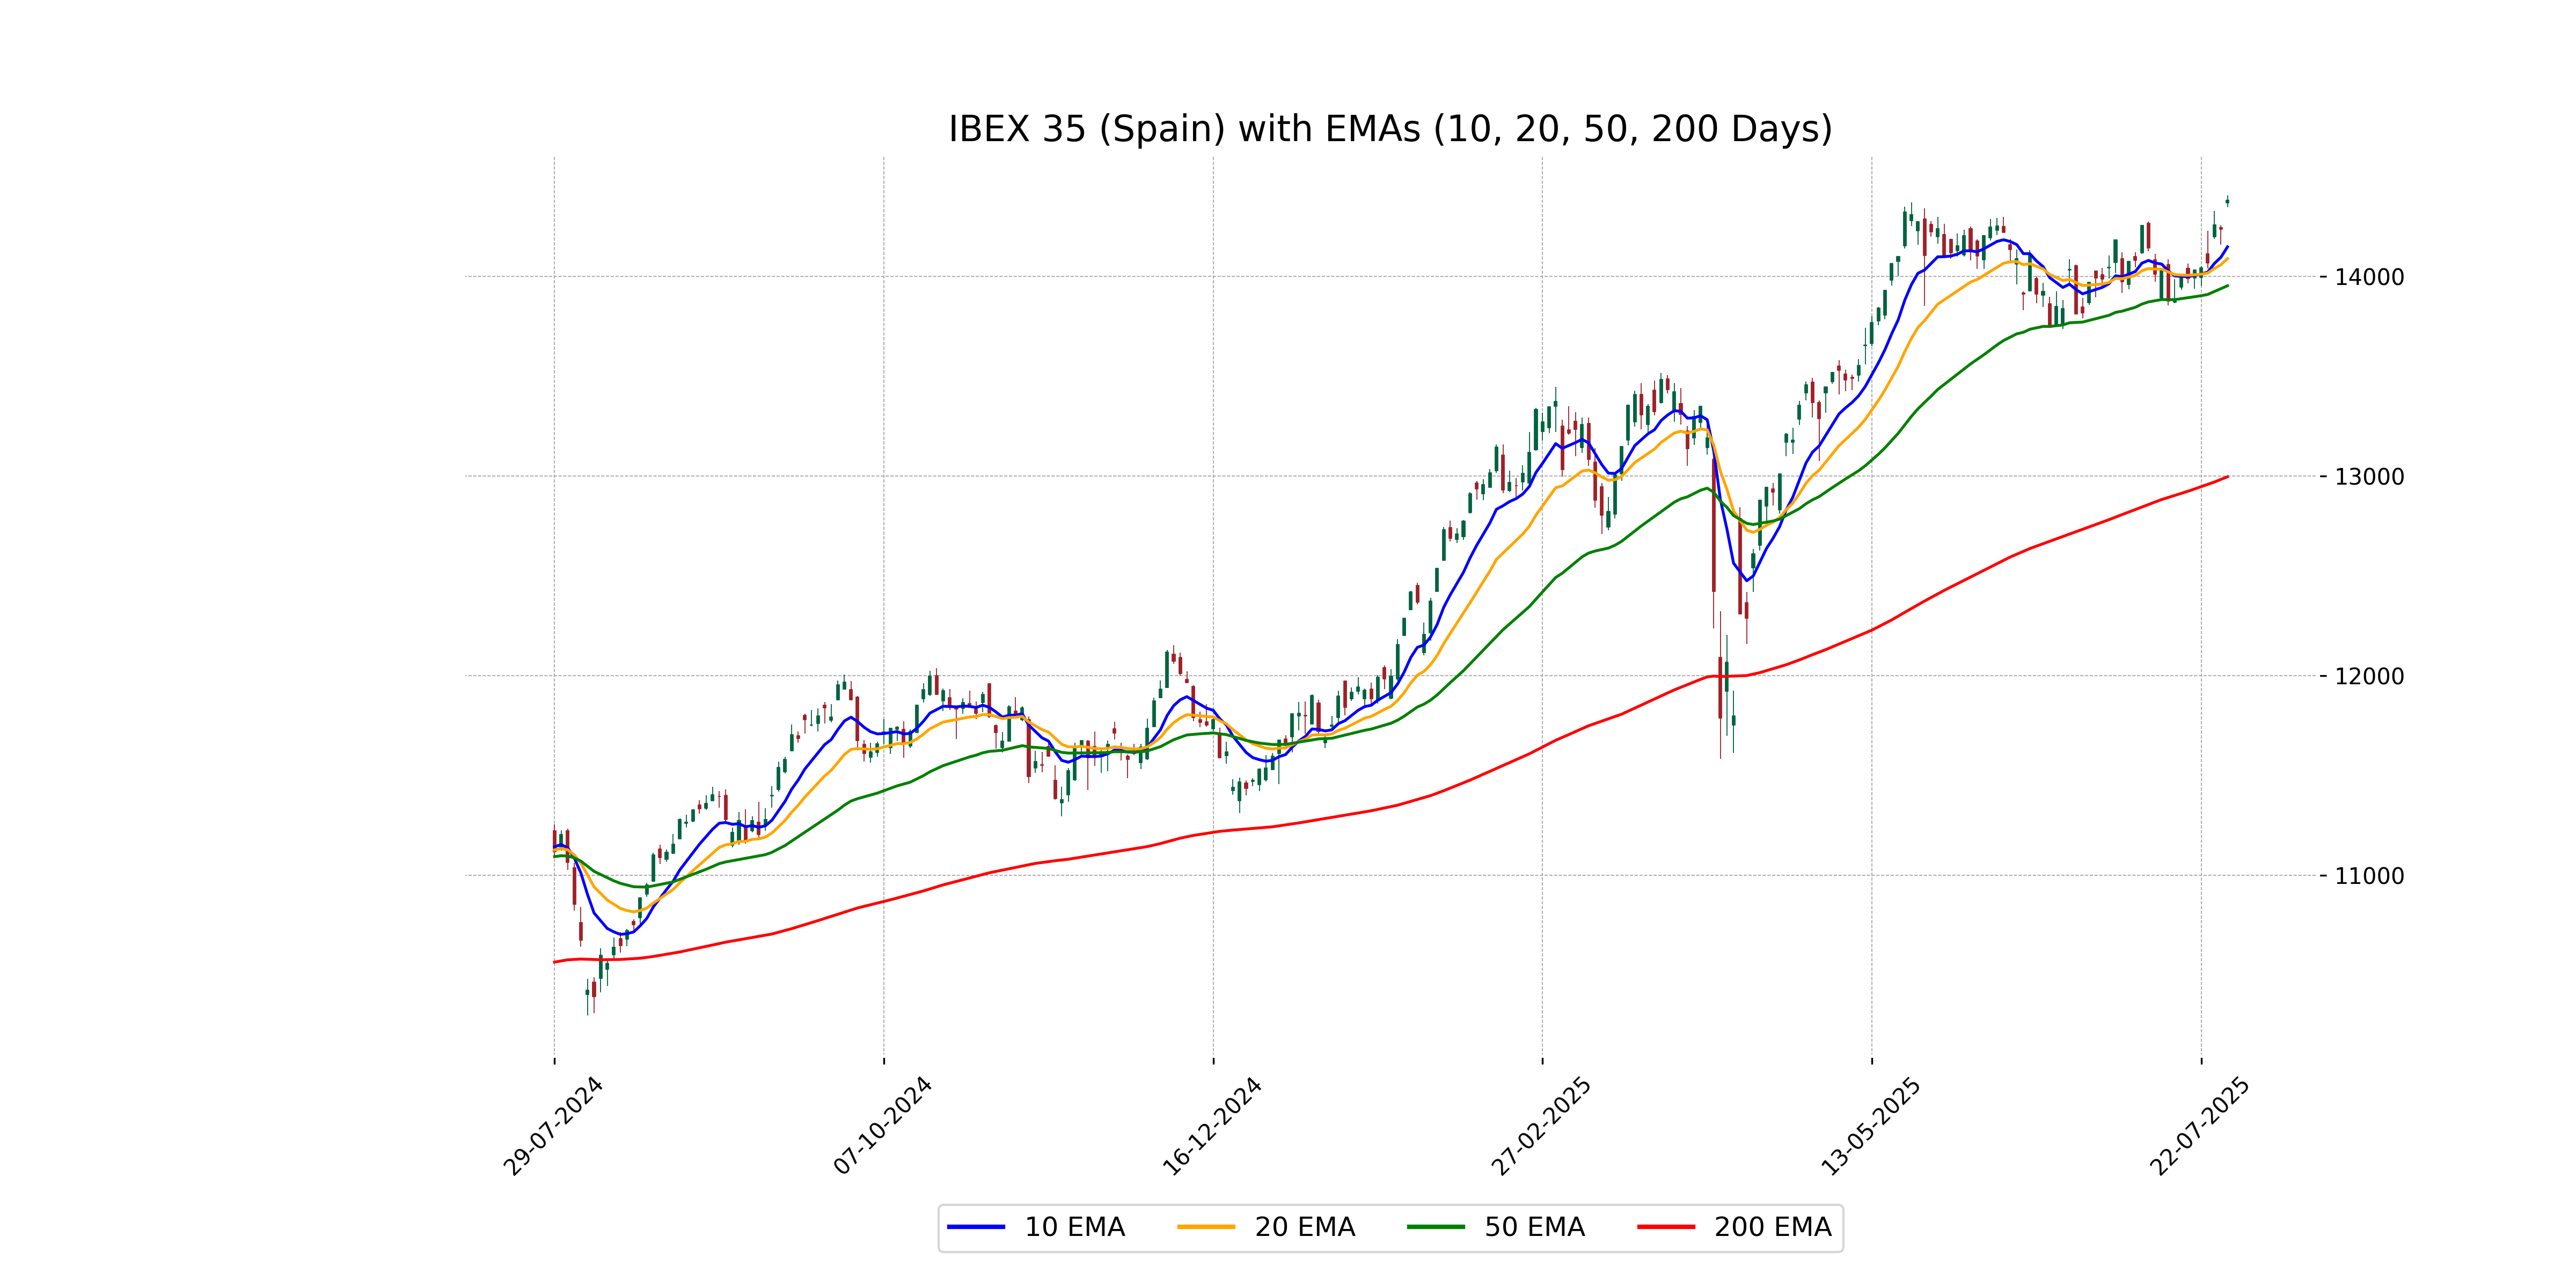
Relationship with Key Moving Averages
The IBEX 35's current close of 14382.60 is above its 50 EMA of 13952.65 and 200 EMA of 12995.97, indicating a bullish trend. The index also surpasses its 10 EMA of 14147.79 and 20 EMA of 14088.80, suggesting positive short-to-medium term momentum.
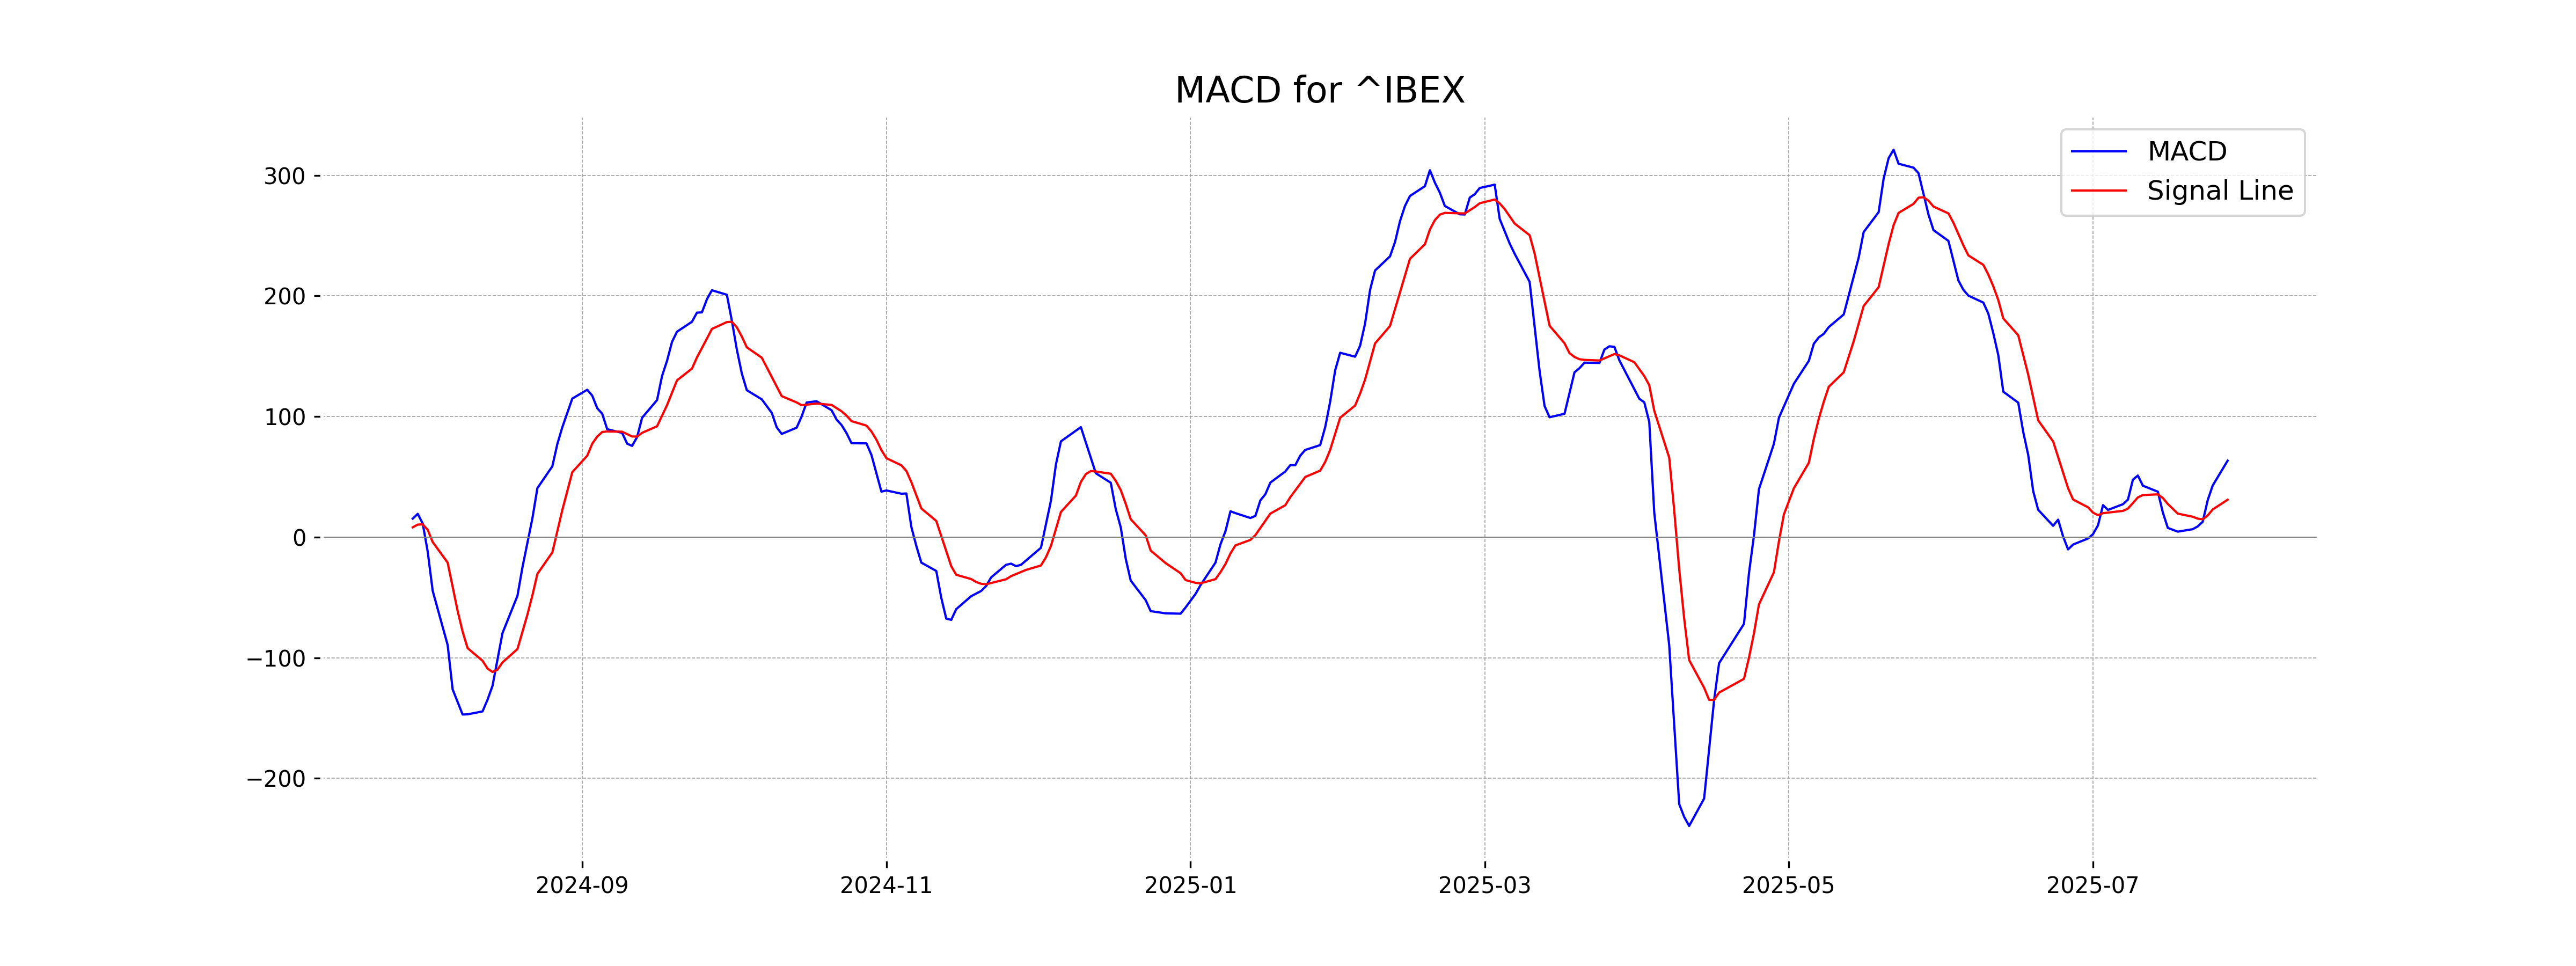
Moving Averages Trend (MACD)
Stock index IBEX 35 (Spain) is currently showing a bullish trend as indicated by its MACD value of 63.40, which is above the MACD Signal of 31.02. This suggests upward momentum and potential for continued price increase, especially with an RSI of 64.40 nearing overbought territory.
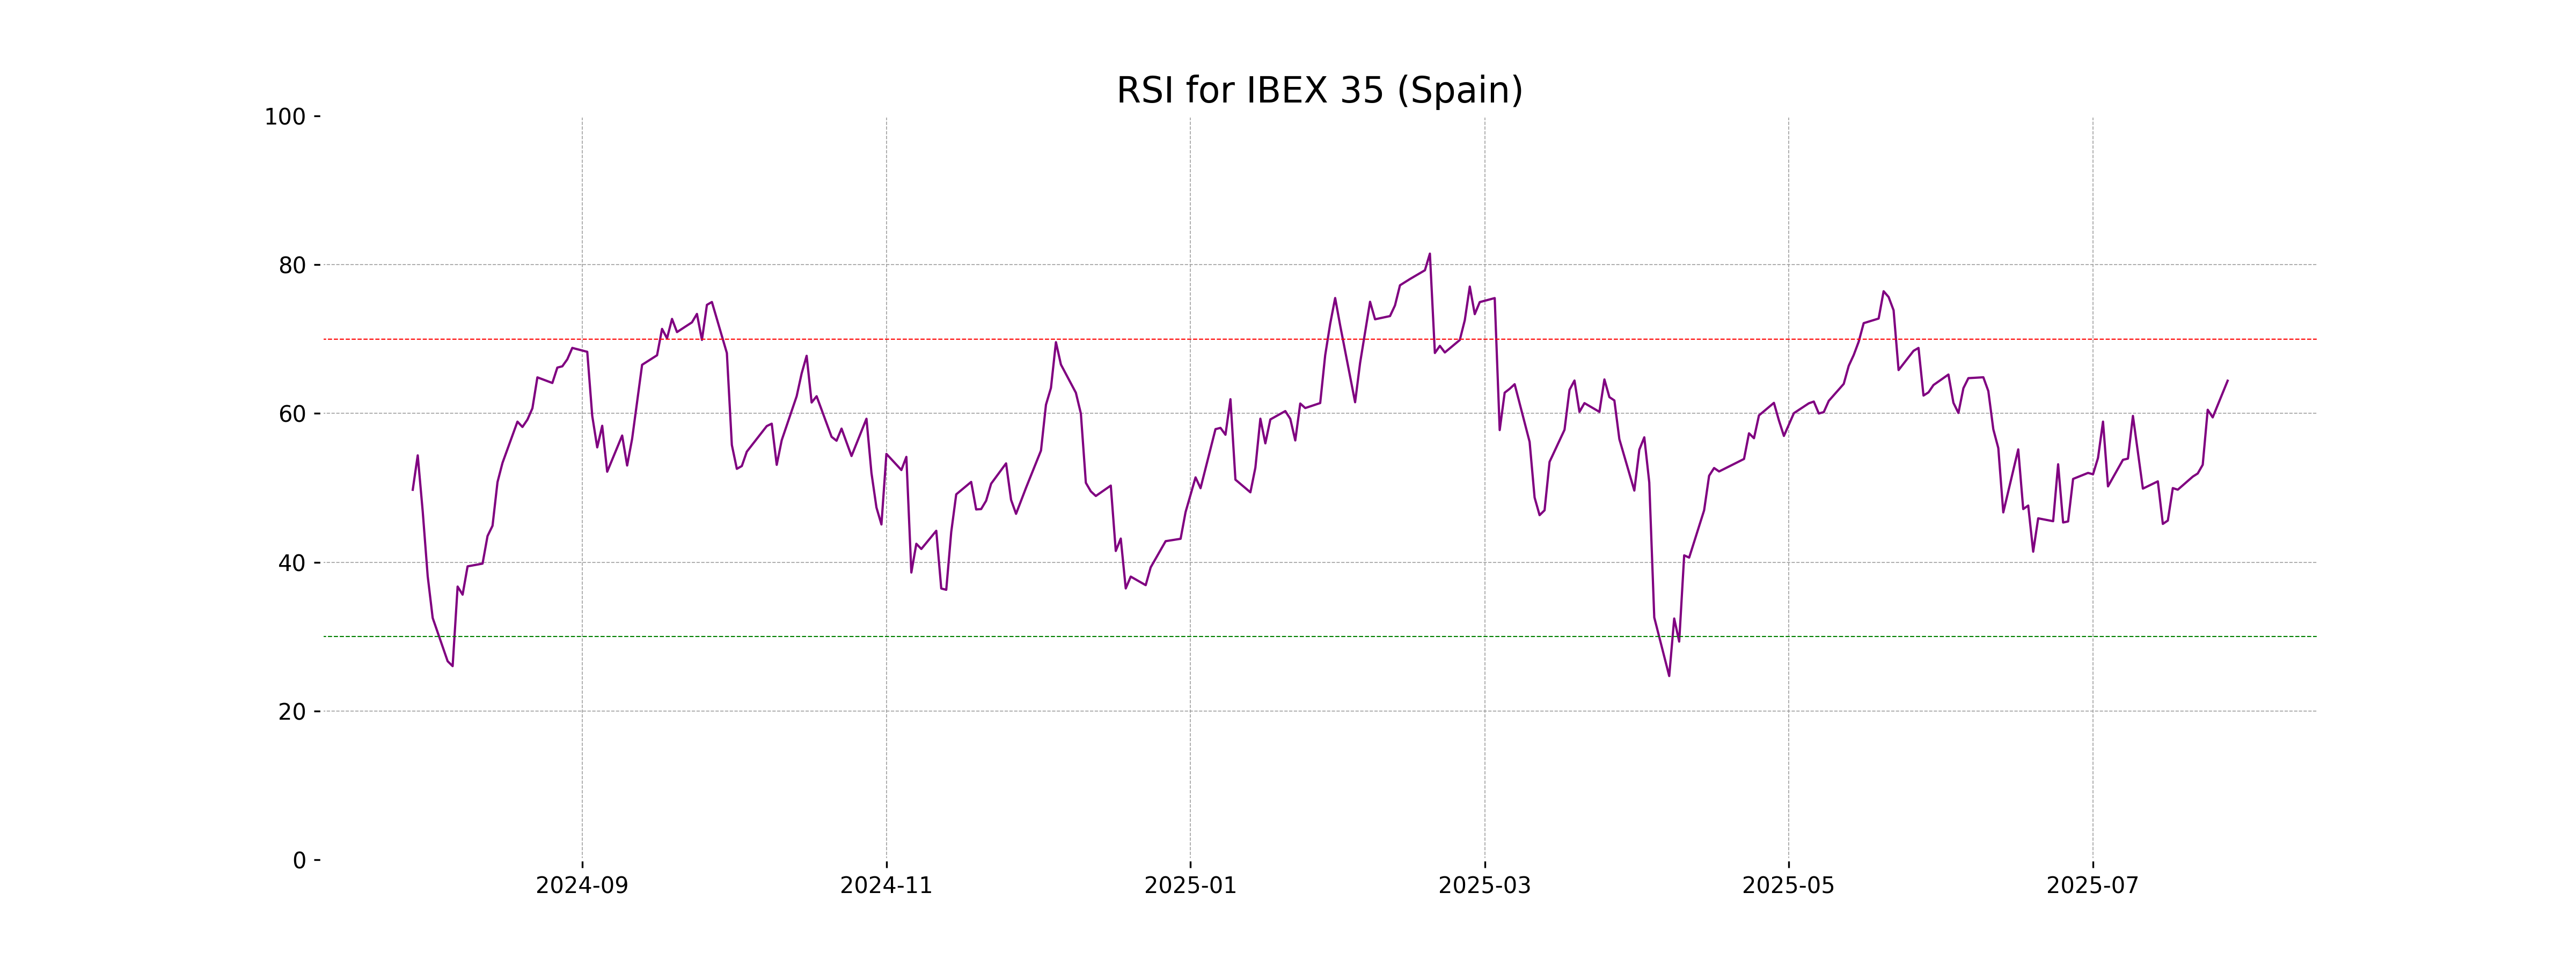
RSI Analysis
The RSI for IBEX 35 (Spain) is 64.40, indicating that the index is approaching an overbought condition but is not yet in the overbought range, which generally suggests caution for potential buyers. Traders may use this as a signal to look for possible trend reversals or selling opportunities.
Analysis for NASDAQ Composite (US) - July 28, 2025
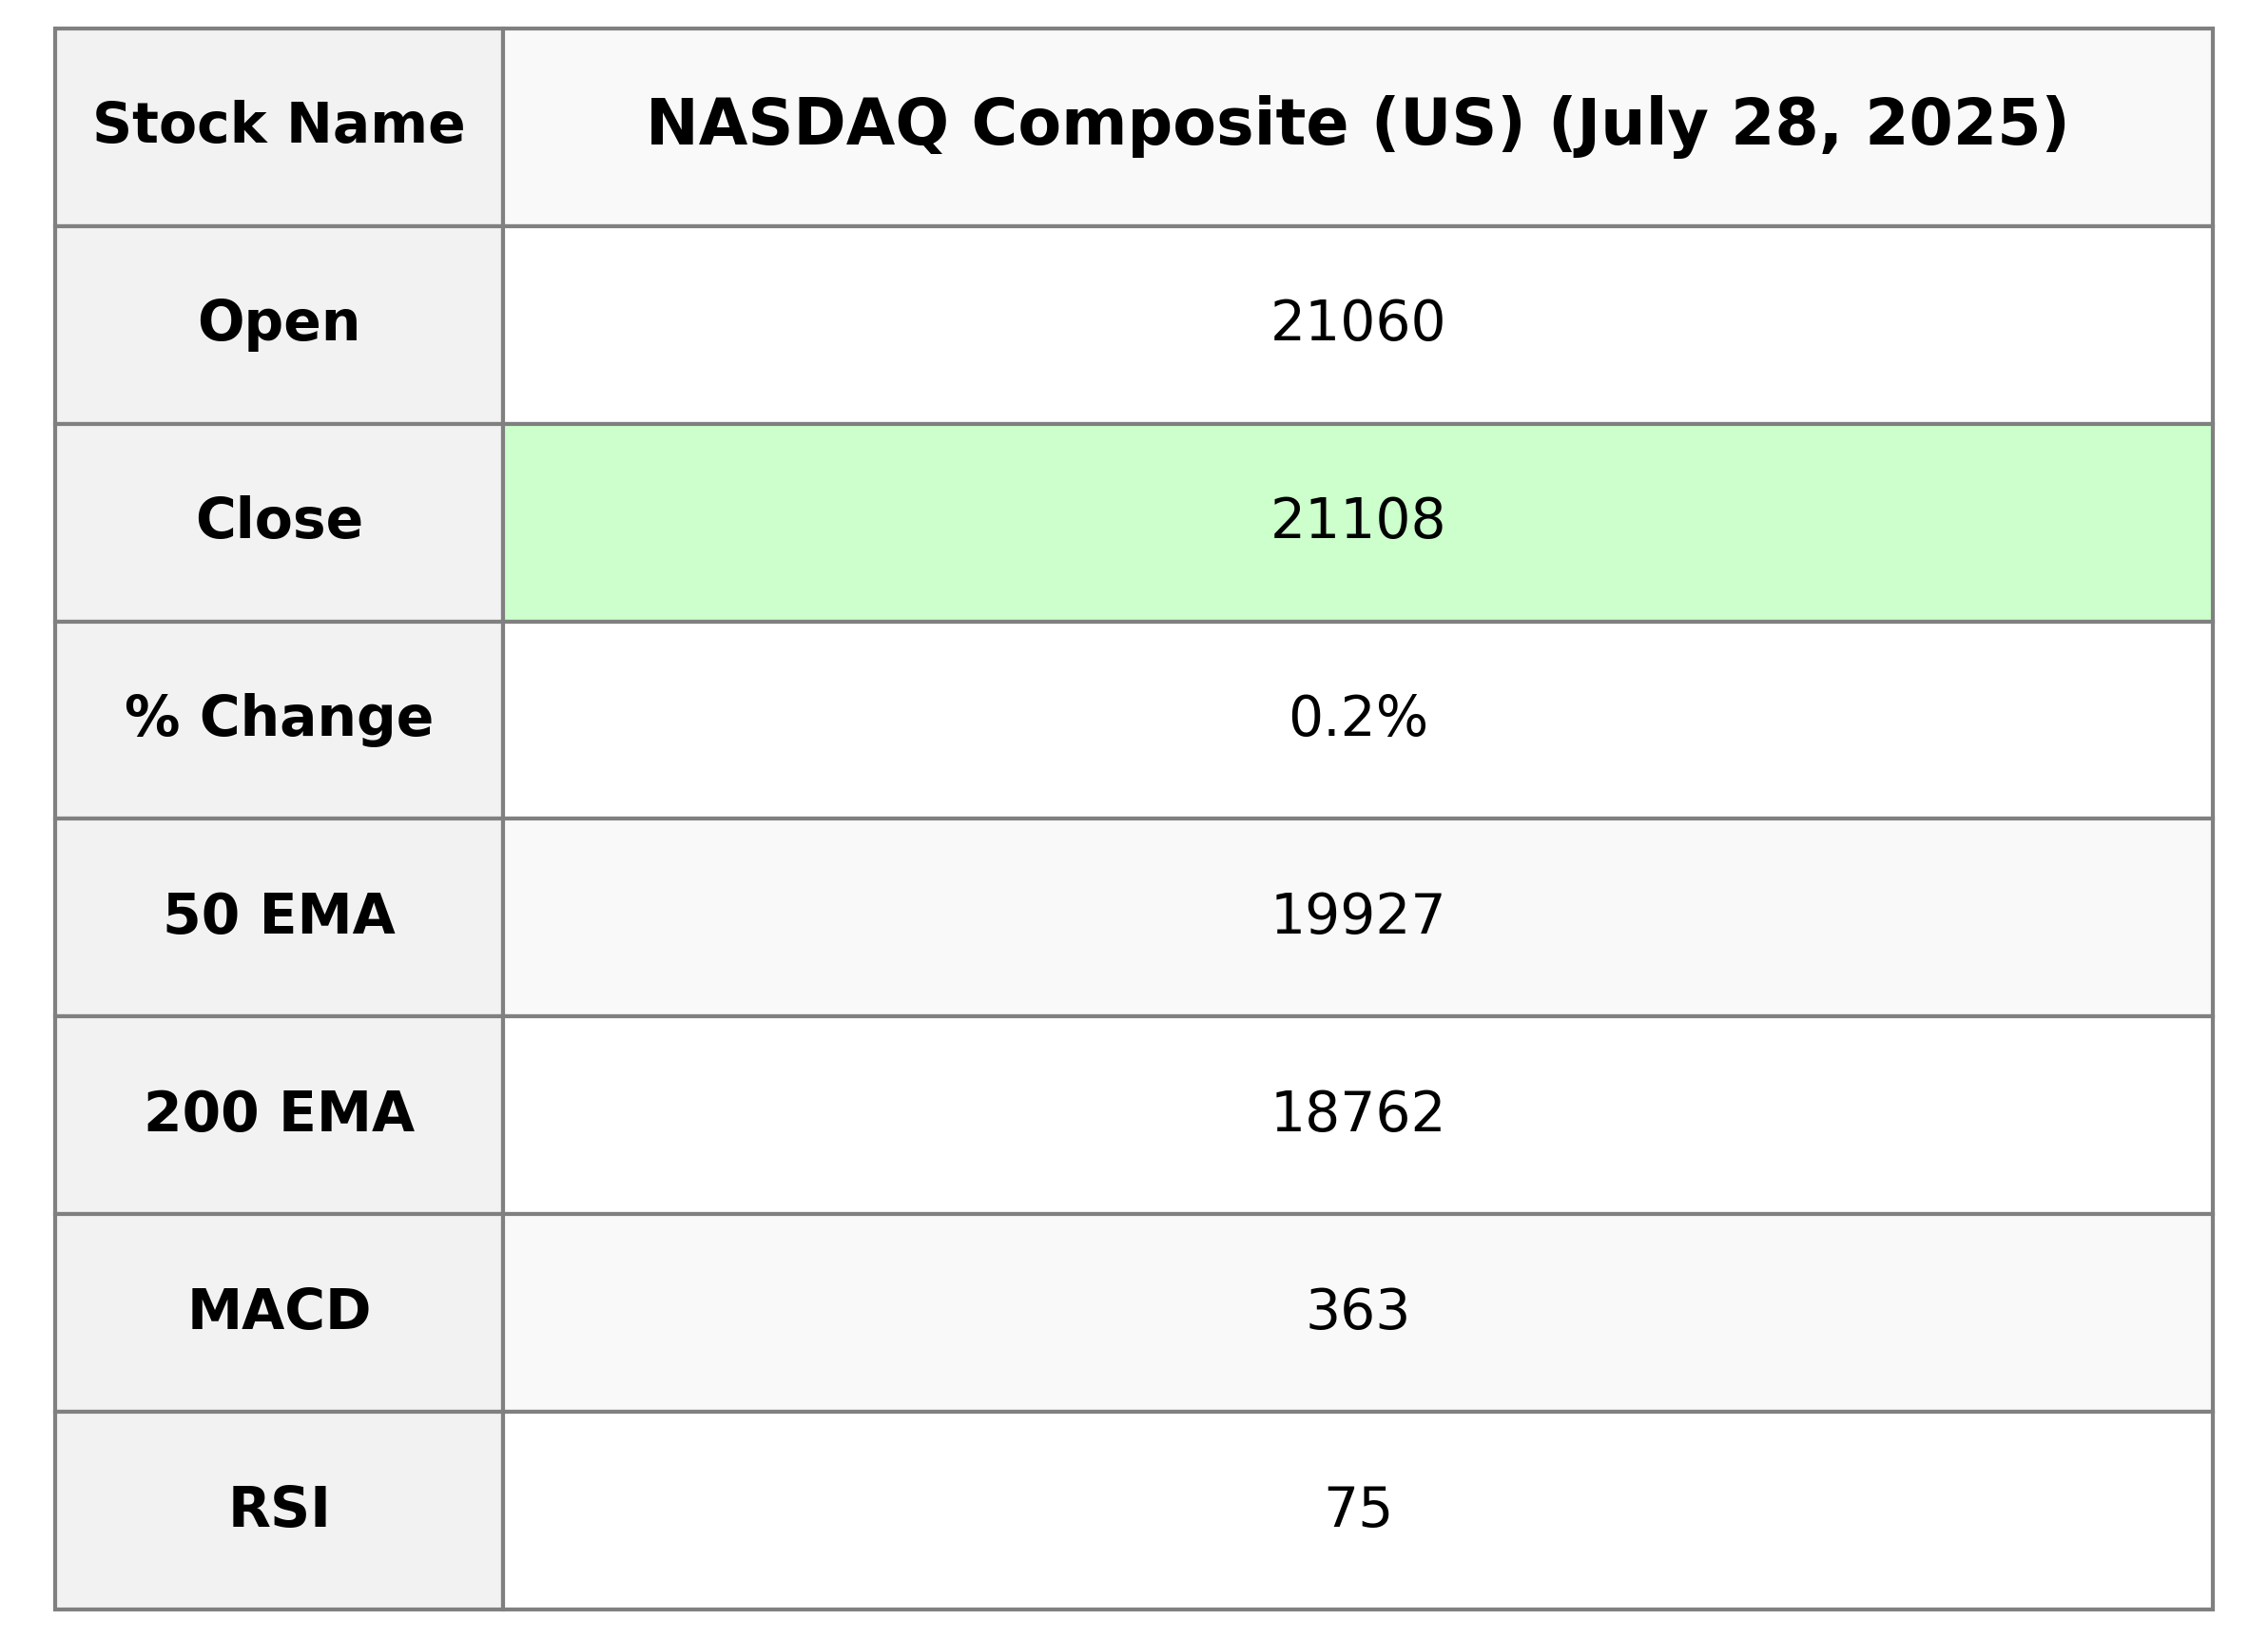
The NASDAQ Composite (US) opened at 21,059.94, reached a high of 21,159.80, and closed at 21,108.32, marking a modest increase of 0.24% with a points change of 50.36. The index exhibited a strong momentum with an RSI of 74.77, indicating overbought conditions, while the MACD of 363.06 is slightly below the signal line of 370.43. Trading volume was significant at 11,028,310,000, with the 50, 200, 10, and 20-day EMAs showing a positive trend.
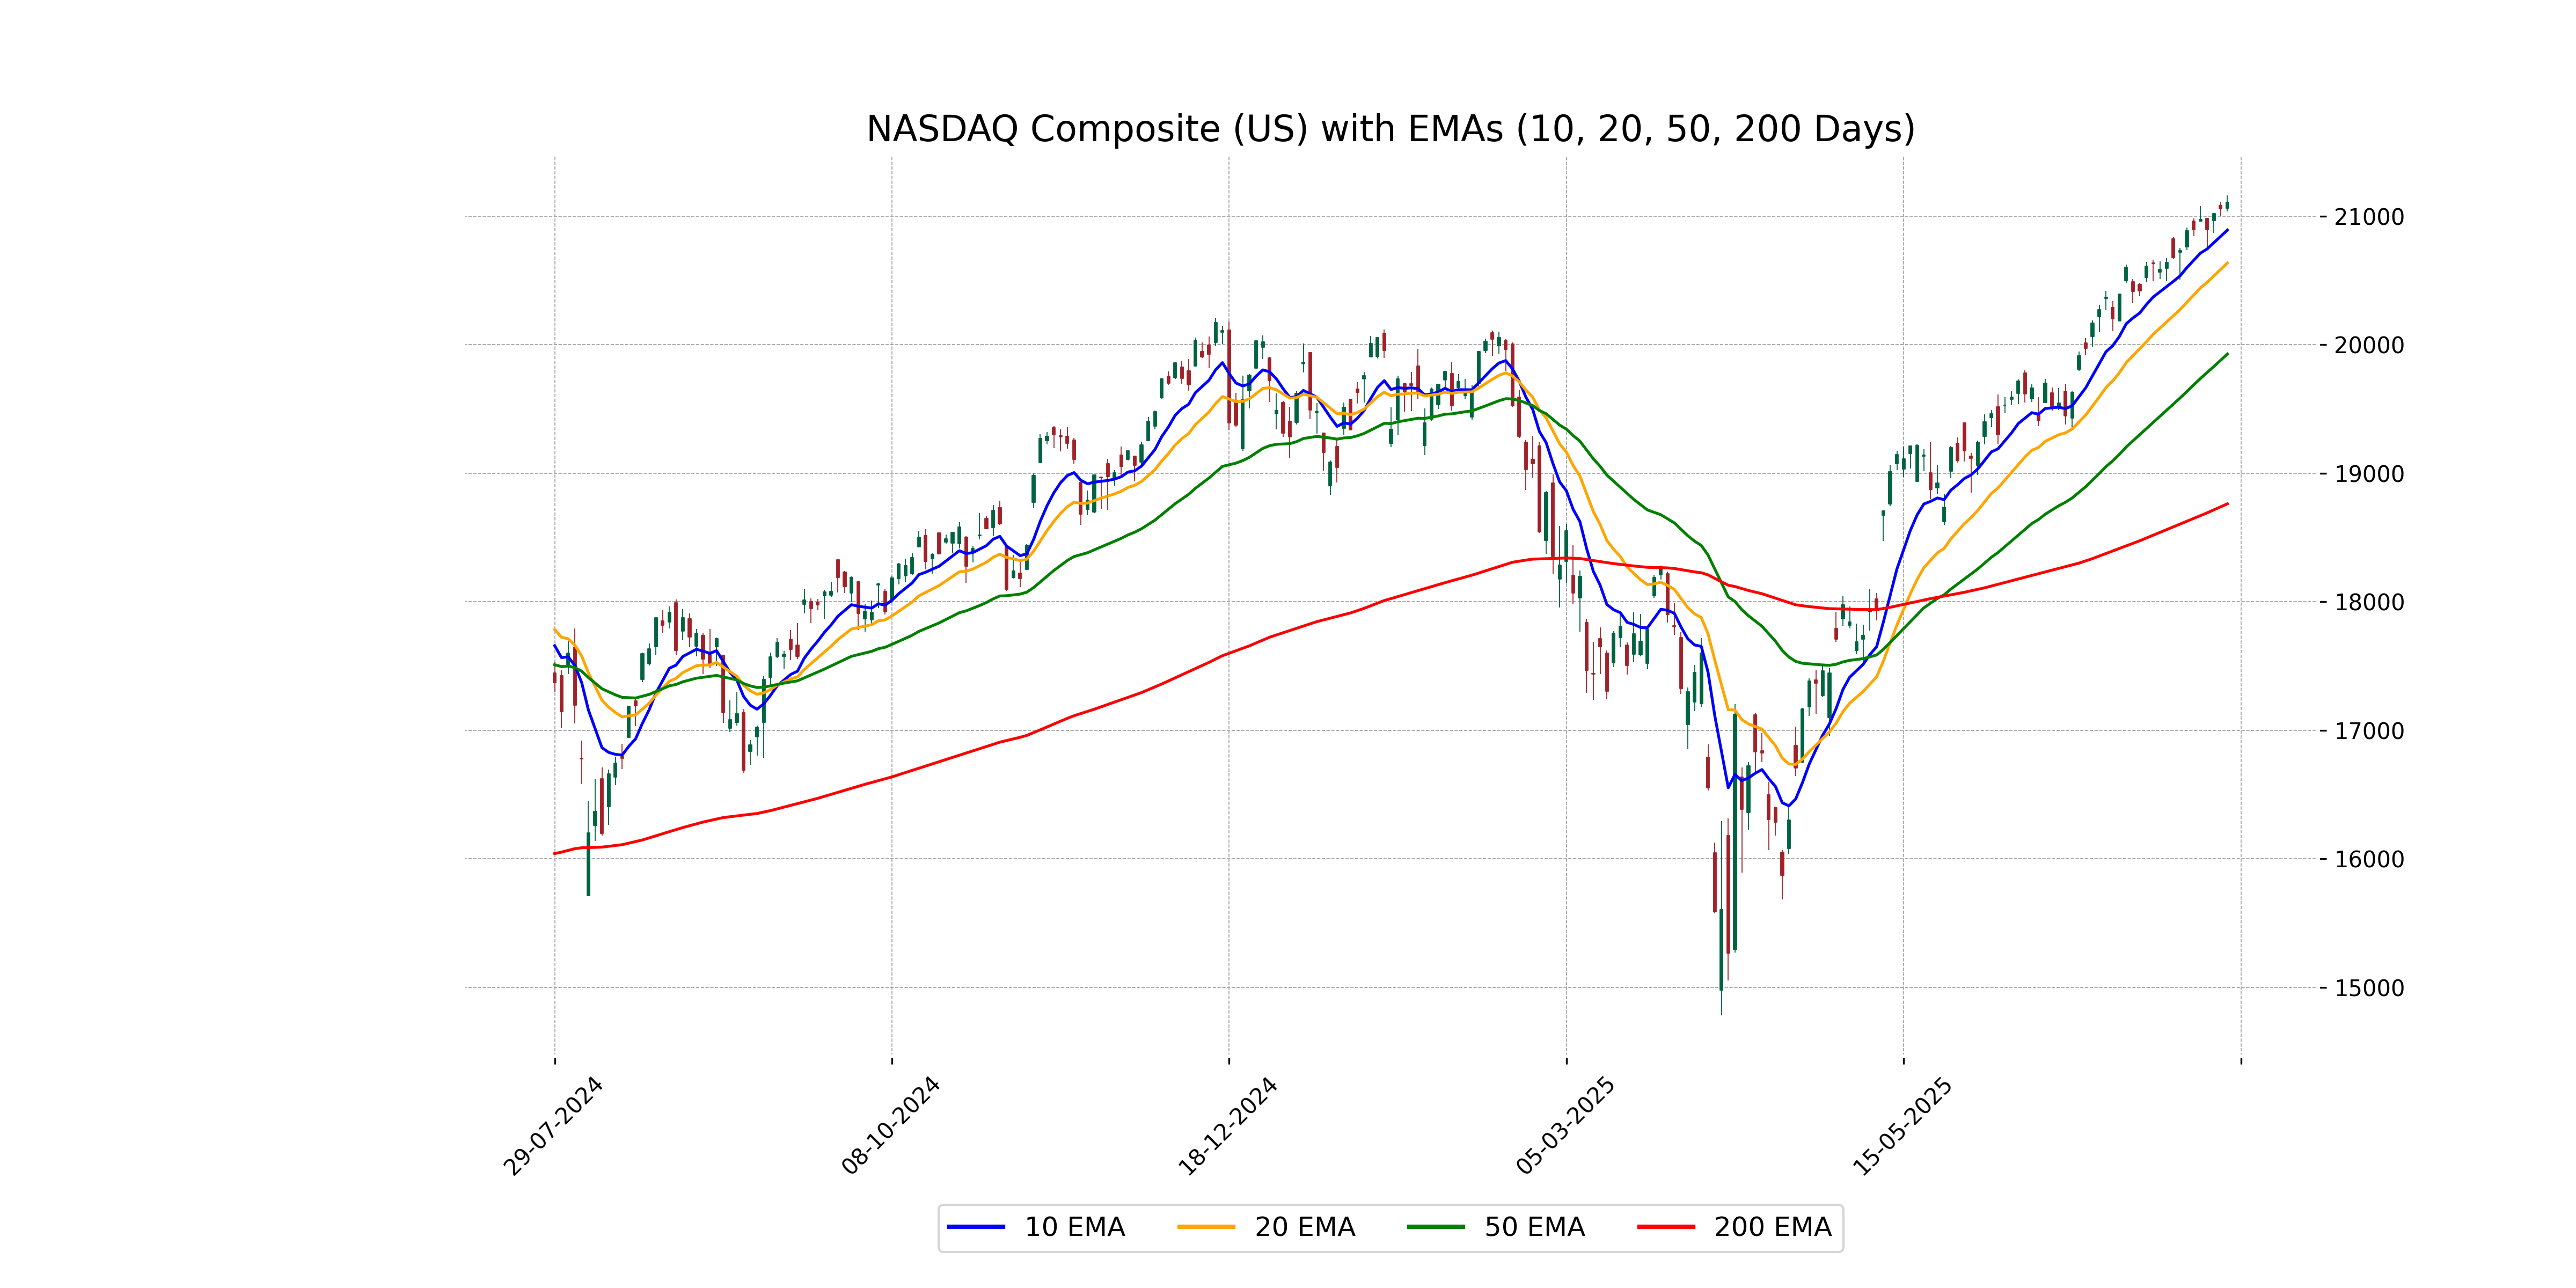
Relationship with Key Moving Averages
NASDAQ Composite (US) is currently trading above its key moving averages. The closing price of 21108.32 is above the 10 EMA at 20890.84, the 20 EMA at 20634.97, the 50 EMA at 19926.77, and the 200 EMA at 18761.75. This indicates a strong bullish trend over different timeframes.
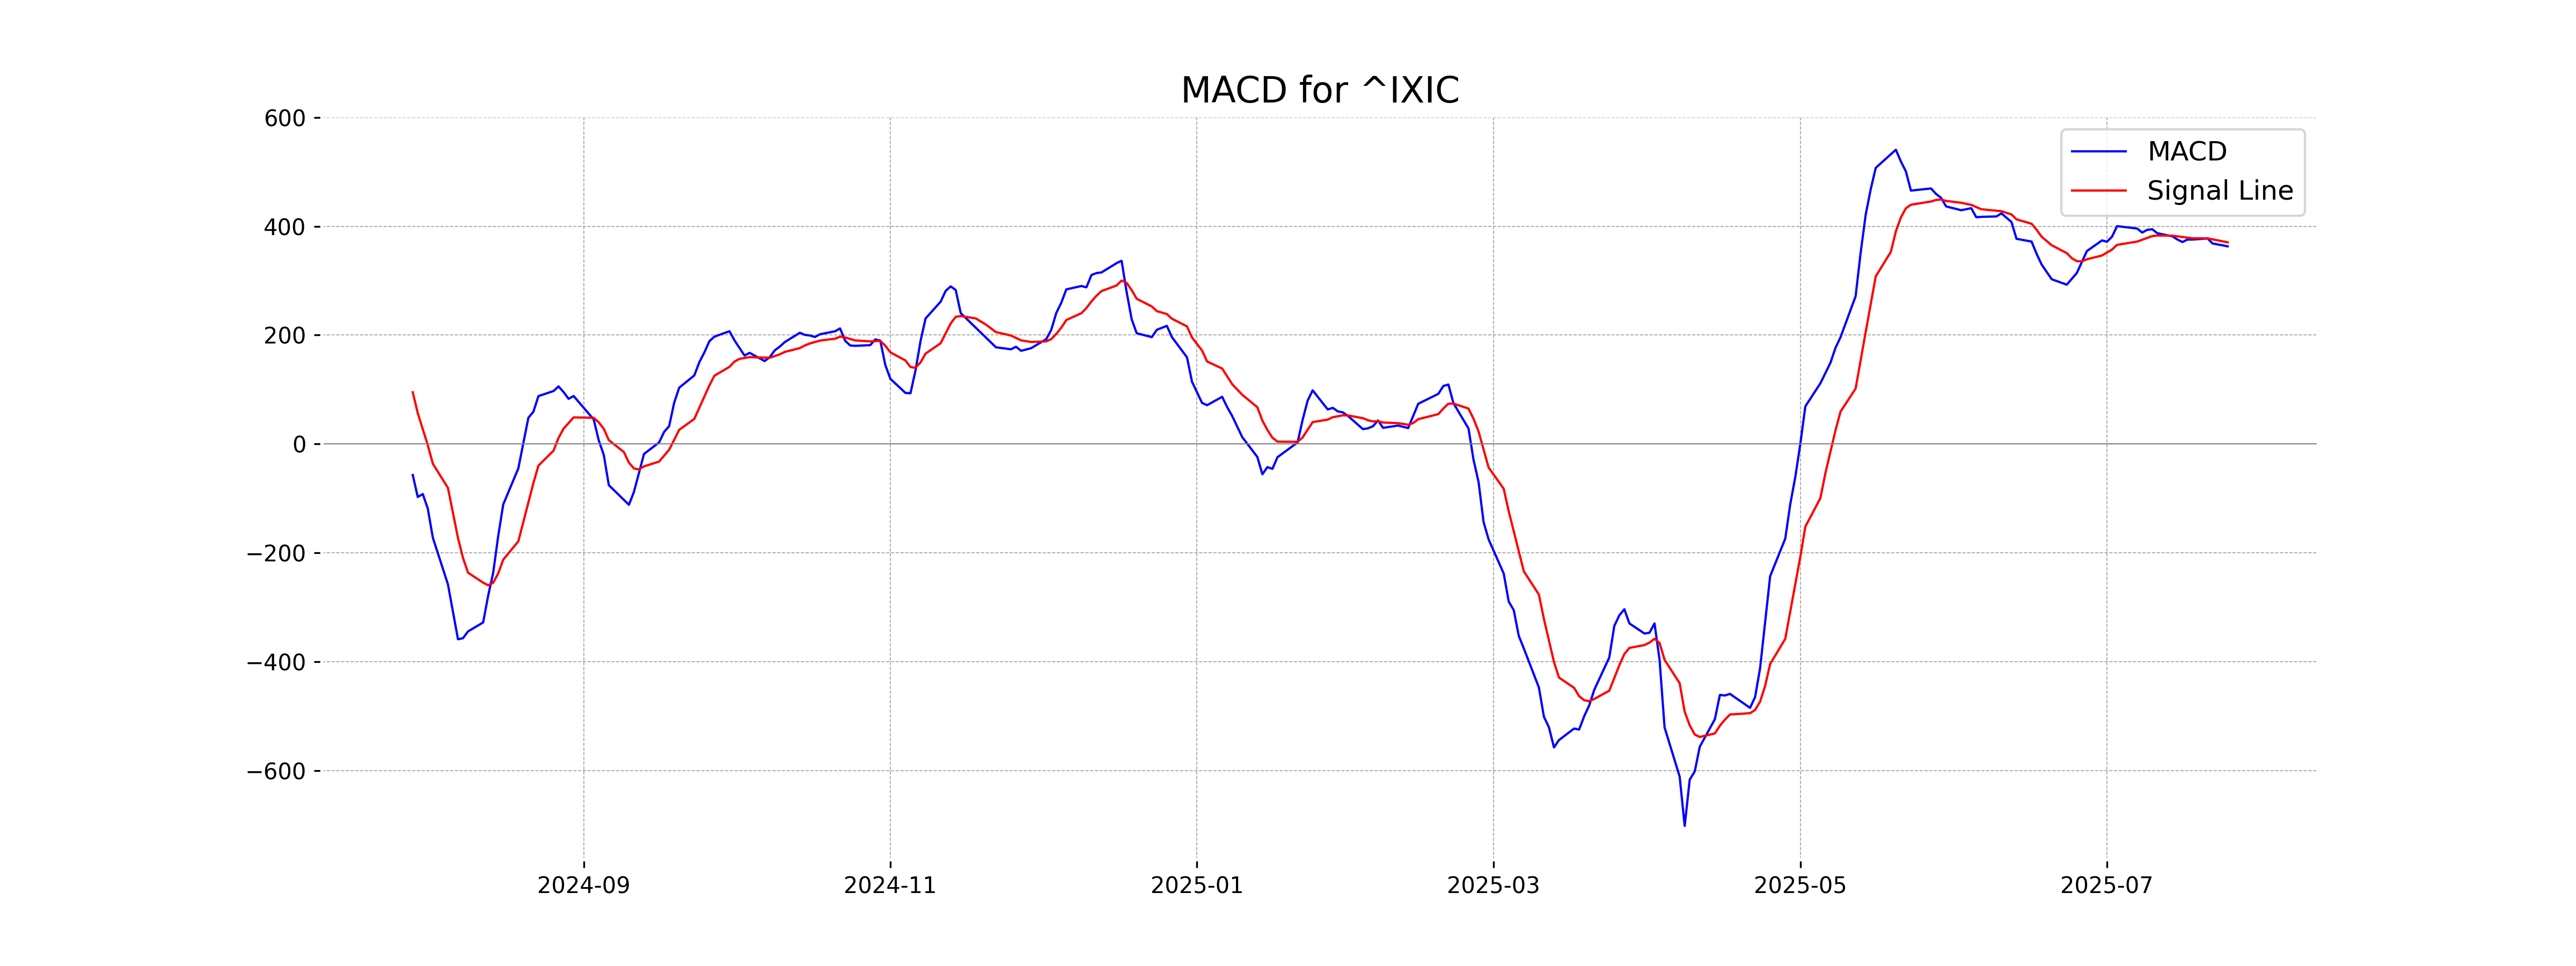
Moving Averages Trend (MACD)
The MACD for NASDAQ Composite (US) is slightly below the MACD Signal, indicating a potential bearish crossover. This suggests that the momentum might be slowing down, and the index could experience some downside in the near term if the trend continues.
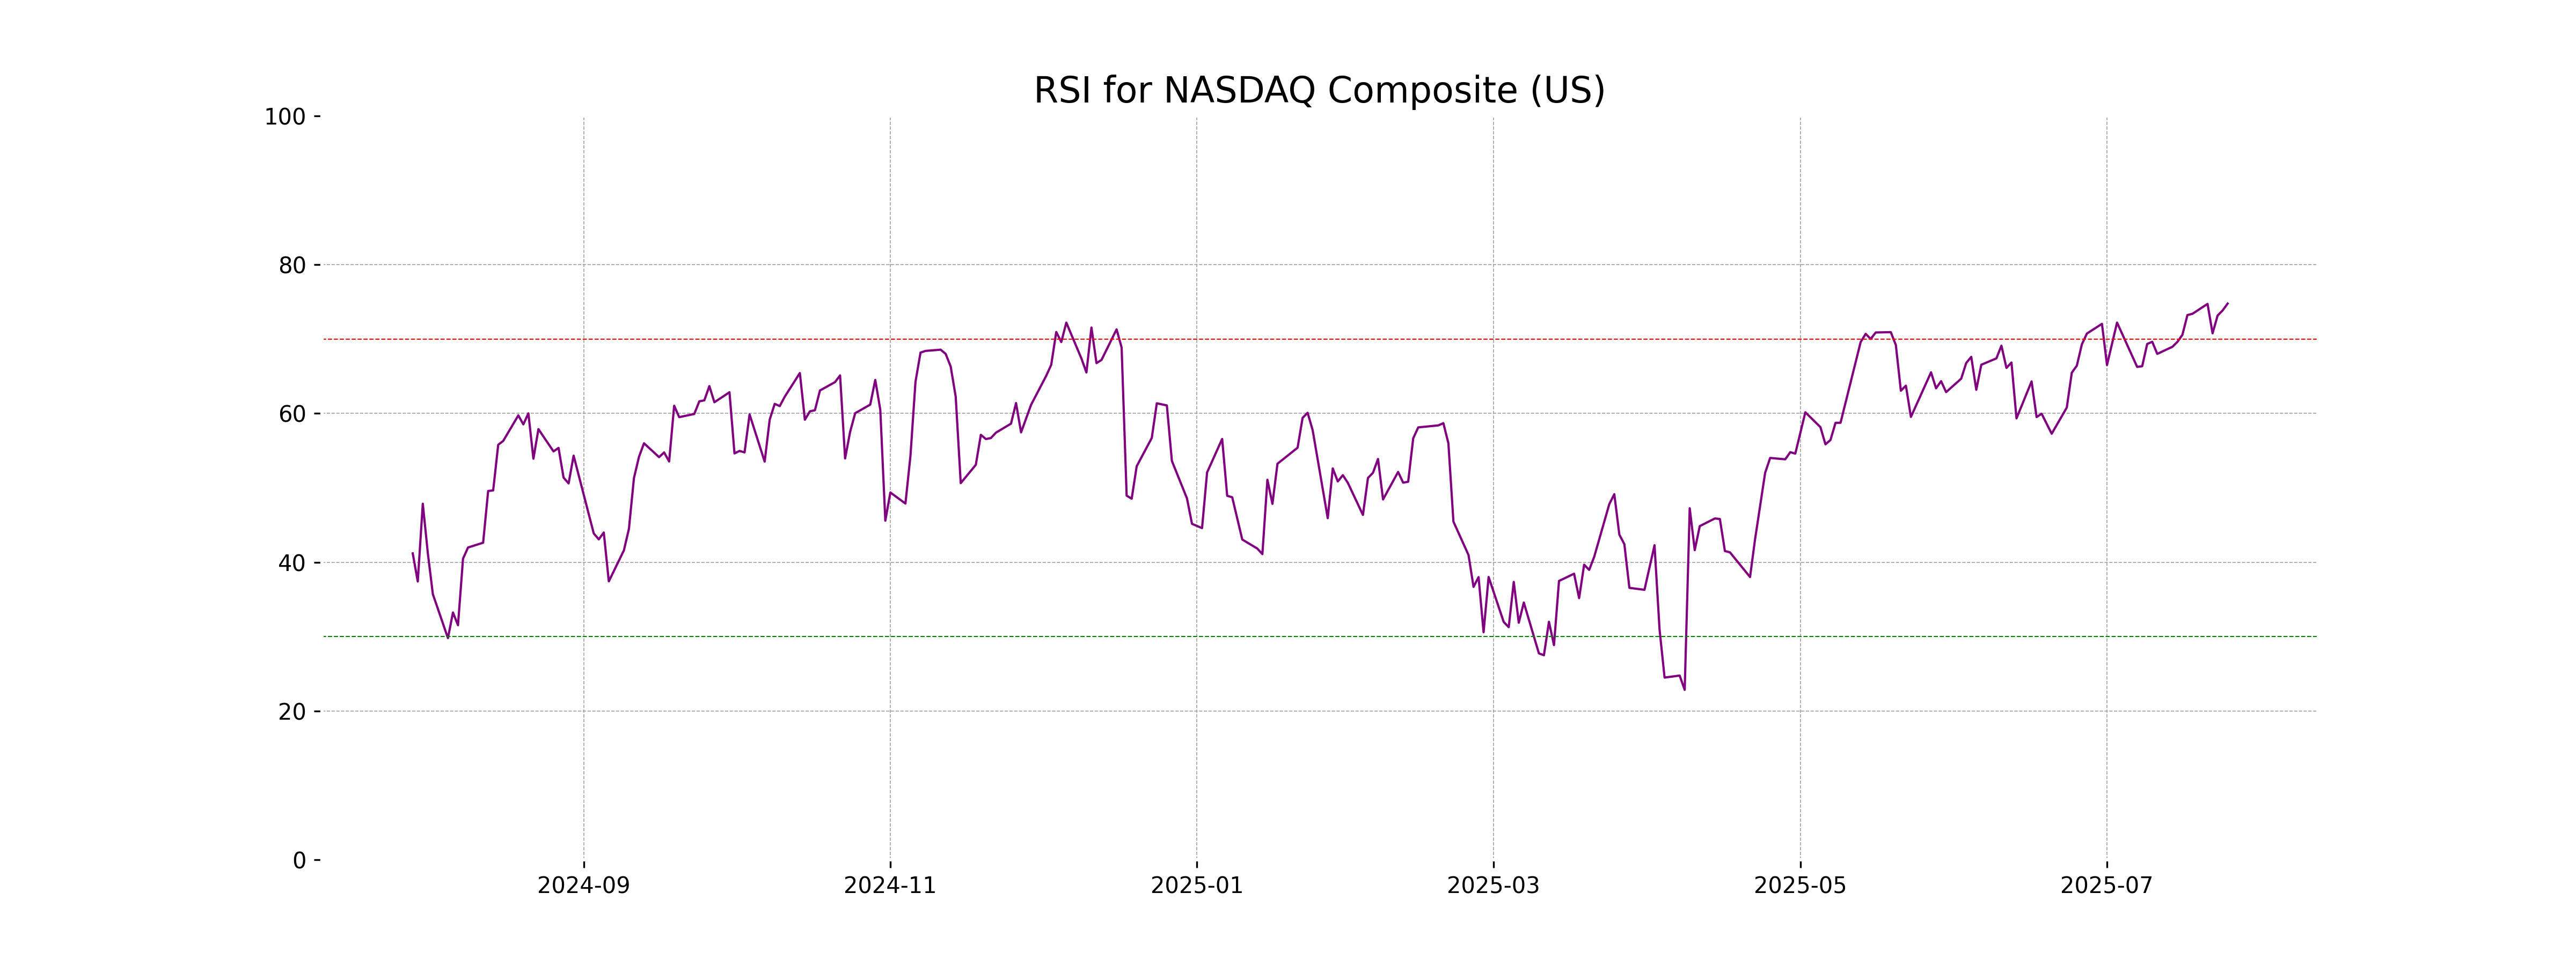
RSI Analysis
Based on the stock data for NASDAQ Composite (US), the RSI is 74.77, indicating that the market is in an overbought condition. This suggests that the index may be due for a price correction or consolidation in the near future.
Analysis for Nikkei 225 (Japan) - July 28, 2025
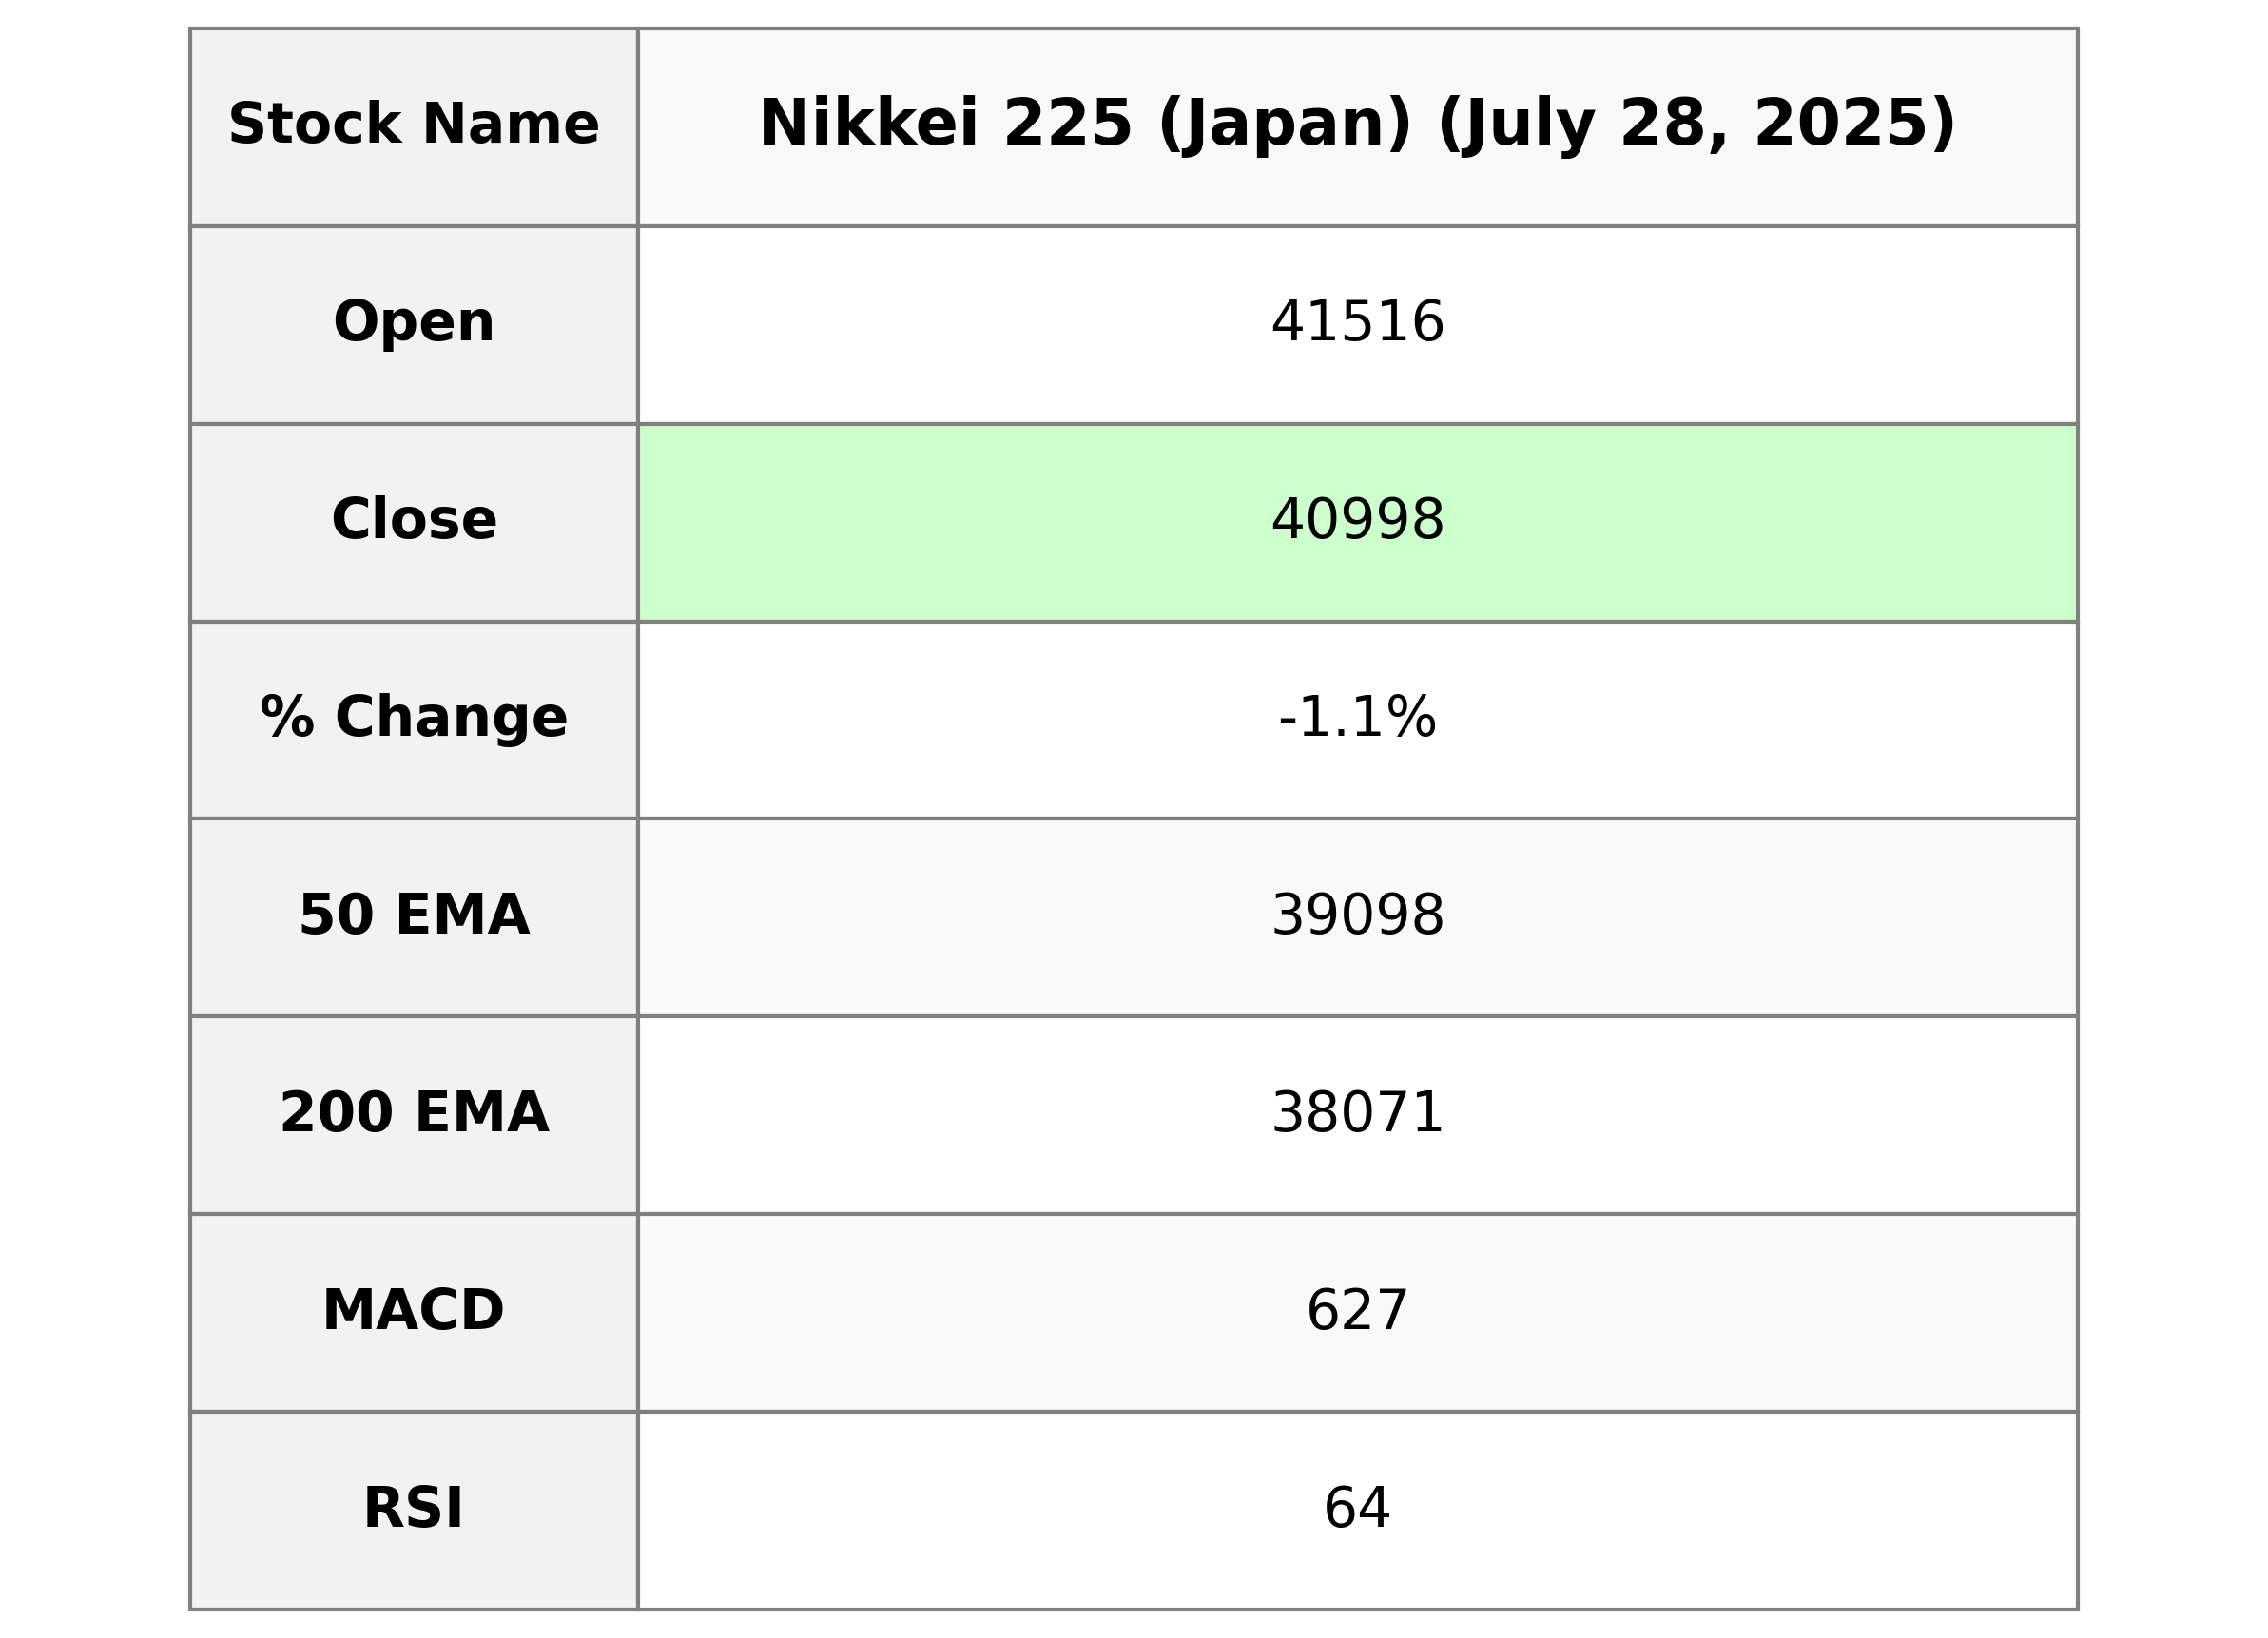
Nikkei 225 (Japan) Performance Summary: The Nikkei 225 opened at 41,515.91 and closed at 40,998.27, experiencing a decrease of 457.96 points or approximately -1.10% from the previous close of 41,456.23. The Relative Strength Index (RSI) stands at 63.98, indicating relatively strong momentum, while the Moving Average Convergence Divergence (MACD) is above the signal line, suggesting recent bullish trends despite the day's decline.

Relationship with Key Moving Averages
Based on the provided data, Nikkei 225 closed at 40,998.27, which is above both its 50-day EMA of 39,098.30 and 200-day EMA of 38,070.50, indicating a short to medium-term bullish trend. However, the close is slightly below its 10-day EMA of 40,607.63, suggesting a potential short-term price pullback.
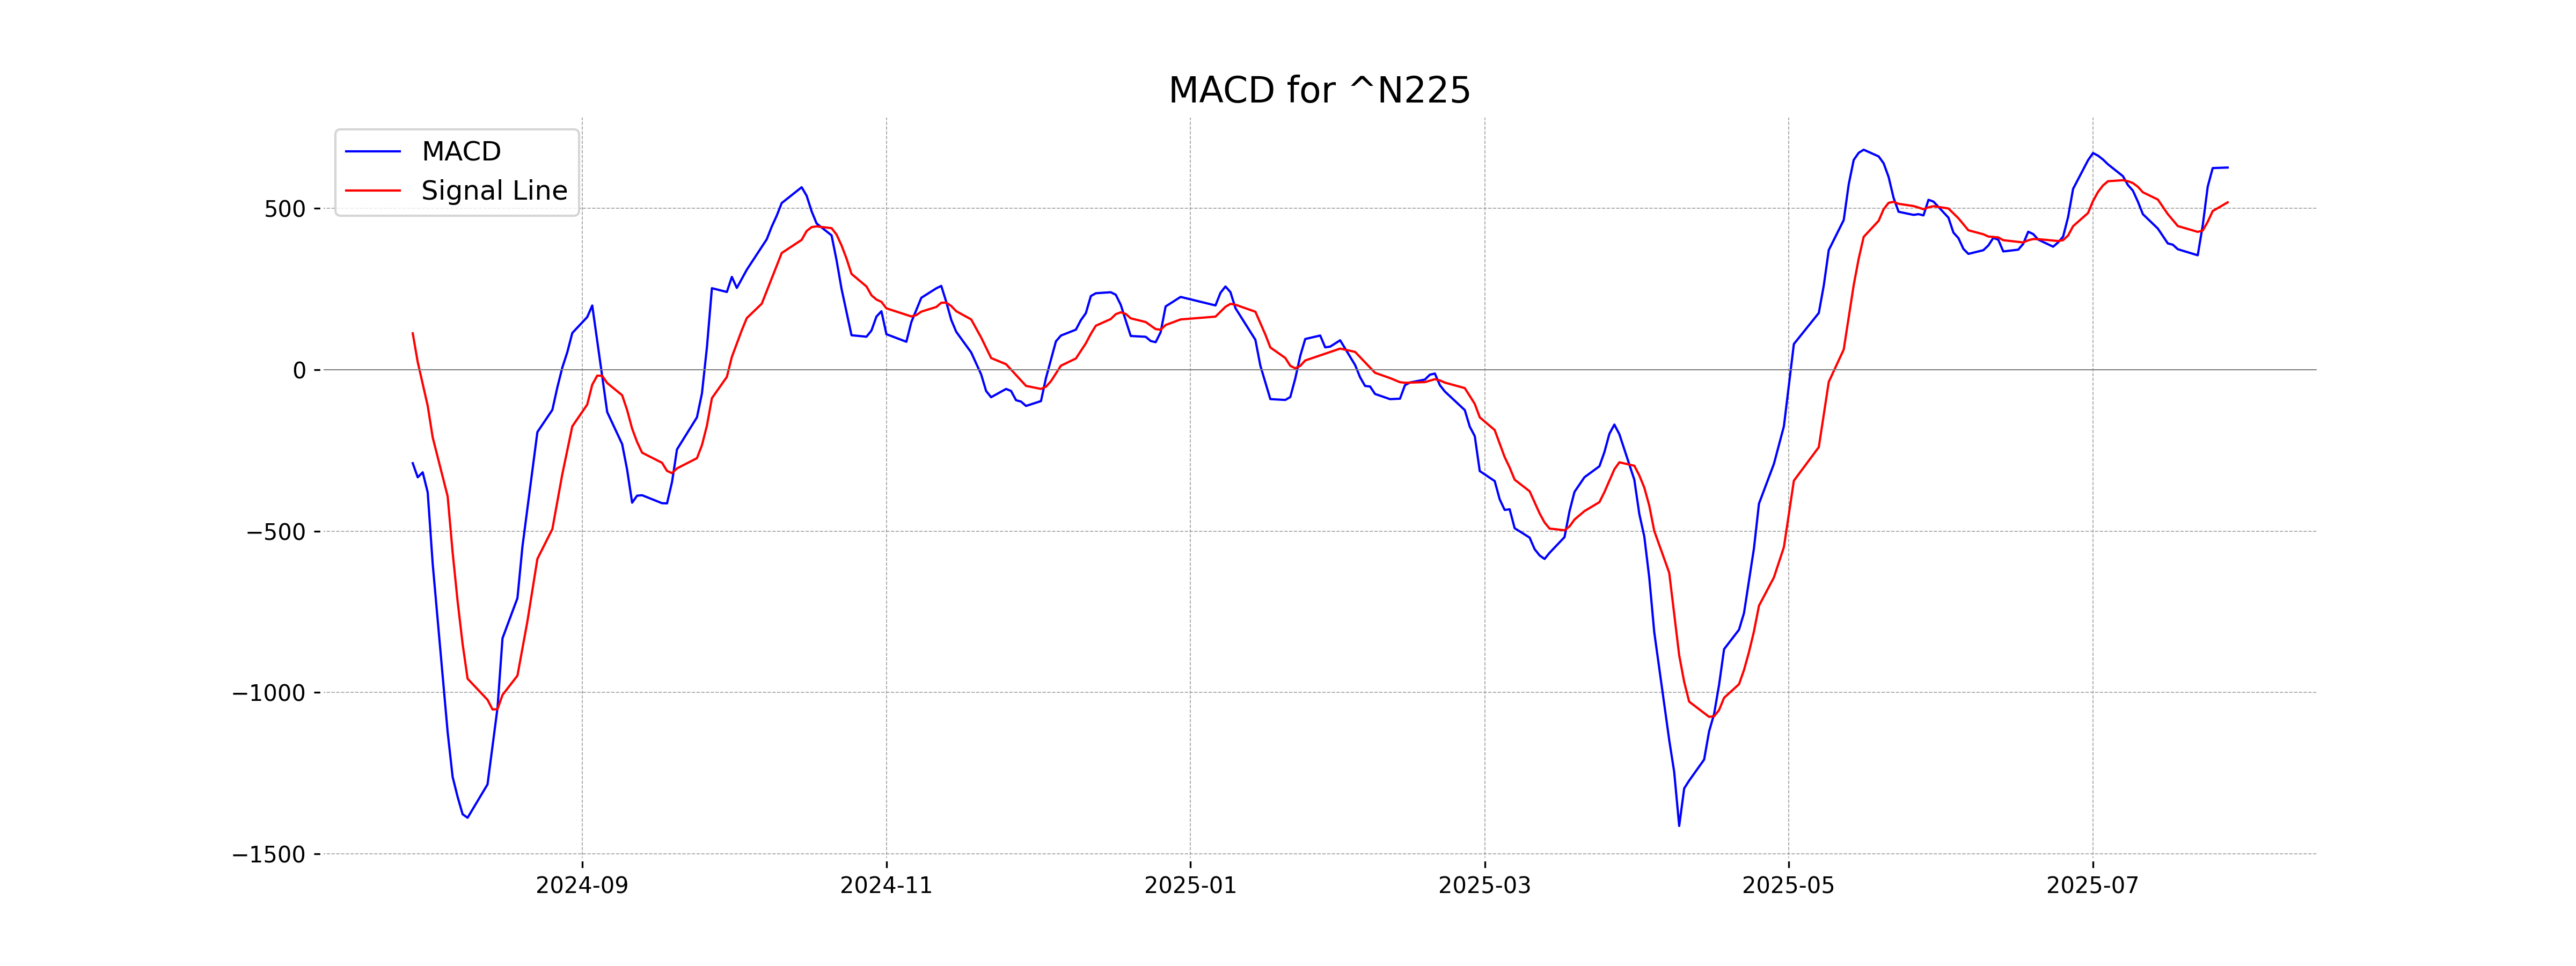
Moving Averages Trend (MACD)
The MACD for Nikkei 225 is 626.65, while the MACD Signal is 518.78, indicating a potentially bullish trend as the MACD line is above the signal line. However, the negative percent change in the close price suggests caution. Consider monitoring the trend for confirmation.
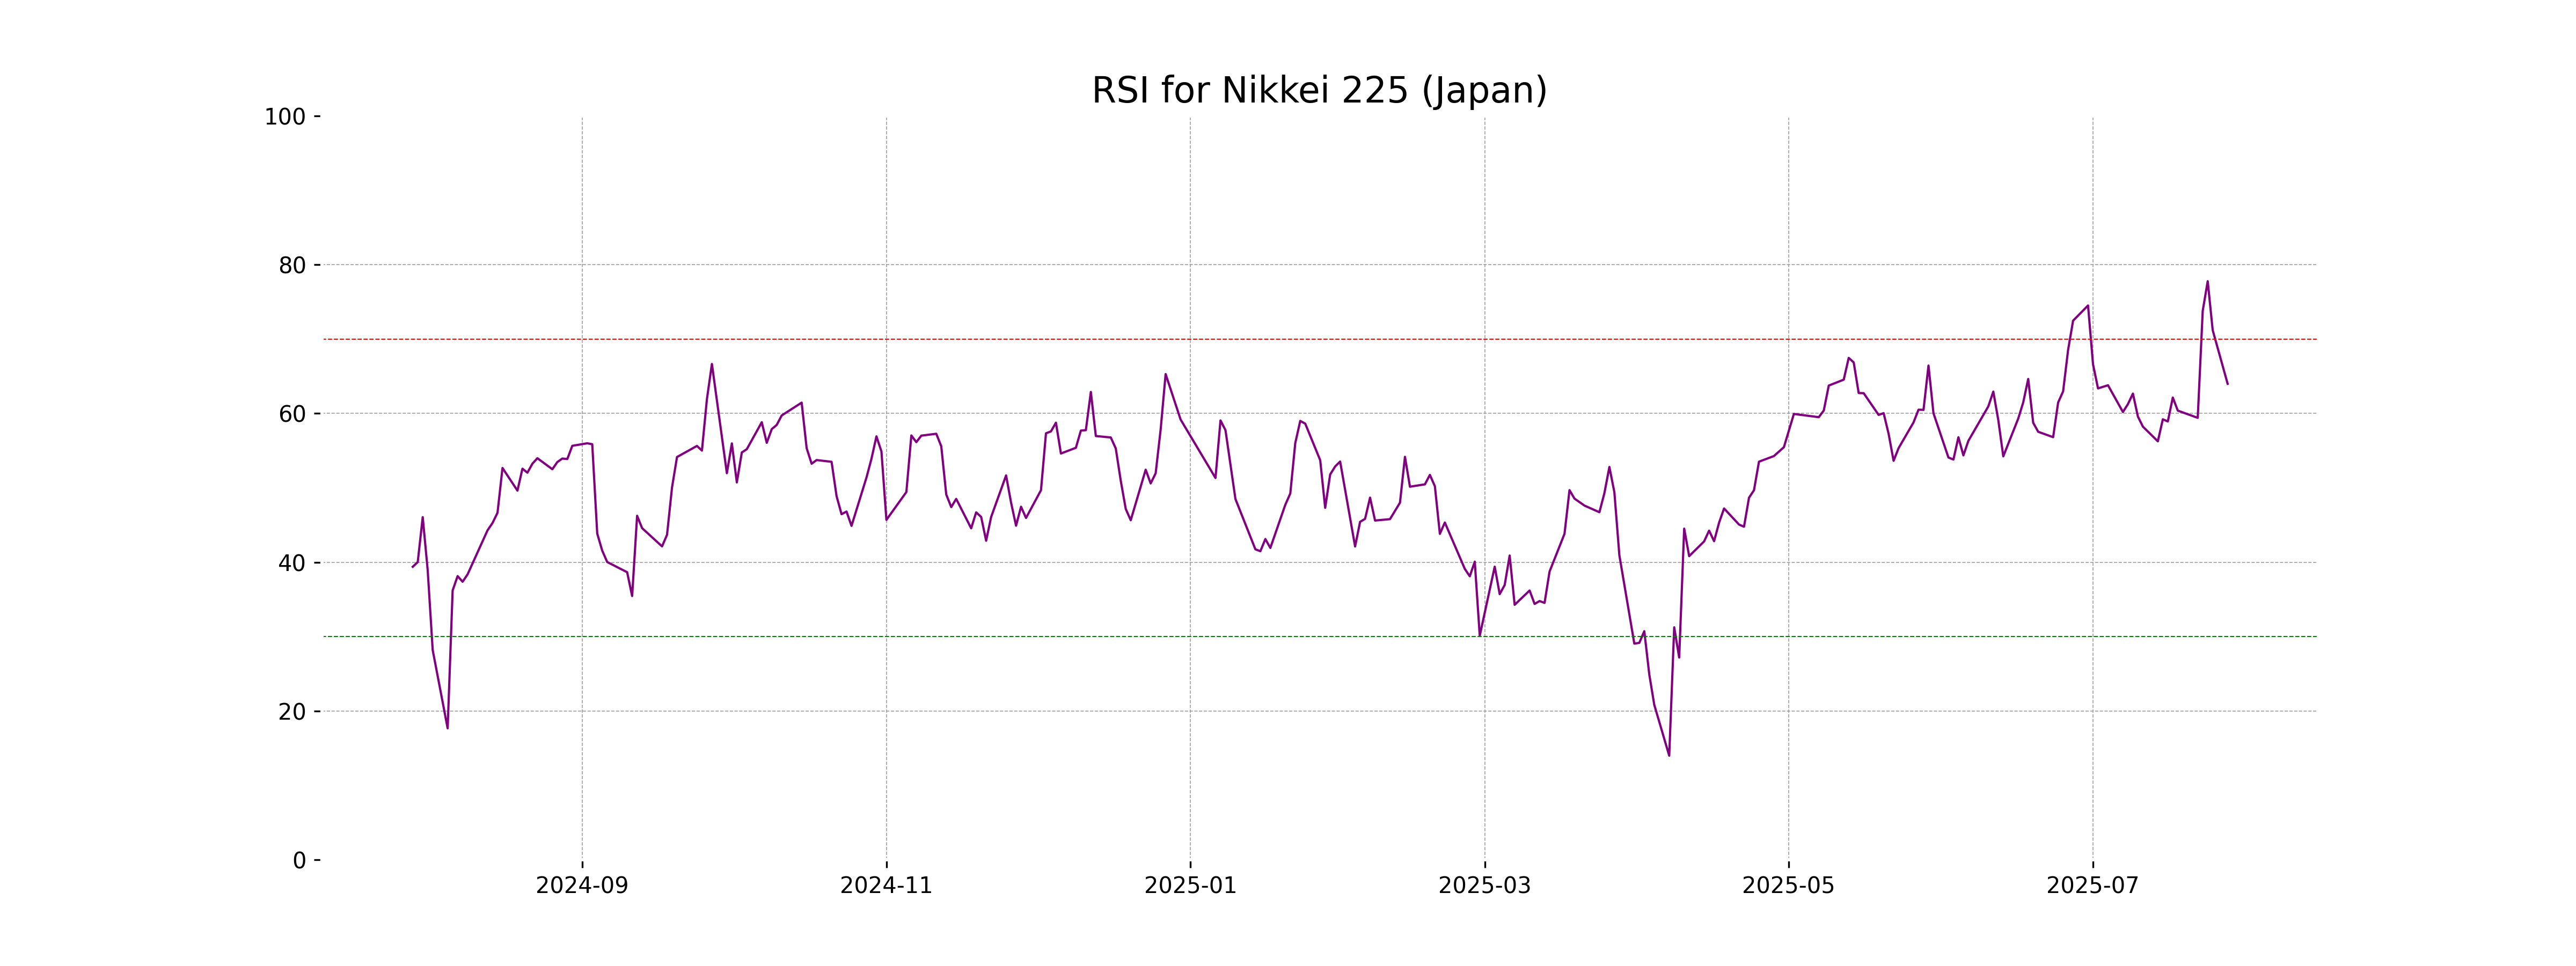
RSI Analysis
Nikkei 225 (Japan) RSI Analysis: The relative strength index (RSI) is currently at 63.98, indicating a relatively strong upward momentum but not yet in the overbought territory. An RSI above 70 typically suggests that a stock might be overbought, so there's still room for further gains before potential consolidation or pullback.
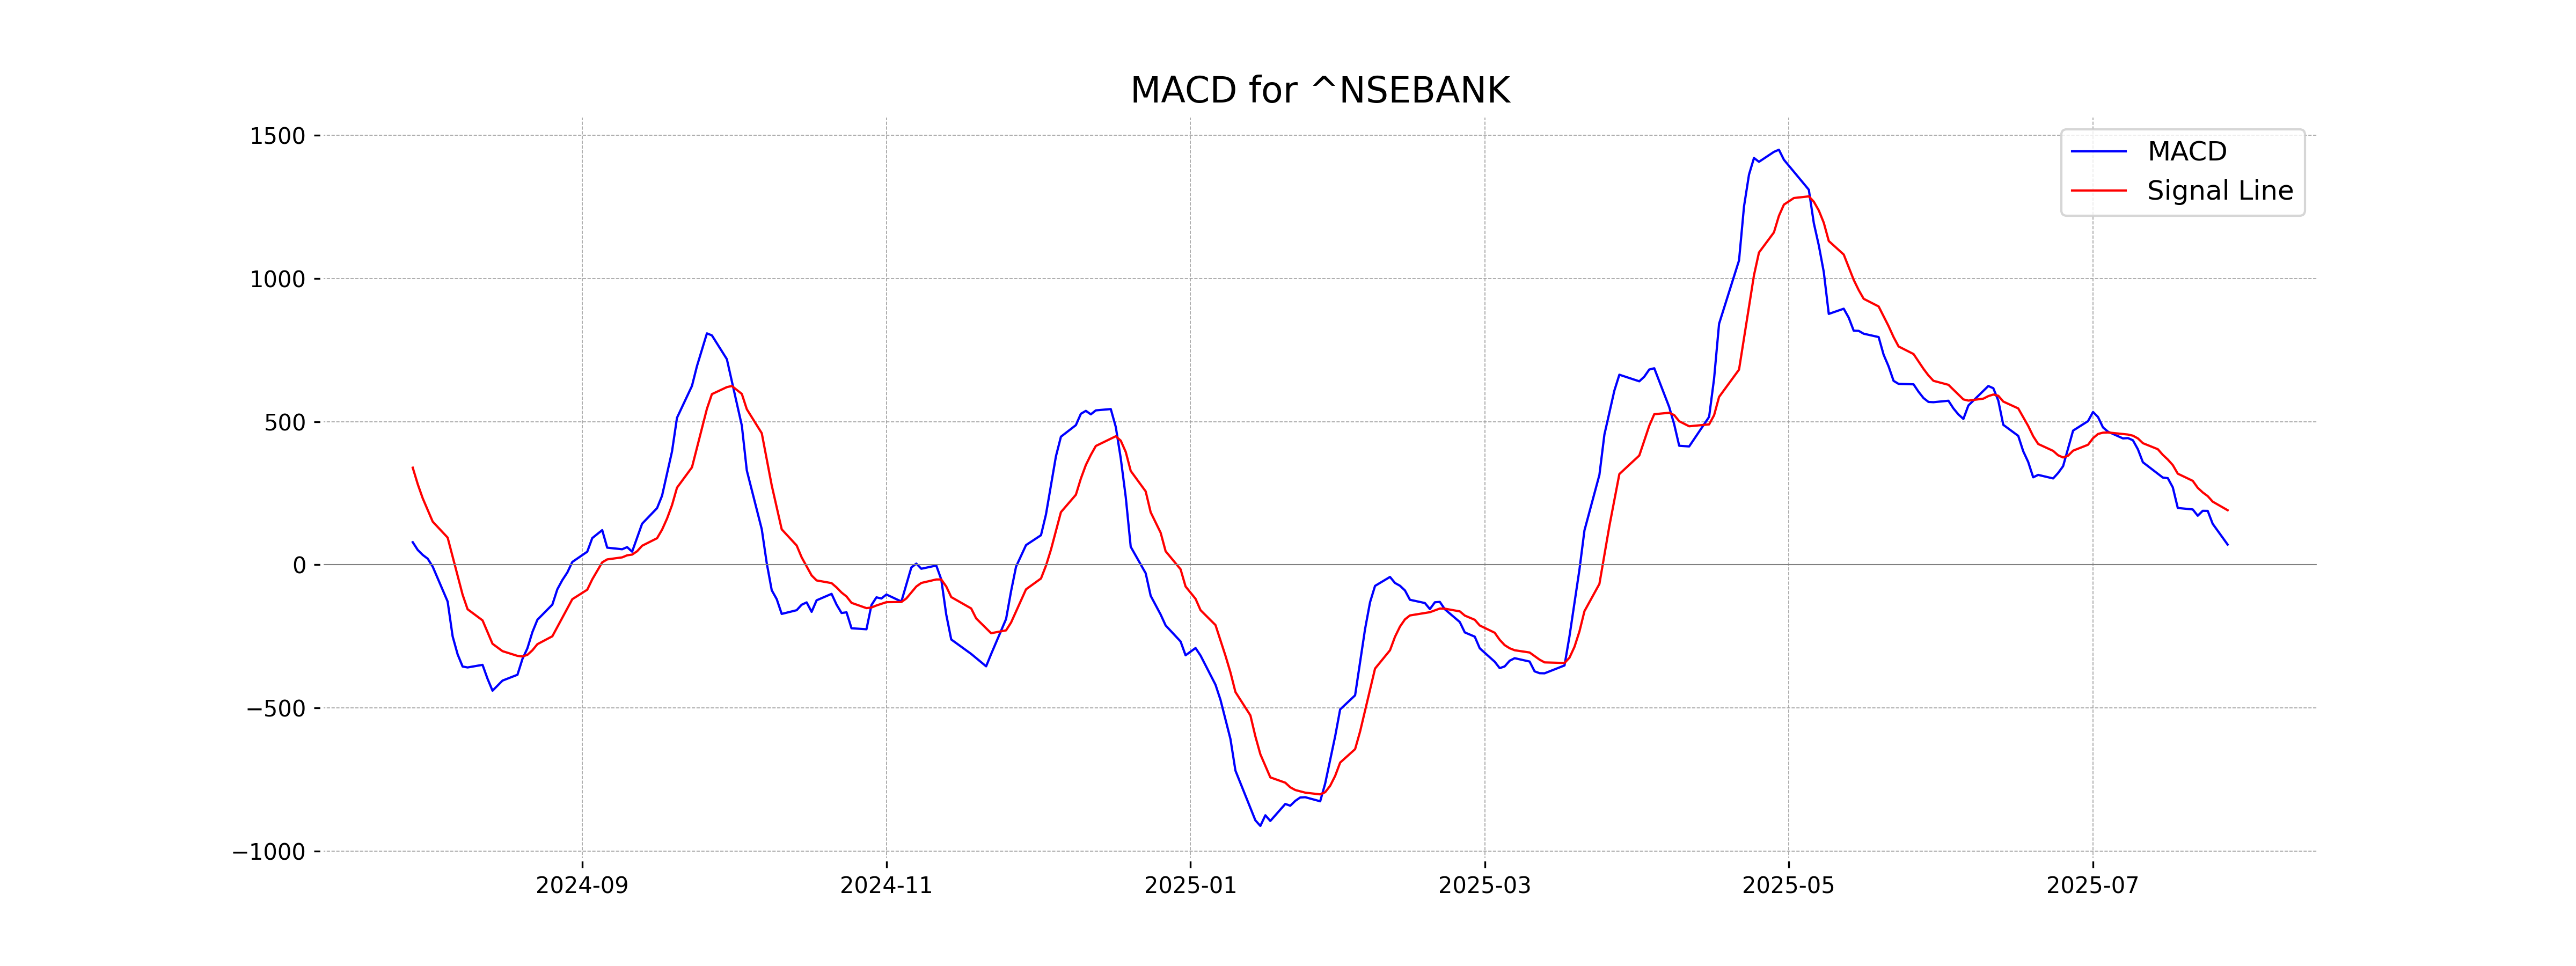
Analysis for Nifty Bank - July 28, 2025
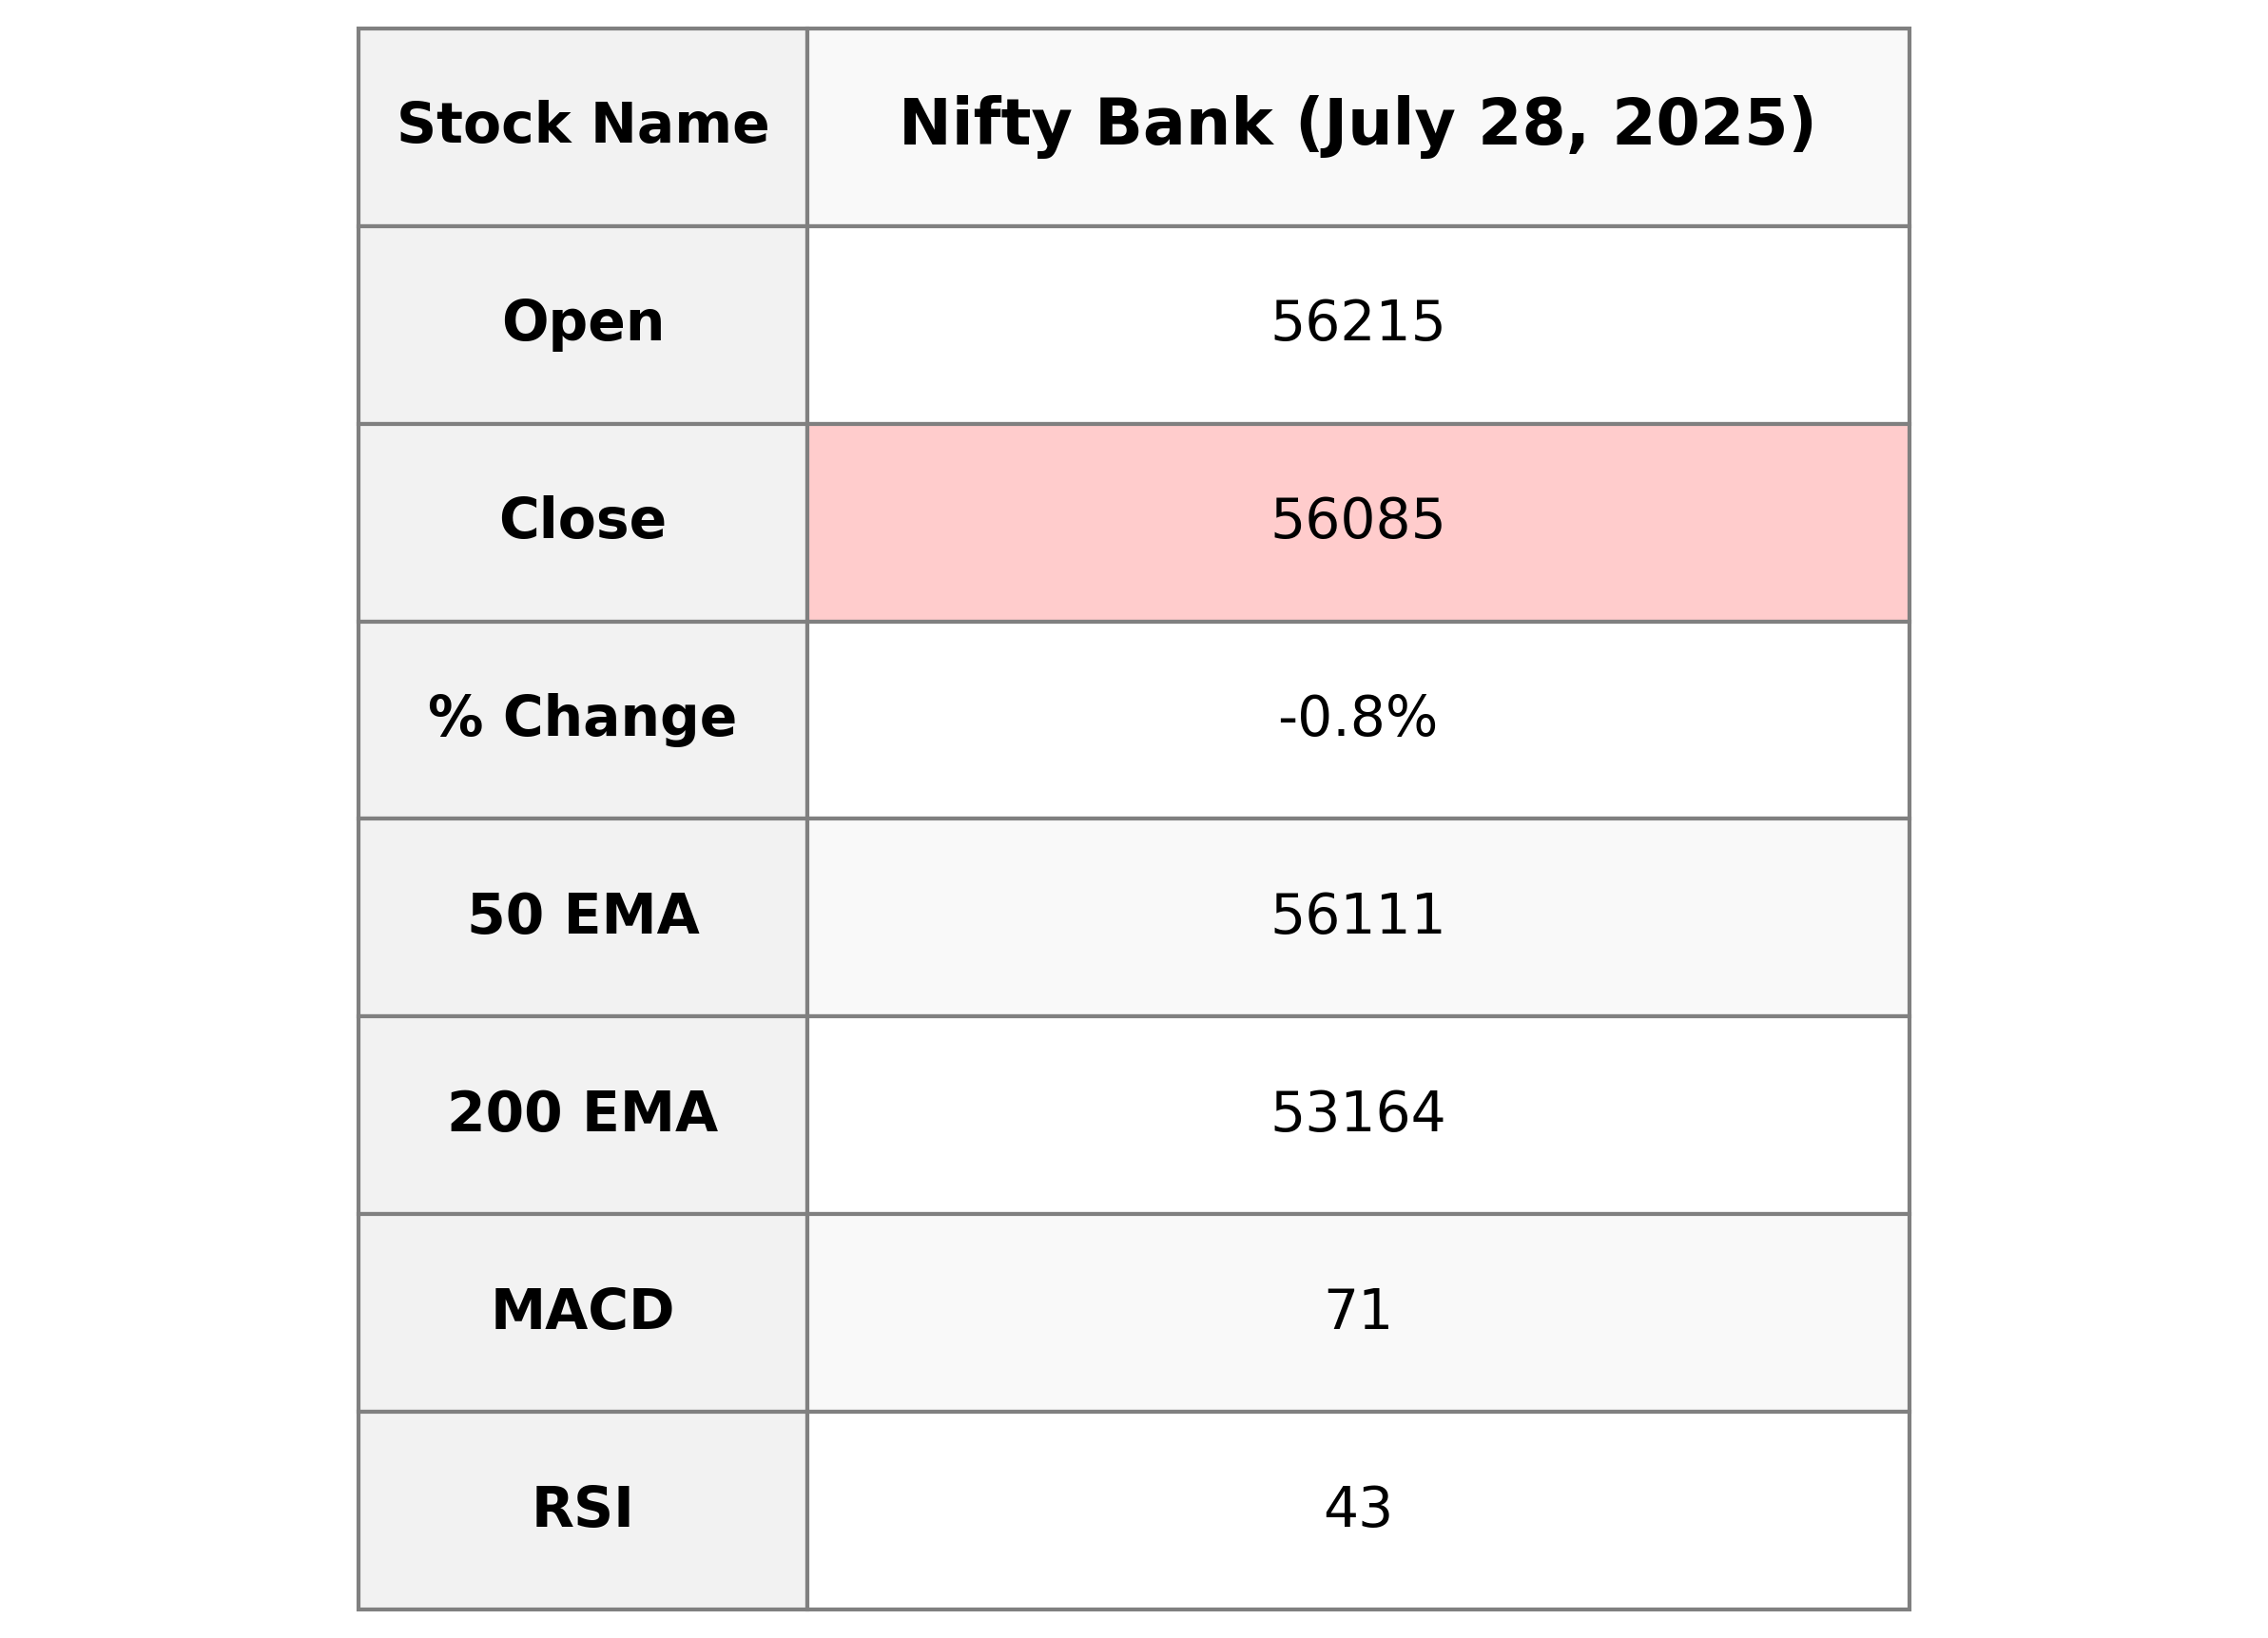
The Nifty Bank index opened at 56,215.10 and closed at 56,084.90, registering a negative change of -0.78% or a decrease of 444 points compared to the previous close of 56,528.90. The index showed a lower price movement with a high of 56,578.40 and a low of 55,997.45, while the Relative Strength Index (RSI) was at 43.10, indicating bearish sentiment. The Moving Average Convergence Divergence (MACD) also showed bearish signals with the MACD line at 70.68 below the MACD Signal line at 190.58.

Relationship with Key Moving Averages
Nifty Bank closed at 56084.90, which is slightly below its 50-day EMA of 56110.72, indicating a bearish sentiment in the short term. It is also well above its 200-day EMA of 53163.51, suggesting a long-term bullish trend despite recent short-term weakness.
Moving Averages Trend (MACD)
The Nifty Bank's MACD stands at 70.68, which is significantly lower than the MACD Signal of 190.58, indicating a bearish trend. The MACD histogram is negative, suggesting downward momentum in the short term.
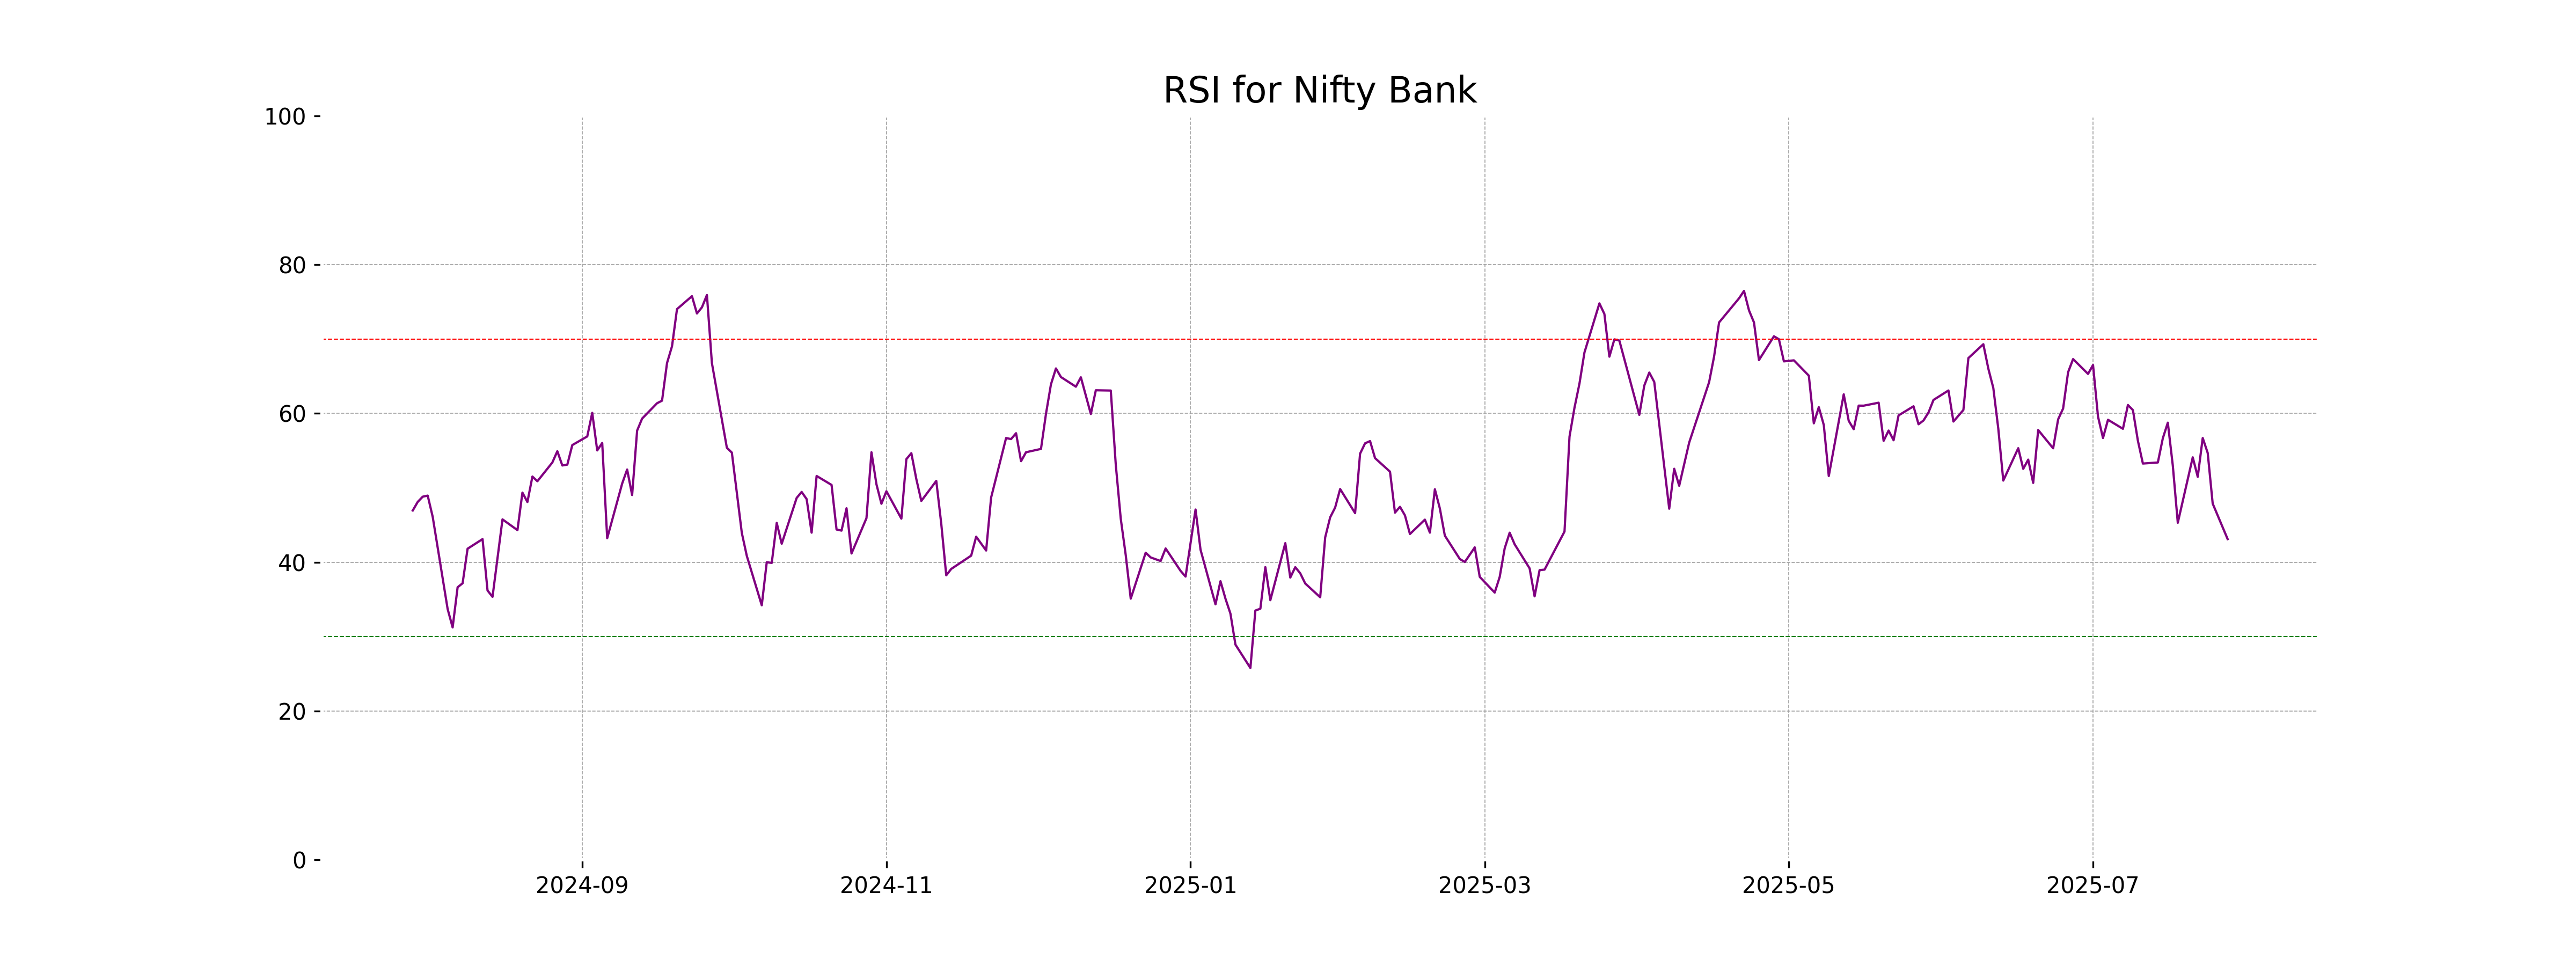
RSI Analysis
The Relative Strength Index (RSI) for Nifty Bank is 43.10, indicating that the stock is neither overbought nor oversold. Since RSI values between 30 and 70 suggest a neutral market condition, the current RSI positions Nifty Bank towards a bearish trend but not at extreme levels.
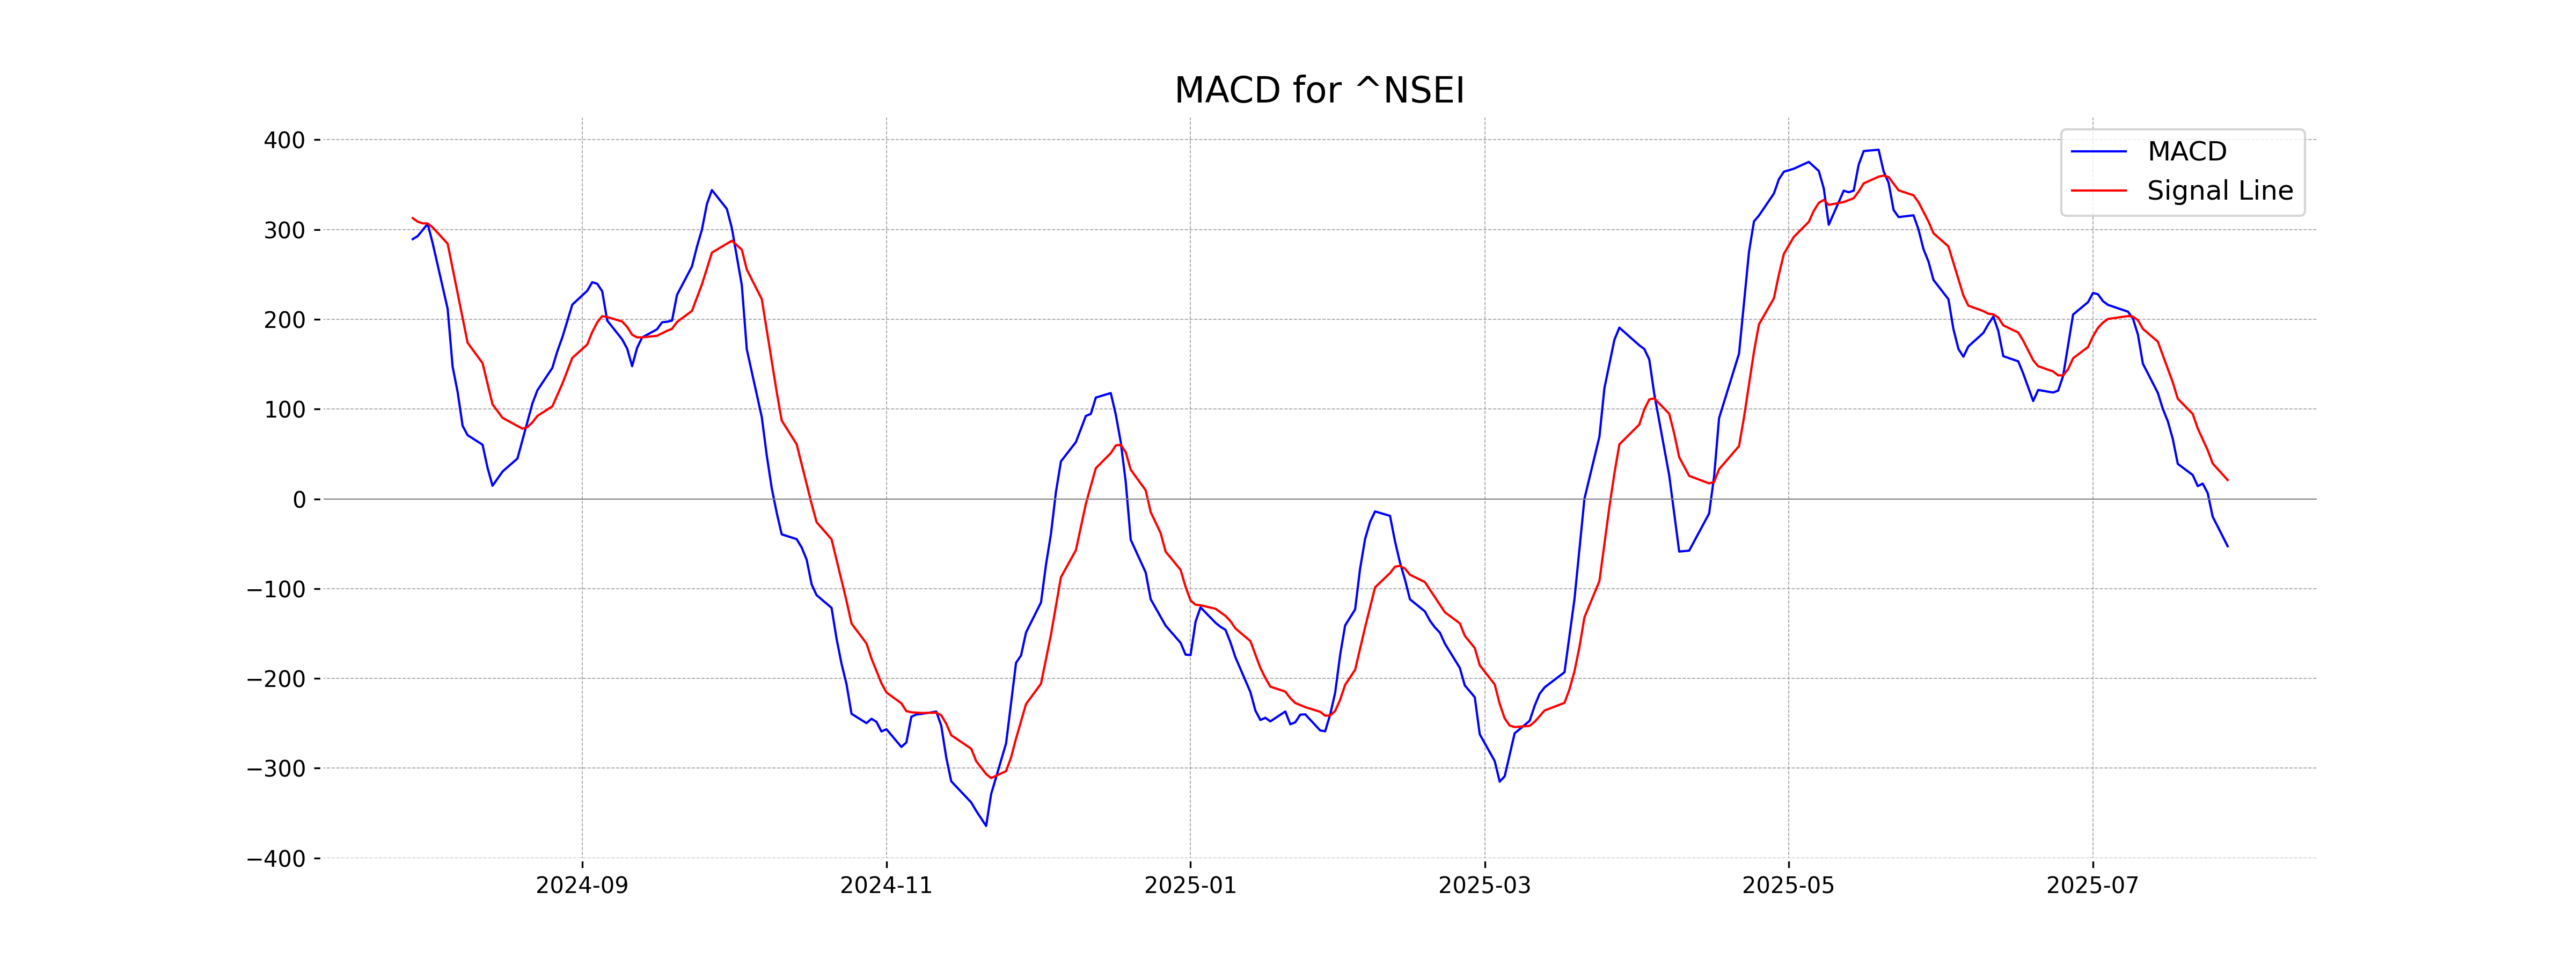
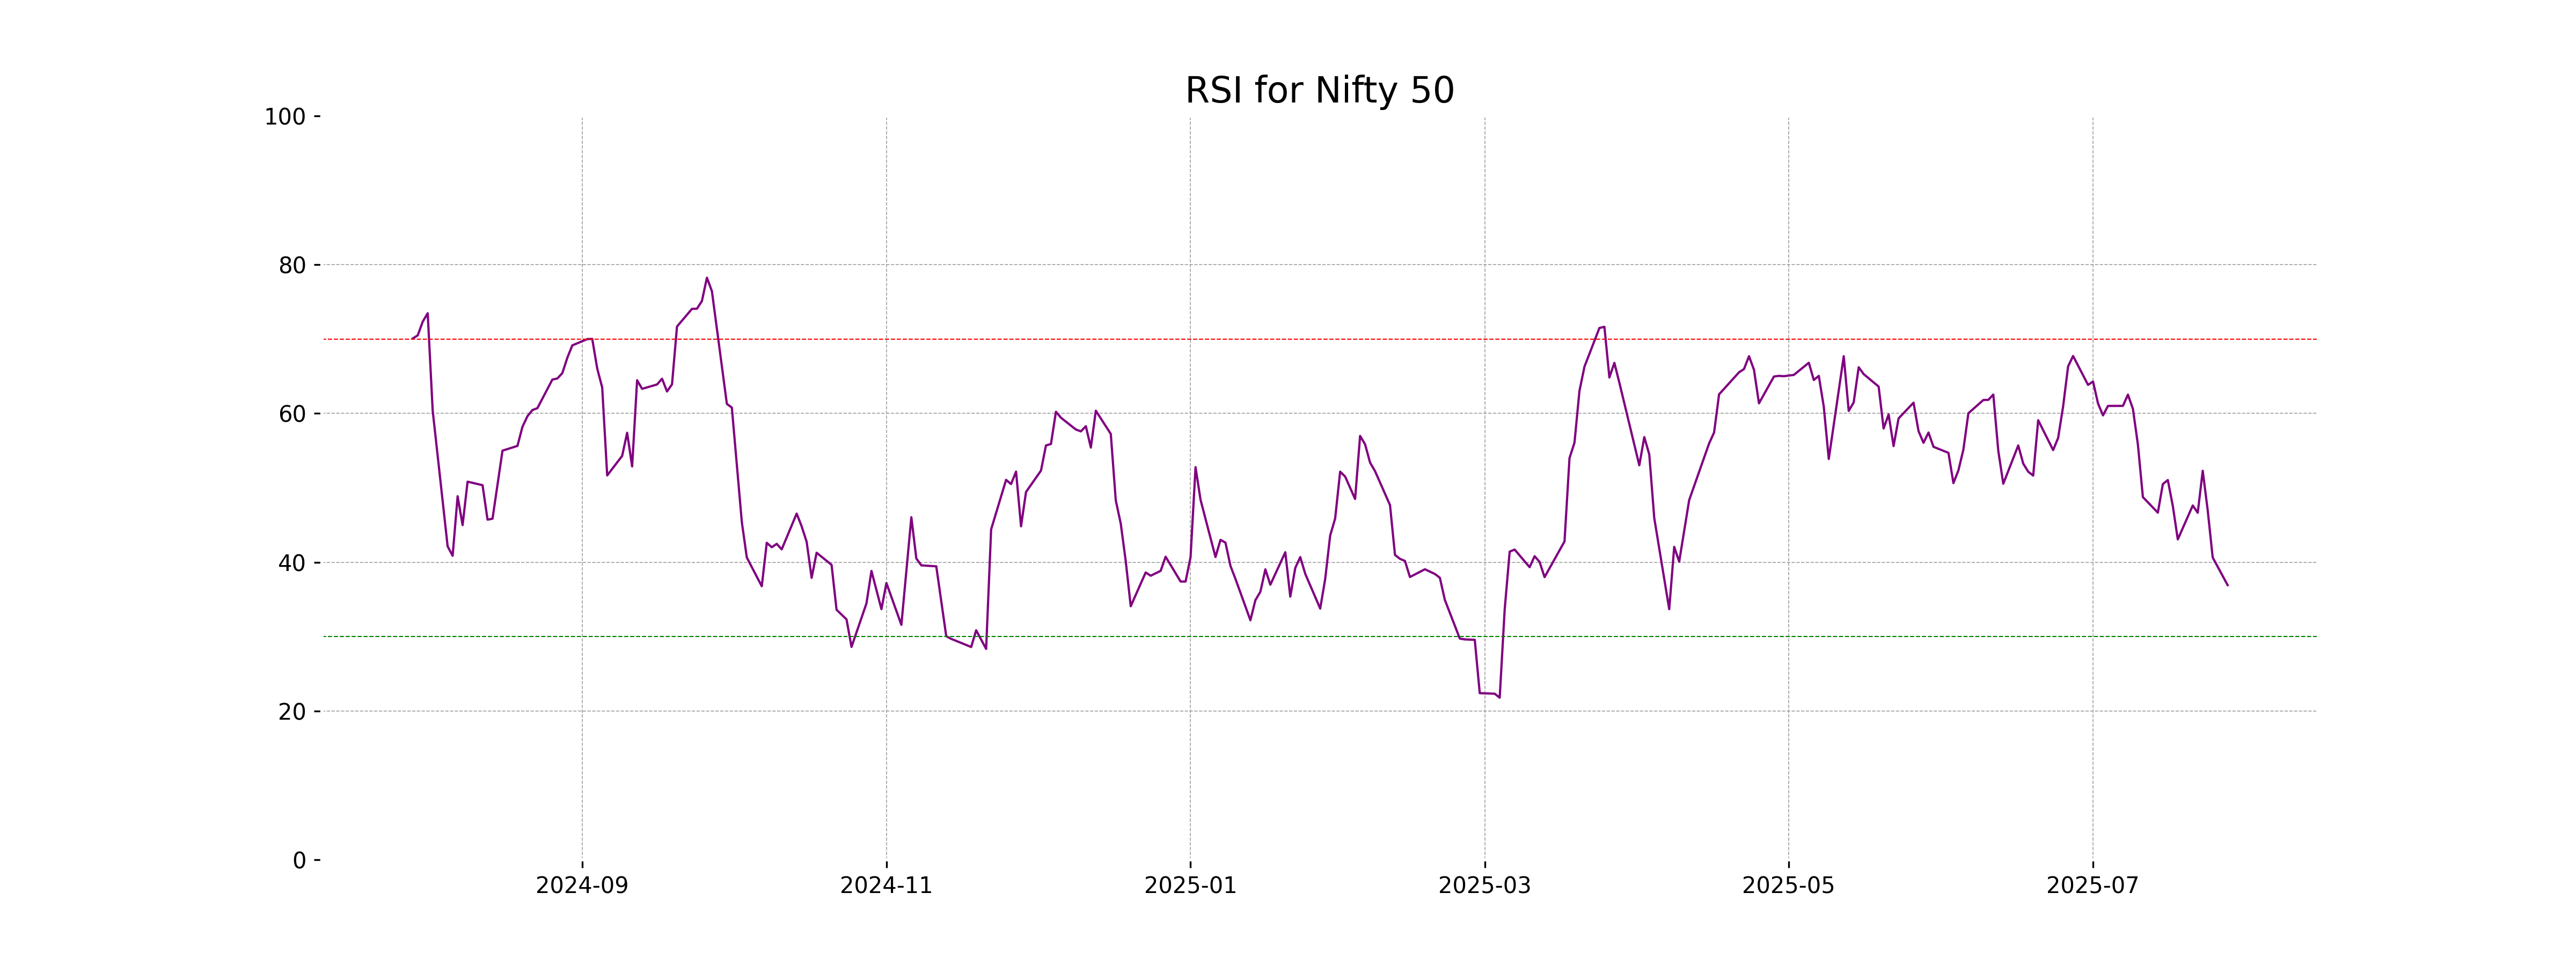
Analysis for Nifty 50 - July 28, 2025

Nifty 50 opened at 24,782.45 and closed at 24,680.90, marking a decrease of 0.63% or a points change of -156.10 from the previous close of 24,837. The Relative Strength Index (RSI) stands at 36.92, indicating a bearish momentum, with the Moving Average Convergence Divergence (MACD) signal suggesting negative trend as well. The 50-day EMA is at 24,942.73, above the current close, suggesting a potential resistance.
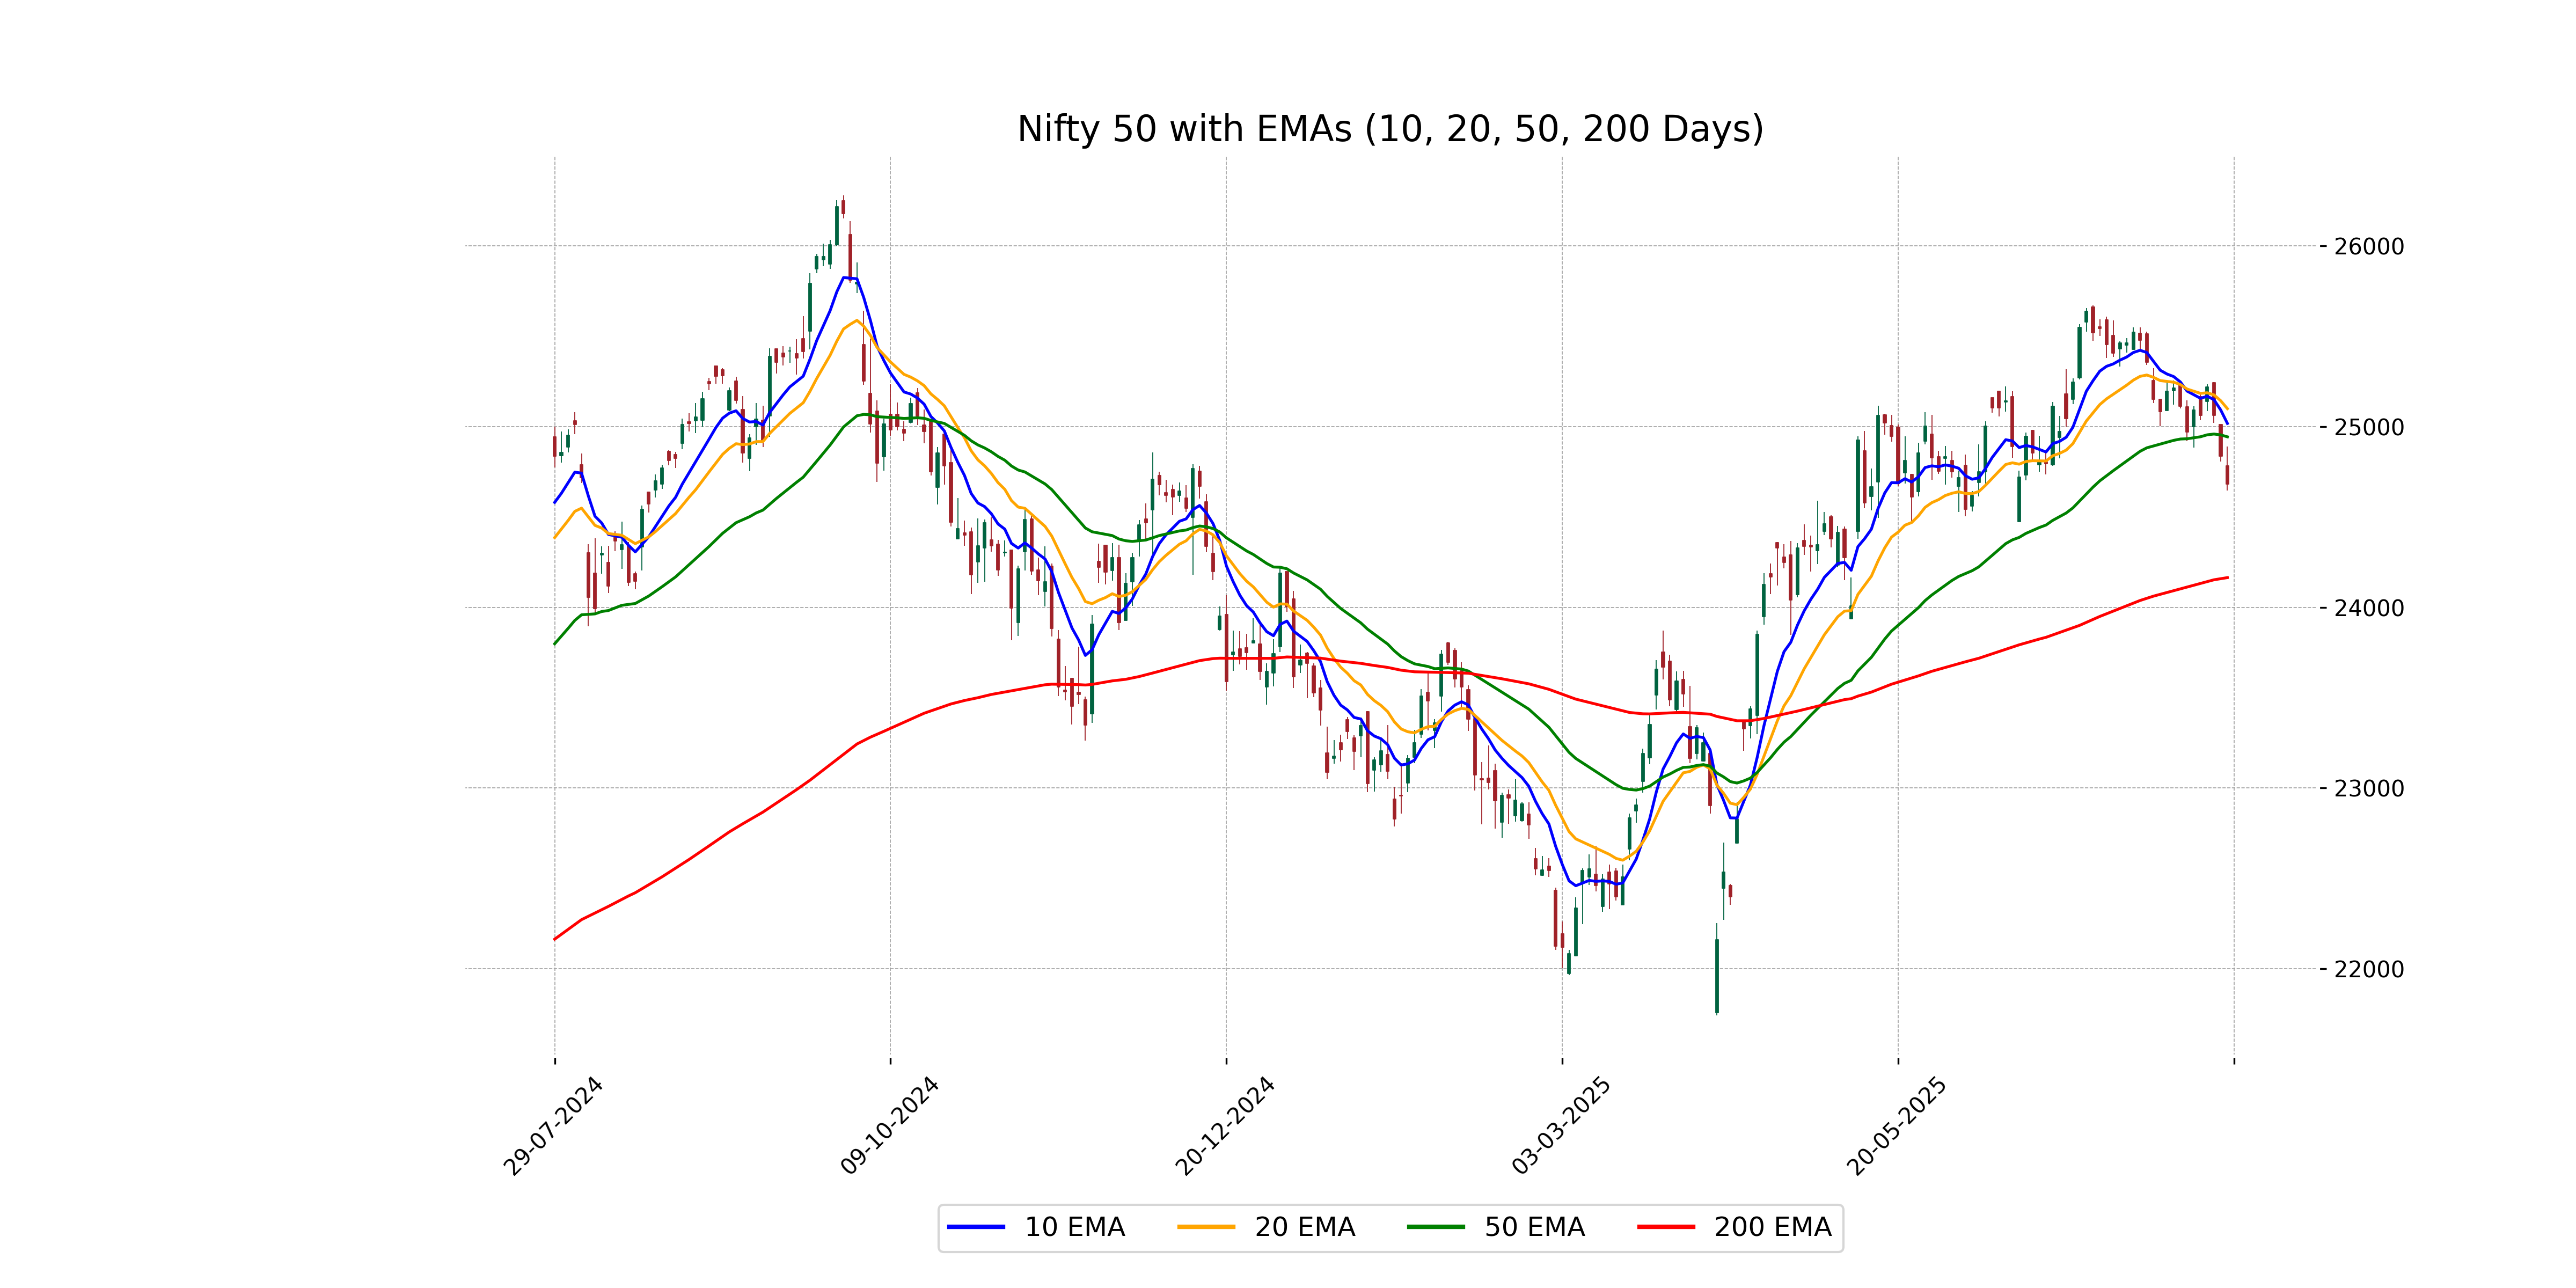
Relationship with Key Moving Averages
The Nifty 50 closed at 24,680.90, which is below its 50-day EMA of 24,942.73 and significantly below its 10-day EMA of 25,016.88 and 20-day EMA of 25,098.58. This indicates a bearish short-term trend as the current price is beneath all these key moving averages.
Moving Averages Trend (MACD)
The MACD for Nifty 50 is currently at -52.74, significantly below the MACD Signal of 20.95, indicating a bearish momentum. This suggests that the recent trend in prices is negative, and there might be selling pressure in the market.
RSI Analysis
The RSI value for Nifty 50 is 36.92, indicating that the index is approaching oversold territory, as it is below the typical threshold of 30 for being considered oversold. This suggests potential for a reversal or stabilization of price, but other technical indicators should also be considered for confirmation.
Up Next

Global stock market indices: How the world markets performed today - 28 July 2025

Centre plans to borrow Rs 8.20 lakh cr from market in first half of FY27

Reliance denies buying Iranian oil amid US sanctions waiver

Premium petrol price up Rs 2, industrial diesel up Rs 22; no change in normal petrol, diesel rates

India's GDP expected to register over 8 pc growth in Sep-Dec: Report

Govt announces seven measures to help boost exports

More videos

RBI keeps interest rates on hold after US trade deal boosts outlook

RBI proposes to compensate customers up to Rs 25,000 loss due to fraud

RBI raises GDP growth projection of Q1, Q2 of FY27

RBI pauses rate cuts, retains interest rate at 5.25 pc

Rupee jumps 122 paise to close at 90.27 against US dollar on India-US trade deal

Stock markets cheer India-US trade deal: Sensex, Nifty surge 2.5 pc

UPI transactions hit record high of Rs 230 lakh crore in 2025-26 till Dec: Govt

Explained: India-US trade deal, tariffs and trade benefits

Trade deal with US adds momentum to India's growth ambition: Industry leaders

Rupee jumps 119 paise to 90.30 against the US dollar on India-US trade deal
Editorji Technologies Pvt. Ltd. © 2022 All Rights Reserved.