


Highlights
- Global markets mixed with a tendency towards positive momentum
- Strong performances in European and U.S. markets
- RSI and MACD provided valuable insights into the prevailing market trends and potential reversals
Latest news

Another Hindu man lynched in Bangladesh over alleged extortion, government denies communal angle

US launches Christmas Day strikes on IS targets in Nigeria

Nitin Gadkari reveals how he met Hamas chief Ismail Haniyeh hours before assassination in Tehran

BNP acting chairman Tarique Rahman returns to Dhaka after 17 years in exile

India revamps tax regime in 2025, new I-T Act to take effect from April 1

BNP's acting chief Tarique Rahman set to return to Bangladesh after 17-year exile

Navi Mumbai International Airport starts commercial flight operations

PM Modi attends Christmas service at Delhi church, greets citizens
Global stock market indices: How the world markets performed today - 22 January 2025


The international stock market indices showed varied performances on January 22, 2025, reflecting the economic sentiment across different regions.
In this article, we analyze the performance of key global indices including the S&P 500, Dow Jones Industrial Average, NASDAQ Composite, FTSE 100, DAX, CAC 40, IBEX 35, Nikkei 225, Hang Seng, Nifty 50, and BSE Sensex.
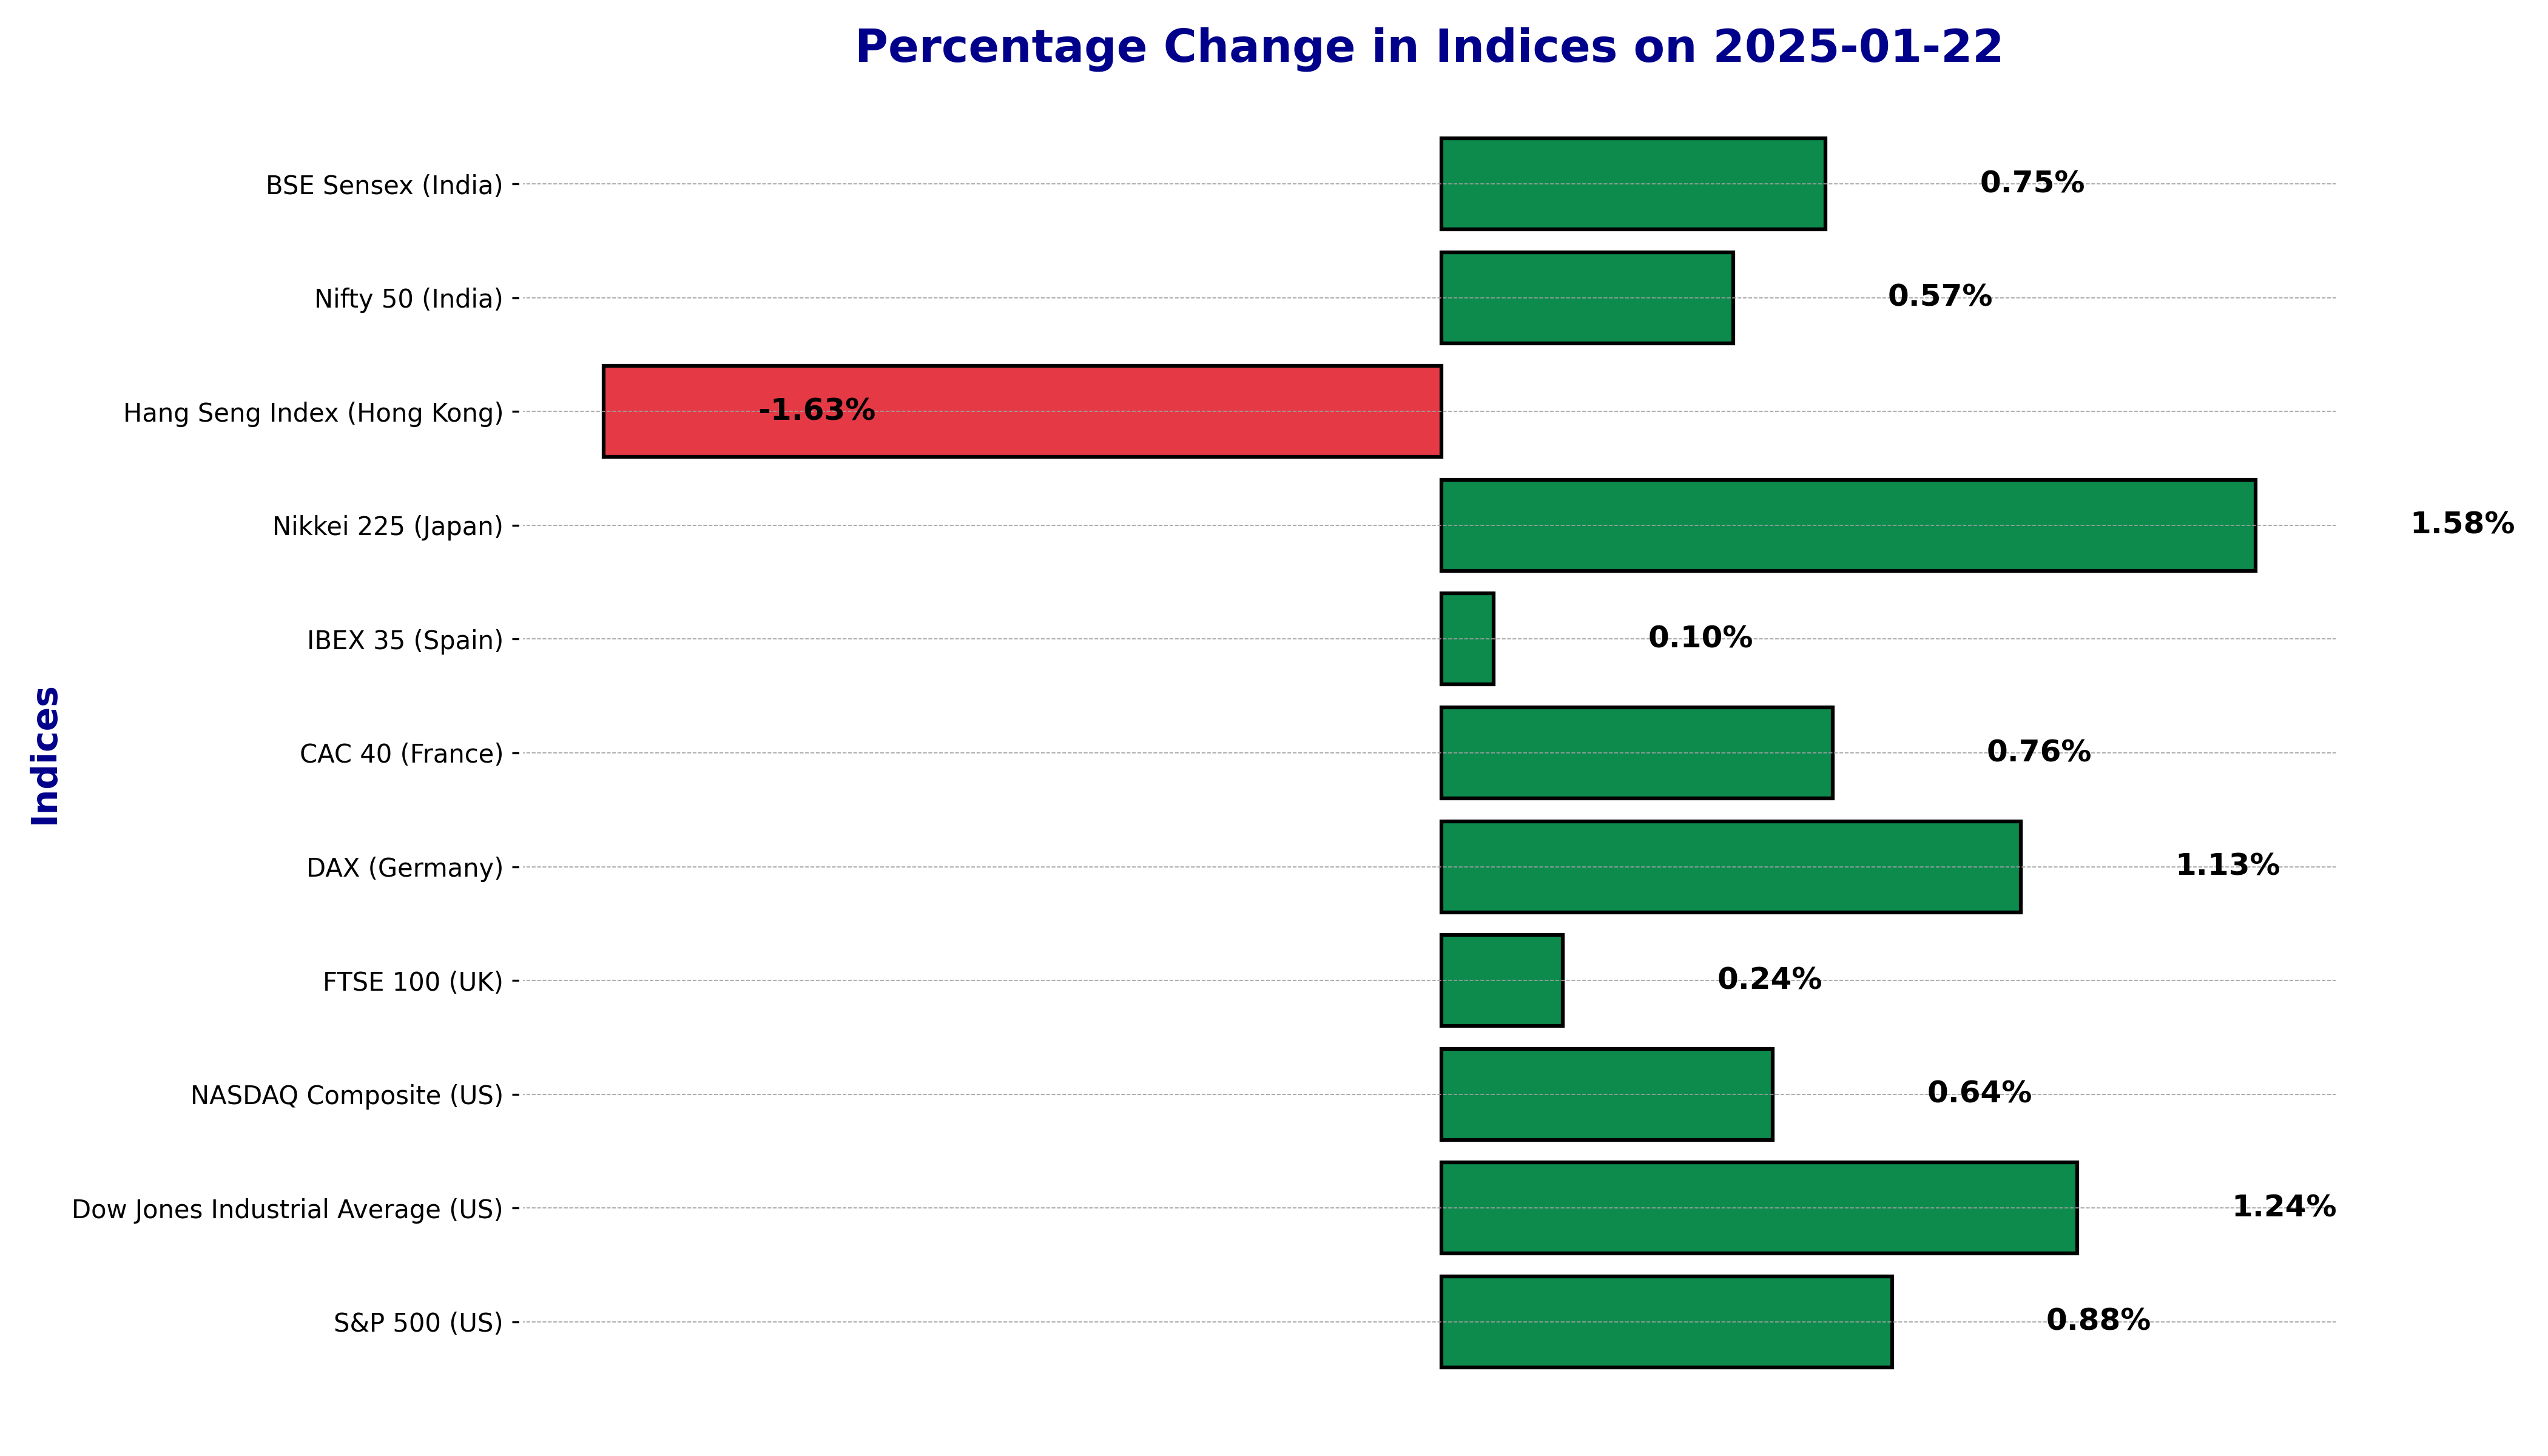
On January 22, 2025, the BSE Sensex (India) exhibited a notable performance with a % change
_candlestick_with_ema_1_year.png)
of 0.75%, representing a points change of 566.63 for the day, closing at 76,404.99. This performance provides valuable insight into the market's momentum and investor sentiment.
Technical Indicators: An analysis of the exponential moving averages (EMAs) provides further clarity on the current market conditions. The 50 EMA stands at 78,334.11, and the 200 EMA is at 78,856.32. These values suggest that the BSE Sensex is currently trading below both its mid-term and long-term average prices, indicating potential bearish momentum. The Relative Strength Index (RSI) at 38.50 signals that the market is approaching an oversold territory, which can often precede a market reversal upwards. Meanwhile, the Moving Average Convergence Divergence (MACD) is at -768.40, with a signal line at -697.90. The negative MACD further confirms the current bearish sentiment, although the histogram convergence hints at a possible change in momentum soon.
Market Sentiment: Evaluating the technical indicators, the current sentiment for the BSE Sensex suggests that the market is in a downtrend. The RSI value under 40 generally signifies oversold conditions which, combined with MACD being in the negative but showing signs of converging towards its signal line, might imply an impending trend change. The combination of these indicators suggests caution but also reflects that value investors might see potential for future growth if the trend reverses as indicated by the RSI and MACD dynamics.
CAC 40 (France) Technical Analysis on January 22, 2025
_candlestick_with_ema_1_year.png)
The CAC 40 index, representing the largest and most actively traded stocks in France, experienced a positive trading session on January 22, 2025. The index showed a percentage change of 0.76% and a points change gain of 59.14 points, closing at 7830.09 points.
Technical Indicators
The technical indicators reveal several insights into the market's movements. The 50-day Exponential Moving Average (EMA) is at 7465.20, and the 200-day EMA is at 7426.86. The relationship between these two EMAs indicates a strong uptrend, as the 50 EMA is above the 200 EMA, suggesting ongoing bullish momentum. This crossover is generally considered a positive sign for future price movements.
The Relative Strength Index (RSI) is currently at 76.39, indicating that the market is in overbought territory. An RSI above 70 is typically seen as a signal that the security is overbought, potentially hinting at a future corrective move or consolidation period.
The Moving Average Convergence Divergence (MACD) indicator is registering a value of 94.74, with a MACD Signal of 55.49. A positive MACD, particularly significantly above the signal line as here, suggests strong upward momentum, reinforcing the current bullish trend seen in the CAC 40.
Market Sentiment
Assessing the performance of the CAC 40 based on the technical indicators, it is evident that the market is in an uptrend. The combination of the 50 EMA being above the 200 EMA and a positive MACD suggests continuous positive sentiment among traders and investors. The RSI, although indicating an overbought condition, confirms strong buying interest but warns of potential short-term corrections. The MACD has provided further confidence in the upward trend by staying well above the signal line.
In conclusion, the CAC 40 index on January 22, 2025, demonstrated robust upward momentum, driven by favorable technical indicators. However, investors should remain vigilant of possible overbought conditions as signaled by the RSI, which could lead to short-term market adjustments.
DAX (Germany) - Market Analysis for January 22, 2025
_candlestick_with_ema_1_year.png)
The DAX (Germany) witnessed a notable change on January 22, 2025, with a percentage change of 1.13% and a points increase of 237.28. This indicates a solid upward movement for the day, closing at 21,279.28.
Technical Indicators Analysis:
Looking at the technical indicators, we find critical insights:
Exponential Moving Averages (EMA):
The 50-day EMA for the DAX stands at 20,371.70, while the 200-day EMA is at 20,294.85. The current close of 21,279.28 is above both these EMAs, suggesting a strong bullish momentum.
Relative Strength Index (RSI):
The RSI is at 79.63, which is above the typically overbought threshold of 70. This high RSI value suggests that the market might be in an overbought condition, signaling potential caution for new buyers, but also confirming a strong current uptrend.
Moving Average Convergence Divergence (MACD):
The MACD value is 214.49, with a MACD Signal of 112.38. The MACD line is significantly above the signal line, which is a bullish indicator, reinforcing the bullish trend.
Market Sentiment:
The performance of the DAX on this particular day indicates a strong uptrend. The fact that the closing price is significantly above the 50 EMA and 200 EMA further underscores this bullish sentiment. The high RSI value confirms the market's strong upward momentum, albeit with a cautionary note on potential overheating. The MACD crossover above the signal line adds further bullish confirmation.
In conclusion, the analysis based on these technical indicators suggests that the DAX (Germany) was in a robust uptrend on January 22, 2025, supported by bullish signals from both the RSI and MACD.
Technical Analysis for Dow Jones Industrial Average (US) on January 22, 2025
_candlestick_with_ema_1_year.png)
The Dow Jones Industrial Average (US) experienced a notable upward movement on January 22, 2025. With a significant percentage change of 1.24%, the index closed with a points change of 537.98, indicating a positive shift in market sentiment for the day. The stock closed at 44,025.81, rising from the previous close of 43,487.83.
Technical Indicators:
The 50-day Exponential Moving Average (EMA) for the Dow Jones Industrial Average stands at 43,178.53, while the 200-day EMA is at 43,330.40. This suggests that the current close price is significantly above both the 50 EMA and the 200 EMA, indicating a bullish market condition. When the shorter-term EMA crosses above the longer-term EMA, it's often considered a positive sign by traders.
The Relative Strength Index (RSI) is 61.23, which is above the midpoint of 50 but below the overbought level of 70. This implies that the market is in a moderately bullish phase. The RSI provides insight into the momentum of price movements, suggesting the potential for further upward movement without being overextended.
The Moving Average Convergence Divergence (MACD) indicator is at -12.73, with a MACD Signal of -184.43. Although both values are in the negative, the MACD line moving towards the signal line indicates a potential bullish reversal. A crossover above the signal line can often be seen as a buying opportunity.
Market Sentiment:
The current technical state of the Dow Jones Industrial Average displays strong bullish undercurrents supported by key technical indicators. The fact that the close price significantly exceeds both the 50 EMA and the 200 EMA suggests that the market is in an uptrend. The moderately high RSI further strengthens this sentiment as it corroborates continued buying pressure without entering overbought territory.
Overall, the MACD, while still negative, is converging towards its signal, suggesting diminishing bearish momentum. This convergence, when combined with the other bullish indicators, points towards a potentially strong market performance moving forward. Investors and traders may view this as an encouraging sign to maintain or initiate long positions in anticipation of continued growth.
FTSE 100 (UK) Technical Analysis for January 22, 2025
_candlestick_with_ema_1_year.png)
The FTSE 100 (UK) concluded its trading session on January 22, 2025, with a notable change in its value. The stock experienced a % change of 0.236%, equivalent to a points change of 20.18 points. This movement reflects the current dynamics of the market as investors navigate through various economic indicators and market sentiments.
Technical Indicators Review:
The 50 EMA (Exponential Moving Average) stood at 8300.44, while the 200 EMA was observed at 8284.03. The divergence between these two EMAs suggests that the market may be in a current upward momentum phase, as the short-term EMA is above the long-term EMA.
The RSI (Relative Strength Index) was recorded at 73.14, indicating that the FTSE 100 is possibly in overbought territory. An RSI value above 70 often suggests that a stock has been overbought, implying upcoming levels of resistance or potential reversals.
The MACD (Moving Average Convergence Divergence) at 70.06, with its signal line at 33.24, points towards continued bullish sentiment. A MACD above the signal line indicates upward momentum, aligning with the observed upward trend in the EMAs.
Market Sentiment:
Based on the technical indicators mentioned, the market sentiment for the FTSE 100 appears to be in an uptrend. The 50 EMA being above the 200 EMA, combined with an RSI above 70, suggests that the market has been experiencing positive momentum. Additionally, the MACD being significantly higher than its signal line corroborates the bullish sentiment observed, emphasizing the uptrend the market is currently experiencing. The convergence of these indicators aids in affirming the market's optimistic trajectory, despite the potential caution indicated by the RSI's proximity to overbought conditions.
Technical Analysis for the Hang Seng Index (Hong Kong) on January 22, 2025
_candlestick_with_ema_1_year.png)
On January 22, 2025, the Hang Seng Index (Hong Kong) experienced a notable decline. The index recorded a percentage change of -1.63% and witnessed a points change, falling by 327.78125 points. This considerable drop is indicative of negative market sentiment for the day.
Technical Indicators Overview:
The analysis of the moving averages and oscillator indicators provides a deeper understanding of the market conditions:
50 EMA: The 50-day Exponential Moving Average (EMA) for the Hang Seng Index was valued at 19,679.99. The price closing below this average suggests that the market could potentially continue its downward trend.
200 EMA: The 200-day EMA stood at 19,715.82, a value higher than both the closing price and the 50 EMA. This alignment generally confirms a bearish sentiment, indicating that the longer-term trend might also be leaning towards the downside.
Relative Strength Index (RSI): The RSI of 53.30 suggests that the market is relatively neutral; however, being just above 50, it leans slightly towards the bullish side. A value of 53.30 does not indicate an overbought or oversold condition, offering no strong reversal signals.
MACD: The Moving Average Convergence Divergence (MACD) was at -12.42, with a MACD Signal of -79.33. The positive crossover where the MACD line is above the signal line suggests a possible recovery or slowdown in the decline, despite the overall negative sentiment from other indicators.
Market Sentiment and Trend Analysis:
The current performance of the Hang Seng Index, analyzed through the moving averages and oscillator indicators, indicates that the market was in a downtrend on this particular day. The short-term moving averages falling below the longer-term averages typically confirm a negative trend. The RSI, being slightly above 50, does not offer strong bullish or bearish signals, leaving it in a neutral zone. However, the MACD, while negative, shows a possible change in momentum due to a positive crossover, indicating that traders should closely monitor for potential reversals or corrections.
Overall, the technical analysis signals a predominately bearish outlook for the Hang Seng Index on January 22, 2025. Investors and traders should remain cautious, considering prevailing technical signals that lean towards a continuation of the downward trend.
Technical Analysis Summary for IBEX 35 (Spain) on January 22, 2025
_candlestick_with_ema_1_year.png)
The IBEX 35 (Spain) displayed slight positive movement on January 22, 2025. The index experienced a percentage change of 0.10%, translating into a points change of 12.10, closing at 11,939.5.
Technical Indicators:
The 50-day Exponential Moving Average (EMA) for the IBEX 35 was recorded at 11,768.65, which suggests the index has been experiencing a relatively steady uptrend over the medium term. Meanwhile, the 200-day EMA is close to this figure at 11,758.41, reinforcing the index's upward momentum over a longer span.
The Relative Strength Index (RSI) stands at 60.77, indicating that the IBEX 35 is in a moderately overbought condition. This suggests that while the market is bullish, there’s a potential risk of a pullback if sentiment turns.
As for the Moving Average Convergence Divergence (MACD), the value is 56.09 with a signal line at 32.08. A MACD above the signal line often points to a bullish trend, and the current data aligns with this, suggesting continued positive momentum.
Market Sentiment:
The technical indicators collectively signify that the market sentiment for the IBEX 35 is bullish, with an uptrend observable. The RSI above the neutral 50 level supports this bullish outlook, indicating upward momentum without entering overbought extremes. Additionally, the MACD's position above its signal line bolsters the perspective of a prevailing uptrend.
This analysis suggests that the IBEX 35 is currently in a healthy market phase but does warrant attentive monitoring for any changes in the RSI or MACD, which could signal shifts in momentum or potential overvaluation.
NASDAQ Composite (US) Analysis – January 22, 2025
_candlestick_with_ema_1_year.png)
The NASDAQ Composite (US) on January 22, 2025, closed at 19,756.78, indicating a positive movement in the market. The index experienced a percentage change of 0.64%, translating to a points change of 126.58 from the previous close of 19,630.20.
Technical Indicators
The 50-day Exponential Moving Average (EMA) for the NASDAQ Composite stands at 19,574.13. In comparison, the 200-day EMA is at 19,605.45. Observing these values shows the market prices being closely aligned to the longer-term EMA, indicating the potential of a consolidating trend.
The Relative Strength Index (RSI) is at 55.04, which is a neutral zone. An RSI above 70 indicates an overbought market, while below 30 indicates an oversold market. Thus, the current RSI suggests a balanced momentum with neither extreme
On the Moving Average Convergence Divergence (MACD) analysis, the MACD is at -47.36 with a MACD Signal of -71.37. The MACD is above the Signal Line, indicating a possible bullish momentum.
Market Sentiment
The NASDAQ Composite (US) showed signs of an upward trend given the percentage and points rise. The marginally above-neutral RSI and MACD indicators aligning with a possible bullish signal suggest positive market sentiment. The MACD, in particular, hints at strengthening momentum since it's moving towards crossing and overtaking the Signal Line, while the RSI reaffirms this steady position in the market.
Overall, the NASDAQ displayed a cautious optimism amidst prevailing market conditions, with technical indicators pointing out potential stability in the upcoming sessions.
Technical Analysis for Nifty 50 (India) on January 22, 2025
_candlestick_with_ema_1_year.png)
The Nifty 50 (India) closed at 23,155.35 on January 22, 2025, showing a percentage change of 0.57% and a points change of 130.70 from the previous close of 23,024.65. Here's a detailed analysis based on various technical indicators:
Technical Indicators:
50 EMA: The 50 Exponential Moving Average (EMA) for Nifty 50 is currently at 23,705.20. This value is above the closing price, indicating that the market is likely experiencing a short-term downtrend, as the price is below this significant moving average.
200 EMA: The 200 Exponential Moving Average stands at 23,854.77. Similar to the 50 EMA, the price being below the 200 EMA suggests a bearish longer-term trend. This long-term trend indicator confirms a potential downtrend when prices remain below it for a sustained period.
RSI: The Relative Strength Index (RSI) is at 38.81, which is below the neutral 50 mark. RSI values below 50 typically indicate weakening momentum. While it hasn't reached the oversold threshold of 30, the current RSI suggests cautious sentiment among traders, hinting at potential bearish momentum.
MACD: The Moving Average Convergence Divergence (MACD) is at -219.29, with the MACD Signal line at -199.80. A negative MACD value and a negative signal line indicate bearish momentum. The MACD crossing below its signal line is typically viewed as a bearish sign, further emphasizing a potential downtrend.
Market Sentiment:
Evaluating the performance of the Nifty 50 using these technical indicators, we observe a predominantly negative sentiment. The indicators point towards a downtrend given that the current price is below both the 50 and 200 EMAs, confirming a longer-term bearish signal. The RSI further suggests weakening momentum, as it hovers below the neutral level. Additionally, the MACD's negative reading, coupled with being below its signal line, corroborates the view of declining momentum in the market. Therefore, traders and investors should exercise caution, as these indicators reflect a bearish outlook for the Nifty 50, despite the minor positive fluctuation observed on this particular day.
Technical Analysis of Nikkei 225 (Japan) - January 22, 2025
_candlestick_with_ema_1_year.png)
The Nikkei 225 (Japan) witnessed a notable upward movement on January 22, 2025, with an impressive percentage change of 1.58% and a points change of 618.27. This significant climb in the index demonstrates a positive sentiment among investors, reflecting bullish market conditions.
Technical Indicators Overview:
The 50-day Exponential Moving Average (EMA) for the Nikkei 225 stands at 39189.90, while the 200-day EMA is almost identical at 39189.42. This close proximity between the 50 EMA and 200 EMA indicates a lack of a clear medium-to-long-term trend direction at the moment. However, with the current price above both EMAs, it suggests the possibility of an uptrend continuation.
Looking at the Relative Strength Index (RSI), the Nikkei 225 is marked at 56.76. The RSI, hovering above the 50 threshold, points toward a moderate bullish momentum. It doesn't indicate an overbought condition, which could imply a continuation of the current upward trajectory.
Examining the Moving Average Convergence Divergence (MACD), we find it at -64.96, with the MACD Signal line at -52.70. While both values are negative, the MACD being below the Signal line often indicates potential bearishness. However, the overall positive movement in the Nikkei on this day suggests that these indicators should be watched closely for potential divergence patterns that may signal market reversals.
Market Sentiment:
The overall sentiment for the Nikkei 225, judged from its recent performance and technical indicators, appears cautiously optimistic. The current market is leaning towards an uptrend, primarily supported by the percentage and points increase in the index. While the RSI hints at a continued bullish move without reaching overbought levels, the MACD's positioning presents a cautious outlook, advising investors to remain vigilant of any changes.
In conclusion, the blend of a positive price movement combined with technical indicators such as EMAs and RSI supports a short-term bullish sentiment for the Nikkei 225 (Japan), with the recommendation of keeping an eye on the MACD for any potential shifts in momentum. This analysis suggests a market environment inclined towards growth, albeit with an eye on possible turning points.
S&P 500 (US) Technical Analysis for January 22, 2025
_candlestick_with_ema_1_year.png)
On January 22, 2025, the S&P 500 (US) experienced a 0.8768% change, equivalent to a points increase of 52.58. This shows a positive movement in the market compared to the previous close of 5996.66, ending the session at 6049.24.
Technical Indicators:
The performance of the S&P 500 (US) is analyzed using several key technical indicators:
- 50 EMA: The 50 Exponential Moving Average (EMA) stands at 5961.53, indicating the short to mid-term momentum is below the current price, suggesting a bullish sentiment.
- 200 EMA: The 200 EMA is positioned at 5974.83, which acts as a support level and is also below the current trading price. This further supports a potential long-term uptrend.
- RSI: The Relative Strength Index (RSI) value is 58.77. Generally, an RSI above 50 suggests that the market is in a neutral to bullish phase without being overbought.
- MACD: The Moving Average Convergence Divergence (MACD) is at -5.54, with a signal line at -20.55. This negative value traditionally represents a bearish sentiment; however, since the MACD is rising towards its signal line, it could be indicative of a change in momentum to the upside.
Market Sentiment:
The analysis of technical indicators suggests that the S&P 500 (US) market is leaning towards an uptrend. Despite the MACD displaying a negative value, its movement towards convergence with the signal line could herald a shift towards bullish momentum. The RSI further supports this minor uptrend as it is positioned in a moderate range, indicating neither overbought nor oversold conditions.
Overall, these factors combined imply a cautiously optimistic sentiment in the market favoring long positions, contributive to the positive percentage and points changes observed in the S&P 500 on this date.
Up Next
Global stock market indices: How the world markets performed today - 22 January 2025

New Zealand commits USD 20 bn investment in India under FTA in 15 yrs; on lines of EFTA pact

India, New Zealand conclude FTA talks; pact to offer duty-free access, USD 20 bn FDI

FTA with New Zealand to significantly deepen bilateral economic engagement: Govt

Rupee breaches 91-mark against US dollar for first time in intra-day trade

Microsoft commits USD 17.5 billion investment in India: CEO Satya Nadella

More videos

CBI books Anil Ambani's son, Reliance Home Finance Ltd. in Rs 228 crore bank fraud case

RBI raises FY26 GDP growth projection to 7.3 pc

RBI trims policy interest rate by 25bps to 5.25pc, loans to get cheaper

Rupee slumps to all-time low of 90.25 against US dollar in intra-day trade

Reliance completes merger of Star Television Productions with Jiostar

India to lead emerging market growth with 7pc GDP rise in 2025: Moody’s

Nifty hits record high after 14 months; Sensex nears all-time peak

Reliance stops Russian oil use at its only-for-export refinery to comply with EU sanctions

ED attaches fresh assets worth over Rs 1,400 cr in case against Anil Ambani's Reliance Group

India signs one-year deal to import 2.2 million tonnes of LPG from US