


Highlights
- Global market sentiment reflected a diverse narrative
- Bullish momentum highlighted by RSI in select indices
- Persistent negative MACD readings across multiple indices
Latest news

US launches Christmas Day strikes on IS targets in Nigeria

Nitin Gadkari reveals how he met Hamas chief Ismail Haniyeh hours before assassination in Tehran

BNP acting chairman Tarique Rahman returns to Dhaka after 17 years in exile

India revamps tax regime in 2025, new I-T Act to take effect from April 1

BNP's acting chief Tarique Rahman set to return to Bangladesh after 17-year exile

Navi Mumbai International Airport starts commercial flight operations

PM Modi attends Christmas service at Delhi church, greets citizens

Gujarat AAP MLA Chaitar Vasava refutes Rs 75 lakh extortion claims by BJP MP
Global stock market indices: How the world markets performed today - 27 February 2025


The international stock market indices showed varied performances on February 27, 2025, reflecting the economic sentiment across different regions.
In this article, we analyze the performance of key global indices including the S&P 500, Dow Jones Industrial Average, NASDAQ Composite, FTSE 100, DAX, CAC 40, IBEX 35, Nikkei 225, Hang Seng, Nifty 50, and BSE Sensex.

Analysis for Sensex - February 27, 2025

The Sensex opened at 74,706.60 points and closed at 74,612.43 points, showing a slight increase of 0.014% compared to its previous close. The RSI is at 31.84, indicating potential oversold conditions, while both the 50 and 200-day EMAs are higher than the current levels, suggesting a bearish trend. The MACD value is negative, further reinforcing the bearish sentiment.

Relationship with Key Moving Averages
The Sensex's current close is below its 10 EMA, 20 EMA, 50 EMA, and 200 EMA, indicating a bearish trend as it is trading below all these key moving averages. Additionally, the RSI is at 31.84, which suggests the index is nearing oversold conditions.
Moving Averages Trend (MACD)
MACD Analysis for Sensex: The MACD for Sensex is negative at -707.74, indicating a bearish trend. The MACD is below its signal line at -532.70, which further suggests potential downward momentum.

RSI Analysis
The RSI for Sensex is 31.84, which suggests that the index is approaching oversold conditions. This level indicates potential for a reversal or a stabilization if market sentiment turns positive, as it is close to the typical oversold threshold of 30.

Analysis for Dow Jones Industrial Average (US) - February 27, 2025

The Dow Jones Industrial Average (US) showed a decrease in performance with a closing value of 43,433.12, down from the previous close of 43,621.16, indicating a percentage change of -0.43%. The index recorded a trading volume of 590.27 million and has an RSI value of 40.16, suggesting it is near the oversold territory. The MACD value of -61.06 also indicates a bearish momentum as it remains below its signal line.

Relationship with Key Moving Averages
The Dow Jones Industrial Average's close of 43,433.12 is below its 50-day EMA (43,863.21), 10-day EMA (43,933.86), and 20-day EMA (44,068.99), indicating a bearish trend in the short to intermediate term. Additionally, the RSI of 40.16 suggests that the index is approaching oversold conditions.
Moving Averages Trend (MACD)
MACD Analysis for Dow Jones Industrial Average: The MACD value of -61.06, which is below the MACD signal value of 119.72, suggests a bearish momentum in the Dow Jones Industrial Average. This indicates potential continued downward pressure on the index.

RSI Analysis
RSI Analysis for Dow Jones Industrial Average (US): The Relative Strength Index (RSI) for the Dow Jones Industrial Average is currently at 40.16, suggesting it is approaching oversold territory, but not quite there yet. Values below 30 typically indicate an oversold condition, so the index may still have room to decline before triggering potential buying interest.

Analysis for CAC 40 (France) - February 27, 2025
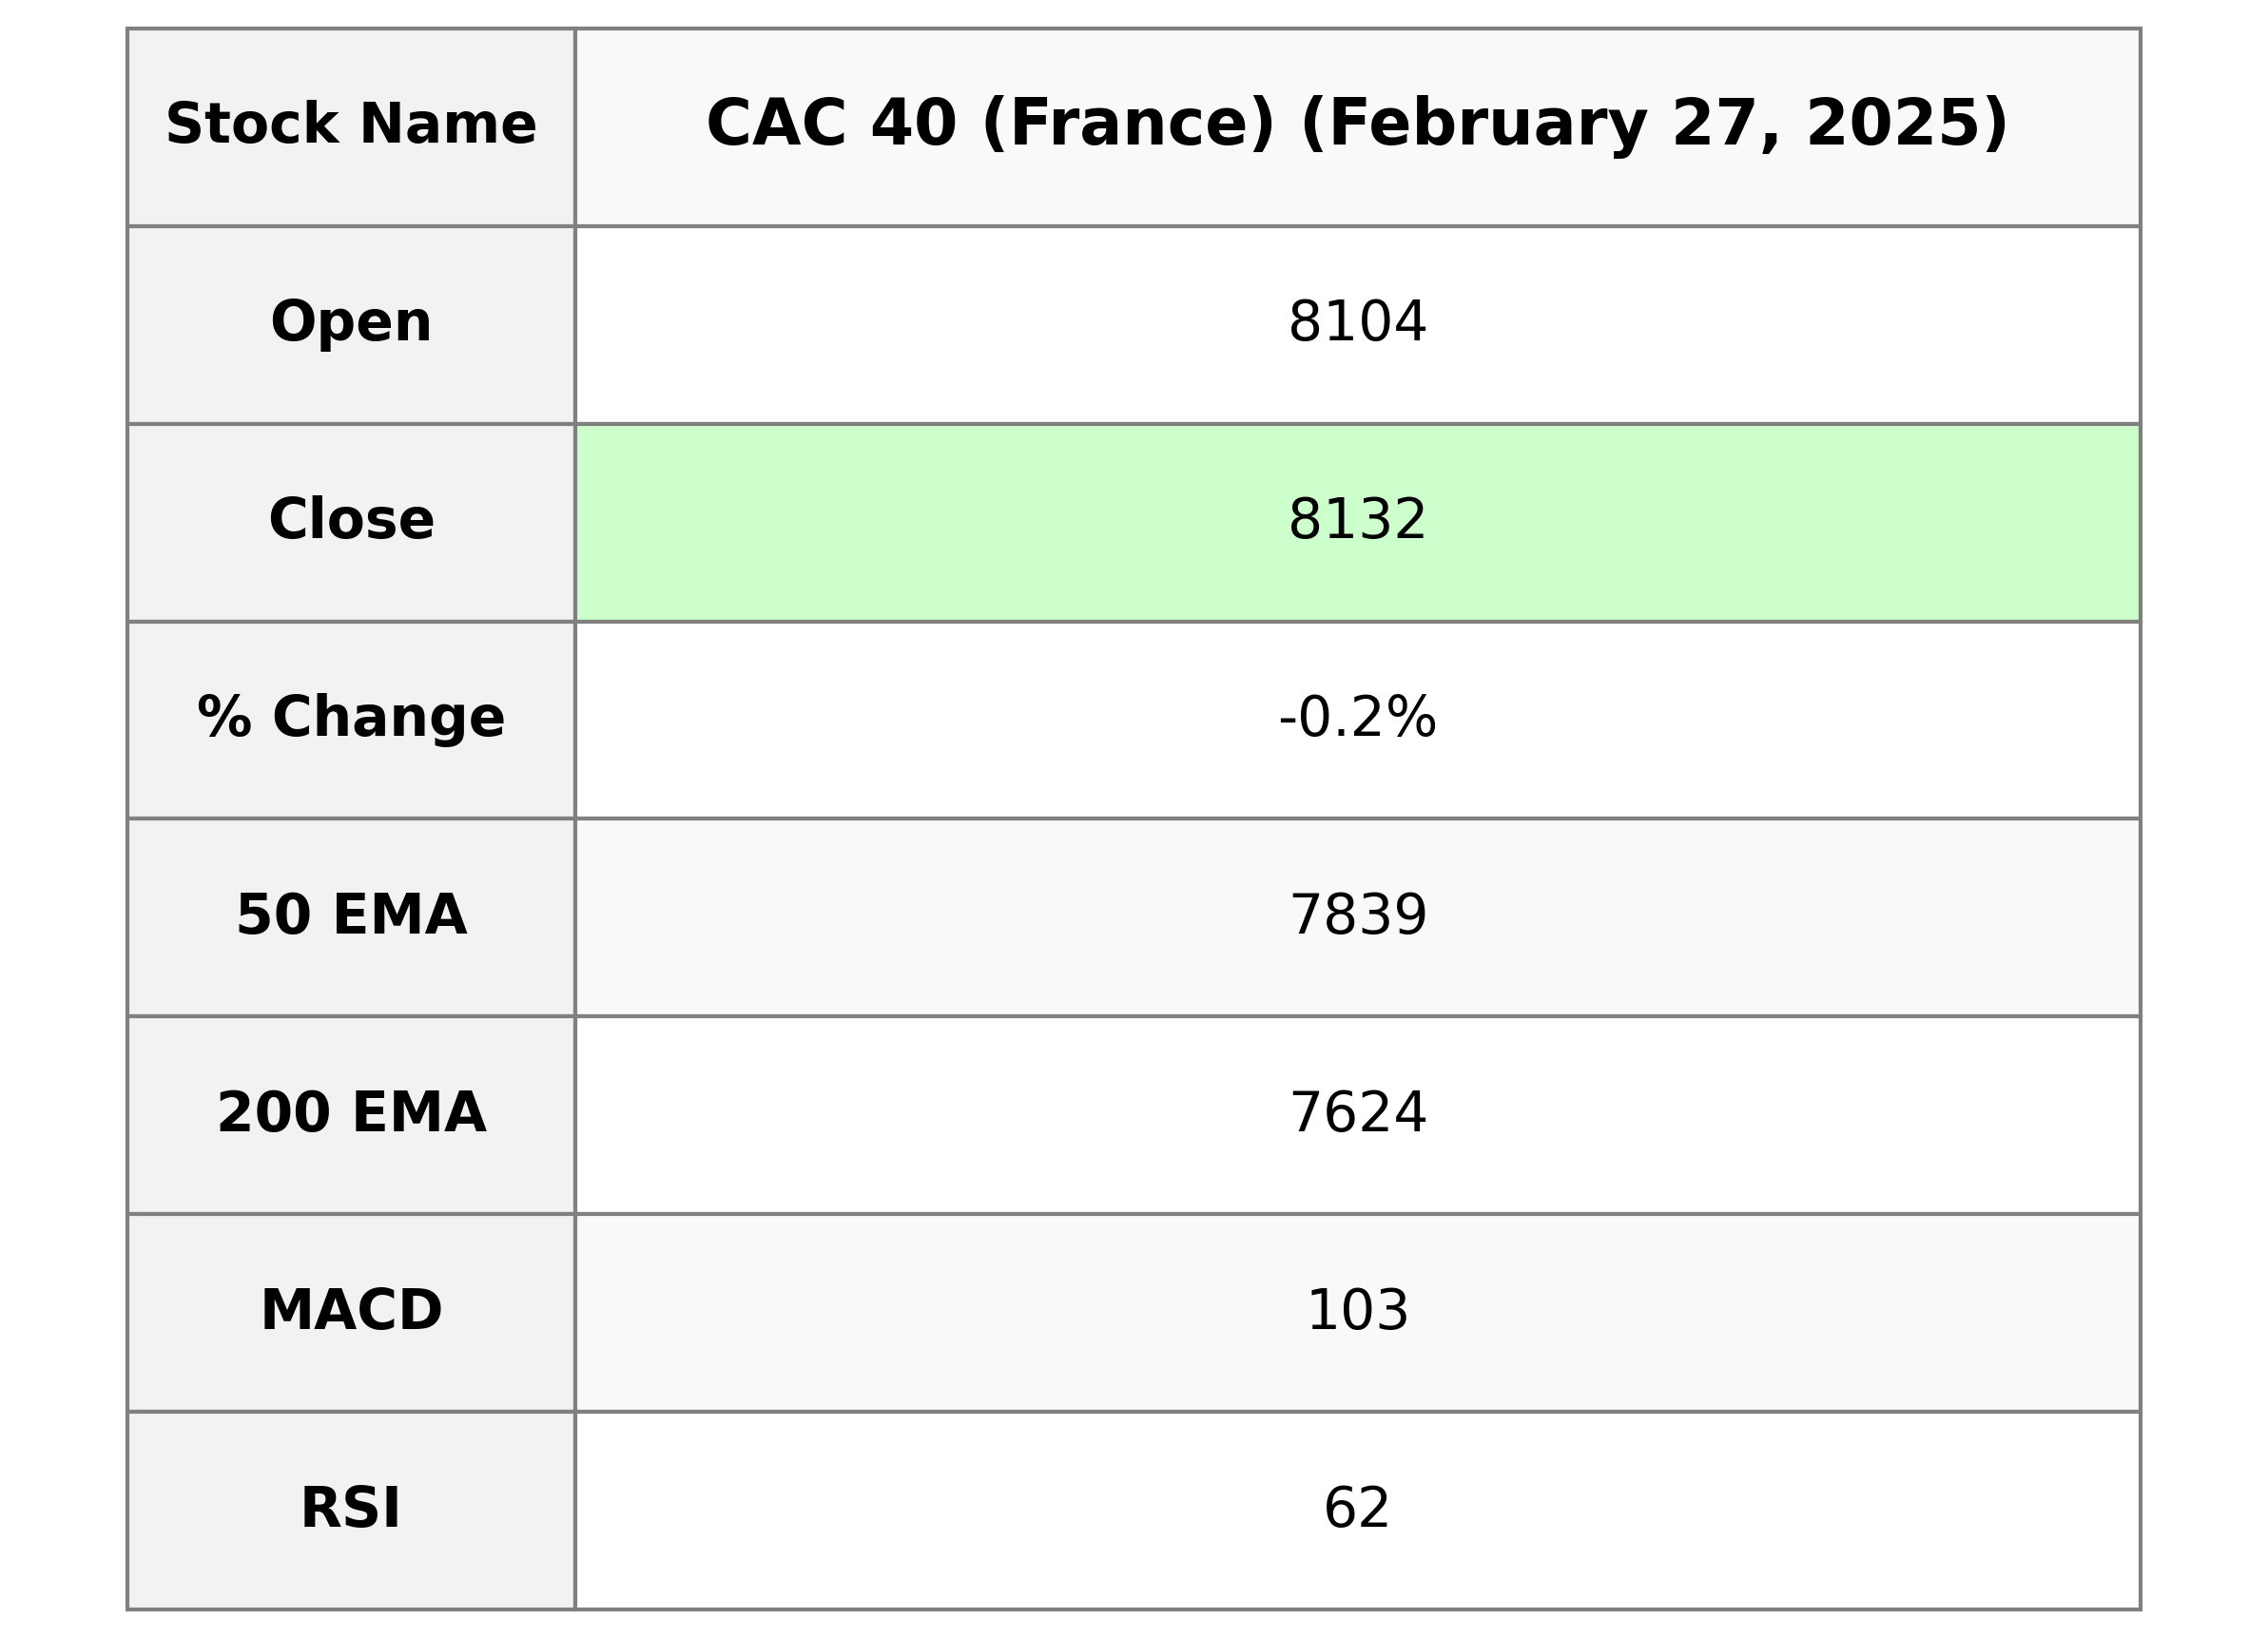
CAC 40 (France) Performance: The CAC 40 index opened at 8104.23, reaching a high of 8132.77 and a low of 8075.27, closing slightly lower at 8131.65. Despite a minor decline of 0.15% or 12.27 points from the previous close of 8143.92, the index's technical indicators such as the 10-day EMA at 8108.64, and an RSI of 62.17 suggest a relatively stable trend. The MACD at 102.80 indicates a potential bearish convergence, considering the MACD signal is at 121.39.

Relationship with Key Moving Averages
The CAC 40 index is currently trading above its 50-day EMA of 7838.95 and 200-day EMA of 7624.41, indicating a bullish trend overall. However, its close is slightly above the 10-day EMA of 8108.64, suggesting possible near-term consolidation.
Moving Averages Trend (MACD)
The MACD for CAC 40 (France) is 102.80, with a MACD Signal of 121.39, indicating a bearish trend as the MACD is below the signal line. This suggests potential selling pressure, but the RSI of 62.17 shows the trend is not overly bearish yet.

RSI Analysis
The CAC 40 (France) has an RSI of 62.17, indicating a moderately strong momentum that suggests the index is approaching overbought territory but not excessively so. Investors might consider this RSI level as being close to an inflection point, where caution is advised in anticipation of potential trend reversals.

Analysis for FTSE 100 (UK) - February 27, 2025

FTSE 100 (UK) opened at 8731.46 and closed slightly higher at 8757.79, marking a positive change of approximately 0.30%, with a points increase of 26.29. Despite zero trading volume indicated, technical indicators like the RSI at 62.85 and MACD value suggest moderate market momentum above mid-term EMA values.

Relationship with Key Moving Averages
The FTSE 100 is currently trading above its key moving averages, with the closing price of 8757.79 higher than the 10 EMA of 8709.51, the 20 EMA of 8675.10, and the 50 EMA of 8541.75, indicating a potential bullish trend. The RSI of 62.85 suggests moderately strong momentum.
Moving Averages Trend (MACD)
The MACD for FTSE 100 (UK) is currently 59.51, which is below the MACD Signal line of 75.06. This indicates a potential bearish trend as the MACD line is lower than the signal line.

RSI Analysis
The Relative Strength Index (RSI) for FTSE 100 is 62.85, indicating a relatively bullish sentiment as it is above the neutral 50 level, but not yet in the overbought territory, which is typically considered above 70. This suggests moderate upward momentum, with room for further gains before potentially encountering overbought conditions.

Analysis for DAX (Germany) - February 27, 2025

DAX (Germany) Performance: On the given trading day, the DAX opened at 22,587.27, reached a high of 22,617.86, and closed at 22,600.42, down by 0.85% from the previous close of 22,794.11. The index showed a negative movement with a points change of -193.69, while technical indicators like the RSI at 64.32 suggest a relatively strong position, though the MACD below the signal line indicates potential bearish momentum.

Relationship with Key Moving Averages
The DAX (Germany) closed at 22,600.42, which is above its 50-day EMA of 21,423.31 and 200-day EMA of 19,655.79, indicating a bullish trend. However, it is slightly above the 10-day EMA of 22,461.30 and further above the 20-day EMA of 22,186.94, confirming short-term positive momentum despite the day's negative movement.
Moving Averages Trend (MACD)
MACD Analysis for DAX (Germany): The MACD for DAX is currently at 398.54, which is below the MACD Signal line of 429.03. This indicates a potential bearish trend, as the falling MACD relative to its signal line suggests decreasing upward momentum.

RSI Analysis
For DAX (Germany), the RSI (Relative Strength Index) is currently at 64.32. This indicates a slightly bullish trend but is approaching the overbought threshold typically set at 70, suggesting potential for a future price correction if the RSI continues to rise.

Analysis for S&P 500 (US) - February 27, 2025

The S&P 500 index opened at 5970.87, reached a high of 6009.82, and closed at 5956.06, marking a slight increase of 0.81 points from the previous close. The 50-day and 20-day EMA values show a bearish trend compared to the 10-day EMA. Additionally, with an RSI of 41.13, the index is in a neutral zone with no strong momentum in either direction.

Relationship with Key Moving Averages
The S&P 500 closed at 5956.06, which is below its 50-day EMA of 6007.65 and significantly below its 10-day and 20-day EMAs, indicating a bearish trend. Additionally, the RSI of 41.13 suggests the market is close to being oversold.
Moving Averages Trend (MACD)
MACD Analysis for S&P 500 (US): The MACD value is -0.98, which is below the MACD Signal of 17.98, indicating a potential bearish momentum. This suggests that the S&P 500 may experience downward pressure in the short term.

RSI Analysis
The RSI for the S&P 500 is 41.13, which suggests the market is approaching an oversold condition. Typically, an RSI below 30 indicates an oversold market, while an RSI above 70 indicates an overbought market. Thus, the index has some room for further downturn before hitting critical oversell levels.

Analysis for Hang Seng Index (Hong Kong) - February 27, 2025

Hang Seng Index opened at 23,783.75 and closed at 23,718.29, experiencing a slight decrease of 0.29% with a points change of -69.64. The RSI is relatively high at 73.12, indicating overbought conditions, while the MACD is above its signal line, suggesting bullish momentum.

Relationship with Key Moving Averages
The Hang Seng Index is currently trading with a closing price of 23,718.29, which is above all its key moving averages: the 50-day EMA (21,158.43), the 20-day EMA (22,271.26), and the 10-day EMA (23,015.22). This indicates a bullish trend, supported by a high RSI of 73.12, suggesting that the index may be overbought.
Moving Averages Trend (MACD)
The MACD value for the Hang Seng Index (Hong Kong) is 909.27, with a signal line of 787.76, indicating a bullish trend as the MACD line is above the signal line. This is further supported by a high RSI of 73.12, suggesting the index might be overbought.

RSI Analysis
RSI Analysis for Hang Seng Index (Hong Kong): The RSI value of 73.12 indicates that the Hang Seng Index is currently in the overbought territory, suggesting potential for a near-term pullback or consolidation. However, the momentum remains strong, implying continued investor interest until a clear reversal signal appears.

Analysis for IBEX 35 (Spain) - February 27, 2025

The IBEX 35 index opened at 13,221.0 and closed slightly lower at 13,295.6, marking a small decrease from the previous close at 13,332.0. The Relative Strength Index (RSI) is quite high at 74.82, indicating potential overbought conditions. The index has a positive MACD, suggesting bullish momentum despite the minor downturn.

Relationship with Key Moving Averages
The IBEX 35's current close at 13,295.60 is above its 50-day EMA of 12,420.08, 200-day EMA of 11,635.50, 10-day EMA of 13,067.65, and 20-day EMA of 12,850.51. This suggests a short-term bullish trend as the index trades above these key moving averages.
Moving Averages Trend (MACD)
The MACD for IBEX 35 is 286.31 with a signal line of 274.04, indicating a bullish trend as the MACD line is above the signal line. This suggests upward momentum in the market.

RSI Analysis
The relative strength index (RSI) for IBEX 35 is 74.82, indicating that the index is approaching overbought territory. This high RSI suggests that the market may be due for a correction or pullback in the near term.

Analysis for NASDAQ Composite (US) - February 27, 2025

The NASDAQ Composite opened at 19,109.32 and closed slightly lower at 19,075.26, with a modest percentage change of 0.26% from the previous close. The RSI indicates the index is oversold at 37.99, and the MACD suggests a bearish momentum, being significantly below the signal line. The trading volume for the day was 7,034,450,000.

Relationship with Key Moving Averages
The NASDAQ Composite closed below its 50-day EMA (19,526.30), 10-day EMA (19,497.29), and 20-day EMA (19,591.68), indicating a short-term bearish trend as it is trading under these key moving averages. Additionally, there is a substantial difference from the 200-day EMA (18,318.24), suggesting the index still remains above its longer-term trend despite recent declines.
Moving Averages Trend (MACD)
The MACD for NASDAQ Composite is at -70.00, which is below the MACD Signal of 22.93, indicating a bearish signal. This suggests potential continued downward momentum.

RSI Analysis
The RSI for NASDAQ Composite is 37.99, indicating that the index is leaning towards the oversold territory. This suggests that the index may be experiencing downward pressure, and traders could be cautious about potential selling exhaustion or a possible reversal.

Analysis for Nikkei 225 (Japan) - February 27, 2025

Nikkei 225 (Japan) opened at 38,251.11 and closed slightly higher at 38,256.17, marking a 0.30% increase from the previous close with a points change of 113.80. The index had a high of 38,369.96 and a low of 38,061.94, with its RSI at 40.07, suggesting a weak momentum. The MACD indicates a bearish trend as it is significantly below the signal line.

Relationship with Key Moving Averages
The Nikkei 225 index closed at 38,256.17, which is below its 50-day EMA of 38,977.90 and just below its 200-day EMA of 38,322.09, indicating a potential bearish trend. Additionally, it is also below the 10-day EMA of 38,647.78 and the 20-day EMA of 38,848.29, suggesting current bearish momentum.
Moving Averages Trend (MACD)
MACD Analysis for Nikkei 225 (Japan): The MACD value of -205.43 suggests a bearish momentum as it is below the MACD Signal line of -105.60, indicating that the downward trend might continue. With RSI at 40.07, it shows a weaker price strength, suggesting limited buying interest at the moment.

RSI Analysis
The RSI for Nikkei 225 is 40.07, suggesting that the index is approaching an oversold condition, as an RSI below 30 typically indicates oversold levels. This implies potential buying opportunities if the downward trend reverses.

Analysis for Nifty Bank - February 27, 2025

The Nifty Bank index opened at 48732.20 and closed at 48743.80, showing a slight positive change of 0.28% with a points change of 135.45. The current RSI is 42, indicating a moderately oversold condition, and the MACD is at -250.75, suggesting a bearish trend. The index's current price is below its 50, 200, 10, and 20-day EMAs, pointing to a potential downtrend in the short to medium term.

Relationship with Key Moving Averages
Nifty Bank closed at 48743.80, which is below its 50 EMA of 49794.65 and 200 EMA of 50094.00, indicating a potential bearish trend relative to these moving averages. However, the close is near the 10 EMA of 49036.17 and 20 EMA of 49231.05, suggesting that the index might be experiencing short-term consolidation or minor recovery.
Moving Averages Trend (MACD)
MACD Analysis for Nifty Bank: The MACD line is at -250.75 and the signal line is at -191.86, indicating a bearish trend. Since the MACD line is below the signal line, it suggests potential weakness or continued downward momentum for Nifty Bank.

RSI Analysis
The relative strength index (RSI) for Nifty Bank stands at 41.99, which suggests that the stock is neither overbought nor oversold. This indicates a potential buying opportunity if the RSI continues to rise towards the 50-70 range, reflecting increasing momentum.

Analysis for Nifty 50 - February 27, 2025

The Nifty 50 experienced a marginal decline, closing at 22,545.05 compared to the previous close of 22,547.55, representing a slight change of -0.011%. The technical indicators show a bearish trend with the MACD below the signal line and RSI towards the oversold region at 30.21. The moving averages indicate the index is trading below both its 50-day and 200-day EMAs.
Relationship with Key Moving Averages
The current close of Nifty 50 (22545.05) is below the 10 EMA (22799.94), 20 EMA (22984.78), 50 EMA (23340.00), and 200 EMA (23534.32), indicating a downtrend with the price trading below key moving averages. The RSI of 30.21 suggests oversold conditions, while the MACD is negative, indicating bearish momentum.
Moving Averages Trend (MACD)
The MACD for Nifty 50 is showing negative momentum, as indicated by the MACD value of -221.45, which is below the MACD Signal of -169.01. This suggests bearish sentiment, as the MACD line is diverging further below the signal line.
RSI Analysis
The RSI of Nifty 50 is at 30.21, indicating that the market is currently in oversold territory. This suggests that the index may be due for a potential rebound or reversal if other technical indicators support it. Caution is advised as oversold conditions can persist in a downtrend.

Up Next
Global stock market indices: How the world markets performed today - 27 February 2025

New Zealand commits USD 20 bn investment in India under FTA in 15 yrs; on lines of EFTA pact

India, New Zealand conclude FTA talks; pact to offer duty-free access, USD 20 bn FDI

FTA with New Zealand to significantly deepen bilateral economic engagement: Govt

Rupee breaches 91-mark against US dollar for first time in intra-day trade

Microsoft commits USD 17.5 billion investment in India: CEO Satya Nadella

More videos

CBI books Anil Ambani's son, Reliance Home Finance Ltd. in Rs 228 crore bank fraud case

RBI raises FY26 GDP growth projection to 7.3 pc

RBI trims policy interest rate by 25bps to 5.25pc, loans to get cheaper

Rupee slumps to all-time low of 90.25 against US dollar in intra-day trade

Reliance completes merger of Star Television Productions with Jiostar

India to lead emerging market growth with 7pc GDP rise in 2025: Moody’s

Nifty hits record high after 14 months; Sensex nears all-time peak

Reliance stops Russian oil use at its only-for-export refinery to comply with EU sanctions

ED attaches fresh assets worth over Rs 1,400 cr in case against Anil Ambani's Reliance Group

India signs one-year deal to import 2.2 million tonnes of LPG from US