


Highlights
- Sensex shows a slight decline, closing at 77,860.19
- Dow Jones signals a bullish trend with positive momentum
- Hang Seng Index gains 1.16%, indicating strong momentum
Latest news

Tata Motors PV sales surge 31% YoY in April at 59,701 units, Tata Motors posts 28 per cent YoY sales growth in April at 34,833 Units

Top 7 Agentic AI Programs to Build Autonomous AI Systems in 2026

India reaffirms commitment to women-led development at BRICS preparatory meeting

Ram Charan starrer 'Peddi' wraps shooting, Rathnavelu reflects on "memorable journey"

Ai+ Smartphone Announces Return of Sales for Nova 2 5G & Nova2 Ultra 5G Sale on May 1, 12 pm

Mitsu Chem Plast Limited Honoured to Be Part of Arjo's Clinicia Bed Series Launch at IDC, IIT Mumbai

Sidharth Malhotra, Kiara Advani win internet with new beach vacation pics

How to Use Personal Loan EMI Calculator Before Taking a Loan
Global stock market indices: How the world markets performed today - 7 February 2025


The international stock market indices showed varied performances on February 07, 2025, reflecting the economic sentiment across different regions.
In this article, we analyze the performance of key global indices including the S&P 500, Dow Jones Industrial Average, NASDAQ Composite, FTSE 100, DAX, CAC 40, IBEX 35, Nikkei 225, Hang Seng, Nifty 50, and BSE Sensex.

Analysis for Sensex - February 07, 2025

The Sensex opened at 78,119.60, reaching a high of 78,356.97 and a low of 77,475.74, closing at 77,860.19. Compared to the previous close of 78,058.16, it experienced a slight decrease of 0.25% or 197.97 points. The Relative Strength Index (RSI) is 52.48, indicating a relatively neutral momentum.

Relationship with Key Moving Averages
The closing price of Sensex at 77,860.1875 is below the 50-day EMA of 78,126.18, indicating a bearish trend in the short term. However, it is slightly above the 200-day EMA of 77,841.21, suggesting a potential support level. This relationship with the moving averages suggests a mixed trend where short-term downtrend pressure is observed, yet the long-term support might hold.
Moving Averages Trend (MACD)
The MACD for the Sensex is currently showing at -75.86, indicating bearish momentum, but it is above the MACD signal of -385.57. This suggests potential for a near-term reversal if momentum improves, though the current trend remains cautious.

RSI Analysis
The Relative Strength Index (RSI) for Sensex is 52.48, indicating a neutral level as it is close to the midpoint of the 0-100 scale. This suggests that the market is neither overbought nor oversold, and there may not be a strong momentum in either direction at the moment.

Analysis for Dow Jones Industrial Average (US) - February 07, 2025

The Dow Jones Industrial Average opened at 44,949.19, reached a high of 44,966.63, and closed lower at 44,747.63, registering a points change of -125.65 or a percentage change of -0.28%. Despite the slight decline, the 50-day EMA at 43,688.01 suggests a bullish trend, with the RSI at 61.75 indicating relatively strong momentum.

Relationship with Key Moving Averages
The Dow Jones Industrial Average has a current close of 44747.63, which is above the 50-day EMA of 43688.01 and significantly higher than the 200-day EMA of 41657.81, indicating a strong upward trend in the medium to long term. The close is also above the 10-day EMA of 44529.87 and 20-day EMA of 44170.89, suggesting continued short-term bullish momentum.
Moving Averages Trend (MACD)
The Dow Jones Industrial Average's MACD is at 417.77, while the MACD Signal is 349.18. The positive difference suggests a bullish momentum, indicating a potential buy signal as the MACD is above the signal line.

RSI Analysis
The RSI for the Dow Jones Industrial Average is 61.75, indicating a moderately strong position. Generally, an RSI above 70 is considered overbought, while below 30 is oversold. At this level, the index doesn't signal any immediate overbought or oversold conditions.

Analysis for CAC 40 (France) - February 07, 2025

CAC 40 (France) opened at 7998 and closed at 7998.4, marking a slight decline with a percentage change of -0.115% and a points change of -9.22. The RSI stands at 69.84, indicating the index is nearing overbought conditions, while the MACD is above the signal line, suggesting a potential uptrend.

Relationship with Key Moving Averages
CAC 40 (France) closed at 7998.40, which is above the 50-day EMA of 7630.21 and the 200-day EMA of 7550.49, indicating a bullish trend compared to these averages. However, it is slightly above the 10-day EMA of 7910.99, showing a short-term positive momentum.
Moving Averages Trend (MACD)
The MACD value for CAC 40 (France) is 132.79, while the MACD Signal line is 130.63. This indicates that the MACD is above the signal line, suggesting a potential bullish trend in the short term. However, it is important to consider other indicators for confirmation.

RSI Analysis
The RSI of CAC 40 (France) is 69.84, which suggests that the index is approaching overbought conditions. This means there might be a potential for a price correction in the near term as the RSI nears the overbought threshold of 70.

Analysis for FTSE 100 (UK) - February 07, 2025

The FTSE 100 opened at 8727.28, reaching a high of 8728.94 and closing at 8711.26, indicating a slight decrease of 0.18% with a points change of -16.04 from the previous close. The RSI of 68.95 suggests the index is nearing overbought conditions. The MACD of 103.14, higher than the signal line of 92.36, indicates a bullish momentum.

Relationship with Key Moving Averages
The FTSE 100 is trading above its 10-EMA and 20-EMA, indicating a short-term bullish trend, but it is below the 50-EMA, suggesting mixed signals for medium-term momentum. Its Relative Strength Index (RSI) is at 68.95, close to the overbought threshold of 70, implying potential for a market correction.
Moving Averages Trend (MACD)
The MACD for FTSE 100 shows a value of 103.14, indicating a bullish trend as it is above the signal line at 92.36. This suggests positive momentum in the short term.

RSI Analysis
The FTSE 100 (UK) has an RSI of approximately 68.95, indicating that the index is approaching overbought conditions. Typically, an RSI above 70 suggests overbought conditions, potentially signaling a reversal or pullback in the near term.

Analysis for DAX (Germany) - February 07, 2025

The DAX index from Germany opened at 21,908.48, reached a high of 21,945.31, and closed at 21,916.43, showing a slight positive change of 0.06%. The index's RSI is 74.53, indicating a possibly overbought condition, and the MACD is above its signal, suggesting upward momentum.

Relationship with Key Moving Averages
The DAX (Germany) index is above its key moving averages, with the current close of 21916.43 significantly higher than the 50 EMA of 20651.01, 200 EMA of 19237.03, 10 EMA of 21593.21, and 20 EMA of 21286.83. This suggests a strong upward momentum as indicated by the high RSI of 74.53, and it is trading above the MACD signal, further supporting the bullish trend.
Moving Averages Trend (MACD)
The MACD for DAX (Germany) is 400.90, which is higher than the MACD Signal of 379.98. This suggests a bullish trend, indicating potential upward momentum in the stock price.

RSI Analysis
The DAX (Germany) has an RSI of 74.53, indicating that the index is in an overbought territory. This suggests potential for a price correction or pullback in the near future. Monitoring other technical indicators would be prudent to confirm any reversal signals.

Analysis for S&P 500 (US) - February 07, 2025

The S&P 500 (US) opened at 6072.22, reached a high of 6084.03, and closed at 6083.57. The index experienced a 0.36% increase, gaining 22.09 points from its previous close of 6061.48. The RSI stands at 57.04, indicating slightly bullish momentum, while the MACD is above its signal, suggesting ongoing positive momentum.

Relationship with Key Moving Averages
The S&P 500 is trading above its 50-day EMA (5977.20) and 200-day EMA (5654.31), indicating a potential upward trend. Additionally, it is above the 10-day EMA (6044.99) and 20-day EMA (6022.70), supporting a short-term bullish sentiment.
Moving Averages Trend (MACD)
The MACD for the S&P 500 is 26.97, with a signal line at 23.28. Since the MACD is above the signal line, it indicates a bullish trend, suggesting positive momentum in the market.

RSI Analysis
The Relative Strength Index (RSI) for the S&P 500 is 57.04, indicating a neutral stance as it is between the typical overbought (70) and oversold (30) levels. This suggests that the market may be steady without significant upward or downward momentum.

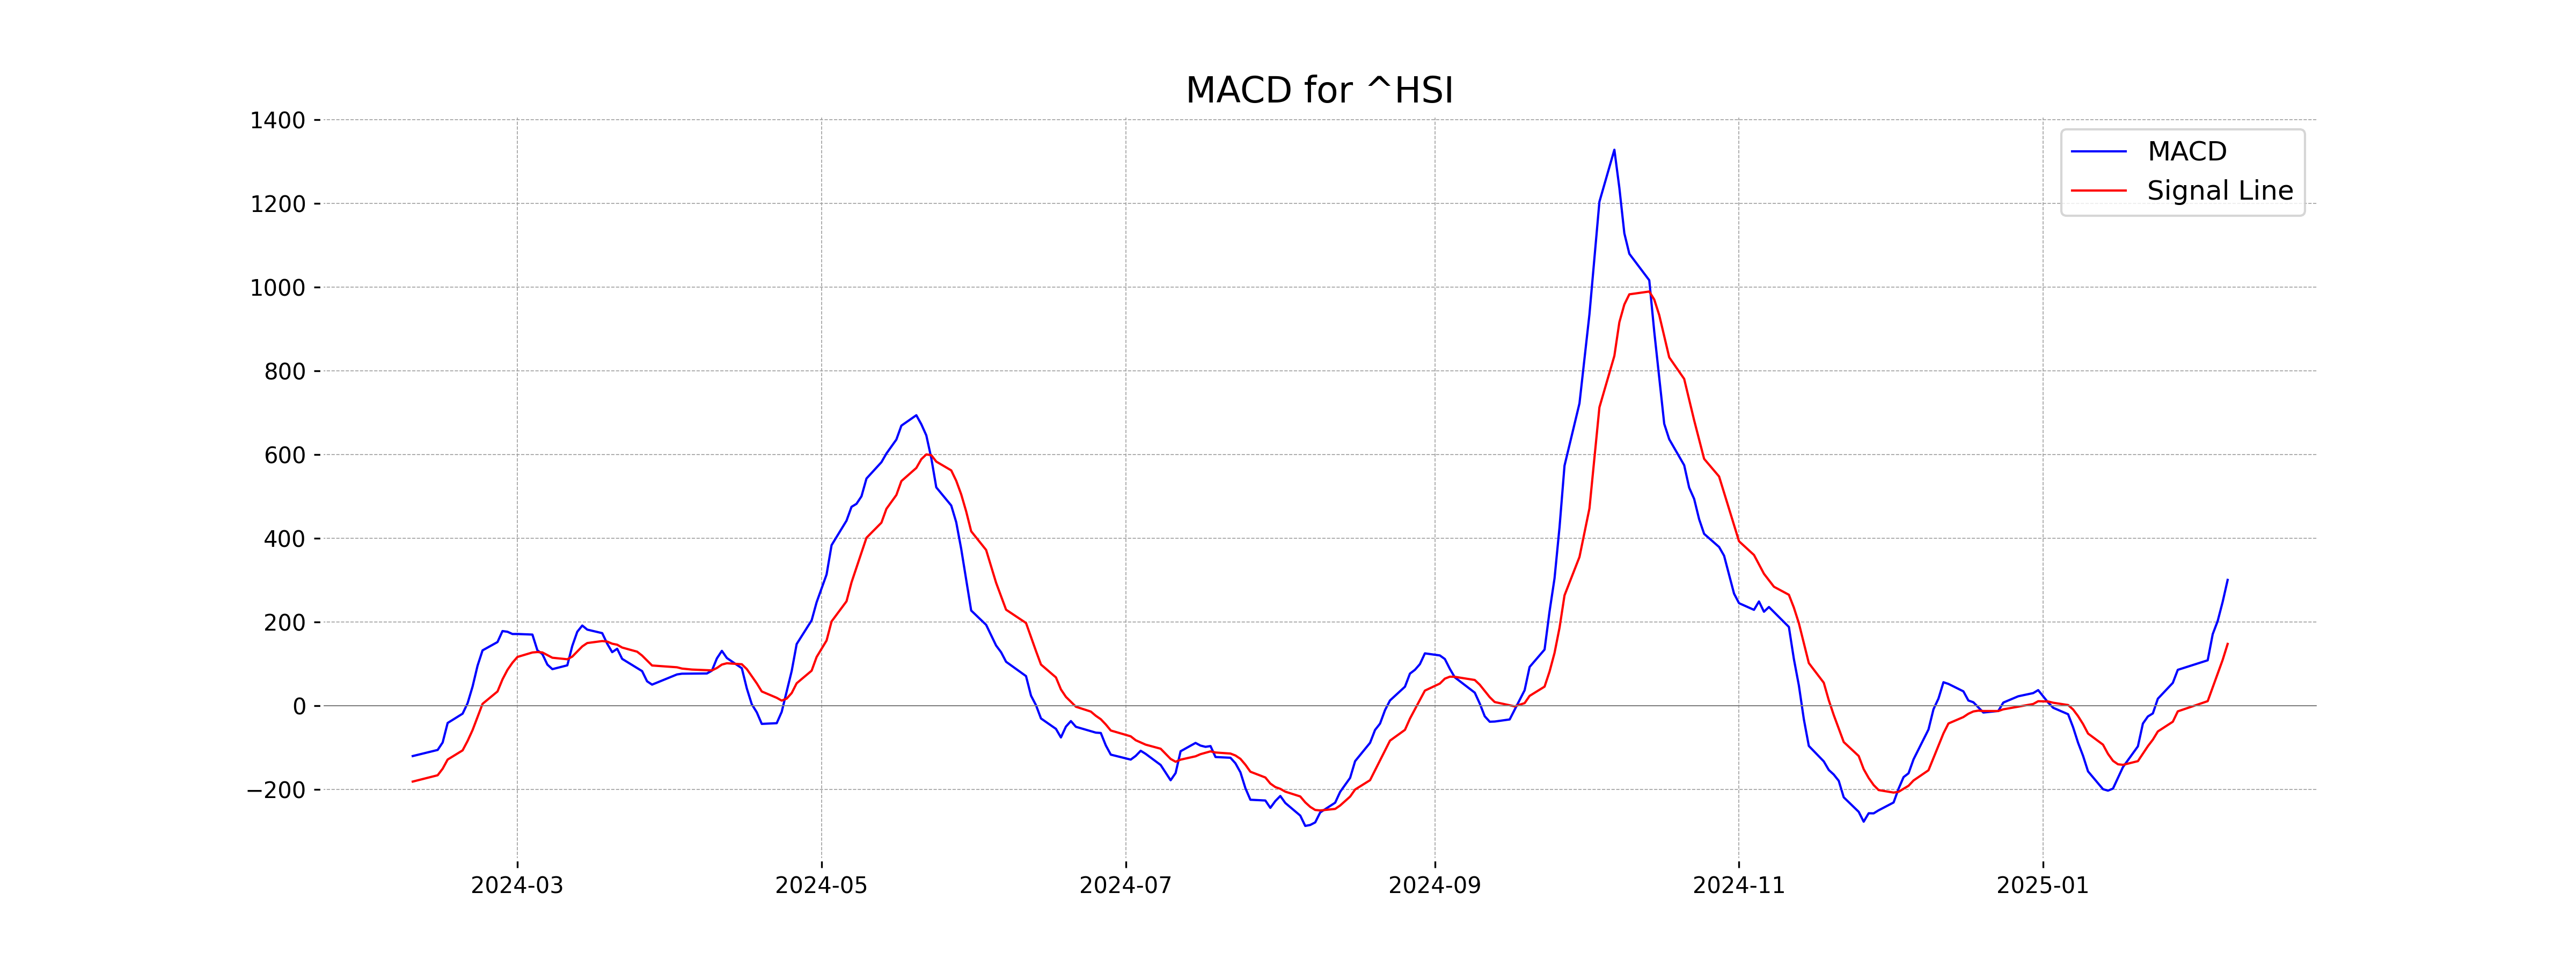
Analysis for Hang Seng Index (Hong Kong) - February 07, 2025

The Hang Seng Index (Hong Kong) had an opening of 20,858.52 and closed at 21,133.54, marking a daily increase of 1.16%. The index saw a notable gain of 241.92 points from the previous close. Technical indicators show a strong momentum with an RSI of 69.83 and the MACD well above the signal line.

Relationship with Key Moving Averages
The Hang Seng Index is trading above its key moving averages, with the current close price of 21,133.54 surpassing the 50 EMA at 19,926.69 and the 200 EMA at 19,064.94. This indicates a bullish trend, strengthened by the RSI value of 69.83 and a positive MACD line above its signal line.
Moving Averages Trend (MACD)
The MACD for the Hang Seng Index indicates a bullish trend with a MACD value of 301.09 and a signal line at 148.20, showing a positive divergence. This suggests potential upward momentum in the stock price.
RSI Analysis
Based on the stock data, the Hang Seng Index (Hong Kong) has an RSI of 69.83, which suggests it is approaching overbought territory. Generally, an RSI above 70 might indicate that the index is overbought and could be due for a pullback.

Analysis for IBEX 35 (Spain) - February 07, 2025

The IBEX 35 (Spain) index opened at 12,741.10, with a high of 12,775.40 and a low of 12,688.40 before closing at 12,703.90, representing a decrease of approximately 0.21% from the previous close. The index experienced a points change of -27.10 with a substantial trading volume of 41,538,006. The 50-day EMA is above the 200-day EMA, suggesting a bullish trend, while the RSI indicates overbought conditions at a value of 73.48.

Relationship with Key Moving Averages
IBEX 35 is trading above its 50 EMA and 200 EMA, indicating a strong bullish trend. The close price is also above the 10 EMA and 20 EMA, suggesting continued upward momentum in the shorter term.
Moving Averages Trend (MACD)
The MACD for IBEX 35 indicates a bullish trend, as the MACD value (222.23) is significantly higher than the MACD Signal line (160.81). This suggests upward momentum in the price movement of the index.

RSI Analysis
The RSI for IBEX 35 (Spain) stands at 73.48, which suggests that the index is in the overbought territory. Typically, an RSI above 70 indicates that the asset may be overvalued and could be due for a pullback or a corrective phase.

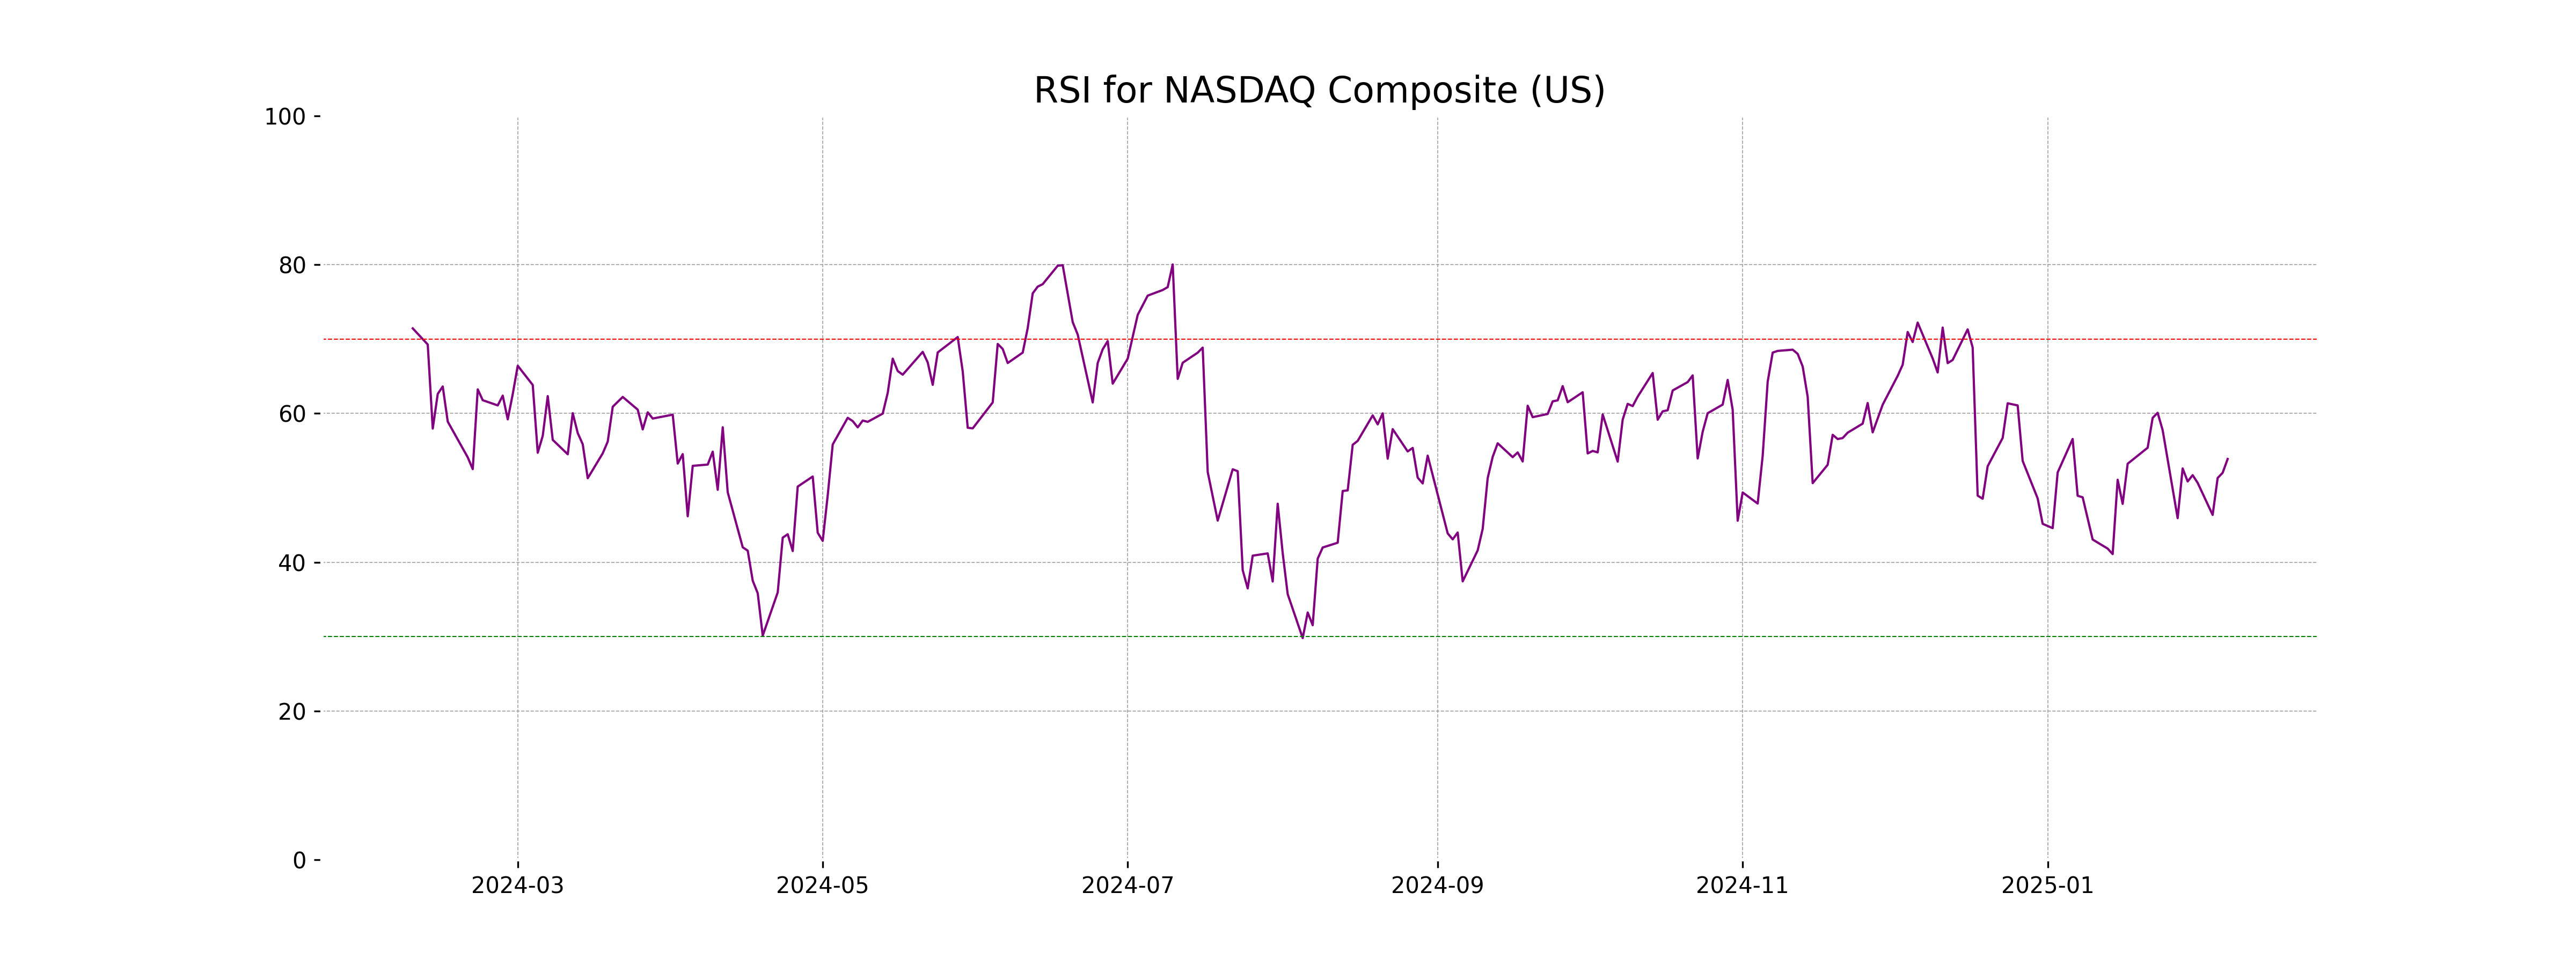
Analysis for NASDAQ Composite (US) - February 07, 2025

The NASDAQ Composite opened at 19725.83 and closed at 19791.99, marking a 0.51% increase with a 99.66-point change. Trading volume was 6.64 billion, with a relative strength index of 53.88 indicating a stable market momentum. The MACD line was slightly above the signal line, suggesting a mildly bullish trend.

Relationship with Key Moving Averages
The NASDAQ Composite opened above its 10 EMA and 20 EMA and remained above these levels throughout the session, closing at 19,791.99. The index is also trading well above its 50 EMA and 200 EMA, indicating a generally strong upward trend in comparison to these key moving averages.
Moving Averages Trend (MACD)
**MACD Analysis for NASDAQ Composite (US):** The MACD value of 43.18 is above its signal line of 41.76, indicating a potential bullish momentum. This suggests a possible upward trend continuation in the market.

RSI Analysis
The RSI (Relative Strength Index) for the NASDAQ Composite is at 53.88, indicating a neutral position as it is near the midpoint of 50. This suggests that the market is neither overbought nor oversold, providing a balanced view of potential future price movements.
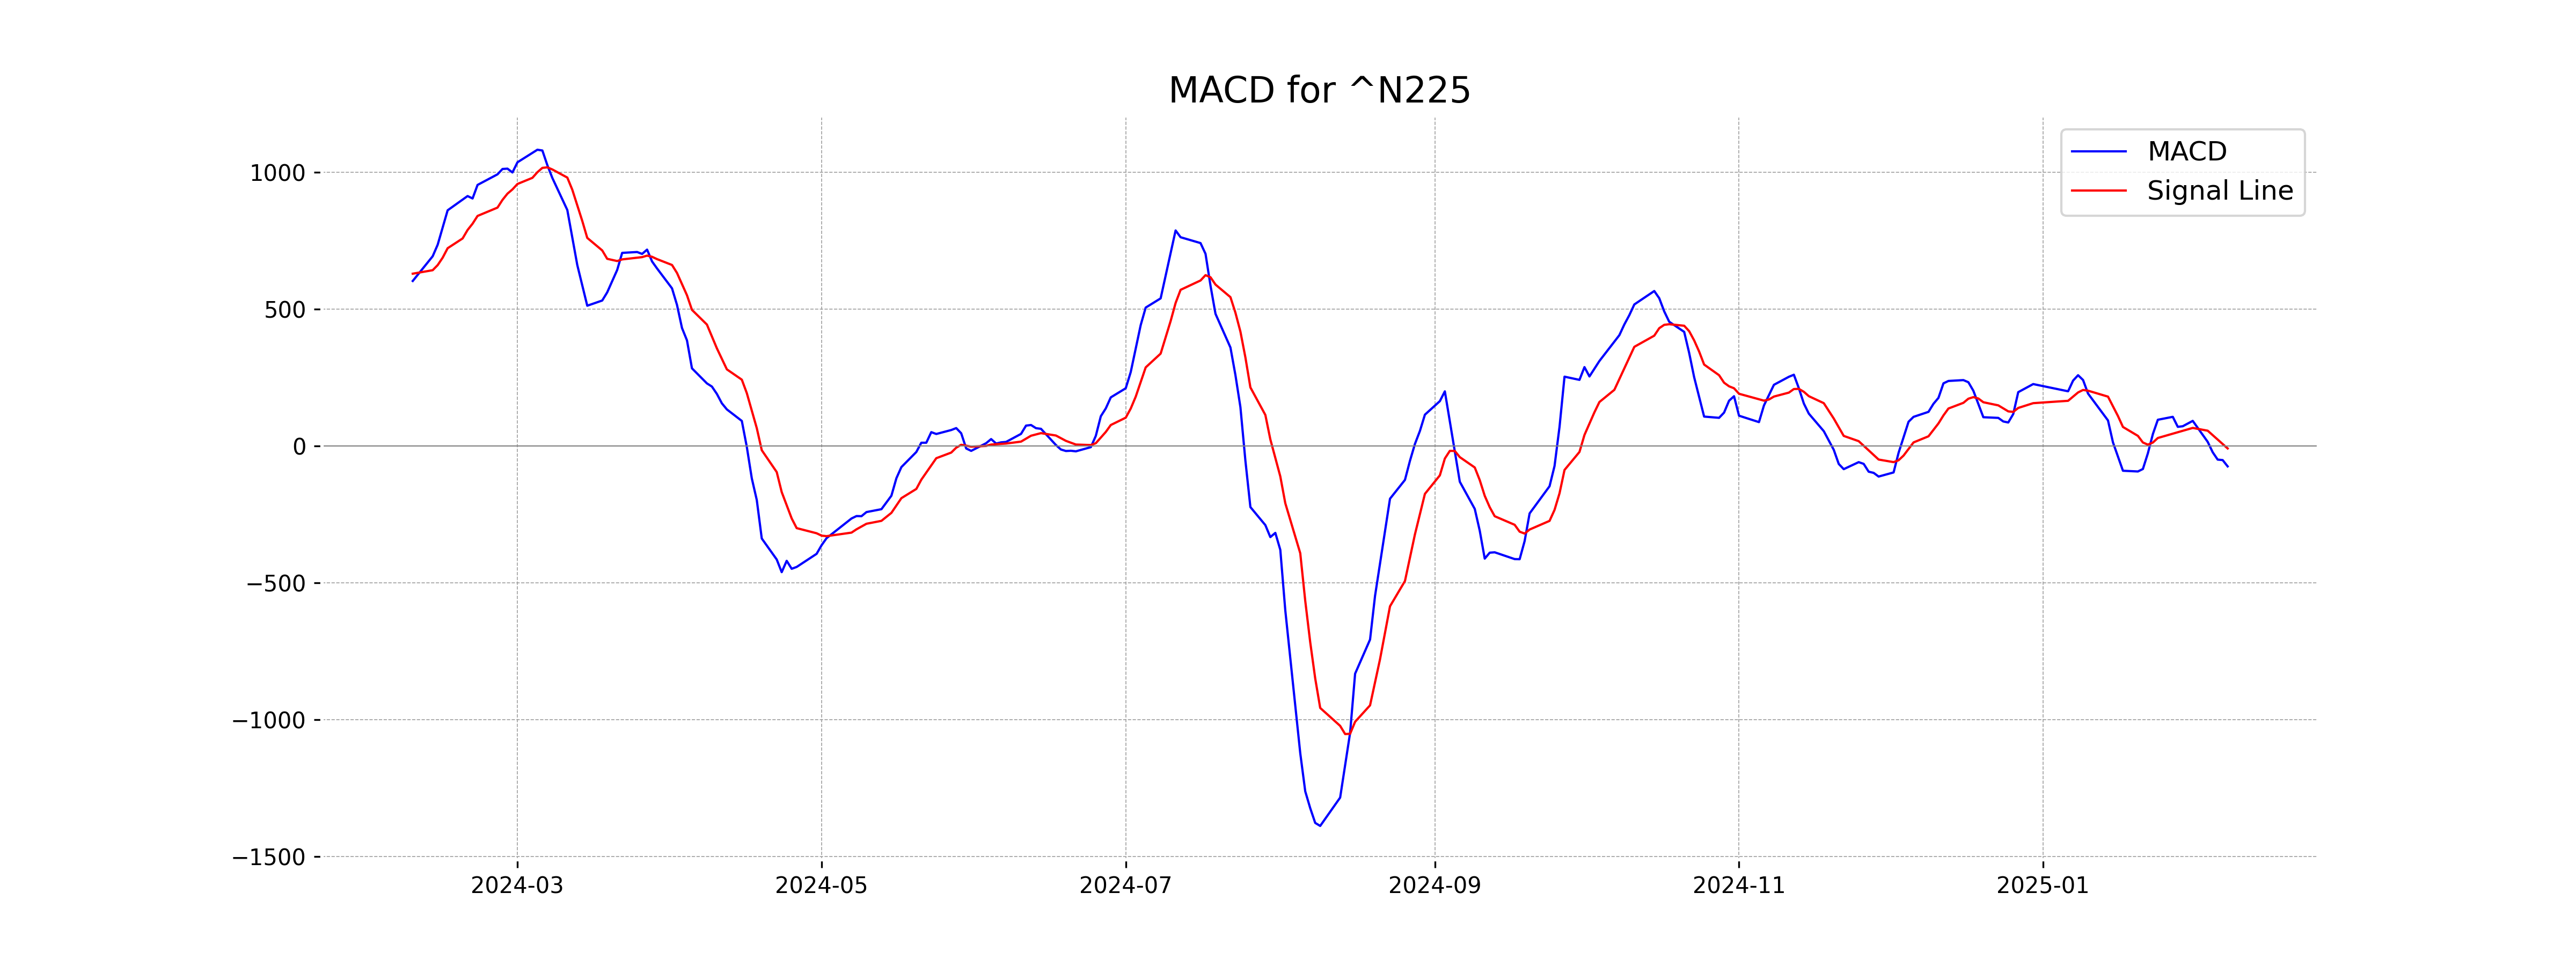
Analysis for Nikkei 225 (Japan) - February 07, 2025

The Nikkei 225 (Japan) experienced a decline with its closing at 38,787.02, down by 279.51 points or 0.72% from the previous close of 39,066.53. Technical indicators show pressure, with an RSI of 45.60 suggesting weaker momentum, and a negative MACD indicating potential for further downside. The volume for the day was minimal.

Relationship with Key Moving Averages
The Nikkei 225 closed at 38,787.02, below its 50-day EMA of 39,090.17 and 20-day EMA of 39,133.58, indicating potential bearish momentum. It is also below the 10-day EMA of 39,043.78, which suggests short-term bearish pressure.
Moving Averages Trend (MACD)
The MACD for Nikkei 225 is -74.86, which is below its signal line of -9.32, suggesting a bearish momentum. This indicates that the recent price movements are more negative, with potential further decline or a need for caution.
RSI Analysis
The RSI (Relative Strength Index) for the Nikkei 225 is 45.60, which indicates a neutral trend, as it is neither in the overbought region (above 70) nor the oversold region (below 30). This suggests a balanced momentum at the moment without extreme conditions.

Analysis for Nifty Bank - February 07, 2025
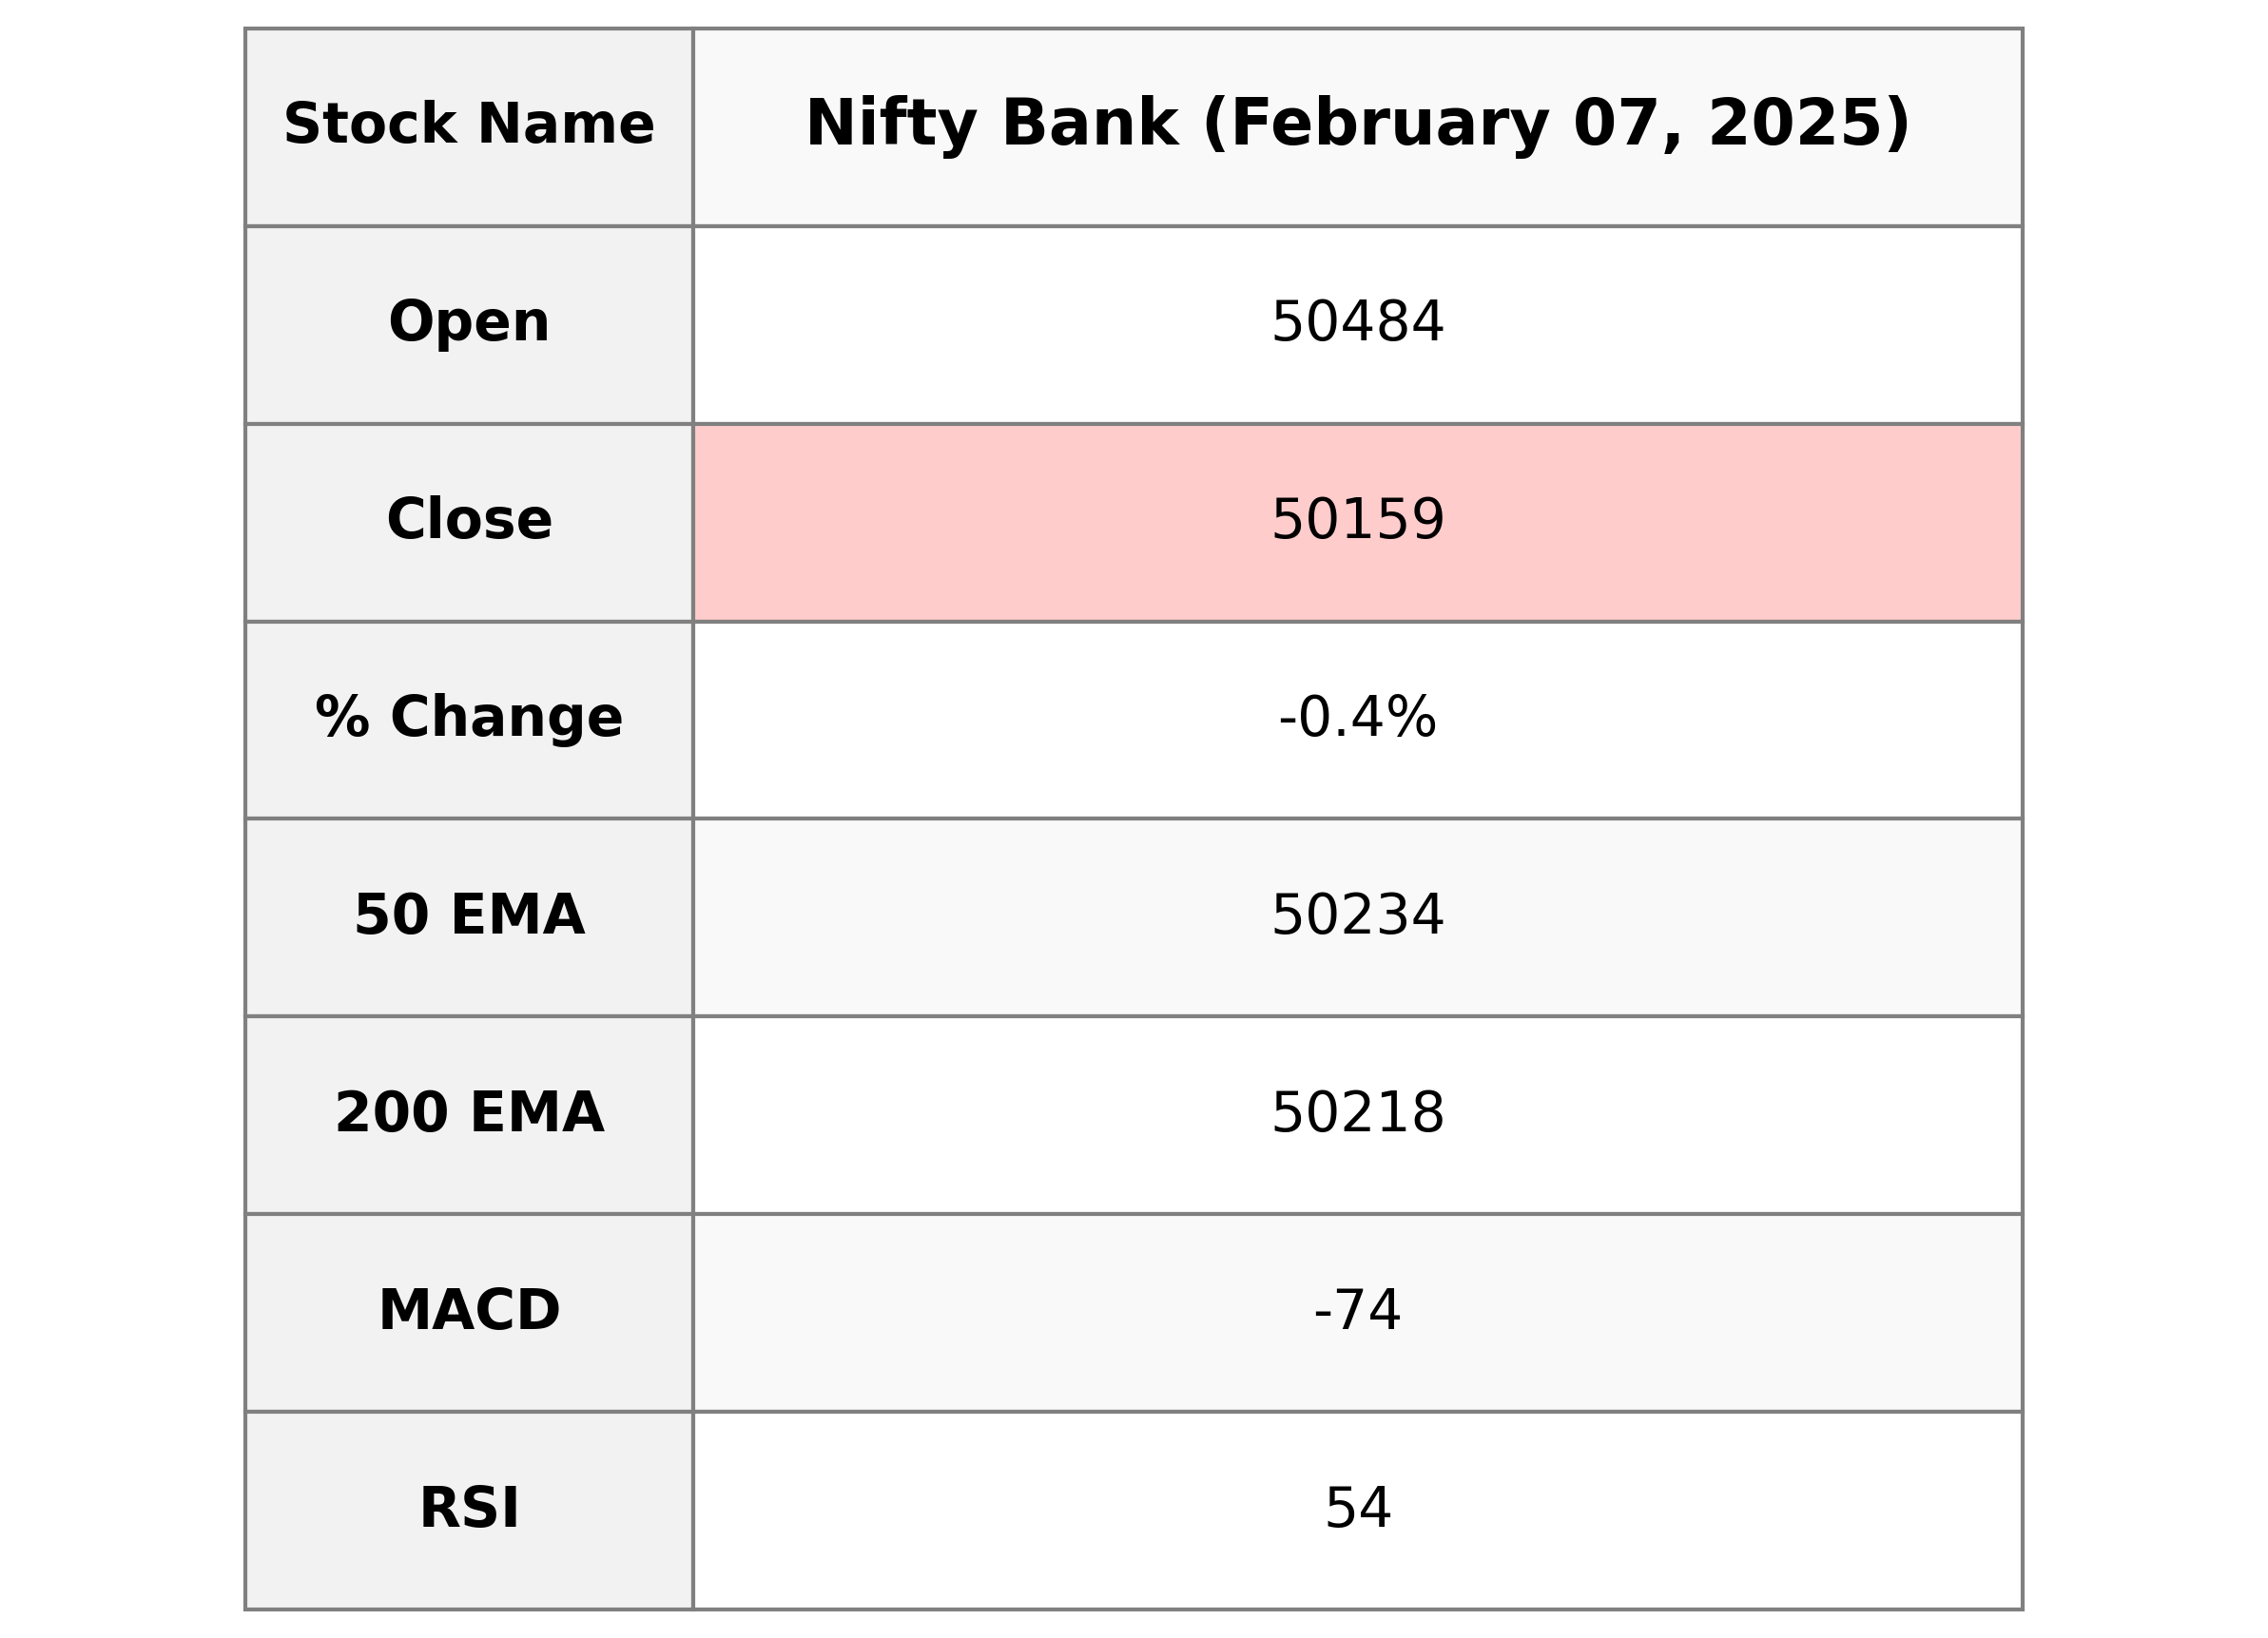
Nifty Bank opened at 50484.45 and closed at 50158.85, with a decrease of 223.25 points, marking a -0.44% change from the previous close of 50382.10. The RSI indicates neutral momentum at 53.99, while the MACD shows a bearish trend with a MACD line value of -73.52 against the signal line at -362.21. Despite the decline, Nifty Bank remains above its 10 and 20 EMA, maintaining a short-term upward trend.

Relationship with Key Moving Averages
Nifty Bank closed at 50158.85, which is below its 50 EMA of 50233.99 and 200 EMA of 50217.58, indicating a bearish trend. However, it remains above its 10 EMA of 49725.93 and 20 EMA of 49627.17, suggesting short-term bullish momentum.
Moving Averages Trend (MACD)
The MACD for Nifty Bank is -73.52, with a MACD Signal of -362.21. The MACD being less negative than the Signal suggests a potential bearish momentum is easing. However, the negative values reflect continued weakness in the index.

RSI Analysis
The RSI value for Nifty Bank is approximately 54, which indicates a neutral momentum. Typically, an RSI value between 30 to 70 suggests that the stock is neither overbought nor oversold, suggesting a balanced demand and supply scenario for the time being.

Analysis for Nifty 50 - February 07, 2025

Nifty 50 opened at 23,649.5 and closed lower at 23,559.95, indicating a slight decrease with a -0.18% change. The index saw a high of 23,694.5 and a low of 23,443.19, while the RSI stands at 52.20 suggesting a neutral market momentum. The MACD is at -26.90, which is still above its signal line of -116.10, signaling a possible bullish crossover.

Relationship with Key Moving Averages
The current price of Nifty 50 closed at 23559.95, below both the 50-day EMA of 23664.44 and the 200-day EMA of 23622.86, suggesting a potential bearish trend or weakness in the short and medium term. The 10-day EMA at 23459.71 and 20-day EMA at 23431.68 indicate recent price support might be forming slightly below the current level.
Moving Averages Trend (MACD)
The MACD for Nifty 50 is -26.90, with a signal line of -116.10, indicating a potential bullish crossover, as the MACD is moving towards the signal line from below. This suggests that the current bearish momentum might be weakening.

RSI Analysis
Based on the RSI value of 52.20, Nifty 50 is currently in a neutral zone, indicating a balance between buying and selling pressure. This suggests no significant overbought or oversold conditions, implying that the market may continue to trade sideways if other factors remain unchanged.

Up Next
Global stock market indices: How the world markets performed today - 7 February 2025

Centre plans to borrow Rs 8.20 lakh cr from market in first half of FY27

Reliance denies buying Iranian oil amid US sanctions waiver

Premium petrol price up Rs 2, industrial diesel up Rs 22; no change in normal petrol, diesel rates

India's GDP expected to register over 8 pc growth in Sep-Dec: Report

Govt announces seven measures to help boost exports

More videos

RBI keeps interest rates on hold after US trade deal boosts outlook

RBI proposes to compensate customers up to Rs 25,000 loss due to fraud

RBI raises GDP growth projection of Q1, Q2 of FY27

RBI pauses rate cuts, retains interest rate at 5.25 pc

Rupee jumps 122 paise to close at 90.27 against US dollar on India-US trade deal

Stock markets cheer India-US trade deal: Sensex, Nifty surge 2.5 pc

UPI transactions hit record high of Rs 230 lakh crore in 2025-26 till Dec: Govt

Explained: India-US trade deal, tariffs and trade benefits

Trade deal with US adds momentum to India's growth ambition: Industry leaders

Rupee jumps 119 paise to 90.30 against the US dollar on India-US trade deal