


Highlights
Latest news

Samsung Galaxy M17 5G Review: Best Budget Samsung Phone Under ₹15,000?

OnePlus 15R first look: OnePlus changes the R-series playbook

India's retail inflation rises to 0.71% in November

Cabinet approves CoalSETU window for auction of coal to boost industrial use and export

Cabinet approves Minimum Support Price for Copra for 2026 season

Fire never left: Vinesh Phogat comes out of retirement, targets LA Olympics

Flexible office segment in India set to grow faster, over 25% annually by 2027: Report

Rahul Gandhi flags issue of air pollution, seeks discussion in Lok Sabha
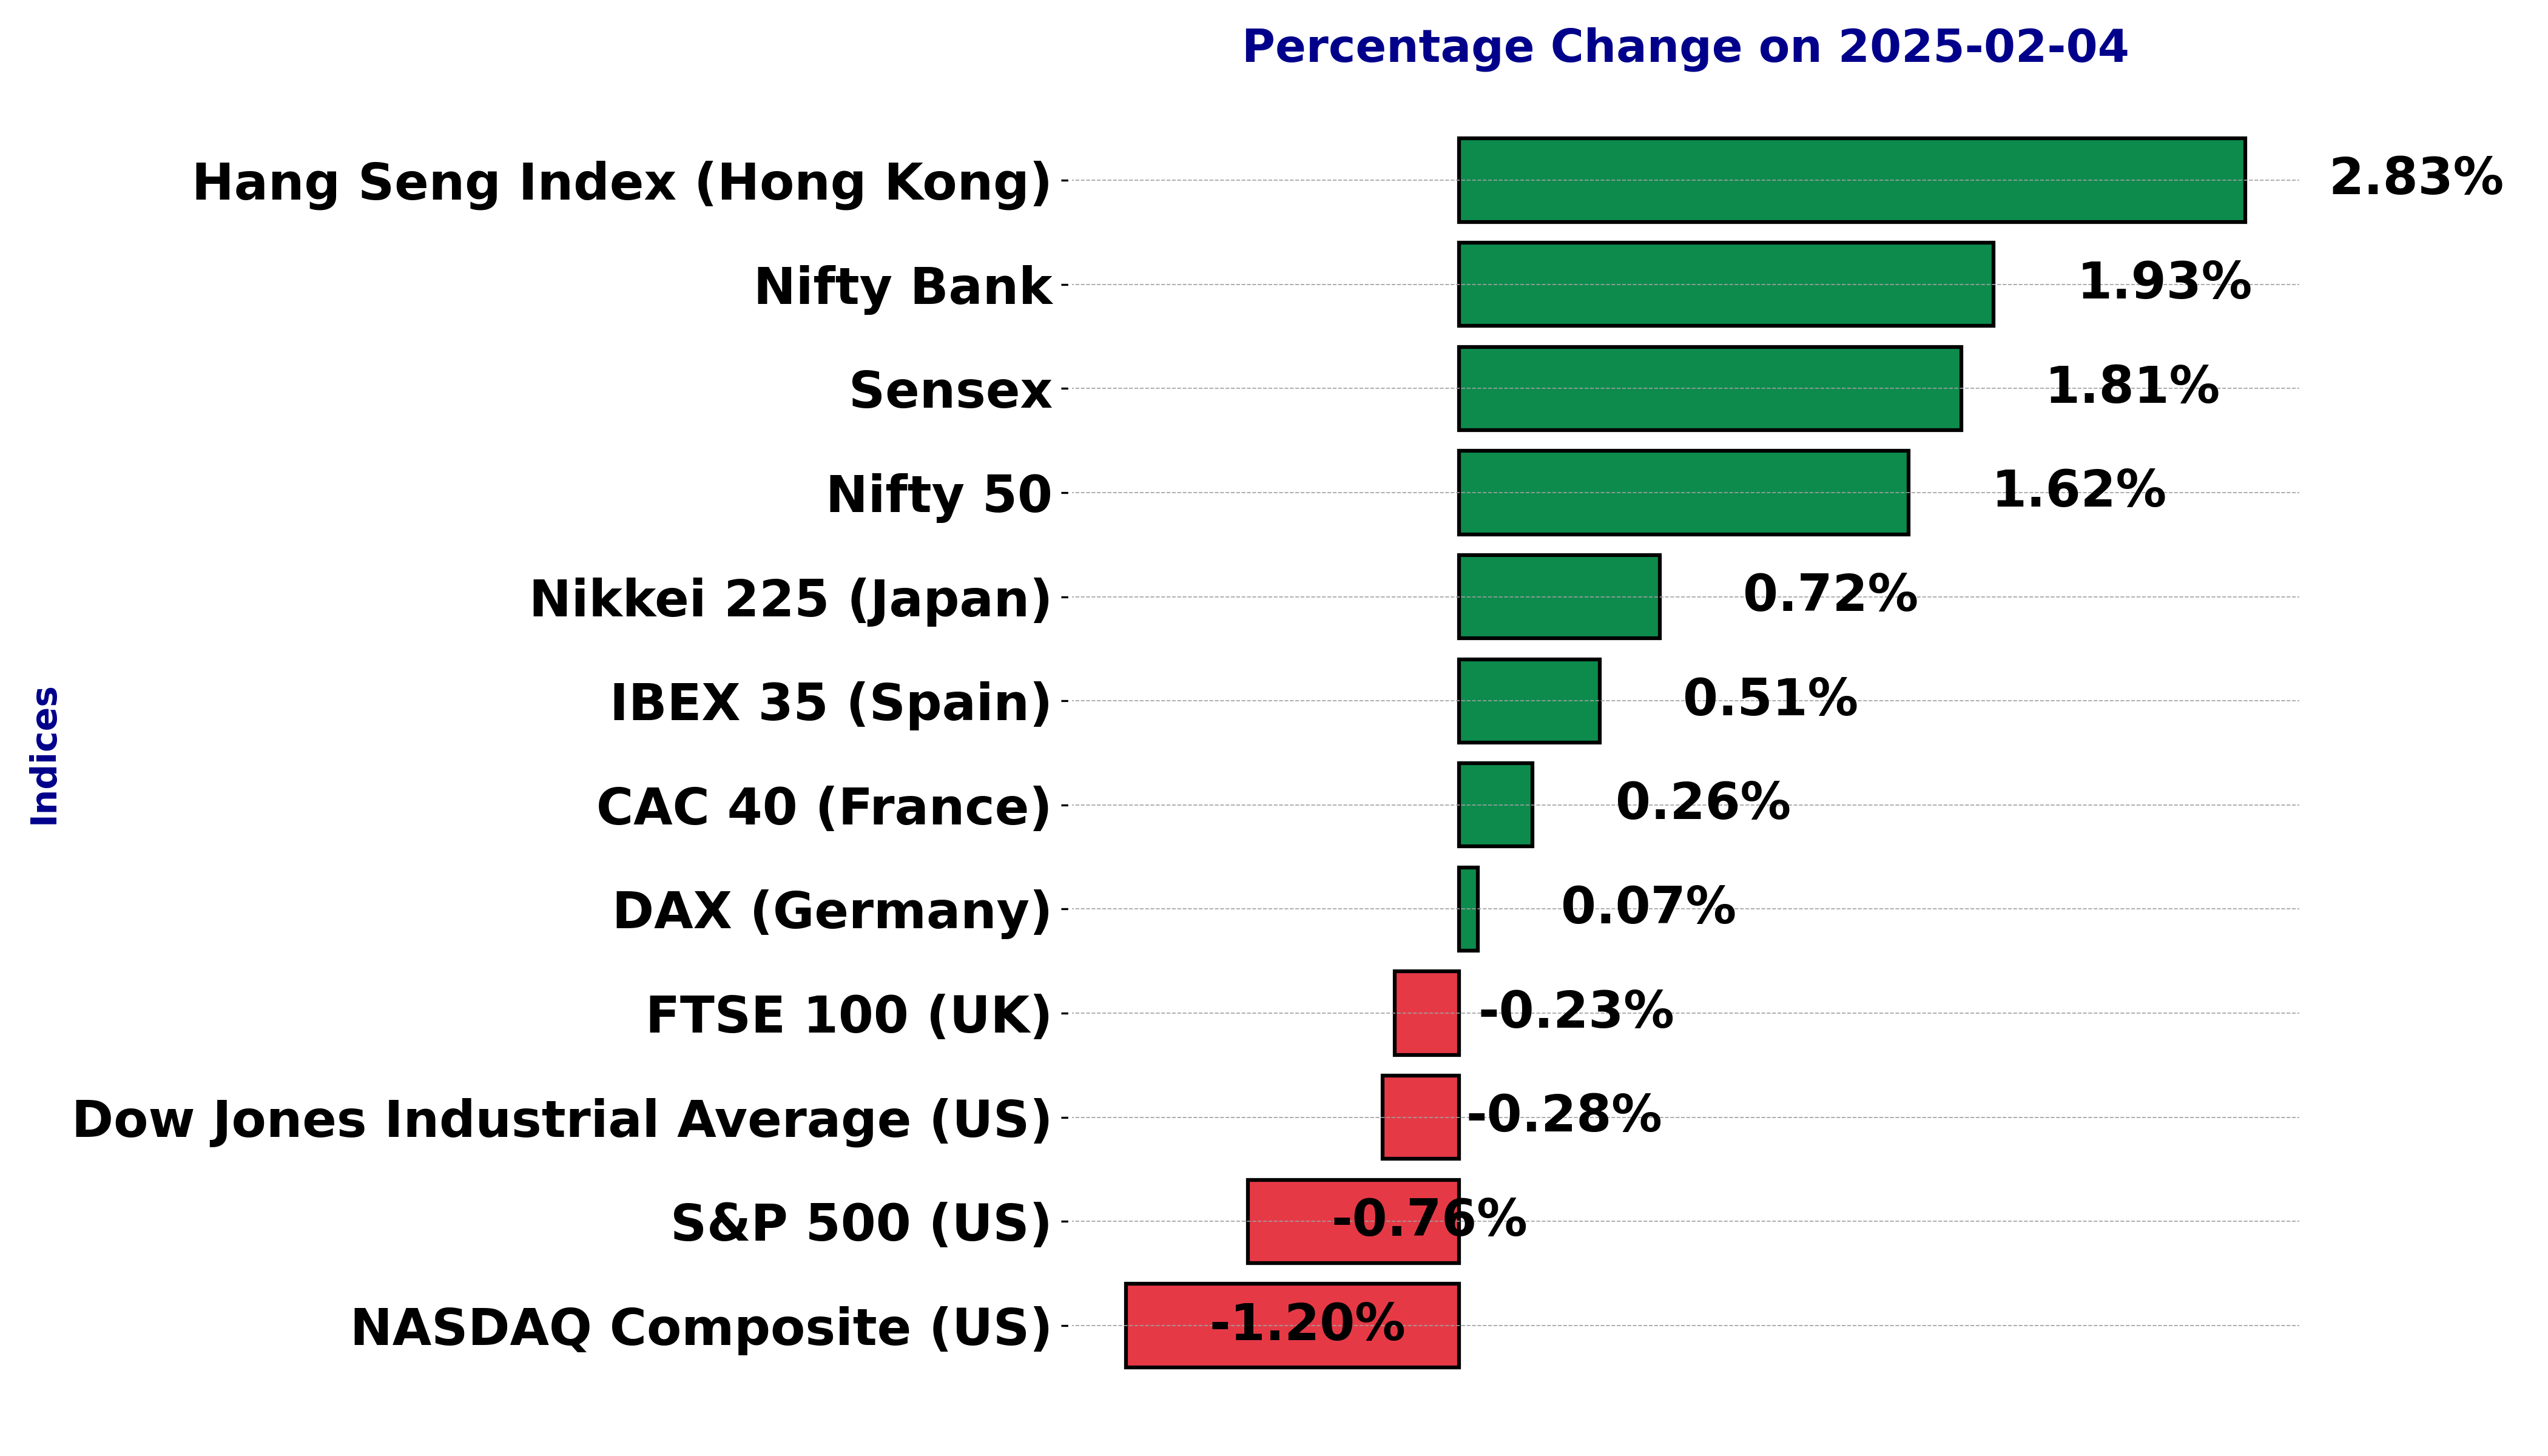
Global stock market indices performed today - February 04, 2025


The international stock market indices showed varied performances on February 04, 2025, reflecting the economic sentiment across different regions.
In this article, we analyze the performance of key global indices including the S&P 500, Dow Jones Industrial Average, NASDAQ Composite, FTSE 100, DAX, CAC 40, IBEX 35, Nikkei 225, Hang Seng, Nifty 50, and BSE Sensex.
Analysis for Sensex - February 04, 2025

The Sensex opened at 77,687.60 and closed at 78,583.81, reflecting a positive change of 1.81%, with a point increase of 1,397.07. The index achieved a high of 78,658.59 and a low of 77,402.37 during the trading session. The Relative Strength Index (RSI) stands at 57.96, indicating a moderate level of market strength.

Relationship with Key Moving Averages
The Sensex closed at 78,583.81, which is above its 50-day EMA of 78,134.91 and 200-day EMA of 77,833.62, indicating a bullish trend against these key moving averages. However, with the 10-day EMA at 77,077.61 and 20-day EMA at 77,176.02, the index suggests recent upward momentum surpassing short-term averages.
Moving Averages Trend (MACD)
The MACD for the Sensex indicates a negative value of -328.24, while the MACD Signal line is at -632.86. This suggests that the MACD line is above the Signal line, which could be a bullish signal implying potential upward momentum.

RSI Analysis
For the Sensex, the RSI (Relative Strength Index) is 57.96, indicating a moderately strong momentum. This level suggests that the index is not in an overbought or oversold condition, potentially pointing to stable or continuing market trends.

Analysis for Dow Jones Industrial Average (US) - February 04, 2025

The Dow Jones Industrial Average (US) opened at 44,268.15 and closed at 44,421.91, experiencing a slight decrease of 0.28% with a points change of -122.75. The index showed a trading range between a low of 43,879.06 and a high of 44,594.54, with a volume of 712.89 million. The Relative Strength Index (RSI) is at 58.95, indicating moderately strong momentum, and the MACD is above its signal line, suggesting potential bullish momentum.

Relationship with Key Moving Averages
The Dow Jones Industrial Average closed at 44,421.91, which is above its 50-day EMA of 43,555.37 and its 20-day EMA of 43,974.47, indicating a short-term upward trend. However, it is slightly below the 10-day EMA of 44,358.50 and remains significantly above the 200-day EMA of 41,563.94, signifying overall longer-term bullish momentum.
Moving Averages Trend (MACD)
The MACD value of 412.71 compared to the MACD Signal of 285.92 indicates a potential bullish momentum for the Dow Jones Industrial Average. The MACD line crossing above the signal line suggests that the index might continue its upward trend. However, it's essential to consider other indicators like RSI, which at 58.95, suggests a moderately bullish condition.

RSI Analysis
The RSI (Relative Strength Index) of the Dow Jones Industrial Average (US) is 58.95, indicating that the index is in a neutral state but leaning slightly towards being overbought. Generally, an RSI above 70 suggests overbought conditions, while an RSI below 30 indicates oversold conditions.

Analysis for CAC 40 (France) - February 04, 2025

CAC 40 (France) opened at 7870.29 and closed at 7875.63 with a percentage change of 0.26% from the previous close of 7854.92, showcasing a modest increase with a points change of 20.71. The index has a robust Relative Strength Index (RSI) of 65.10, indicating a bullish trend, supported by a positive MACD of 132.54.

Relationship with Key Moving Averages
The closing price of CAC 40 (France) at 7875.63 is above the 50-day EMA of 7586.02 and the 200-day EMA of 7537.47, indicating a bullish trend with the stock trading above these key moving averages. The closing price is also slightly above the 10-day EMA of 7854.44, suggesting short-term strength.
Moving Averages Trend (MACD)
The MACD for CAC 40 shows a value of 132.54, with a MACD Signal of 129.07, indicating a bullish trend as the MACD line is above the signal line. This suggests potential positive momentum in the stock.

RSI Analysis
The Relative Strength Index (RSI) for CAC 40 (France) is 65.10, indicating a relatively strong upward momentum. With an RSI above 60, the index is not yet in overbought territory, but it suggests a bullish trend. Investors might want to keep an eye on this to see if it crosses into overbought levels.

Analysis for FTSE 100 (UK) - February 04, 2025

The FTSE 100 closed at 8563.74, marking a slight decline of 0.23% with a points change of -19.86 from the previous close of 8583.60. Technical indicators show the 50-day EMA at 8366.76, the 200-day EMA at 8196.61, and a relatively strong RSI at 61.14. The MACD is above the signal line, suggesting a potential bullish trend. Despite a high opening, the index faced resistance, reflected in the day's low of 8524.66.

Relationship with Key Moving Averages
FTSE 100 is trading above its 50-EMA and 200-EMA, indicating a potential bullish trend. However, the closing price is currently below the 10-EMA, suggesting possible short-term weakness.
Moving Averages Trend (MACD)
**MACD Analysis for FTSE 100 (UK):** The MACD value of 92.94 is above the MACD Signal line of 85.43, indicating a bullish trend. This suggests a potential upward momentum in the short term.

RSI Analysis
The FTSE 100 has an RSI of 61.14, suggesting that it is neither overbought nor oversold, indicating a relatively stable position with mild bullish momentum. Typically, an RSI above 70 is considered overbought, while below 30 is considered oversold.

Analysis for DAX (Germany) - February 04, 2025

DAX (Germany) opened at 21,474.79, reached a high of the same, and had a low of 21,298.71, closing at 21,442.53. The index experienced a modest percentage change of 0.067% from the previous close of 21,428.24, with a points change of 14.29. The RSI indicates moderately strong financial momentum at 66.50, and the MACD value of 384.12 suggests a relatively bullish trend compared to the MACD Signal of 366.57.

Relationship with Key Moving Averages
The DAX (Germany) index closed at 21,442.53, showing a slight increase from the previous close, with a positive % change of 0.0667%. It is trading above key moving averages, with the 10 EMA at 21,392.06, 50 EMA at 20,501.26, and 200 EMA at 19,158.05, indicating a bullish trend.
Moving Averages Trend (MACD)
The MACD value for DAX is 384.12, which is above the MACD Signal of 366.57. This suggests a bullish signal and potential upward momentum in the index. Additionally, the positive MACD histogram often indicates strengthening buying pressure.

RSI Analysis
The RSI for the DAX (Germany) is 66.50, which suggests that the index is approaching overbought territory, as RSI values above 70 typically indicate overbought conditions. Investors may need to monitor for potential price corrections if the RSI continues to rise above 70.

Analysis for S&P 500 (US) - February 04, 2025

The S&P 500 (US) showed a decline with a closing value of 5994.57, down 0.76% from the previous close. The trading volume was 4,797.21 million shares. The Relative Strength Index (RSI) stood at 49.60, indicating a neutral market sentiment, while the MACD suggests some bullish momentum with a value above its signal line.

Relationship with Key Moving Averages
The opening price of the S&P 500 is above its 50-day EMA but below the 10-day EMA, indicating a potential short-term bearish sentiment despite longer-term support. Its closing price remains above the 200-day EMA, suggesting an overall bullish trend in the longer term.
Moving Averages Trend (MACD)
The MACD analysis for S&P 500 (US) indicates a slightly bullish signal as the MACD value (24.43) is above the MACD Signal line (21.29). This suggests potential positive momentum in the market despite the recent decrease in closing price.

RSI Analysis
**S&P 500 RSI Analysis:** The Relative Strength Index (RSI) is at 49.60, indicating a neutral market sentiment. This value suggests that the market is neither overbought nor oversold, and there might be no imminent trend reversal.

Analysis for Hang Seng Index (Hong Kong) - February 04, 2025

The Hang Seng Index (Hong Kong) opened at 20,488.29 and closed at 20,789.96, reflecting a notable increase with a percentage change of 2.83% and a points change of 572.70. The Relative Strength Index is at 68.04, indicating that the index is nearing overbought territory. The trading volume was not available.

Relationship with Key Moving Averages
Hang Seng Index (Hong Kong) is currently trading above its key moving averages, with the close price of 20789.96 being higher than the 50-day EMA of 19804.98 and the 200-day EMA of 19009.74. This indicates a bullish trend, supported by a positive MACD and a high RSI of 68.04.
Moving Averages Trend (MACD)
The Hang Seng Index's MACD is 171.36, with a MACD Signal of 43.42. This positive MACD divergence suggests a strong bullish momentum, indicating potential upward movement in the near term if the trend continues.

RSI Analysis
The Hang Seng Index shows a Relative Strength Index (RSI) of 68.04, indicating it is approaching overbought conditions. This suggests that the index has experienced significant upward momentum recently, and traders might anticipate a potential reversal or consolidation period.

Analysis for IBEX 35 (Spain) - February 04, 2025

The IBEX 35 index of Spain opened at 12,204.30 and closed at 12,267.60, marking a positive shift with a 0.51% increase from the previous close of 12,205.80. The index experienced moderate fluctuations with a high of 12,271.40 and a low of 12,174.40, and recorded a strong trading volume of 28,782,093.

Relationship with Key Moving Averages
The current close of the IBEX 35 is 12,267.60, which is above its 50 EMA of 11,872.84 and 200 EMA of 11,389.98, indicating a positive trend. Additionally, it is slightly above the 10 EMA of 12,173.90 and 20 EMA of 12,044.39, suggesting recent bullish momentum.
Moving Averages Trend (MACD)
The MACD for IBEX 35 (Spain) is 150.25, which is above the MACD Signal line at 117.32, indicating a bullish trend. The positive difference suggests potential upward momentum in the stock index.

RSI Analysis
The RSI (Relative Strength Index) for IBEX 35 stands at 63.64, indicating a moderately strong position in the market. Since RSI values above 70 suggest overbought conditions and below 30 indicate oversold conditions, the current RSI suggests that IBEX 35 is approaching overbought territory but is not yet there. This implies potential for price stabilization or a continued uptrend.

Analysis for NASDAQ Composite (US) - February 04, 2025

The NASDAQ Composite showed a decrease in performance, closing at 19,391.96 with a percentage change of -1.20% and a points change of -235.48. It traded with a volume of 8.27 billion and has a Relative Strength Index (RSI) of 46.36, which indicates a neutral momentum.

Relationship with Key Moving Averages
The NASDAQ Composite's current close of 19,391.96 is below its 10 EMA of 19,609.01 and 20 EMA of 19,600.97, indicating a short-term bearish trend. However, it remains slightly above the 50 EMA of 19,426.17, suggesting possible support at that level.
Moving Averages Trend (MACD)
The NASDAQ Composite's MACD value is 27.20, while the MACD Signal is 47.35. This suggests a bearish trend as the MACD is below the signal line, indicating potential downward momentum.

RSI Analysis
The RSI (Relative Strength Index) for the NASDAQ Composite is at 46.36, indicating a neutral position, neither overbought nor oversold. It suggests a balanced momentum in the market, and traders might await further signals for trend confirmation.

Analysis for Nikkei 225 (Japan) - February 04, 2025

The Nikkei 225 index opened at 39,078.66 and closed at 38,798.37, marking a positive change of 0.72% or 278.28 points from its previous close of 38,520.09. With a relative strength index of 45.43, the index is trending slightly downward, and the MACD indicates a bearish signal as it is below the MACD signal line.

Relationship with Key Moving Averages
Nikkei 225's close price of 38,798.37 is below the 50-day EMA of 39,115.14 and the 10-day EMA of 39,170.01, indicating a bearish momentum in the short to mid-term. However, it remains above the 200-day EMA of 38,235.39, suggesting some long-term bullishness. The current RSI of 45.43 also supports a neutral to slightly bearish sentiment.
Moving Averages Trend (MACD)
The MACD for Nikkei 225 shows a value of -23.22, while the MACD Signal is 39.75. This negative MACD value below the signal line suggests bearish momentum, indicating potential downward pressure on the index.

RSI Analysis
The Relative Strength Index (RSI) for Nikkei 225 is 45.43, indicating a neutral trend as it is close to the midpoint of the typical 30-70 range. This suggests the index is neither overbought nor oversold, and traders might look for other indicators for further insights.

Analysis for Nifty Bank - February 04, 2025

Nifty Bank opened at 49,538.80 and closed at 50,157.95, marking a 1.93% increase from the previous close of 49,210.55. The index experienced a high of 50,206.60 and a low of 49,482.50, with a notable points change of 947.40. The RSI indicates moderate strength at 54.60, and the MACD suggests a negative divergence from the signal line.

Relationship with Key Moving Averages
The closing price of Nifty Bank is 50,157.95, which is slightly below its 50 EMA of 50,226.57 and 200 EMA of 50,214.66, indicating a potential resistance at these levels. However, it is above its 10 EMA of 49,266.86 and 20 EMA of 49,395.61, suggesting a short-term bullish trend.
Moving Averages Trend (MACD)
The MACD for Nifty Bank is -336.12, while the MACD Signal is -581.95. Since the MACD is above the MACD Signal, it indicates a potential bullish trend or upward momentum. However, additional analysis and confirmation indicators should be considered for a comprehensive view.

RSI Analysis
**RSI Analysis for Nifty Bank:** The RSI (Relative Strength Index) for Nifty Bank is 54.60, which suggests a neutral market condition. An RSI above 50 typically indicates that the stock is trending upwards, but since it is not above 70, it does not suggest overbought conditions.

Analysis for Nifty 50 - February 04, 2025

The Nifty 50 index opened at 23,509.90 and closed at 23,739.25, marking an increase of 378.20 points or 1.62% from the previous close of 23,361.05. The day's trading saw a high of 23,762.75 and a low of 23,423.15. The 50-day EMA suggests a support level at 23,670.36, while the RSI of 56.67 indicates mildly bullish sentiment.

Relationship with Key Moving Averages
Nifty 50 closed at 23739.25, above its 50-day EMA of 23670.36 and its 200-day EMA of 23622.70, indicating a potential bullish trend. It also closed above the 10-day EMA of 23334.85 and the 20-day EMA of 23367.36, showing short-term momentum.
Moving Averages Trend (MACD)
The MACD for Nifty 50 is -100.58, which is above the MACD Signal of -187.43. This suggests potential upward momentum, as the MACD line crossing above the Signal line can be a bullish indicator. However, it's essential to consider other factors and indicators before making any trading decisions.

RSI Analysis
The RSI for Nifty 50 is currently at 56.67, indicating a neutral position in terms of momentum. This implies that the index is neither overbought nor oversold, suggesting a likely balanced market sentiment at this time.

Up Next
Global stock market indices performed today - February 04, 2025

Microsoft commits USD 17.5 billion investment in India: CEO Satya Nadella

CBI books Anil Ambani's son, Reliance Home Finance Ltd. in Rs 228 crore bank fraud case

RBI raises FY26 GDP growth projection to 7.3 pc

RBI trims policy interest rate by 25bps to 5.25pc, loans to get cheaper

Rupee slumps to all-time low of 90.25 against US dollar in intra-day trade

More videos

Reliance completes merger of Star Television Productions with Jiostar

India to lead emerging market growth with 7pc GDP rise in 2025: Moody’s

Nifty hits record high after 14 months; Sensex nears all-time peak

Reliance stops Russian oil use at its only-for-export refinery to comply with EU sanctions

ED attaches fresh assets worth over Rs 1,400 cr in case against Anil Ambani's Reliance Group

India signs one-year deal to import 2.2 million tonnes of LPG from US

India International Trade Fair begins at Pragati Maidan amid tight security

Stock markets decline in initial trade on foreign fund outflows, weak Asian peers

Amazon to lay off 30,000 office workers amid AI-driven cost cuts

US sanctions on Russian firms to hit Reliance; PSUs likely to keep buying Russian oil via traders