


Highlights
Latest news

Gujarat AAP MLA Chaitar Vasava announces Aravalli protection convention on December 23

New Zealand commits USD 20 bn investment in India under FTA in 15 yrs; on lines of EFTA pact

Bihar CM Nitish Kumar, Dy CM Samrat Choudhary call on PM Modi in Delhi

Union Home Minister Amit Shah meets Bihar CM Nitish Kumar in Delhi

National Herald case: Delhi HC seeks Gandhis' reply on ED plea against trial court order

Delhi: Over 2.12 lakh PUC certificates issued in four days as GRAP-IV enforcement intensifies

Assam on high alert in view of fresh unrest in Bangaldesh: Himanta

Oppo Reno 15 Pro Mini First Look & Hands-On: Small Phone, Big Intentions
NSE Nifty 50 Top losers: What are the 5 Biggest Stock losers Today January 21, 2025


In this article, we will explore the technical indicators of some of the low-performing stocks on the Indian stock market, including ADANIPORTS.NS,ICICIBANK.NS,NTPC.NS,SBIN.NS, and TRENT.NS.
By looking at these stocks through the lens of key technical factors, we aim to better understand their price movements, trends, and potential future performance.
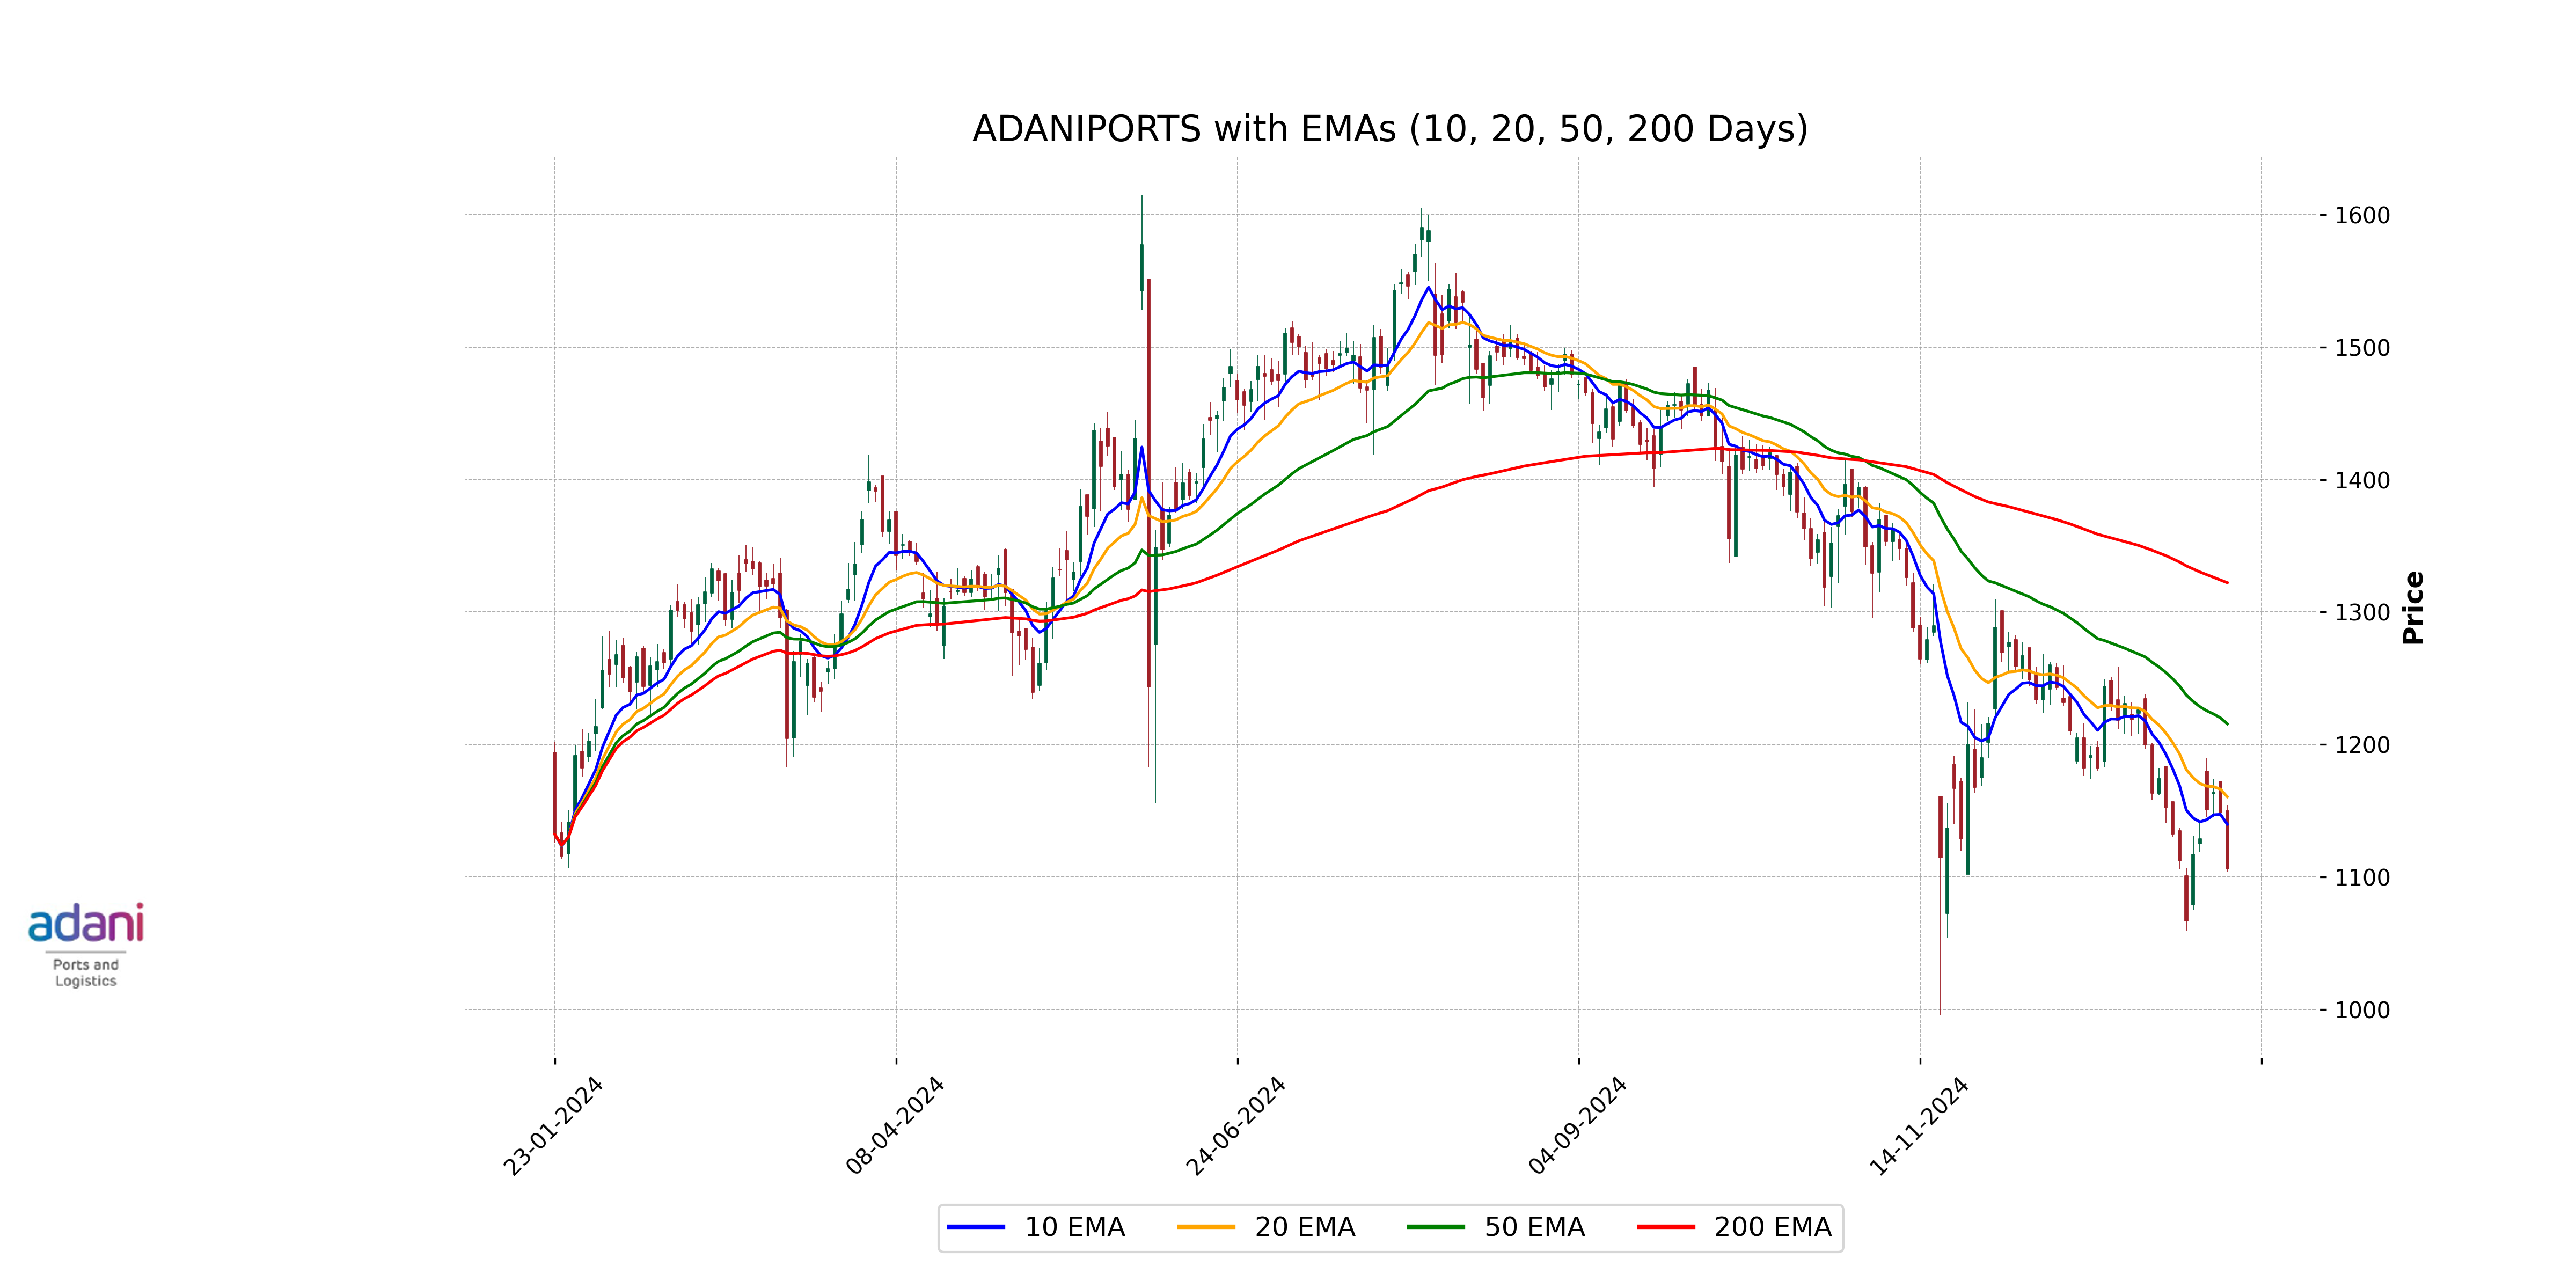
Stock Performance for January 21, 2025: ADANIPORTS.NS opened at 1150.0 and had a high of 1154.25 before closing at 1106.20, representing a percentage change of -3.70% and a points change of -42.5 from the previous close of 1148.70.
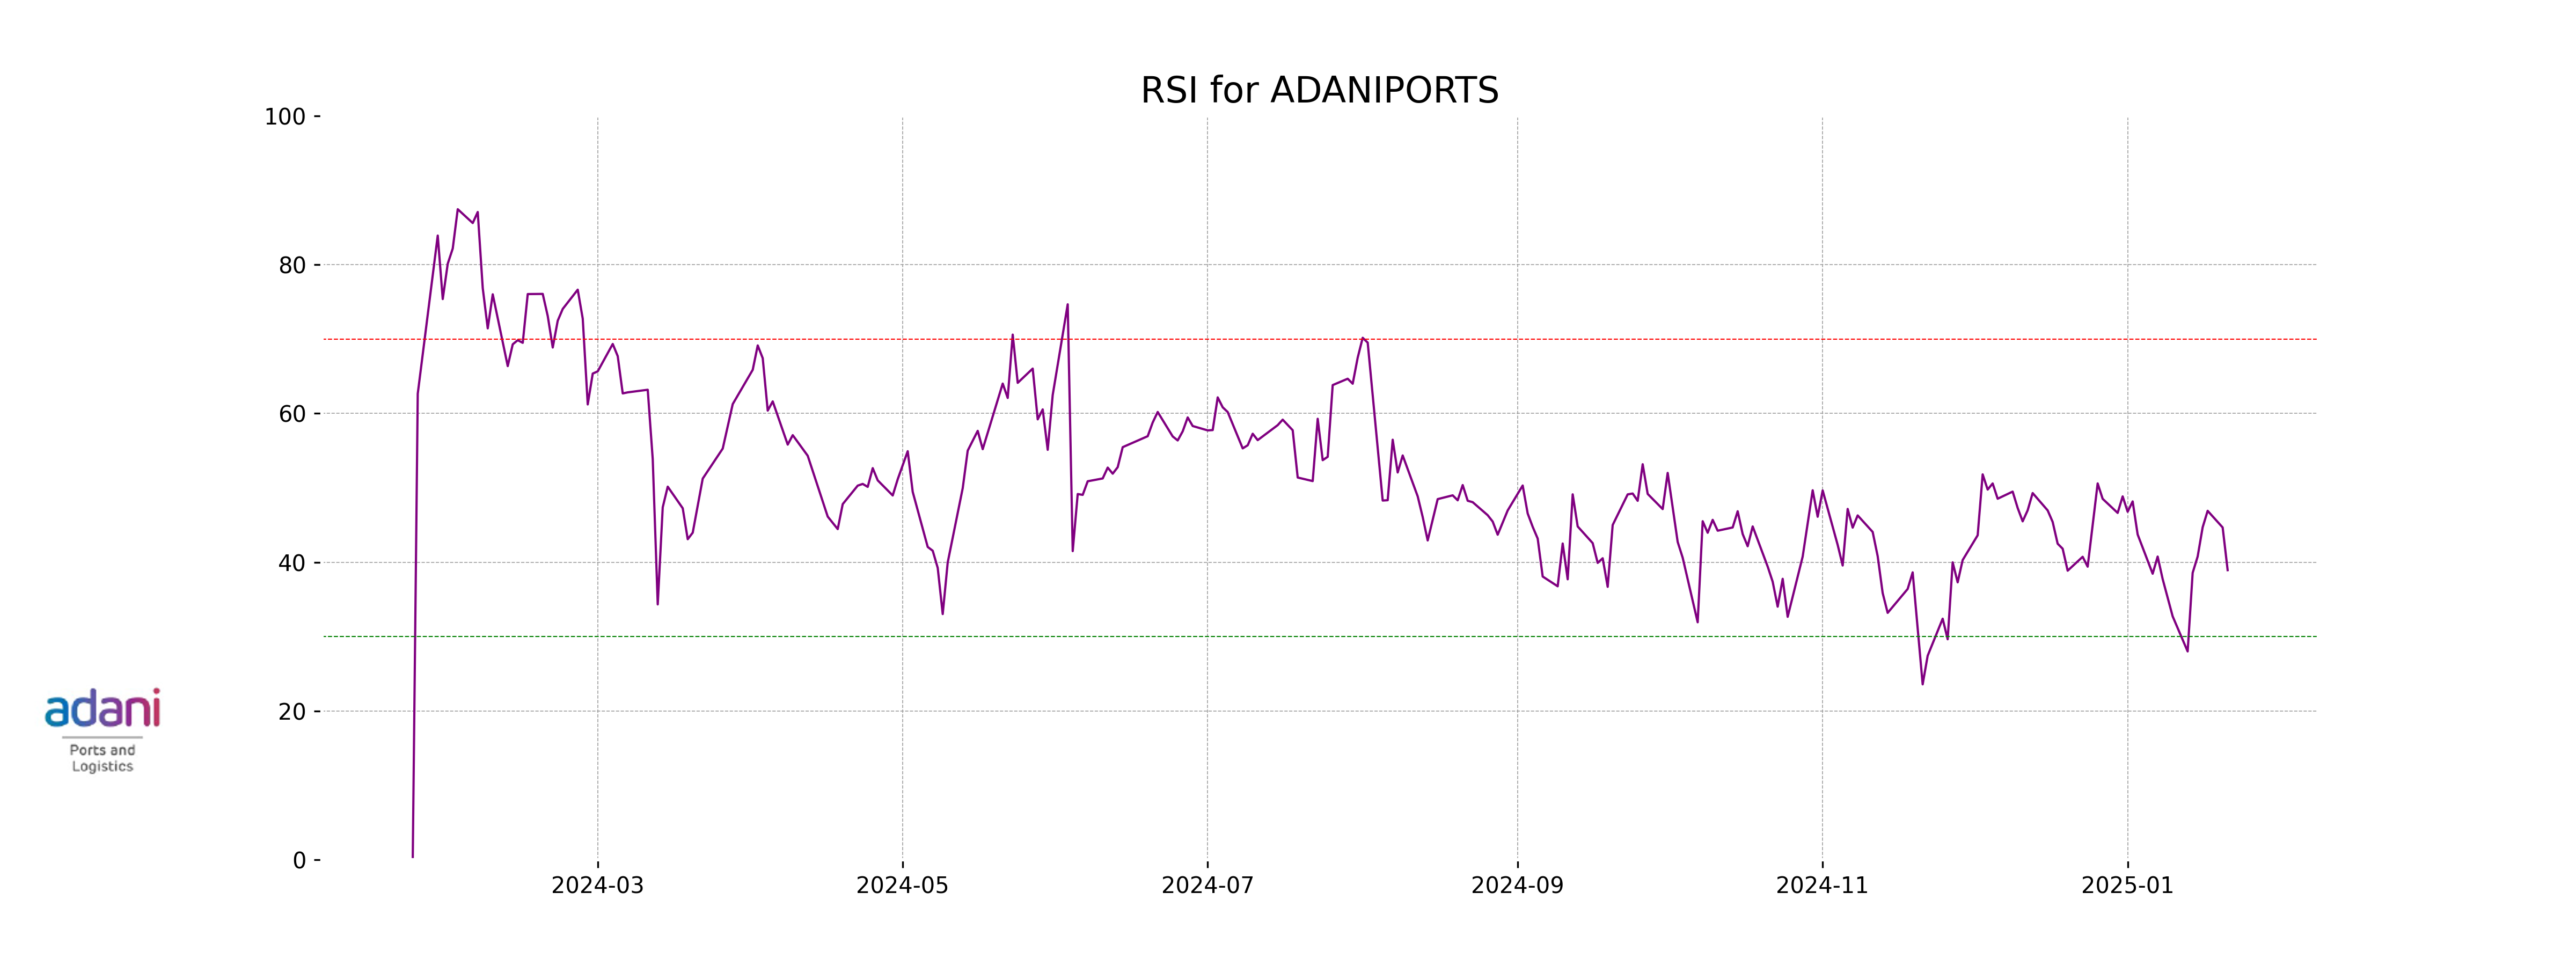
RSI Analysis: The RSI for ADANIPORTS.NS is at 1156.10, indicating the stock is potentially in an overbought condition, which could signal a forthcoming price correction.
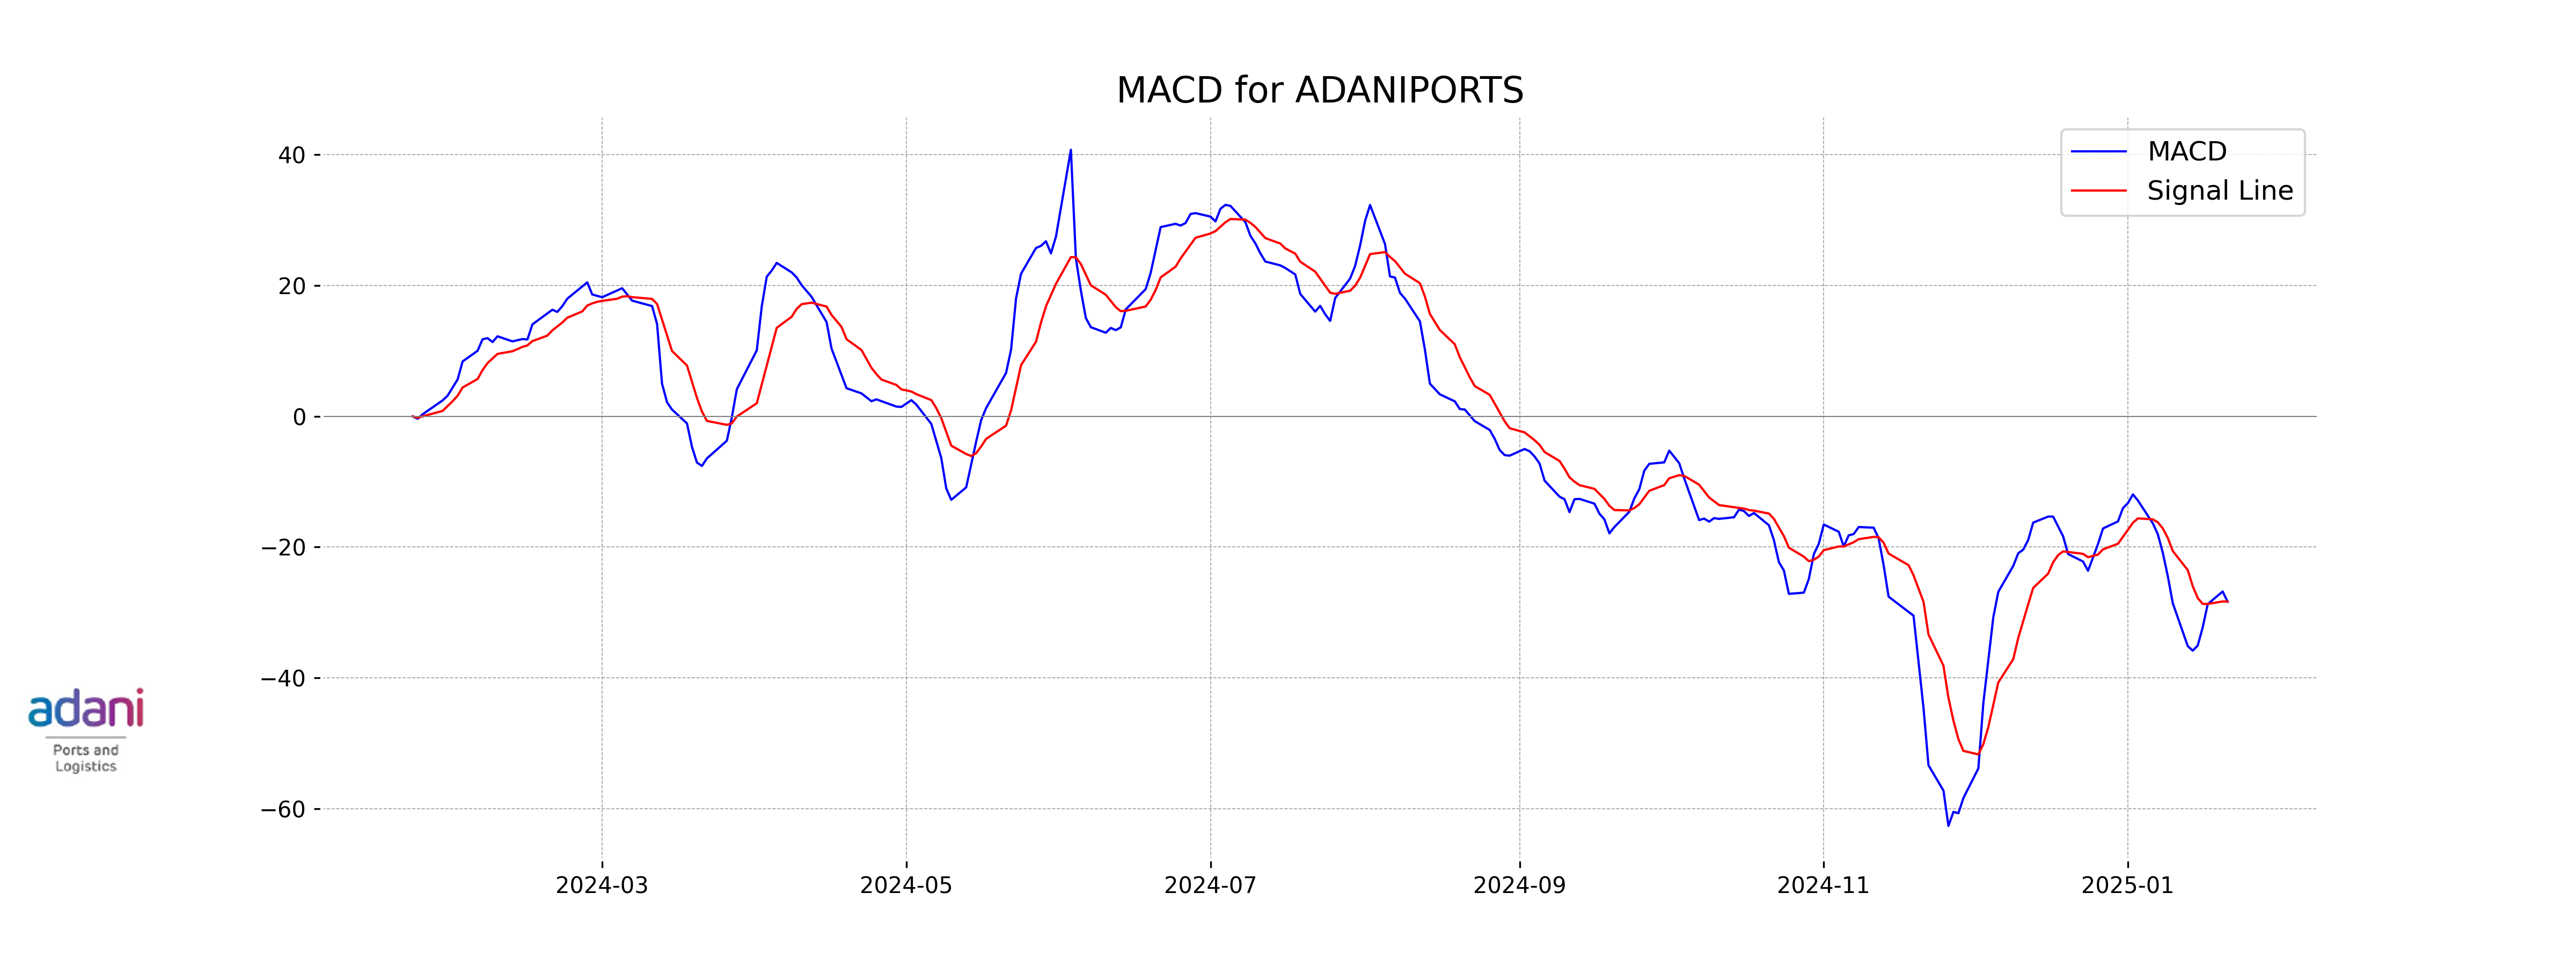
MACD Analysis: With a MACD value of -19.13 and a signal line at -17.97, ADANIPORTS.NS has a negative MACD crossover, suggesting a bearish momentum in the short term. Traders might interpret this as a signal to watch for further downtrends.
Moving Averages Insight: The stock is currently below its 10-EMA (37.25), 20-EMA (1174.78), and 50-EMA (1185.99), but below the 200-EMA (1139.58), supporting a bearish trend. This could indicate downward pressure is significant in the short-term, yet there is some long-term support above the current prices.
Stock Performance on January 21, 2025:
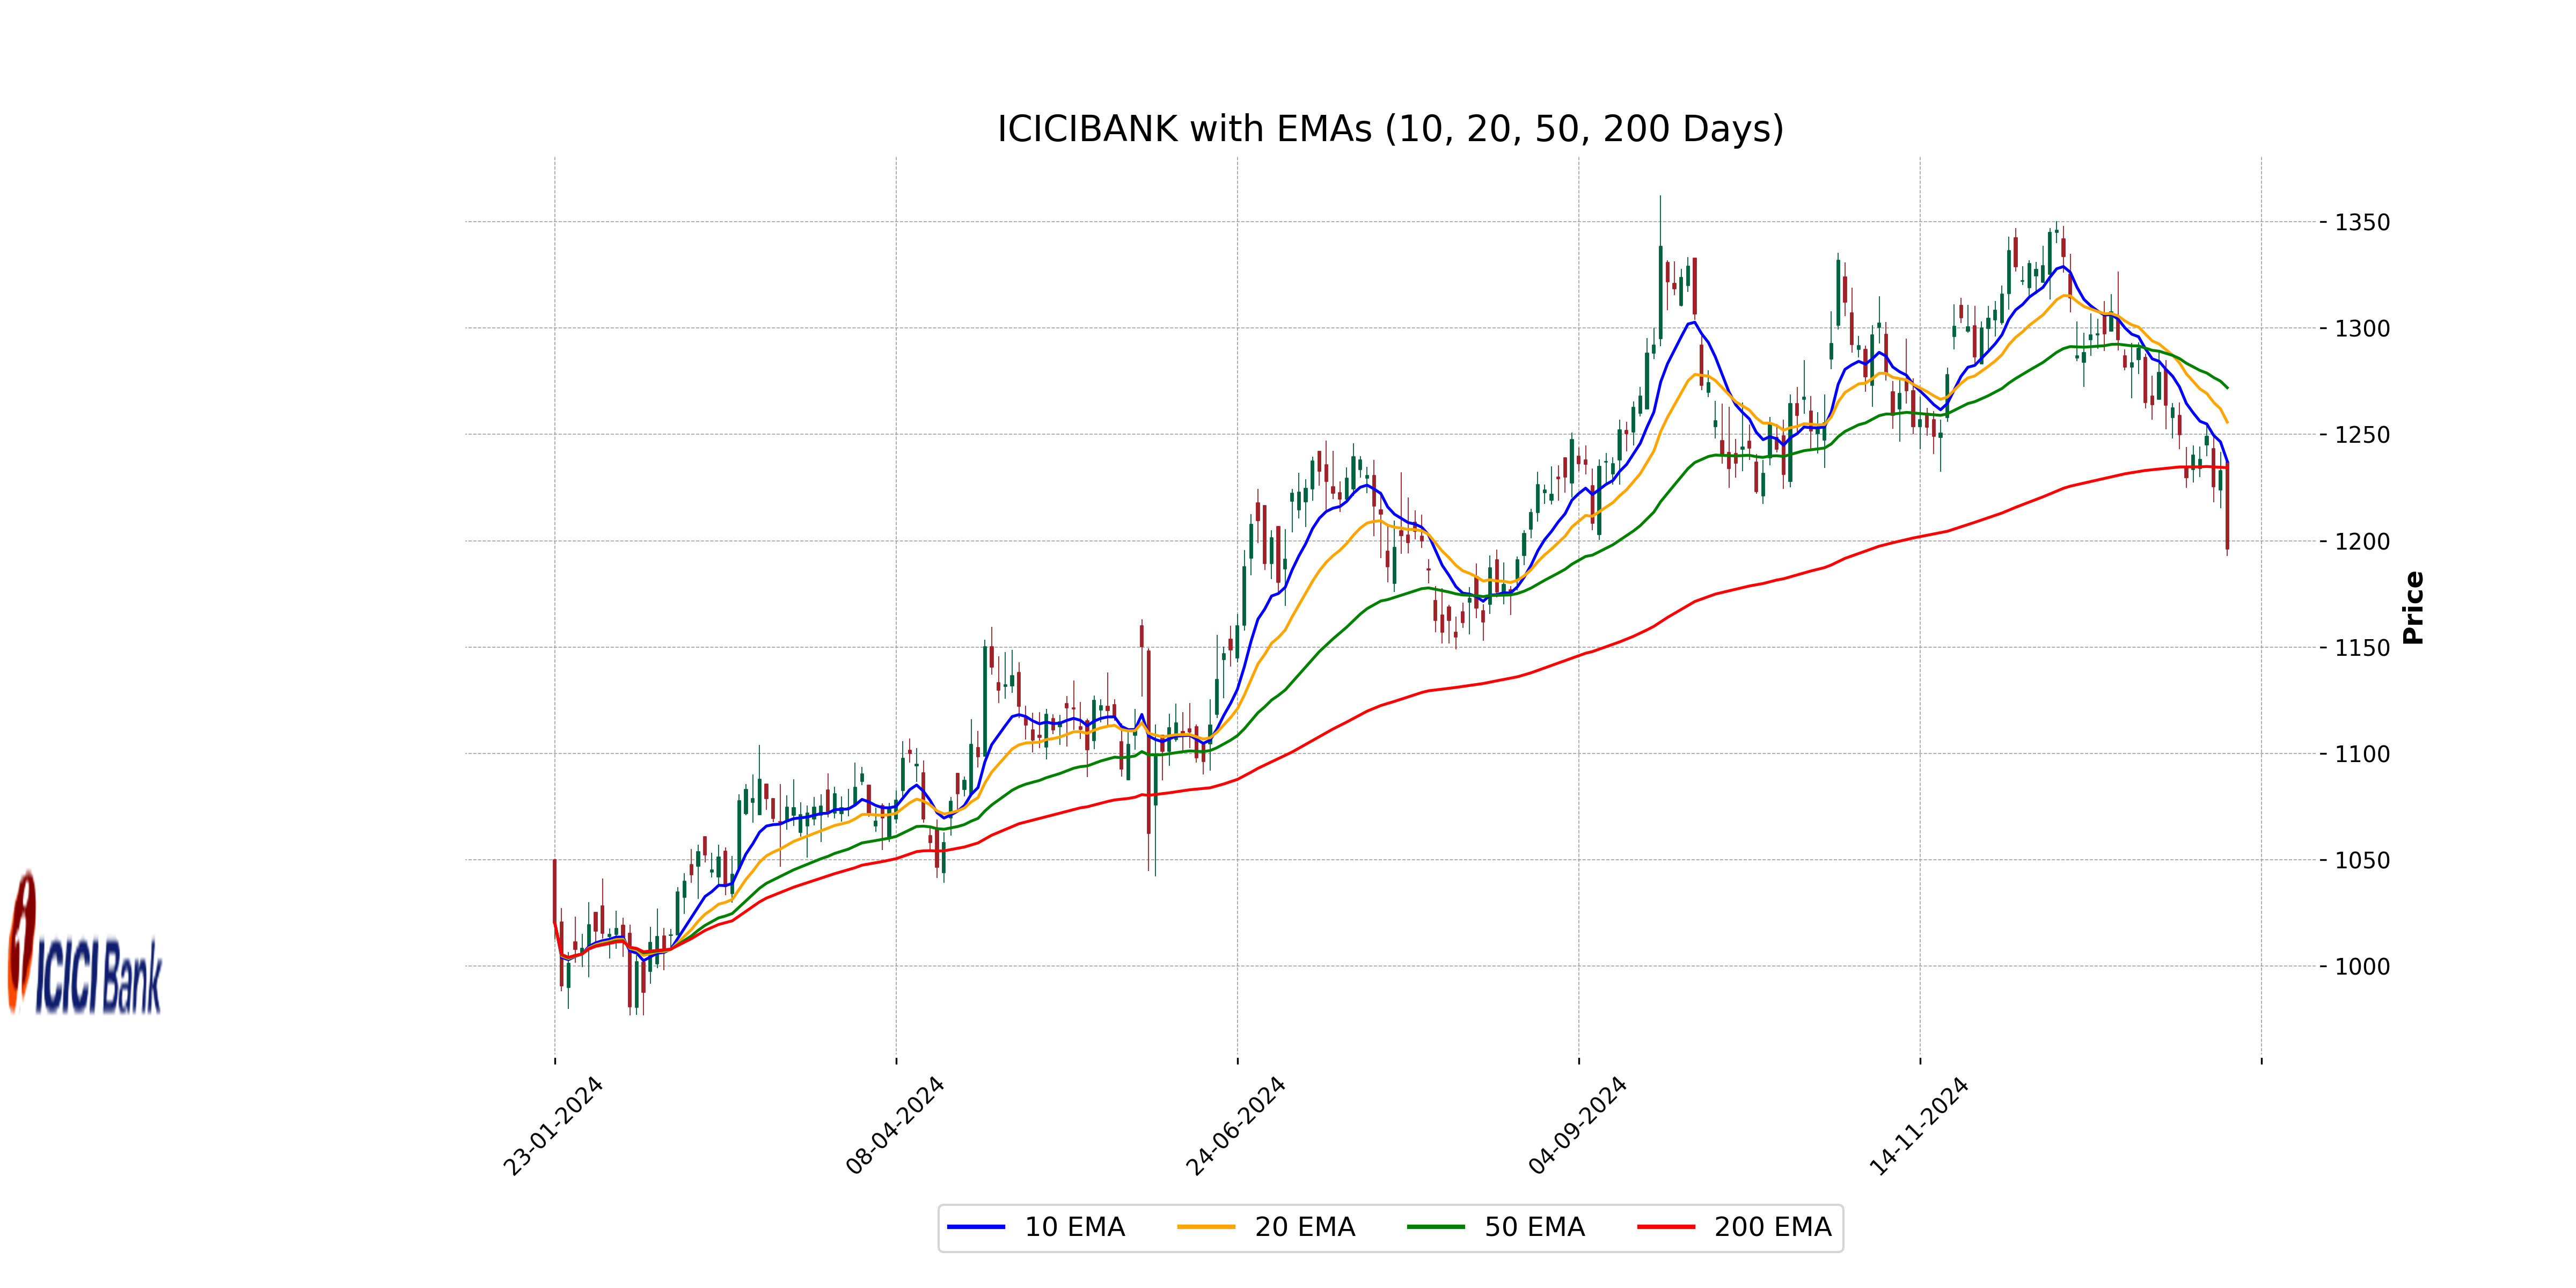
The stock "ICICIBANK.NS" opened at ₹1,236.95, reached a high of ₹1,238.95 and a low of ₹1,192.70, closing at ₹1,196.15. It experienced a percentage change of -2.98% and a points change of -36.80 from its previous close of ₹1,232.95.
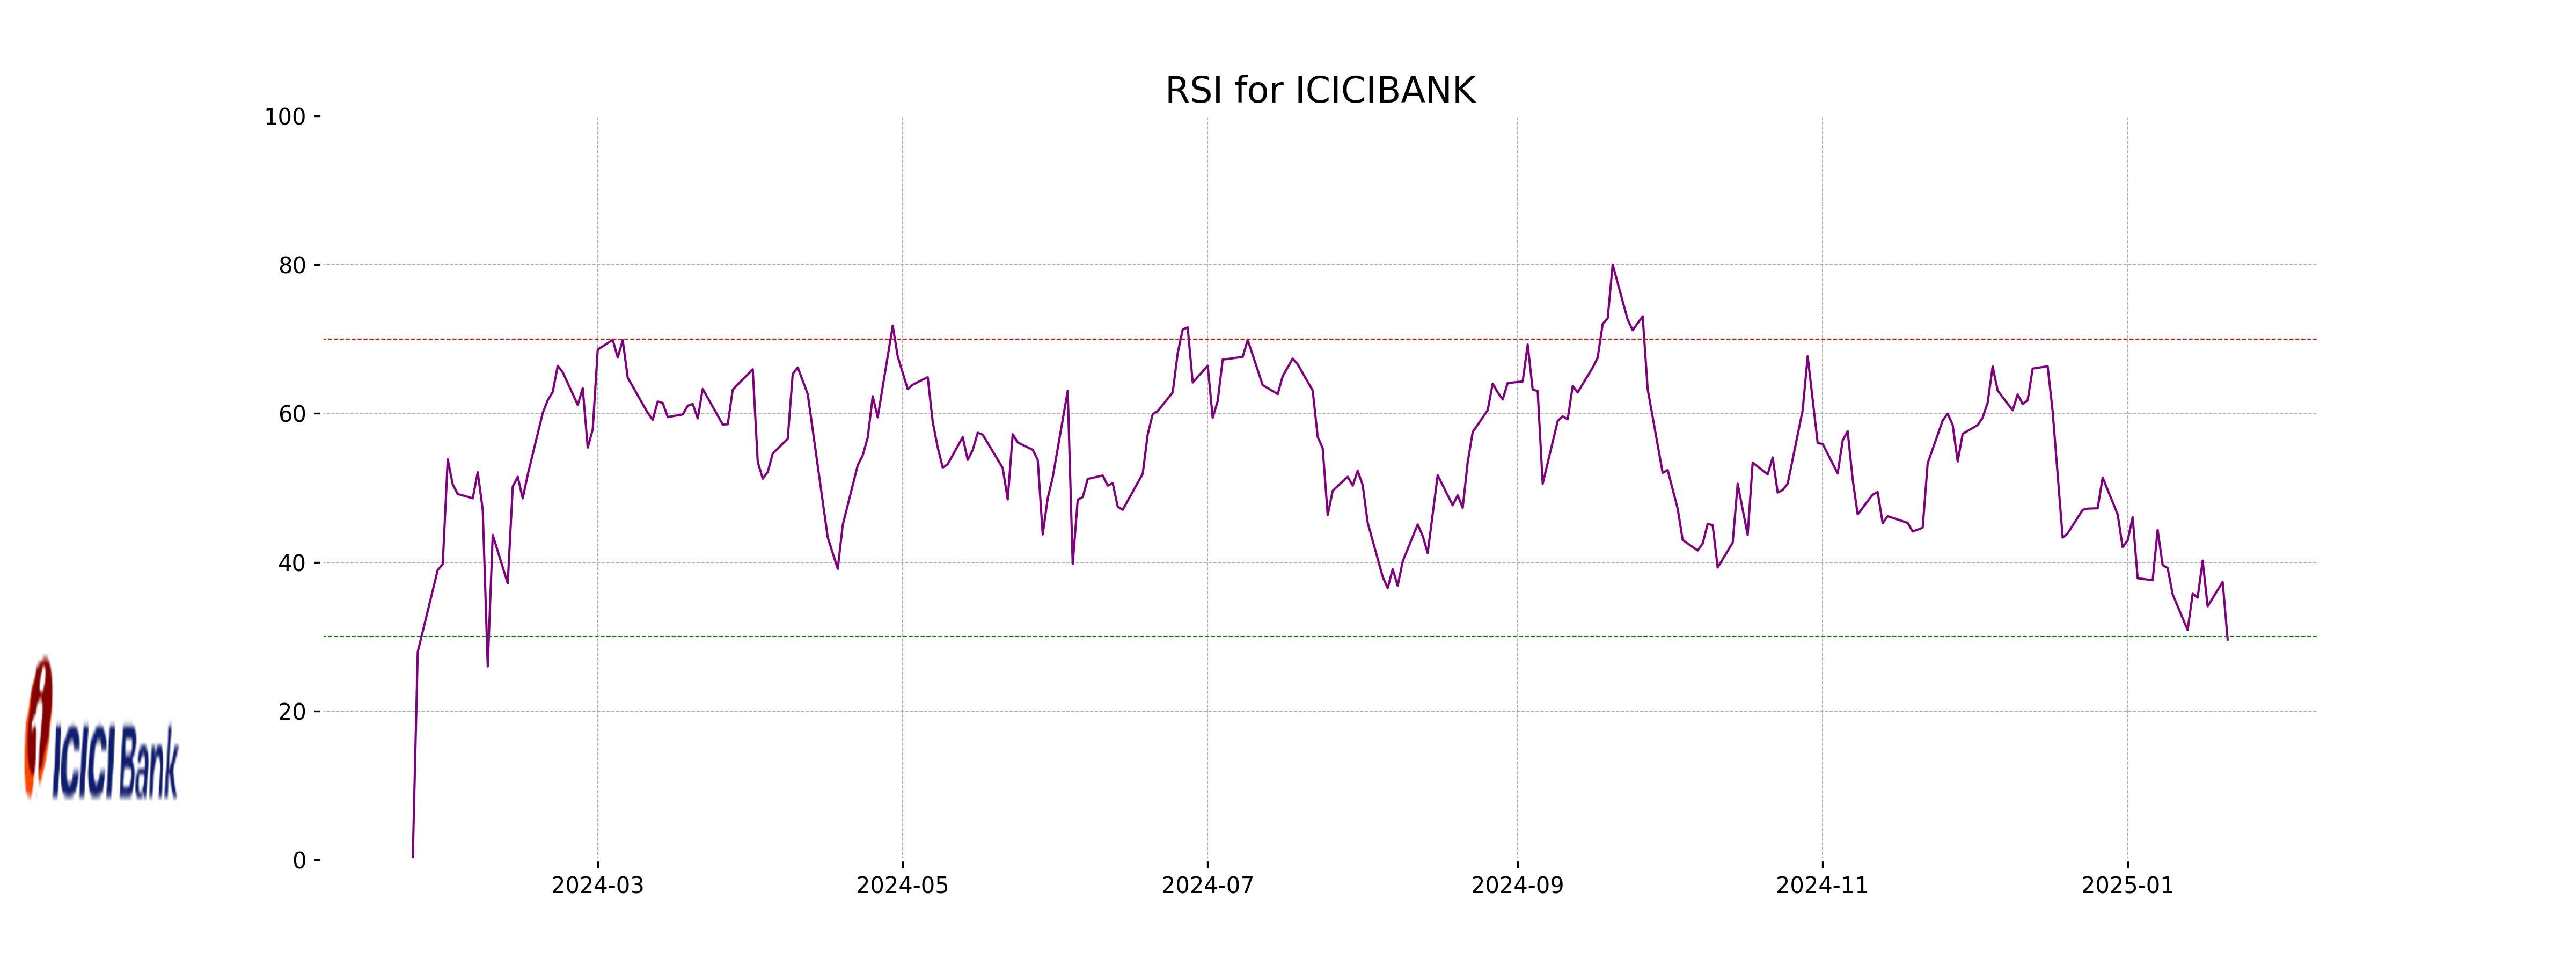
Relative Strength Index (RSI):
The RSI for ICICIBANK.NS is 1253.88, which is considerably above the typical overbought threshold. This suggests that the stock is in an overbought state, indicating potential for a price correction soon.
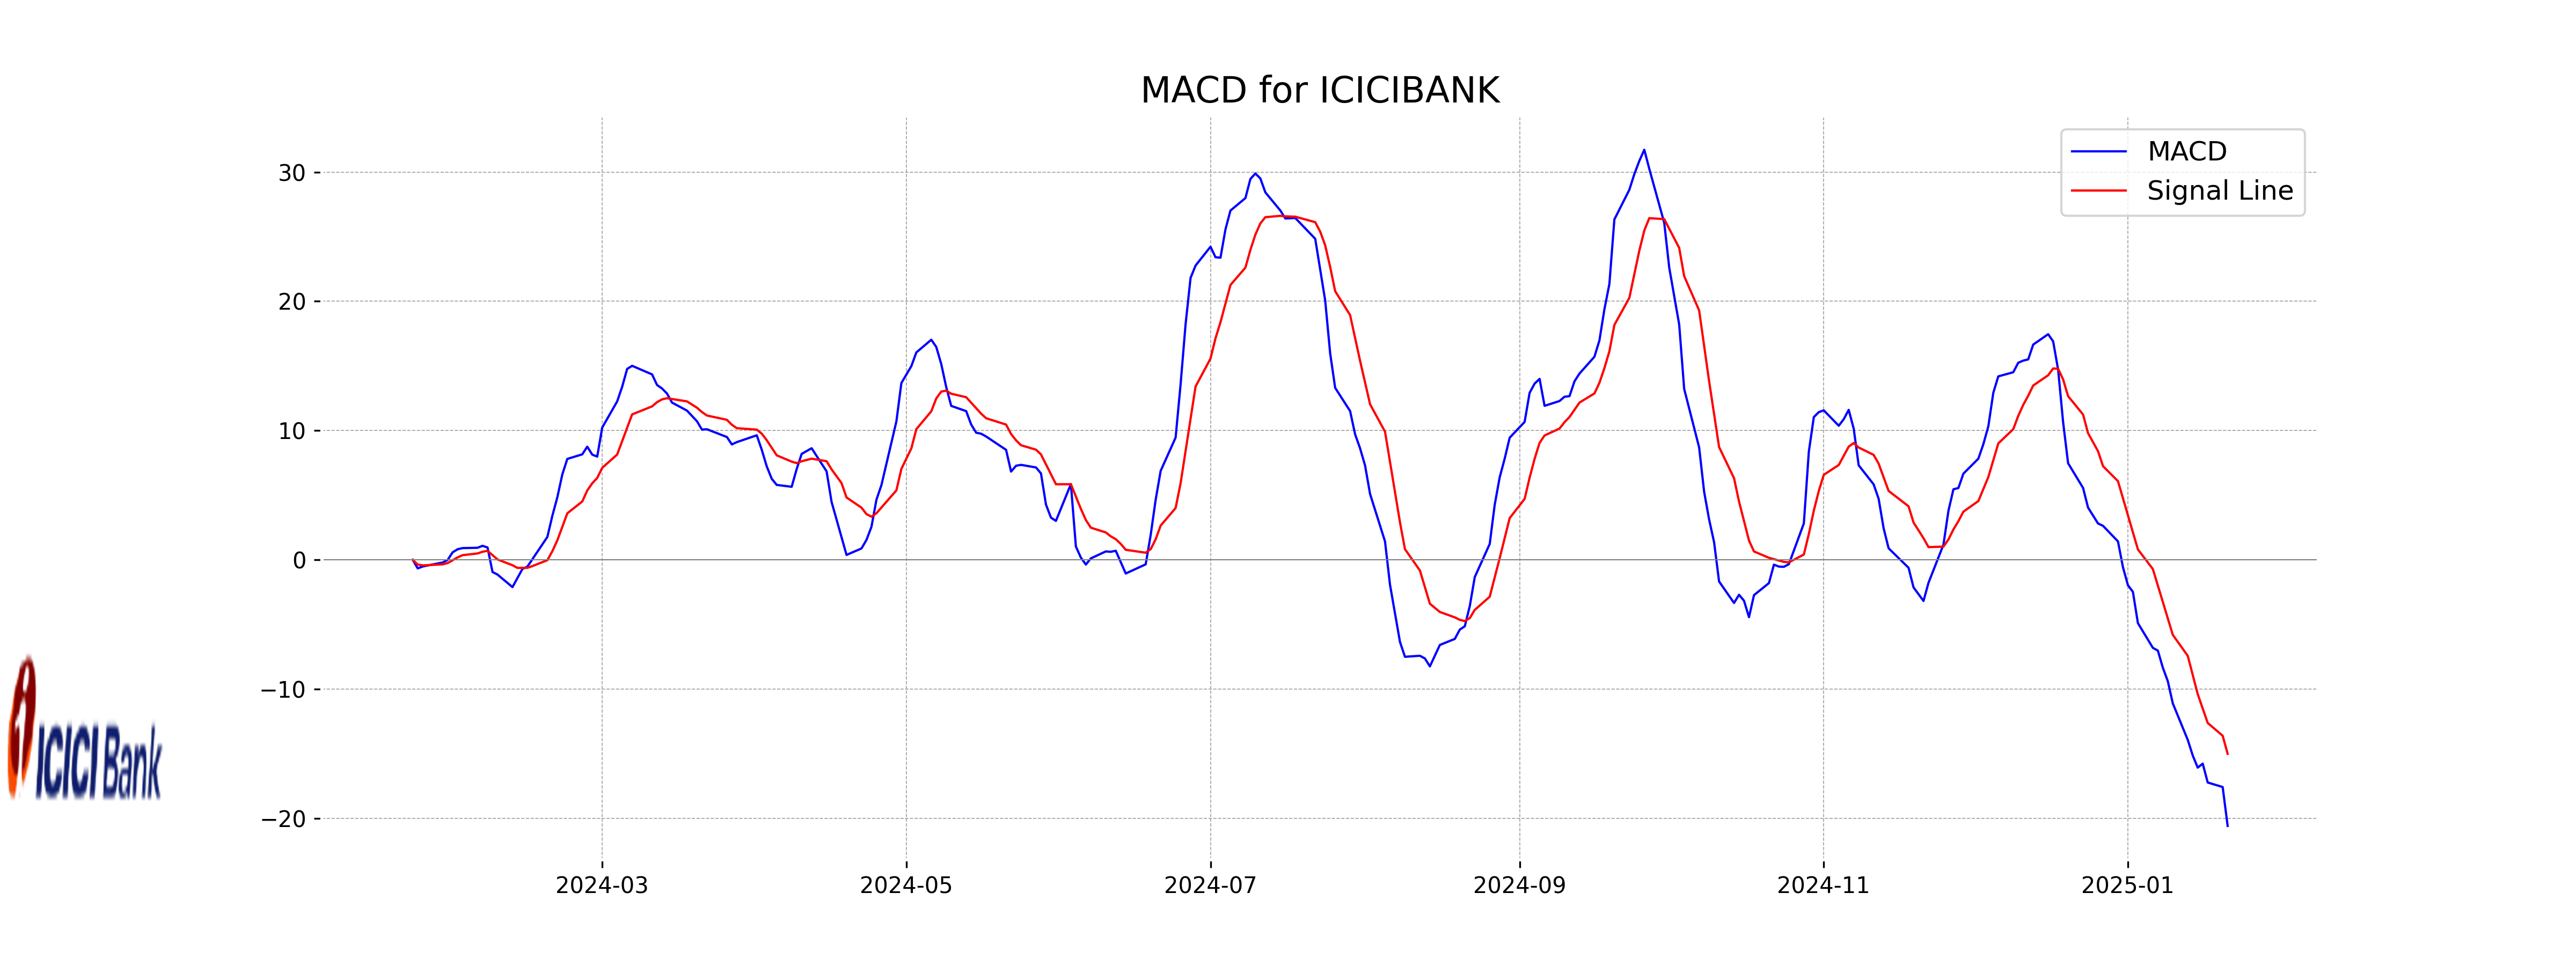
MACD Analysis:
The MACD value is -18.06, while the signal line is at -13.94. The fact that the MACD is below the signal line suggests a bearish crossover, which implies sustained selling pressure and a possible continuation of the downtrend.
Moving Average Analysis:
The stock price is significantly below all critical EMAs: 10-EMA at 26.40, 20-EMA at 1270.20, 50-EMA at 1279.68, and 200-EMA at 1237.23. This alignment confirms a bearish trend, suggesting further decline unless reversal patterns emerge.
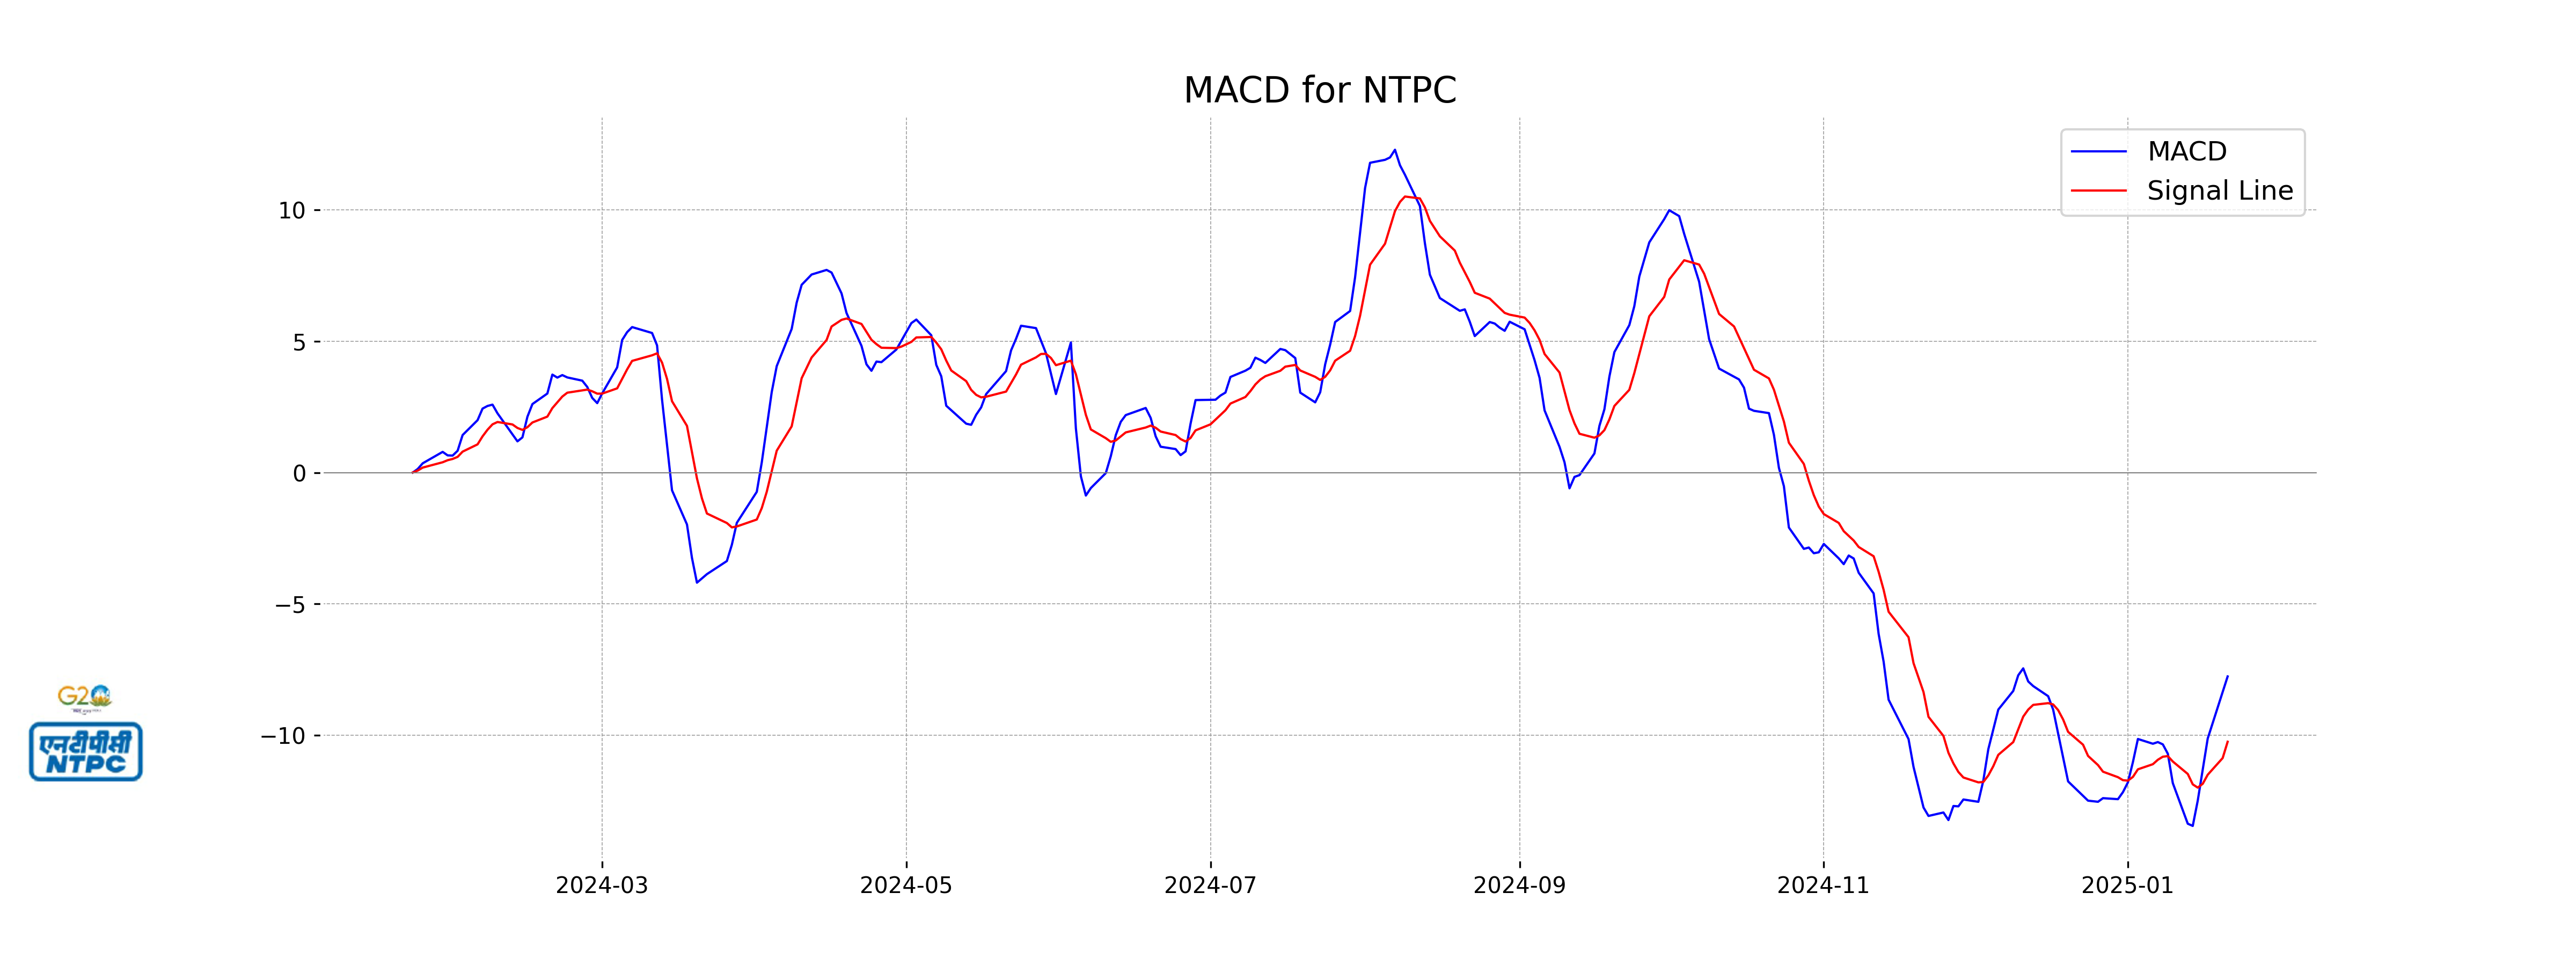
Stock Performance (January 21, 2025): The stock NTPC.NS opened at 337.80, saw a high of 338.25 and a low of 323.80, finally closing at 324.30. This represents a percentage change of -3.50% and a points change of -11.75 from the previous close of 336.05.
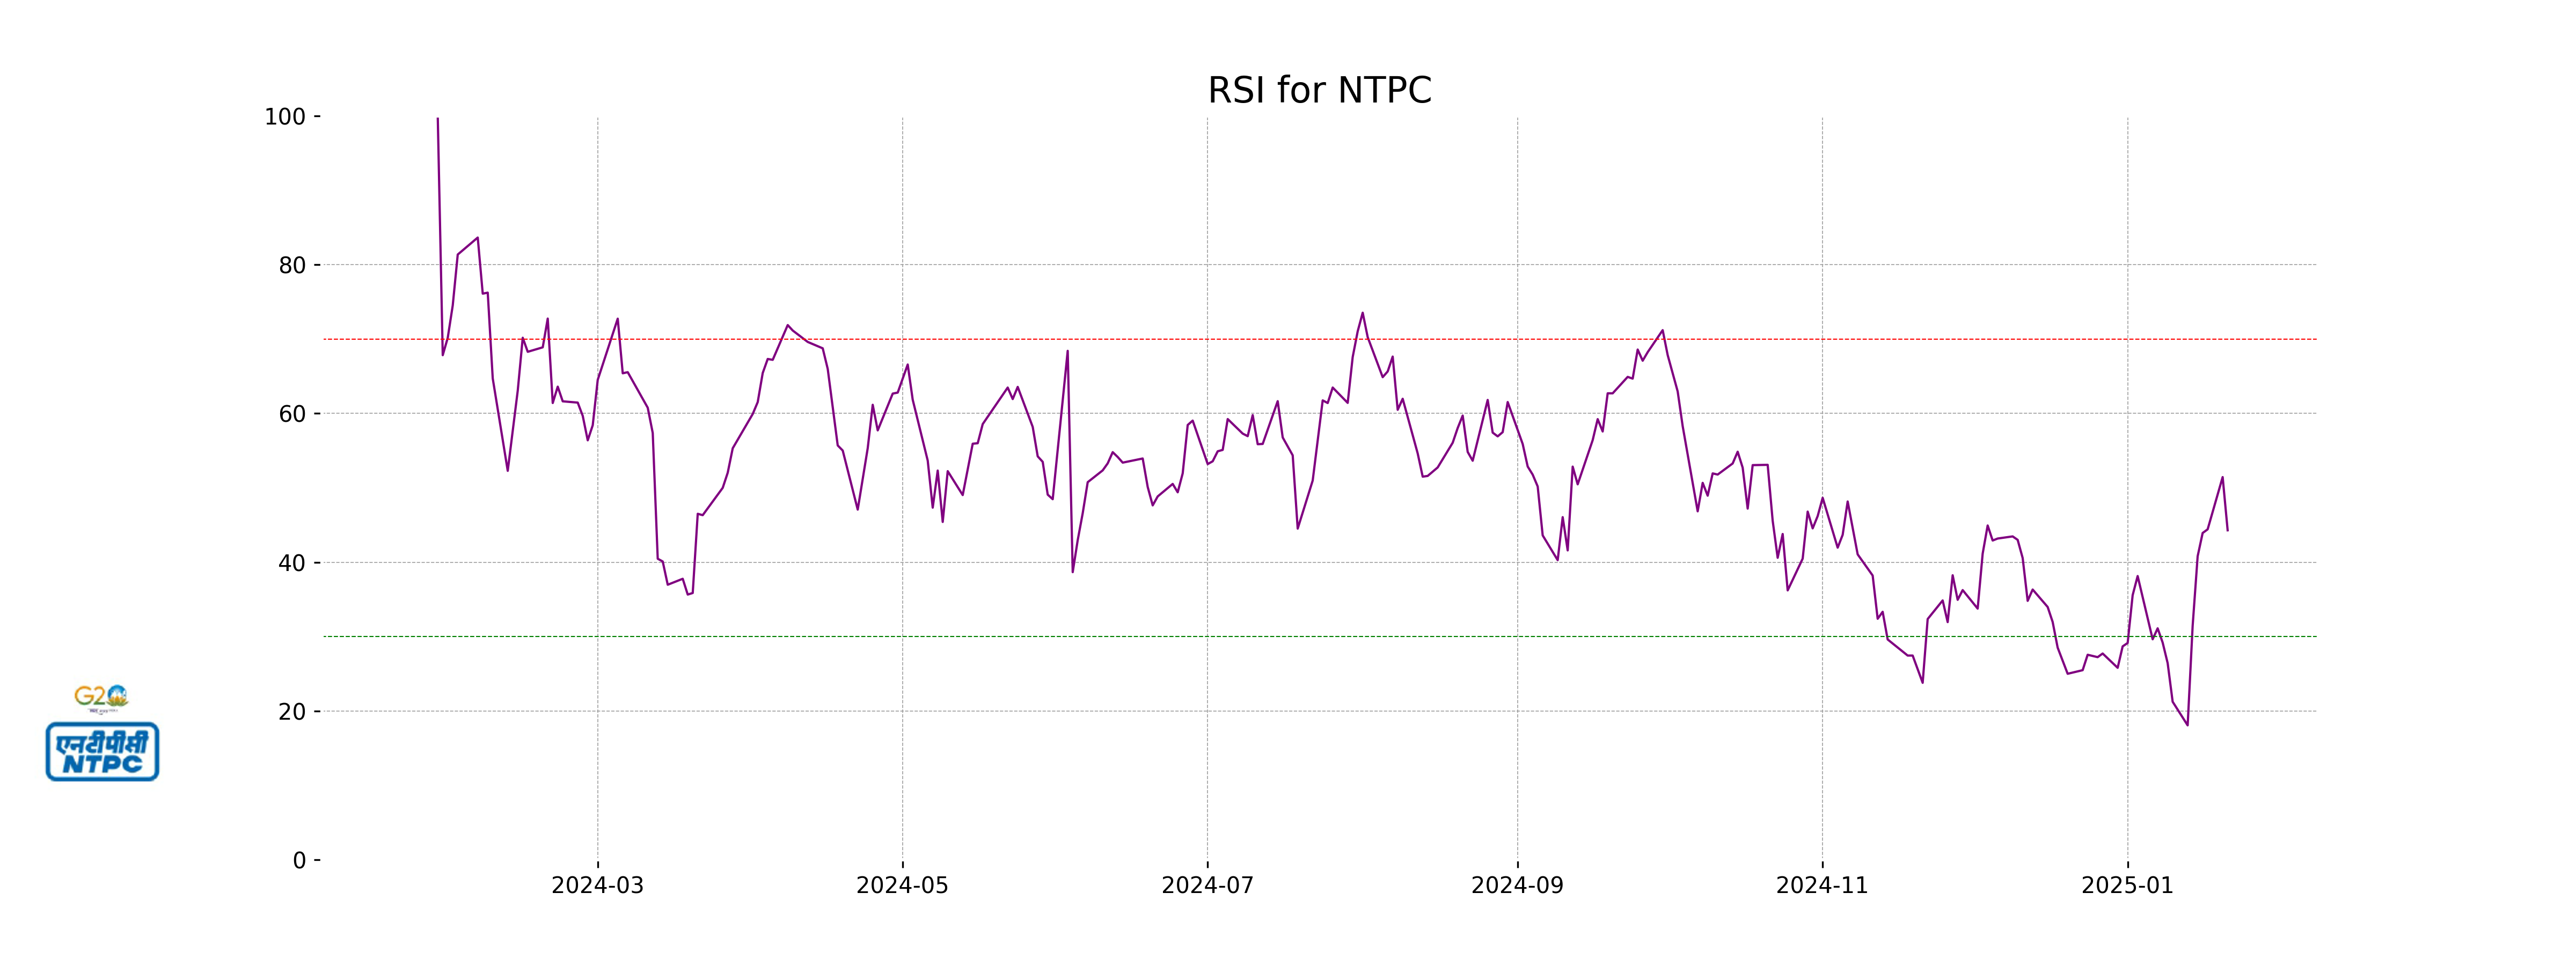
RSI Analysis: The RSI value is 326.60, which is atypical as RSI generally ranges from 0 to 100. In typical scenarios, an RSI above 70 is considered overbought, and below 30 is oversold; however, the given value seems inaccurate. Adjustments or clarification may be needed.
MACD Analysis: The MACD value is -3.38 with the signal line at -4.72. Since the MACD is above the signal line, this indicates a potential bullish crossover, which could suggest a positive trend reversal, although the negative values indicate underlying weakness.
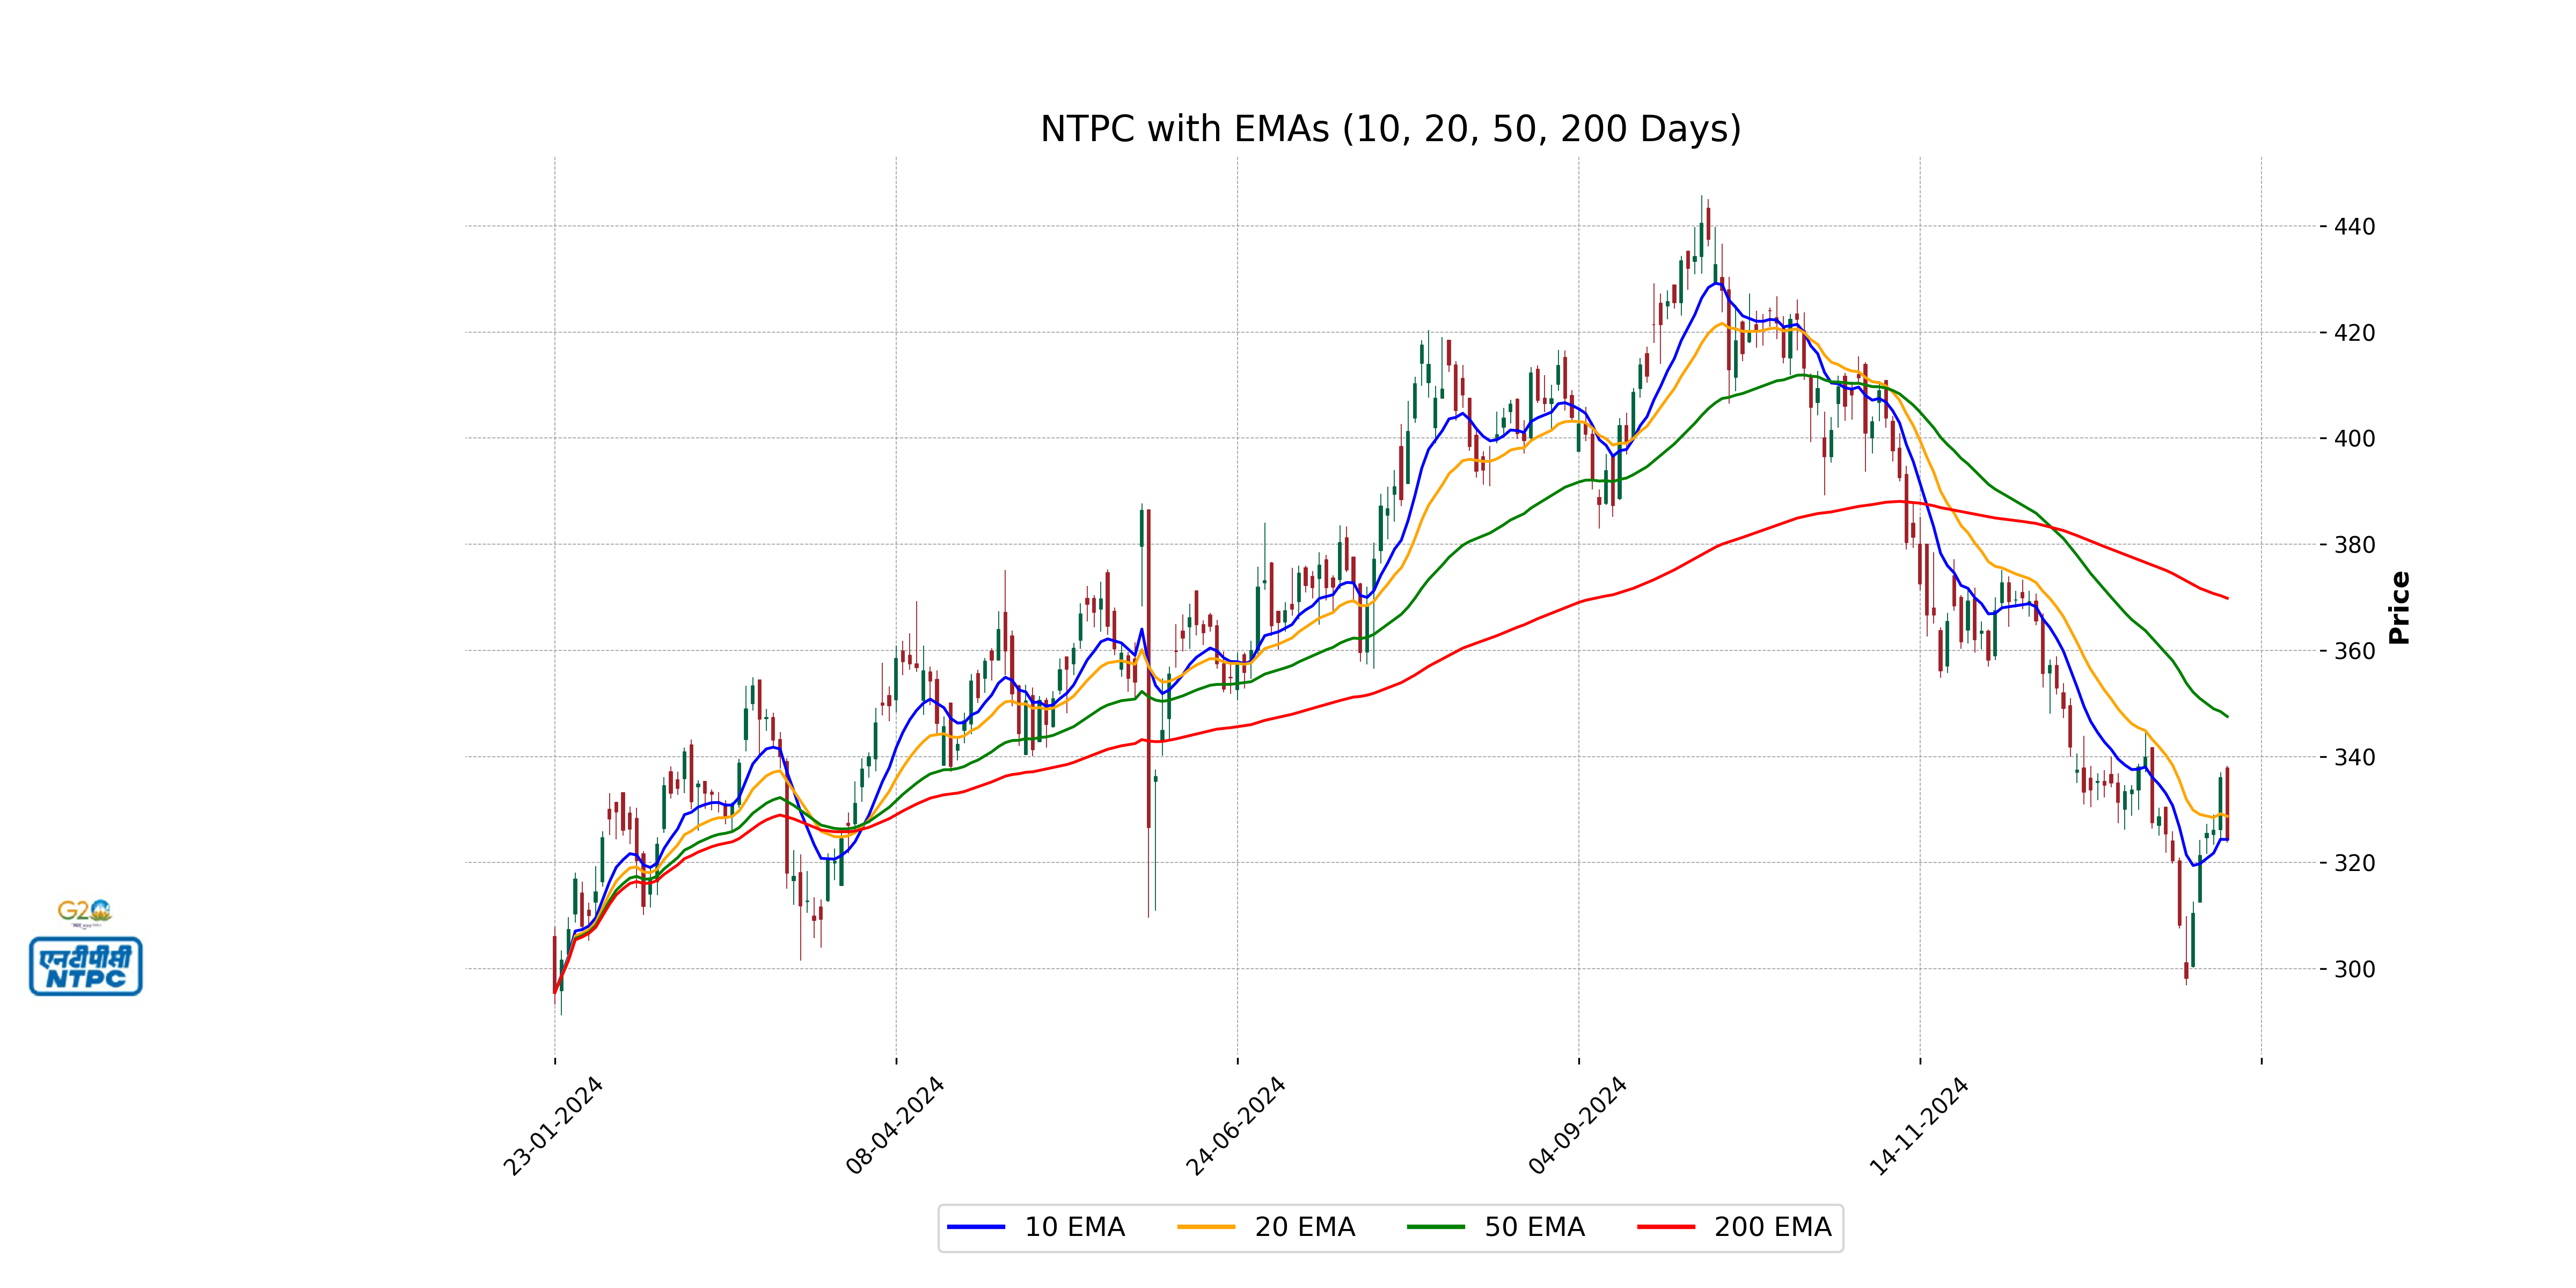
Moving Averages: NTPC.NS is currently below its 50-EMA (334.24) but just below the 200-EMA (324.29), indicating a bearish stance as the price is moving downwards, reflecting weakness. The 10-EMA and 20-EMA values seem incorrect, requiring revalidation.
Stock Performance for January 21, 2025:
- Open: 784.80
- High: 784.90
- Low: 756.05
- Close: 759.05
- Percentage Change: -2.59%
- Points Change: -20.20
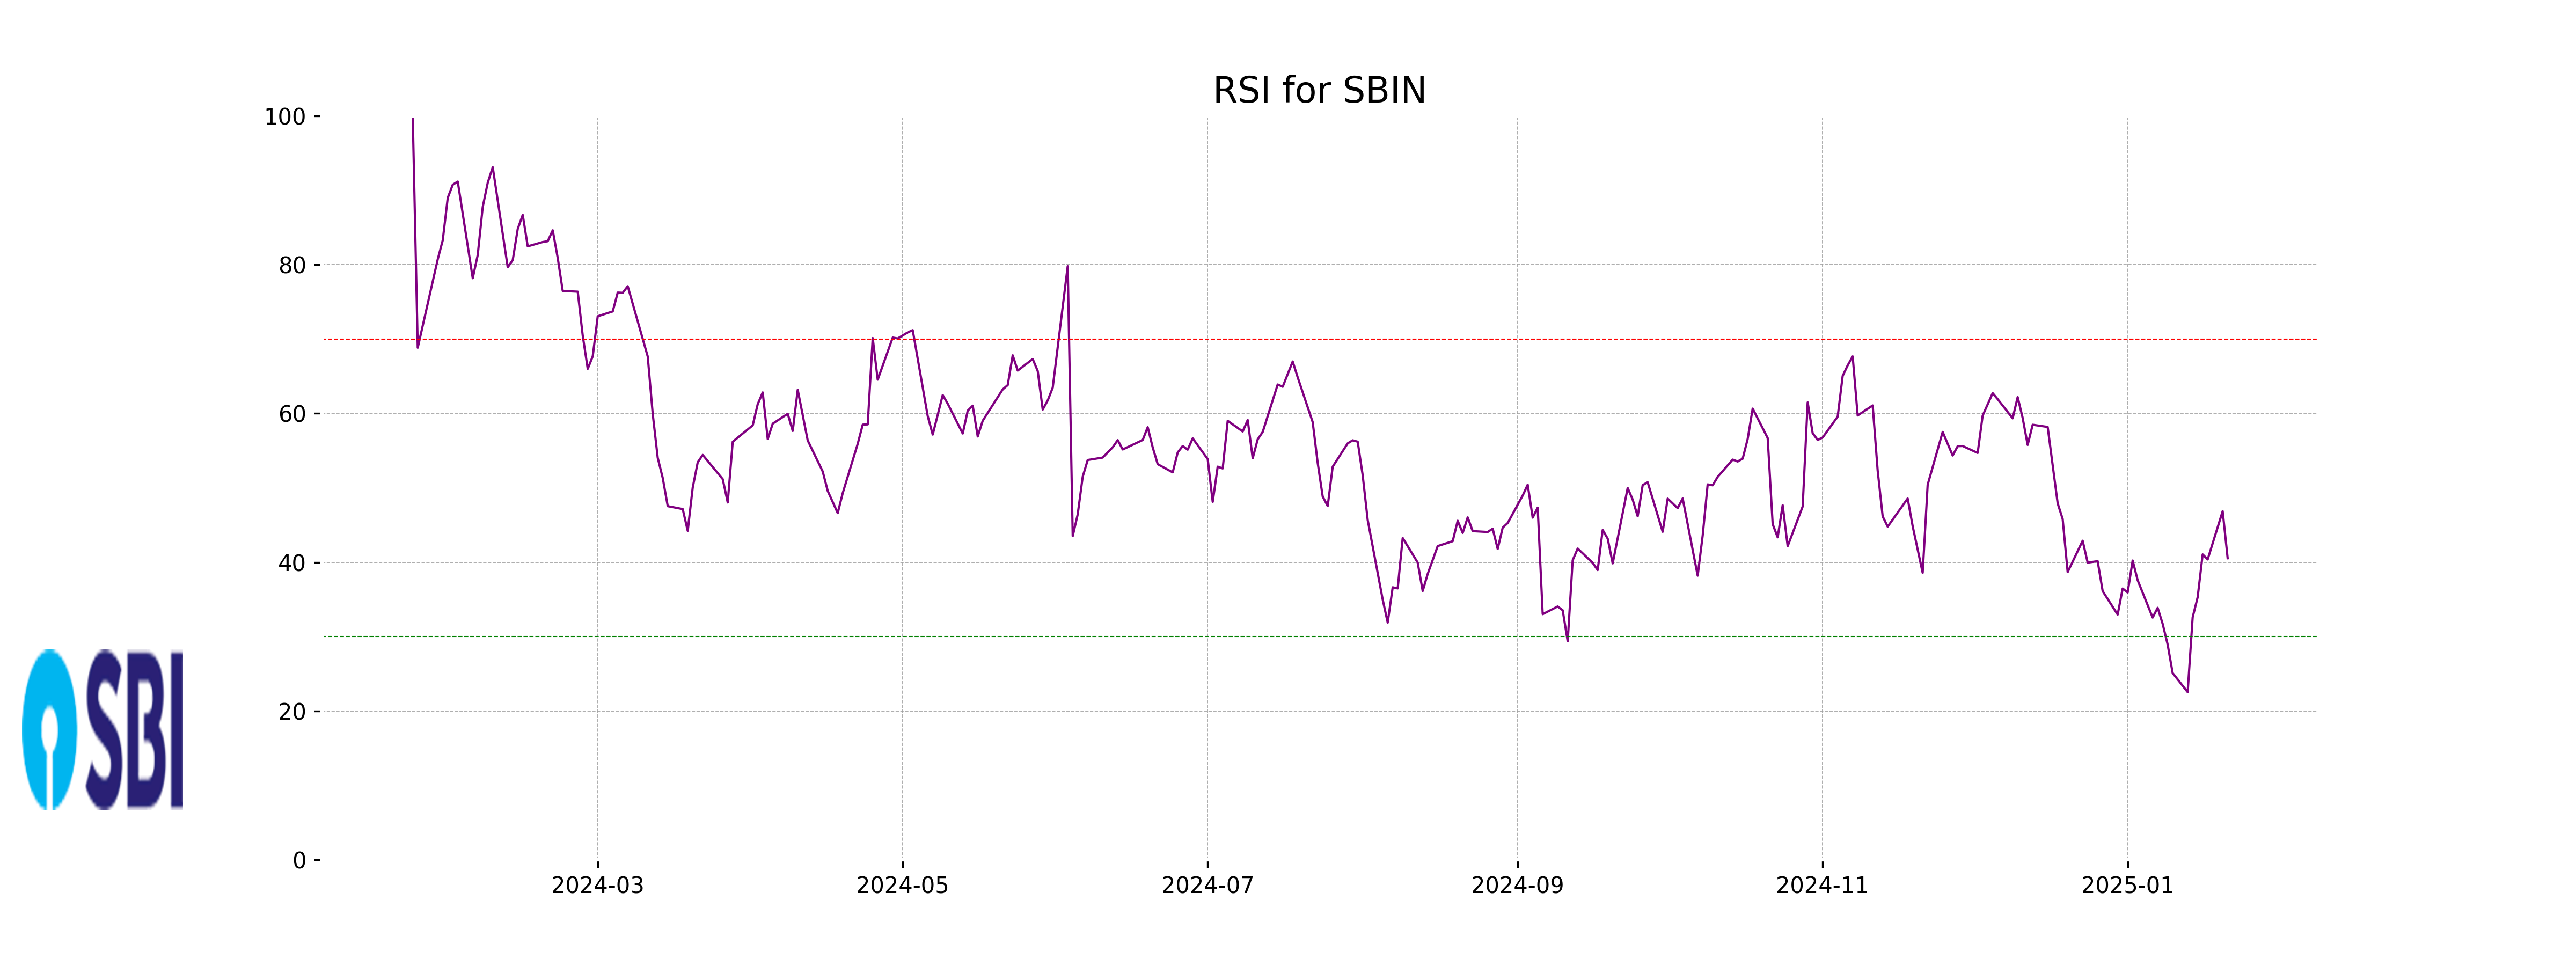
RSI (Relative Strength Index) Analysis:
The RSI for SBIN.NS stands at 774.90, which is substantially higher than the typical range of 0-100. This suggests a strong deviation from conventional values. This unusual reading needs careful consideration, as it's unusually high compared to standard market behavior. However, in a typical context, a value above 70 indicates an overbought condition, while below 30 suggests oversold.
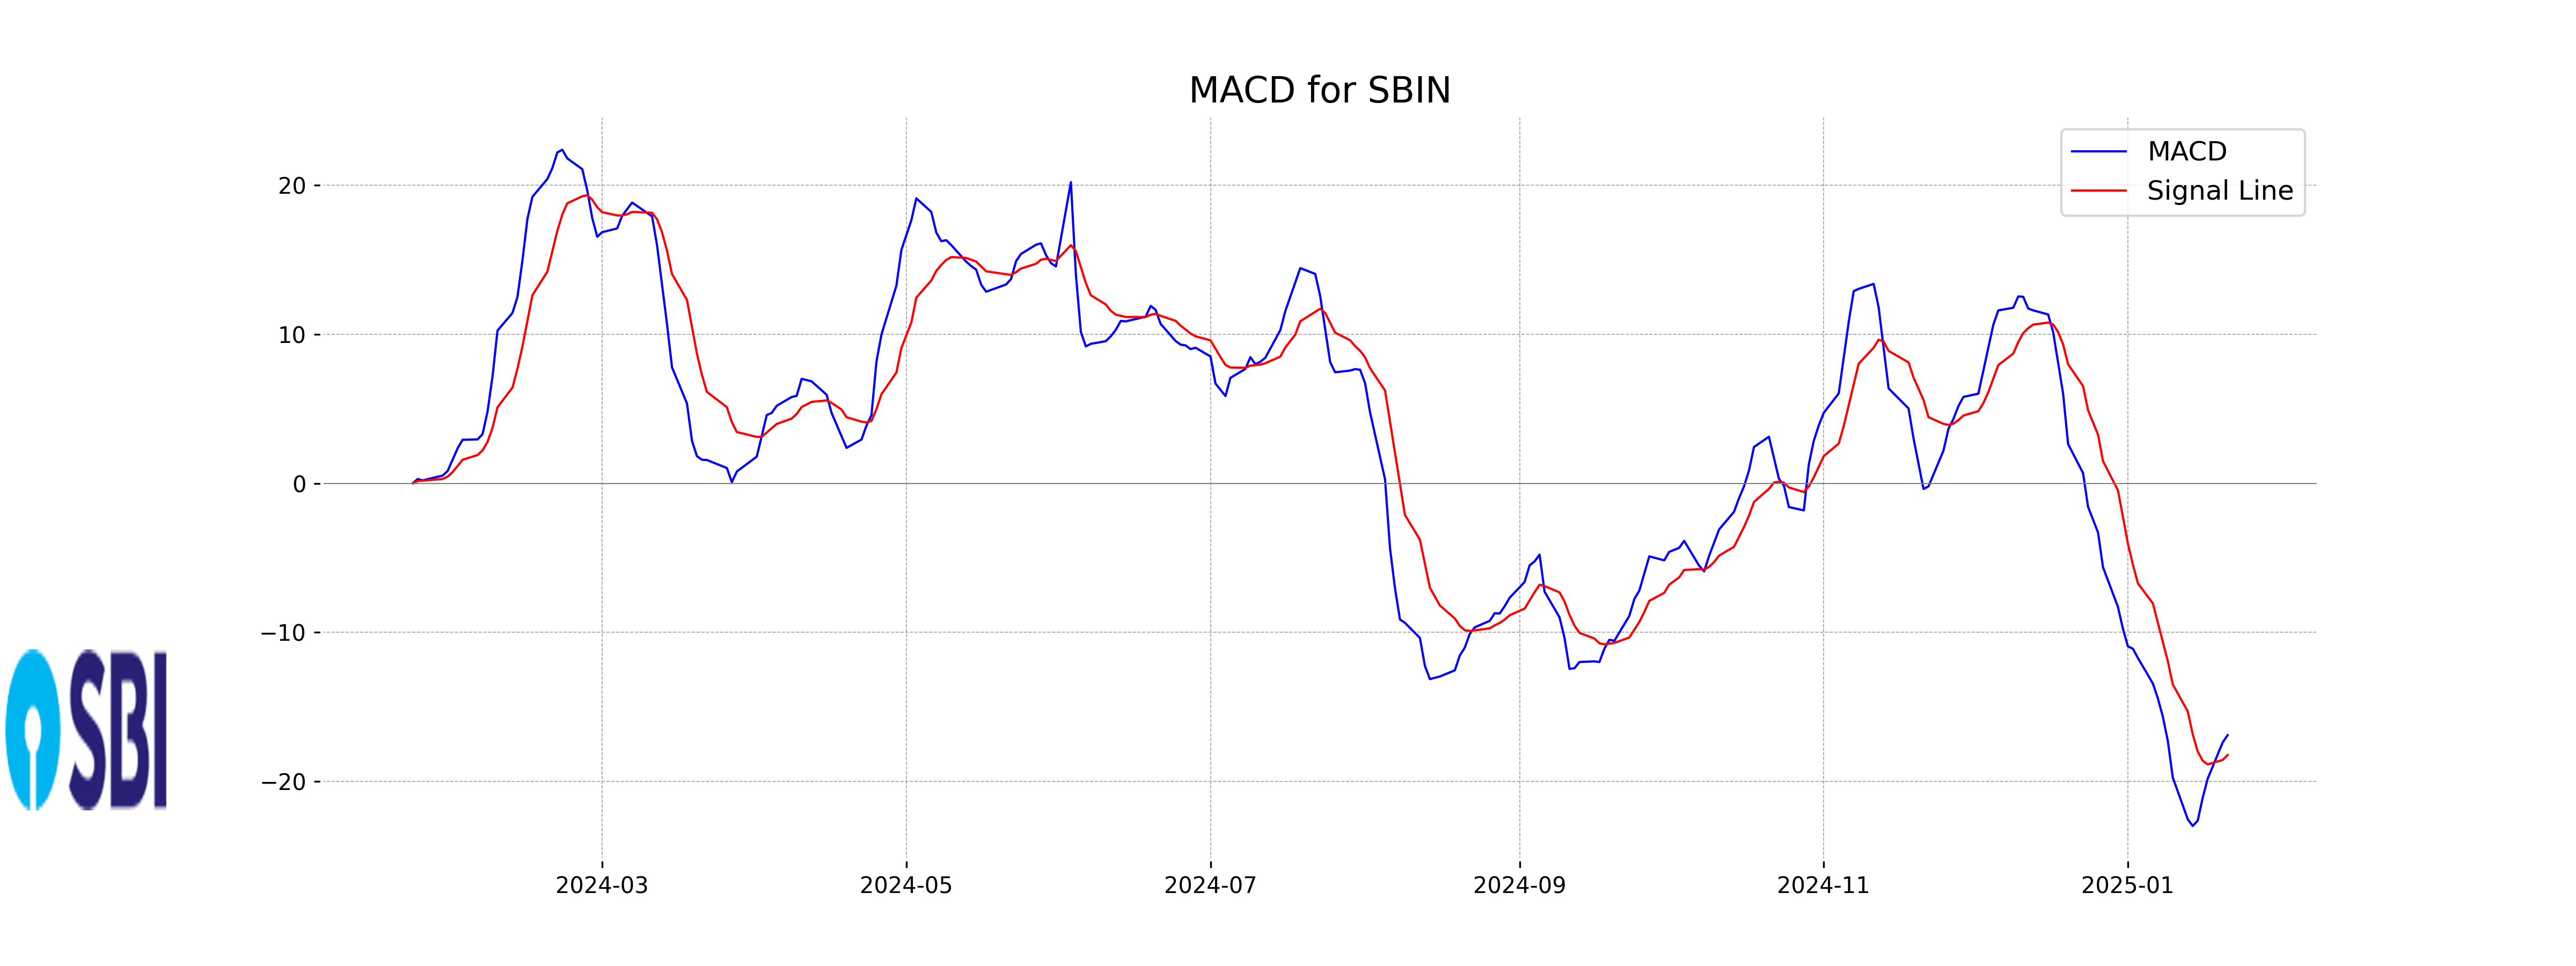
MACD (Moving Average Convergence Divergence) Analysis:
The MACD is at -12.35, with the signal line at -13.87. This positioning highlights a positive crossover, as the MACD is above the signal line. Such a crossover typically signals potential upward momentum or a bullish reversal in the stock's performance, suggesting a possible buying opportunity.
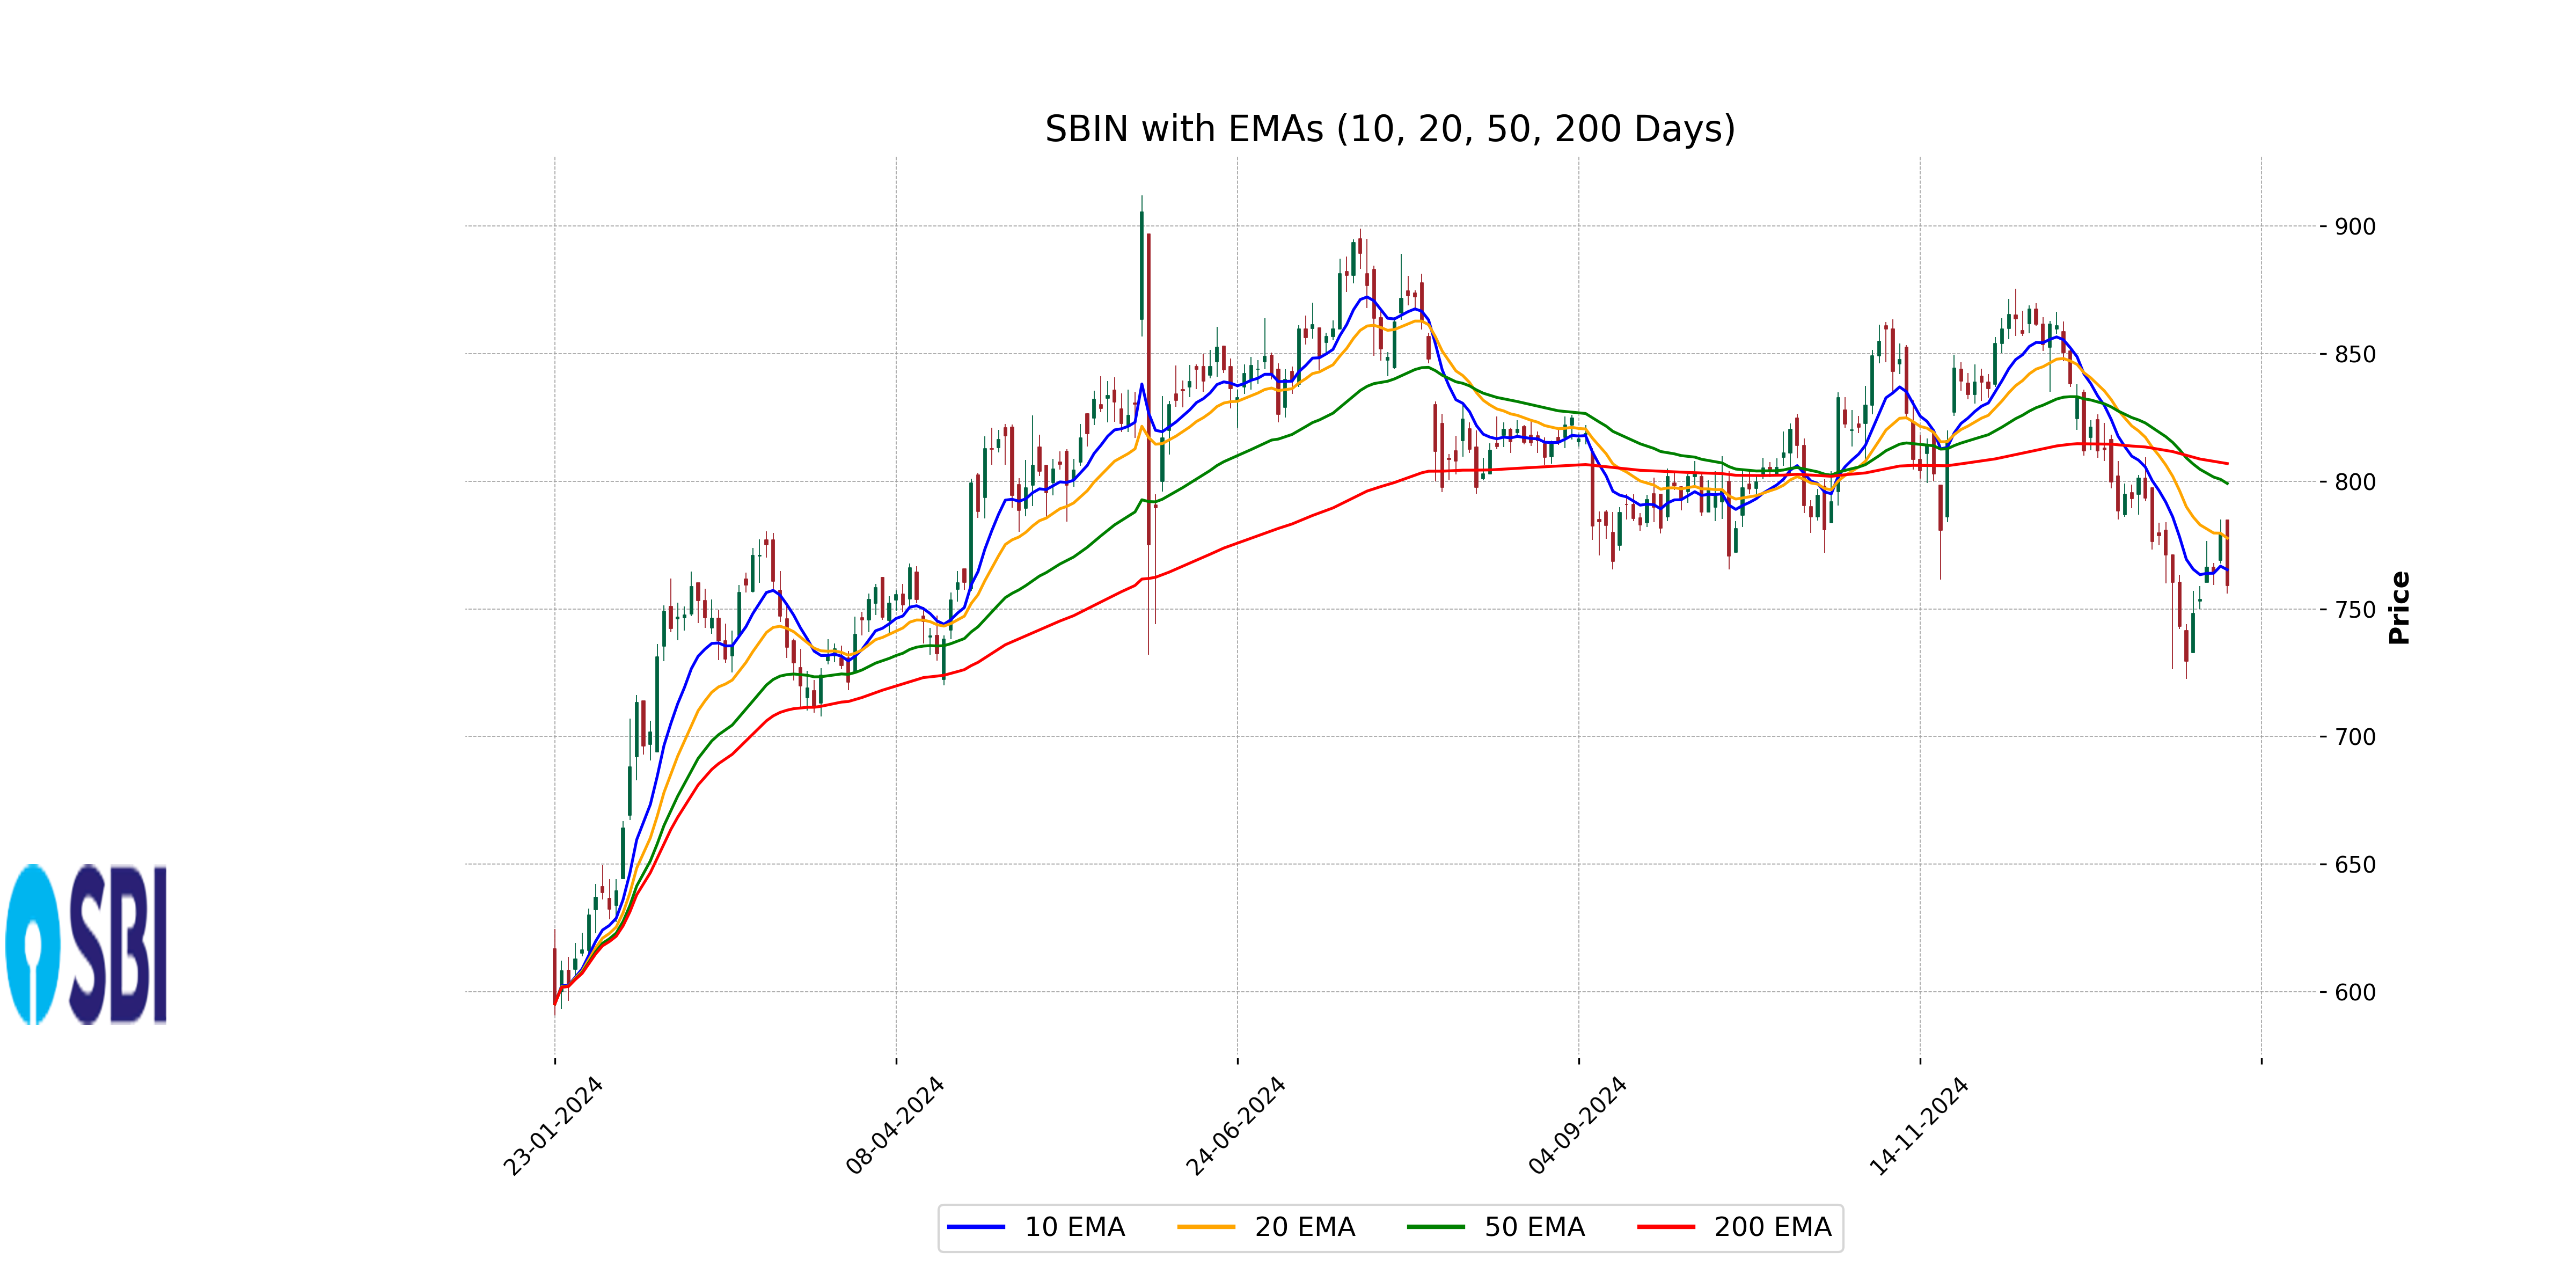
Relationship with Key Moving Averages:
SBIN.NS is trading below its 50-EMA of 798.09 and 20-EMA of 788.79, but above its 200-EMA of 765.18. The stock being below the short to mid-term EMAs suggests a bearish trend, reinforced by the negative percentage change and current price below these averages. However, trading above the 200-EMA may provide some hope of long-term support.
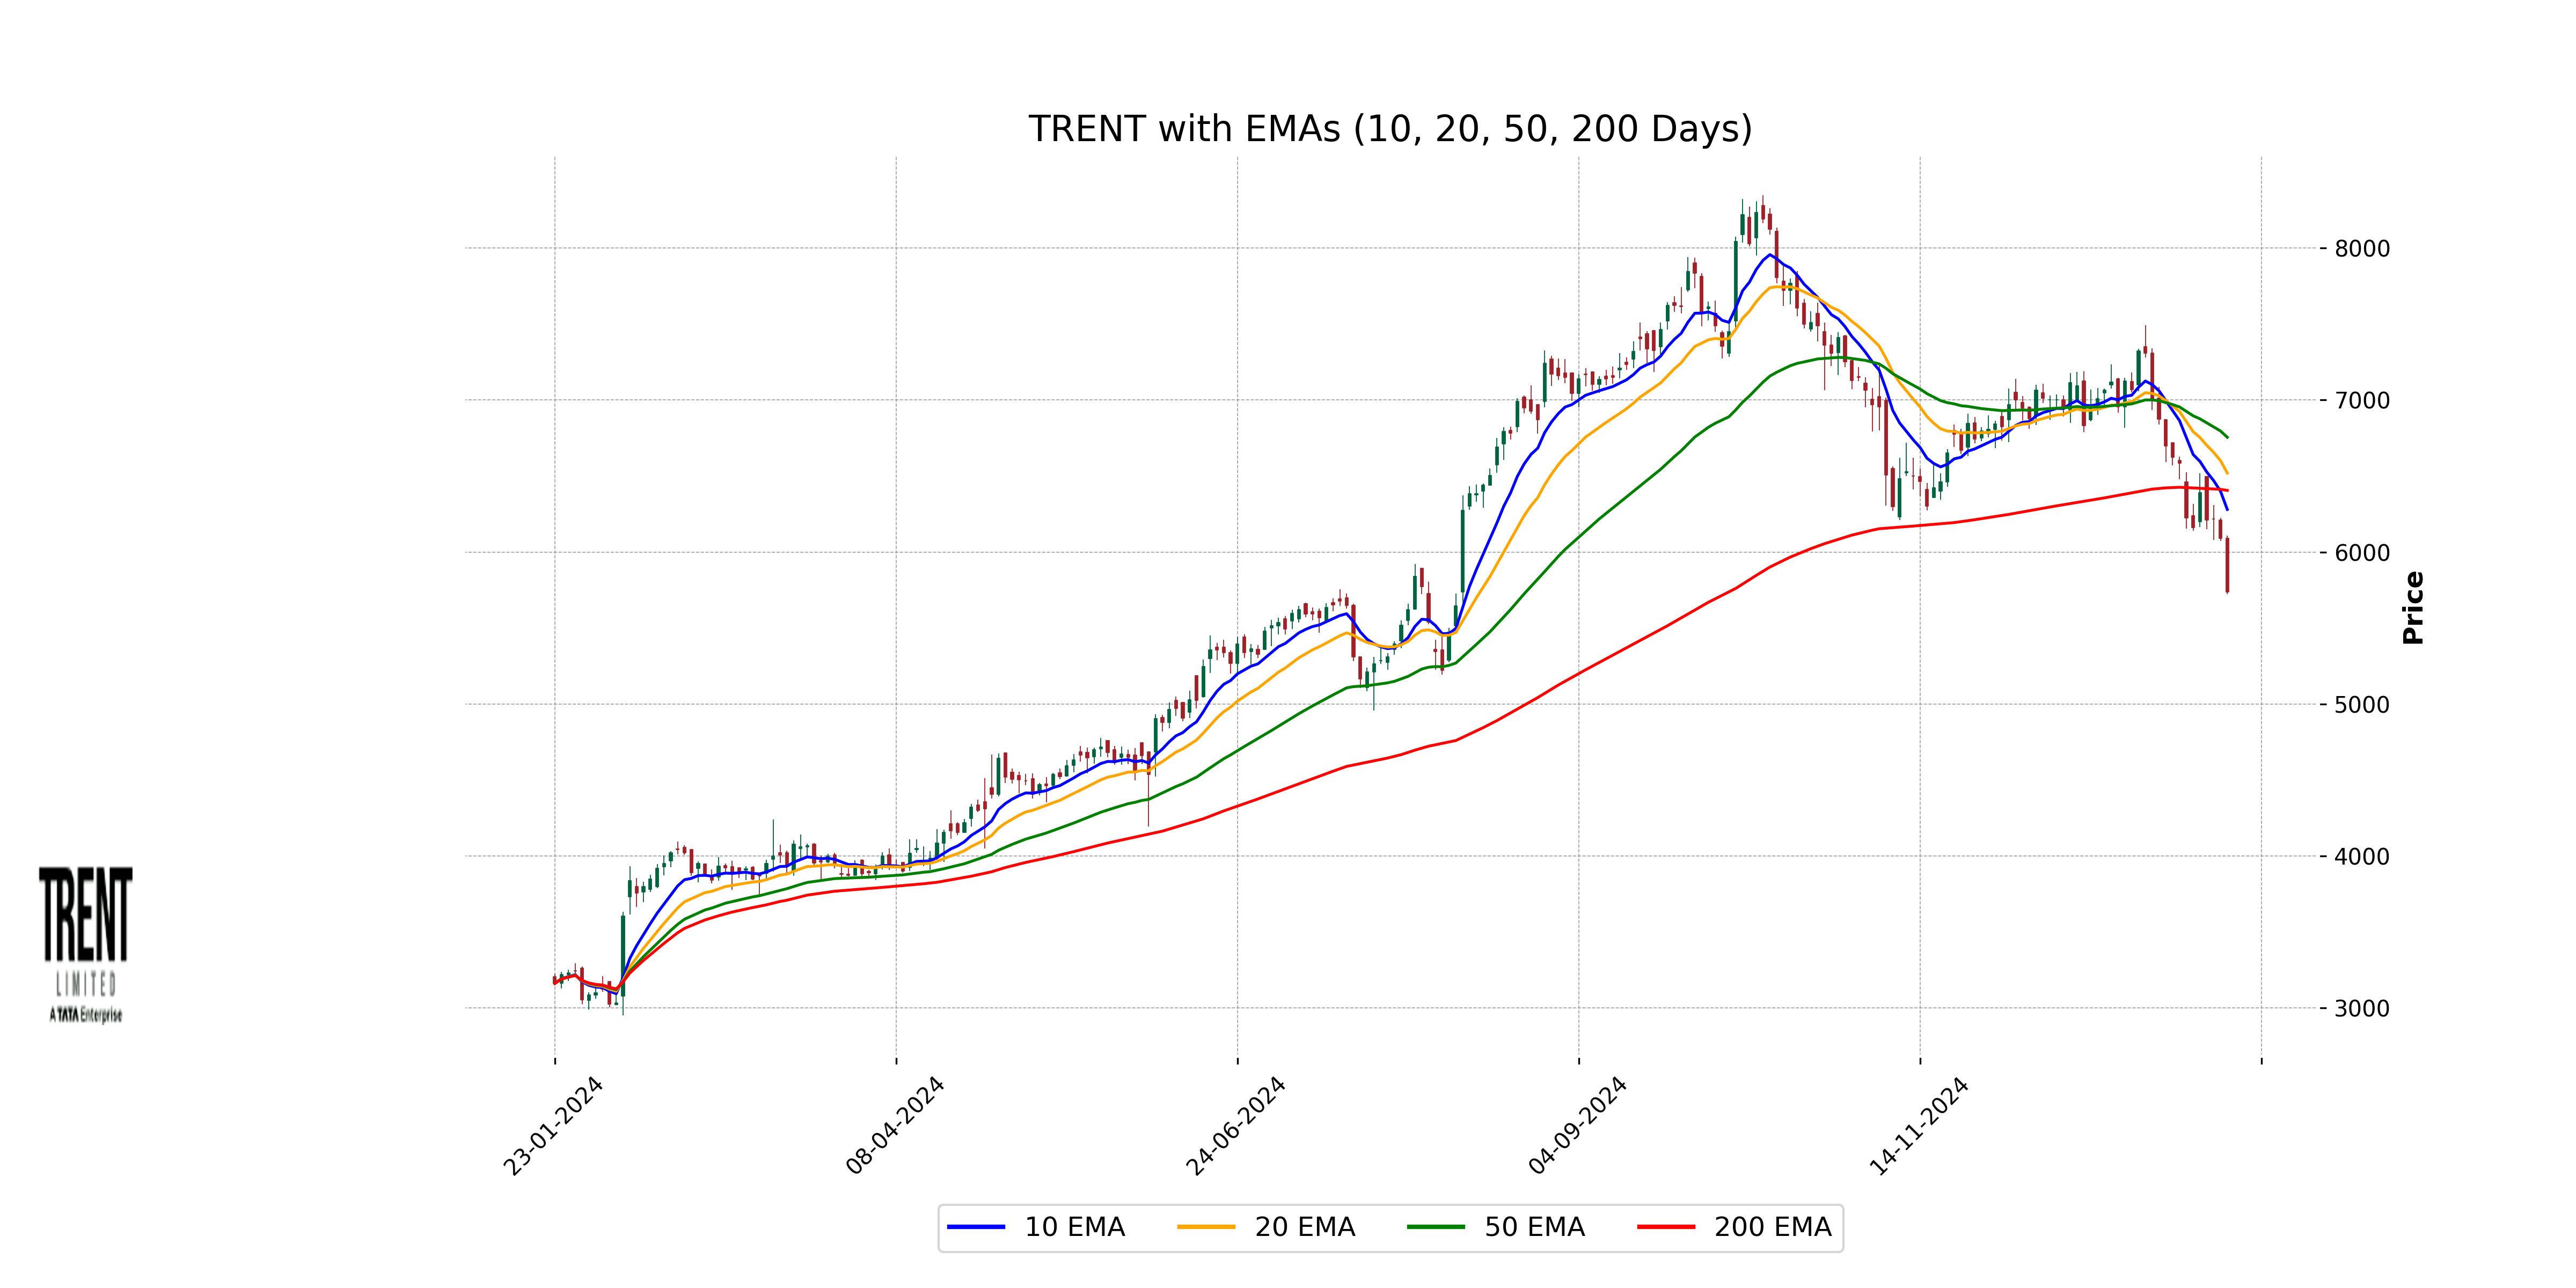
Stock Performance for January 21, 2025: TRENT.NS opened at 6090.60 and saw a high of 6109.00 and a low of 5723.30, closing at 5736.95. This represents a percent change of -5.80% and a points change of -353.05.
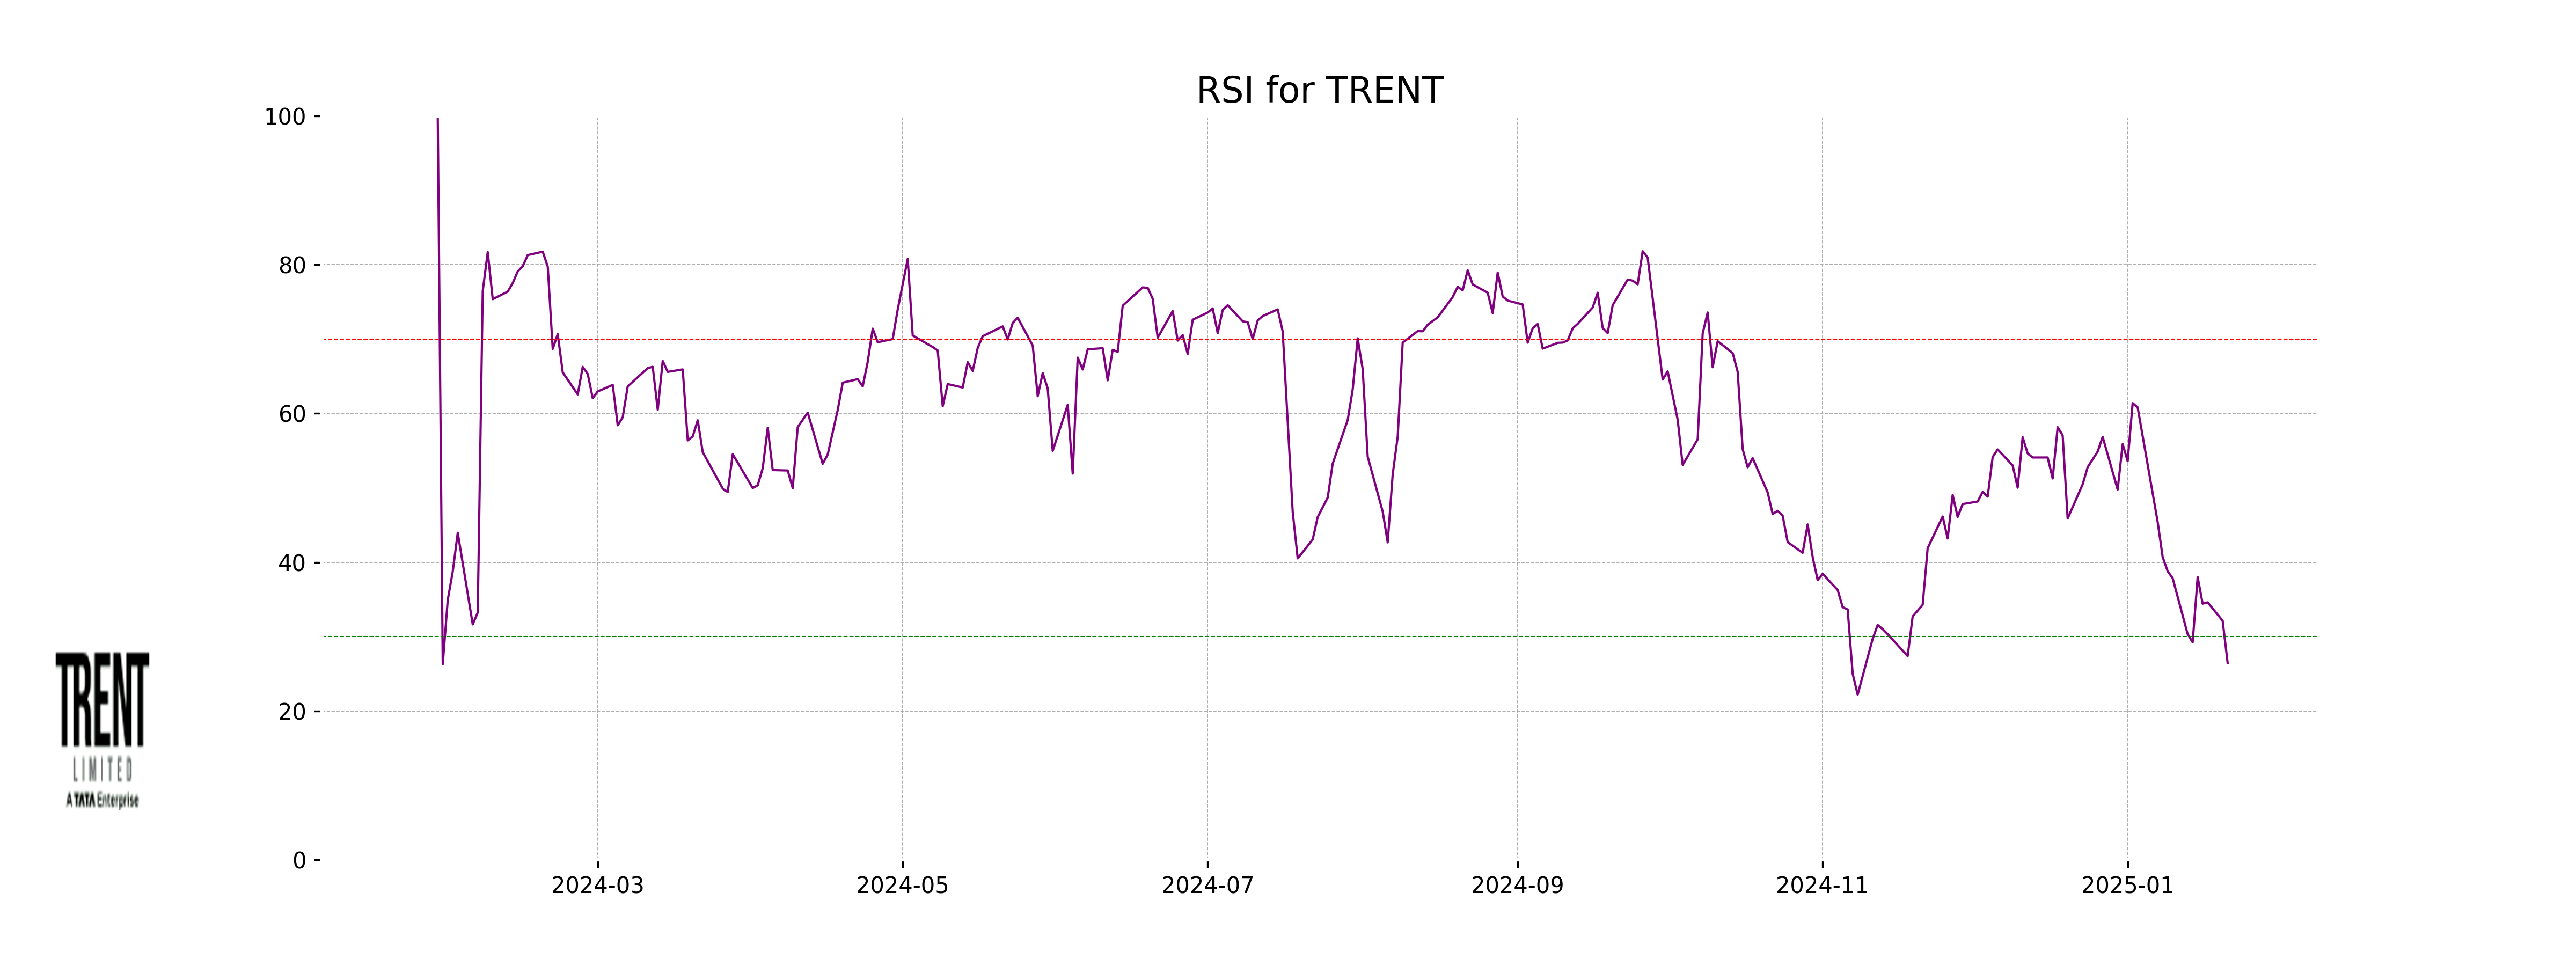
RSI Analysis: The RSI of TRENT.NS stands at 6504.65, which is highly unusual and likely a data entry error. Under typical circumstances, such an RSI value suggests that the calculation might need reevaluation, as typical RSI values range from 0 to 100, indicating overbought or oversold conditions.
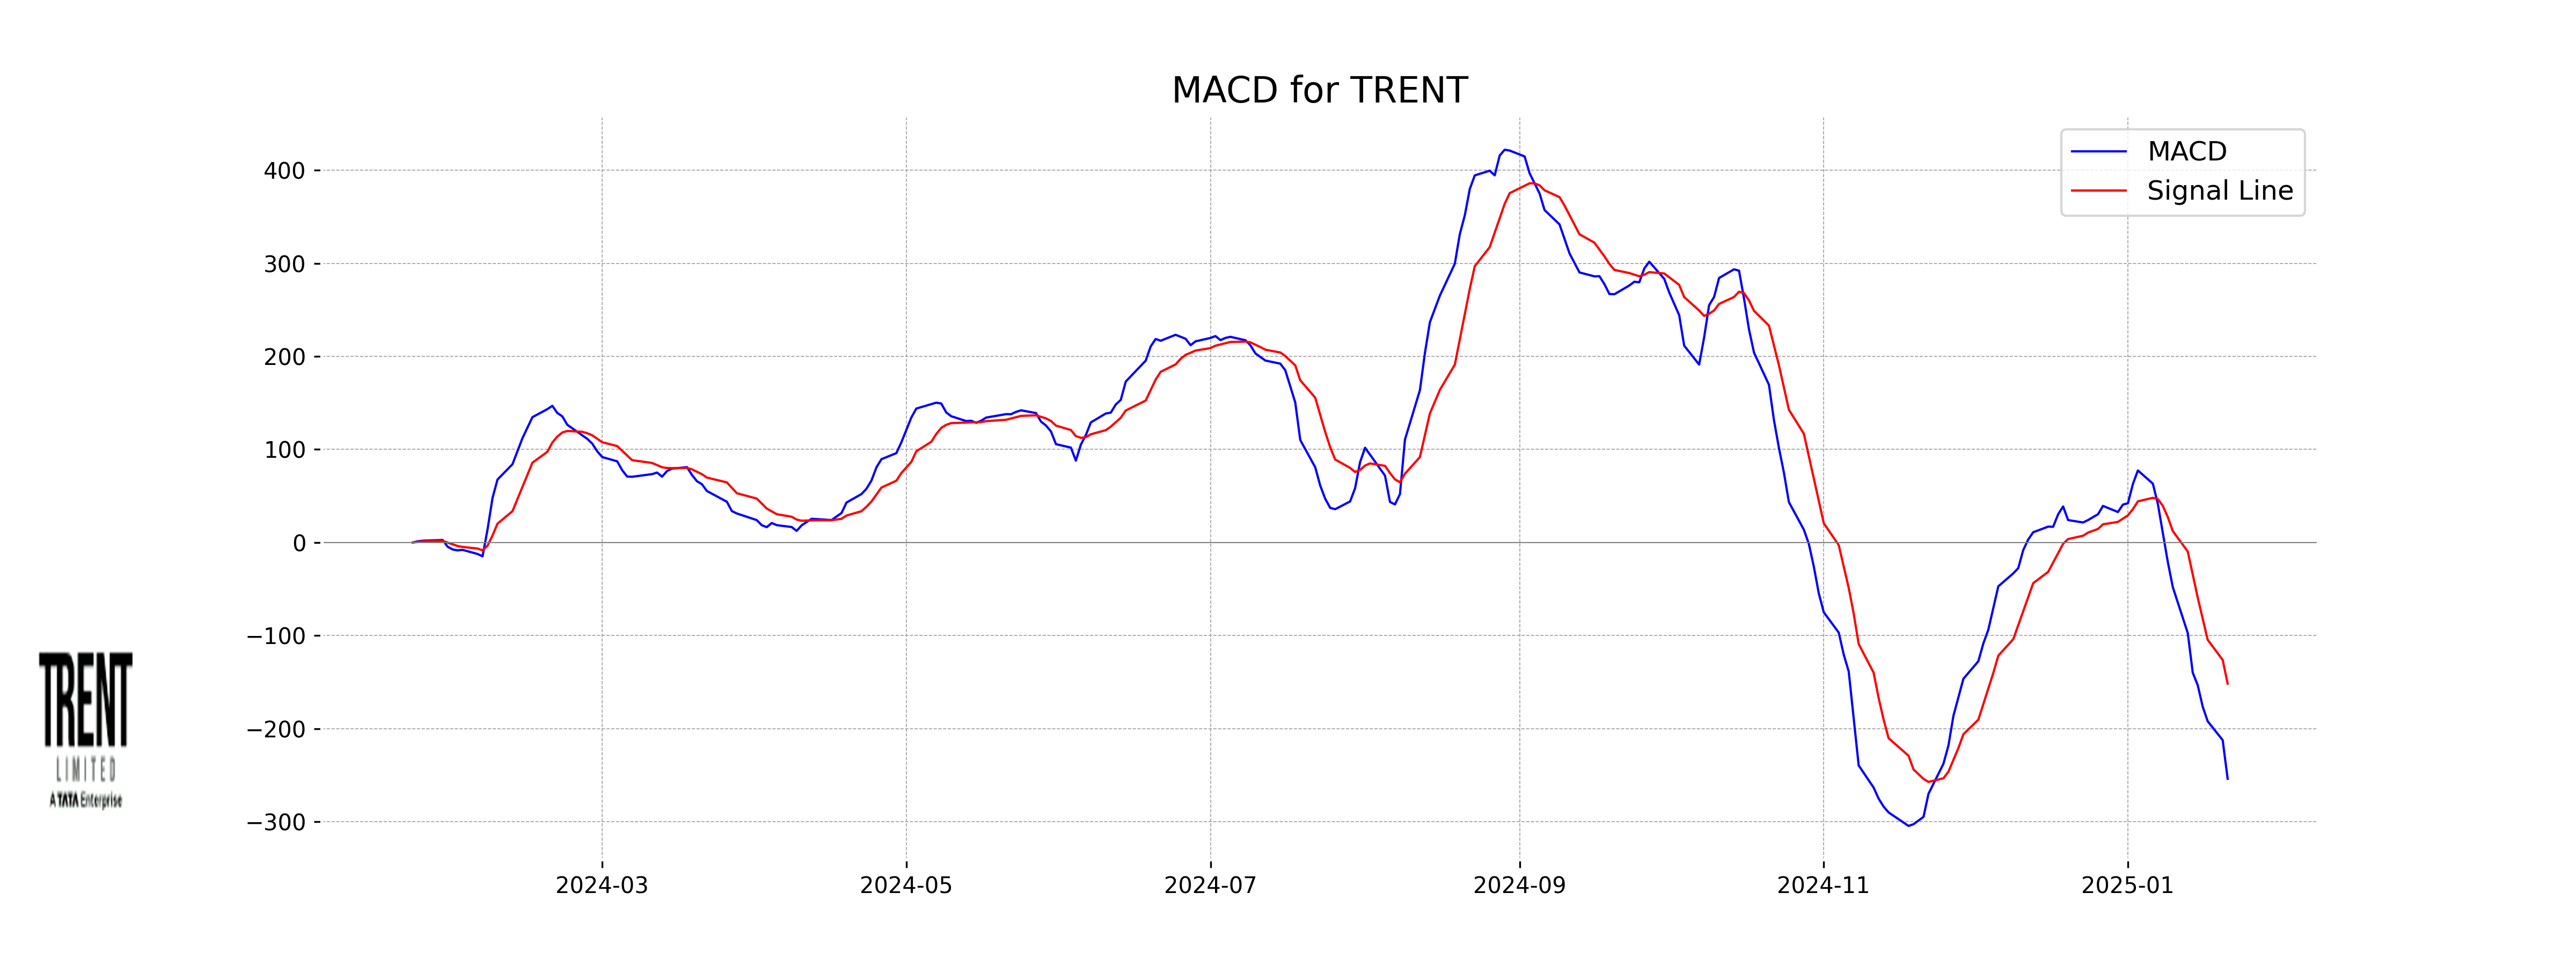
MACD Analysis: The MACD value is -229.38 with a signal line at -144.46. The negative MACD indicates a bearish trend, and its position below the signal line confirms this momentum. If the MACD were to cross above the signal line, it could suggest a potential shift to bullish momentum.
Moving Averages Relationship: With the current price at 5736.95, TRENT.NS trades below its 10-EMA (24.43), 20-EMA (6681.79), 50-EMA (6767.38), and 200-EMA (6278.86). This positioning indicates a bearish trend, as the stock price is below all significant moving averages, reflecting sustained downward pressure.
Up Next

NSE Nifty 50 Top losers: What are the 5 Biggest Stock losers Today January 21, 2025

India, New Zealand conclude FTA talks; pact to offer duty-free access, USD 20 bn FDI

FTA with New Zealand to significantly deepen bilateral economic engagement: Govt

Rupee breaches 91-mark against US dollar for first time in intra-day trade

Microsoft commits USD 17.5 billion investment in India: CEO Satya Nadella

CBI books Anil Ambani's son, Reliance Home Finance Ltd. in Rs 228 crore bank fraud case

More videos

RBI raises FY26 GDP growth projection to 7.3 pc

RBI trims policy interest rate by 25bps to 5.25pc, loans to get cheaper

Rupee slumps to all-time low of 90.25 against US dollar in intra-day trade

Reliance completes merger of Star Television Productions with Jiostar

India to lead emerging market growth with 7pc GDP rise in 2025: Moody’s

Nifty hits record high after 14 months; Sensex nears all-time peak

Reliance stops Russian oil use at its only-for-export refinery to comply with EU sanctions

ED attaches fresh assets worth over Rs 1,400 cr in case against Anil Ambani's Reliance Group

India signs one-year deal to import 2.2 million tonnes of LPG from US

India International Trade Fair begins at Pragati Maidan amid tight security