


Highlights
- Bajaj Auto shows mixed signals despite price dip
- HCL Tech, Hindalco indicate short-term bearish pressure
- Shriram Finance, Tech Mahindra signal cautious momentum
Latest news

Gujarat AAP MLA Chaitar Vasava announces Aravalli protection convention on December 23

New Zealand commits USD 20 bn investment in India under FTA in 15 yrs; on lines of EFTA pact

Bihar CM Nitish Kumar, Dy CM Samrat Choudhary call on PM Modi in Delhi

Union Home Minister Amit Shah meets Bihar CM Nitish Kumar in Delhi

National Herald case: Delhi HC seeks Gandhis' reply on ED plea against trial court order

Delhi: Over 2.12 lakh PUC certificates issued in four days as GRAP-IV enforcement intensifies

Assam on high alert in view of fresh unrest in Bangaldesh: Himanta

Oppo Reno 15 Pro Mini First Look & Hands-On: Small Phone, Big Intentions
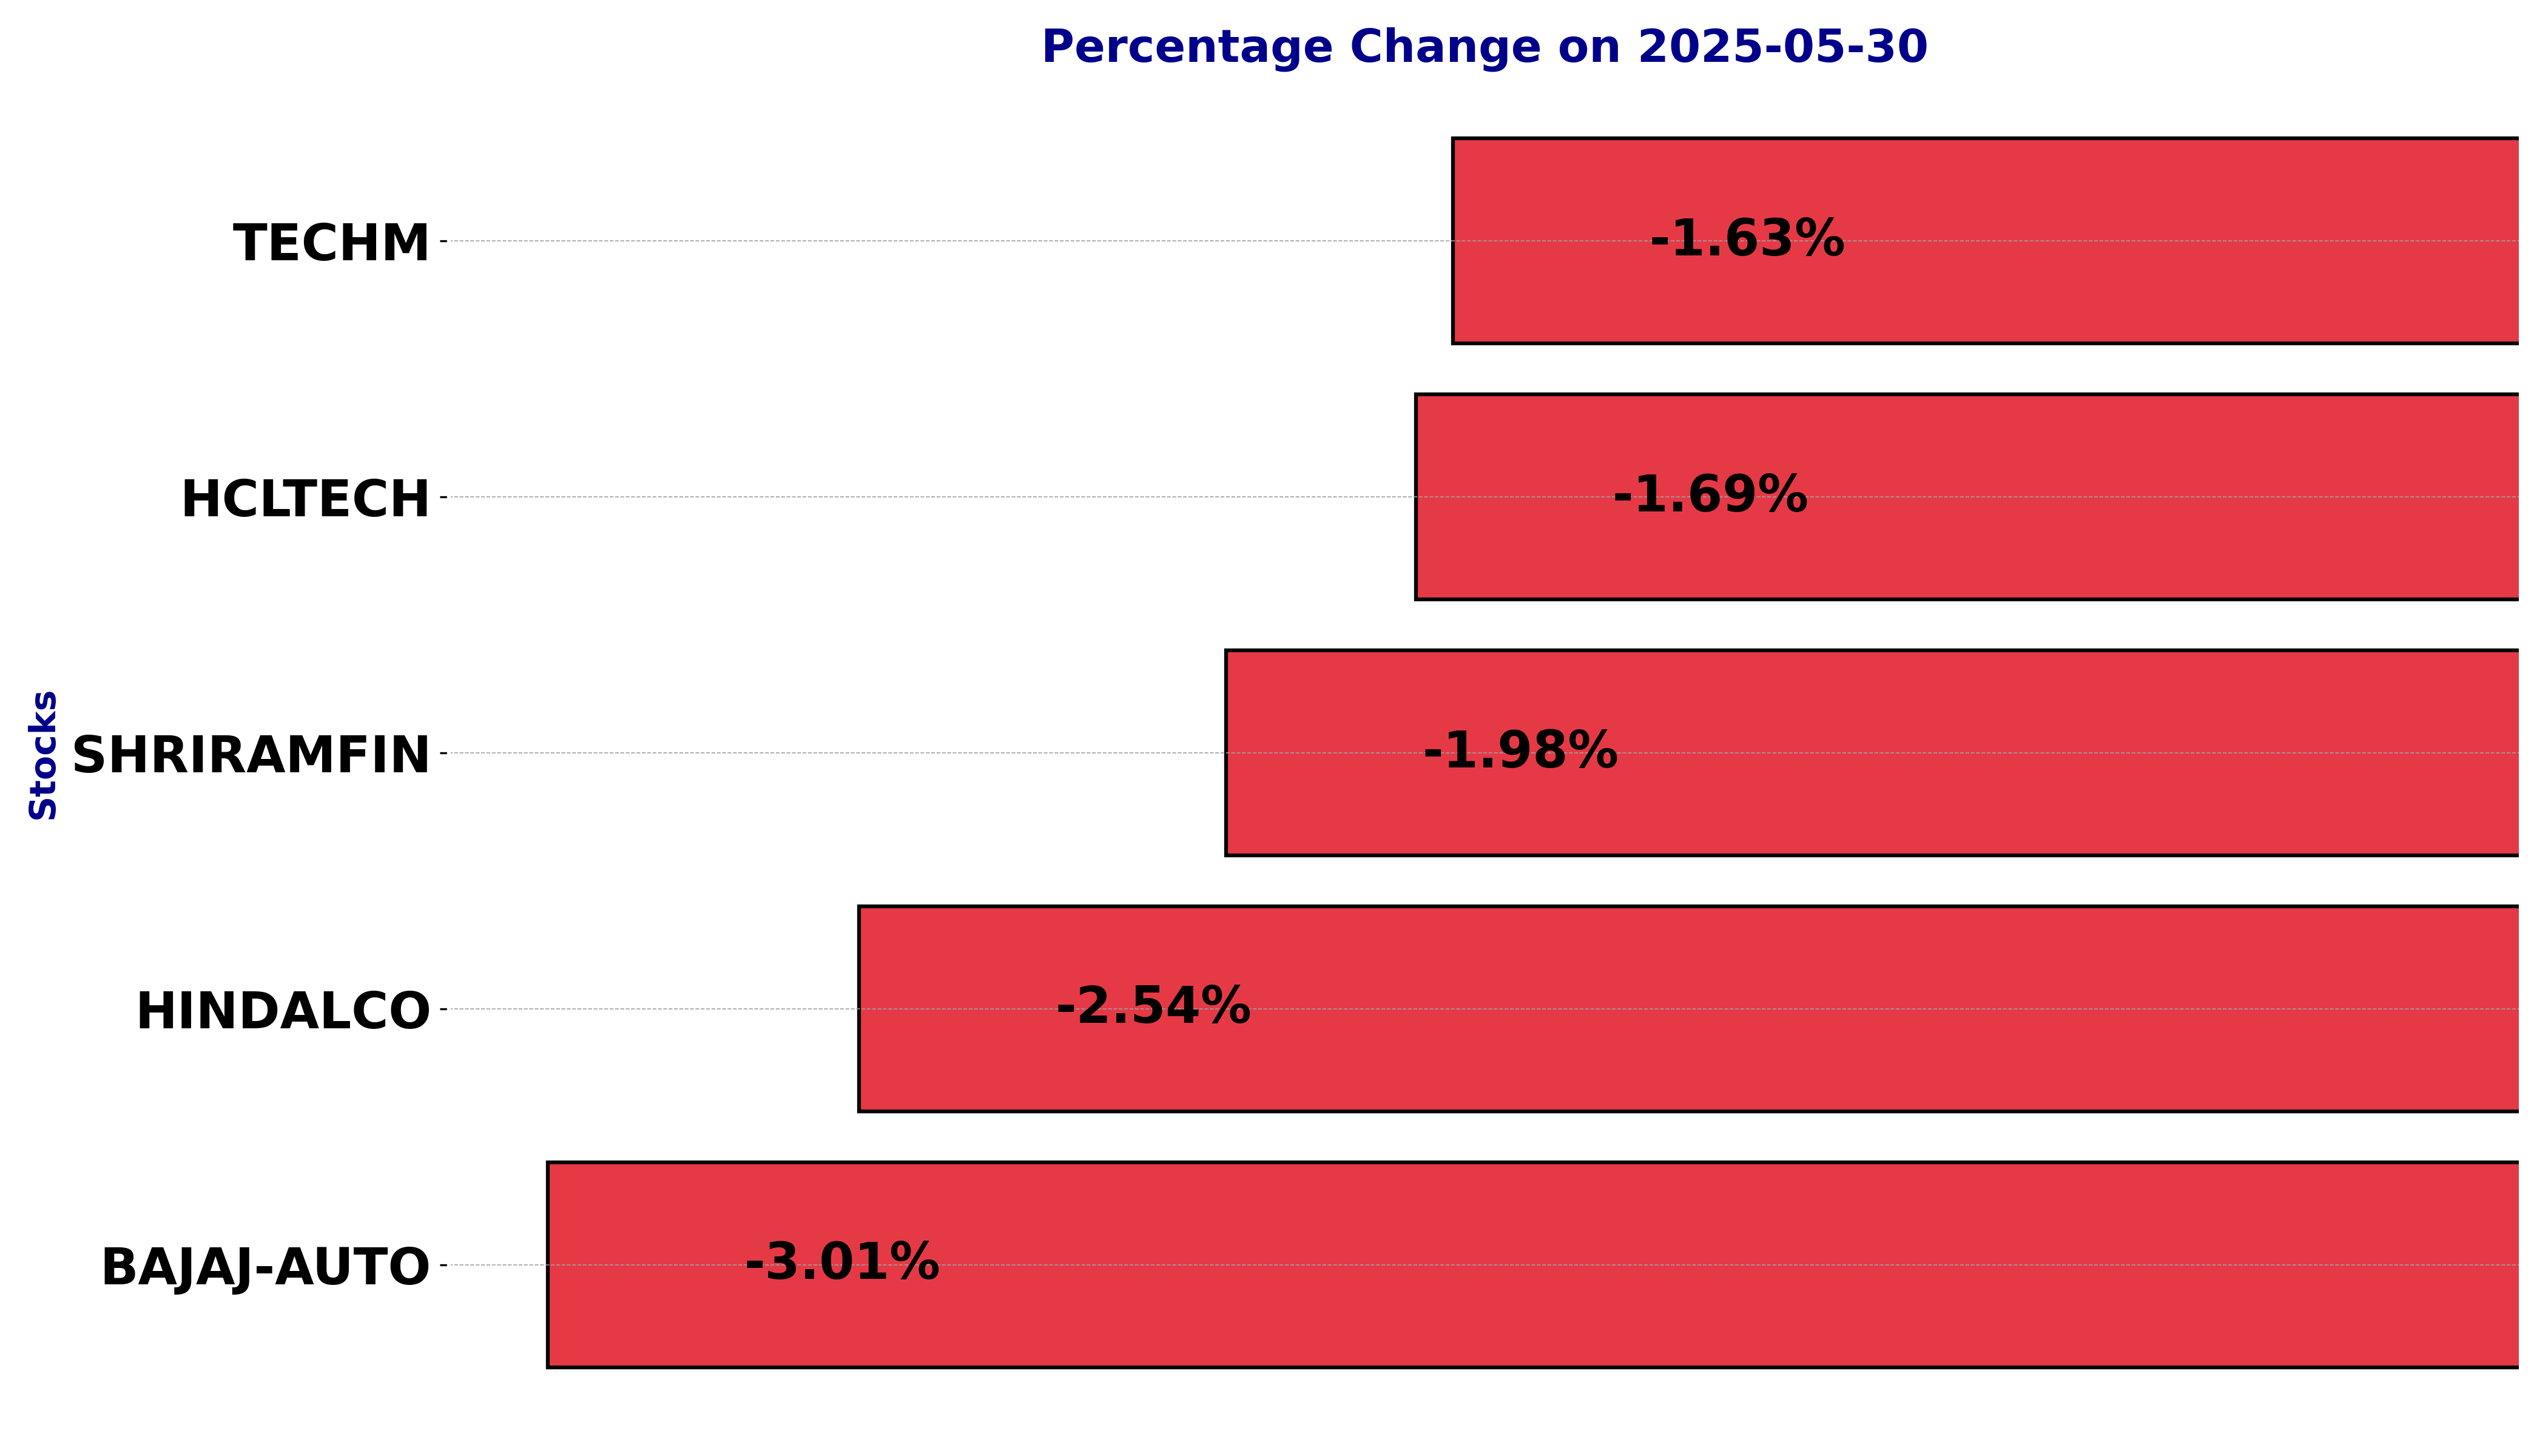
NSE Nifty 50: Top 5 stock losers of May 30, 2025


In this article, we will explore the technical indicators of some of the low-performing stocks on the Indian stock market, including BAJAJ-AUTO, HCLTECH, HINDALCO, SHRIRAMFIN, and TECHM.
By looking at these stocks through the lens of key technical factors, we aim to better understand their price movements, trends, and potential future performance.
Analysis for Bajaj Auto - May 30, 2025
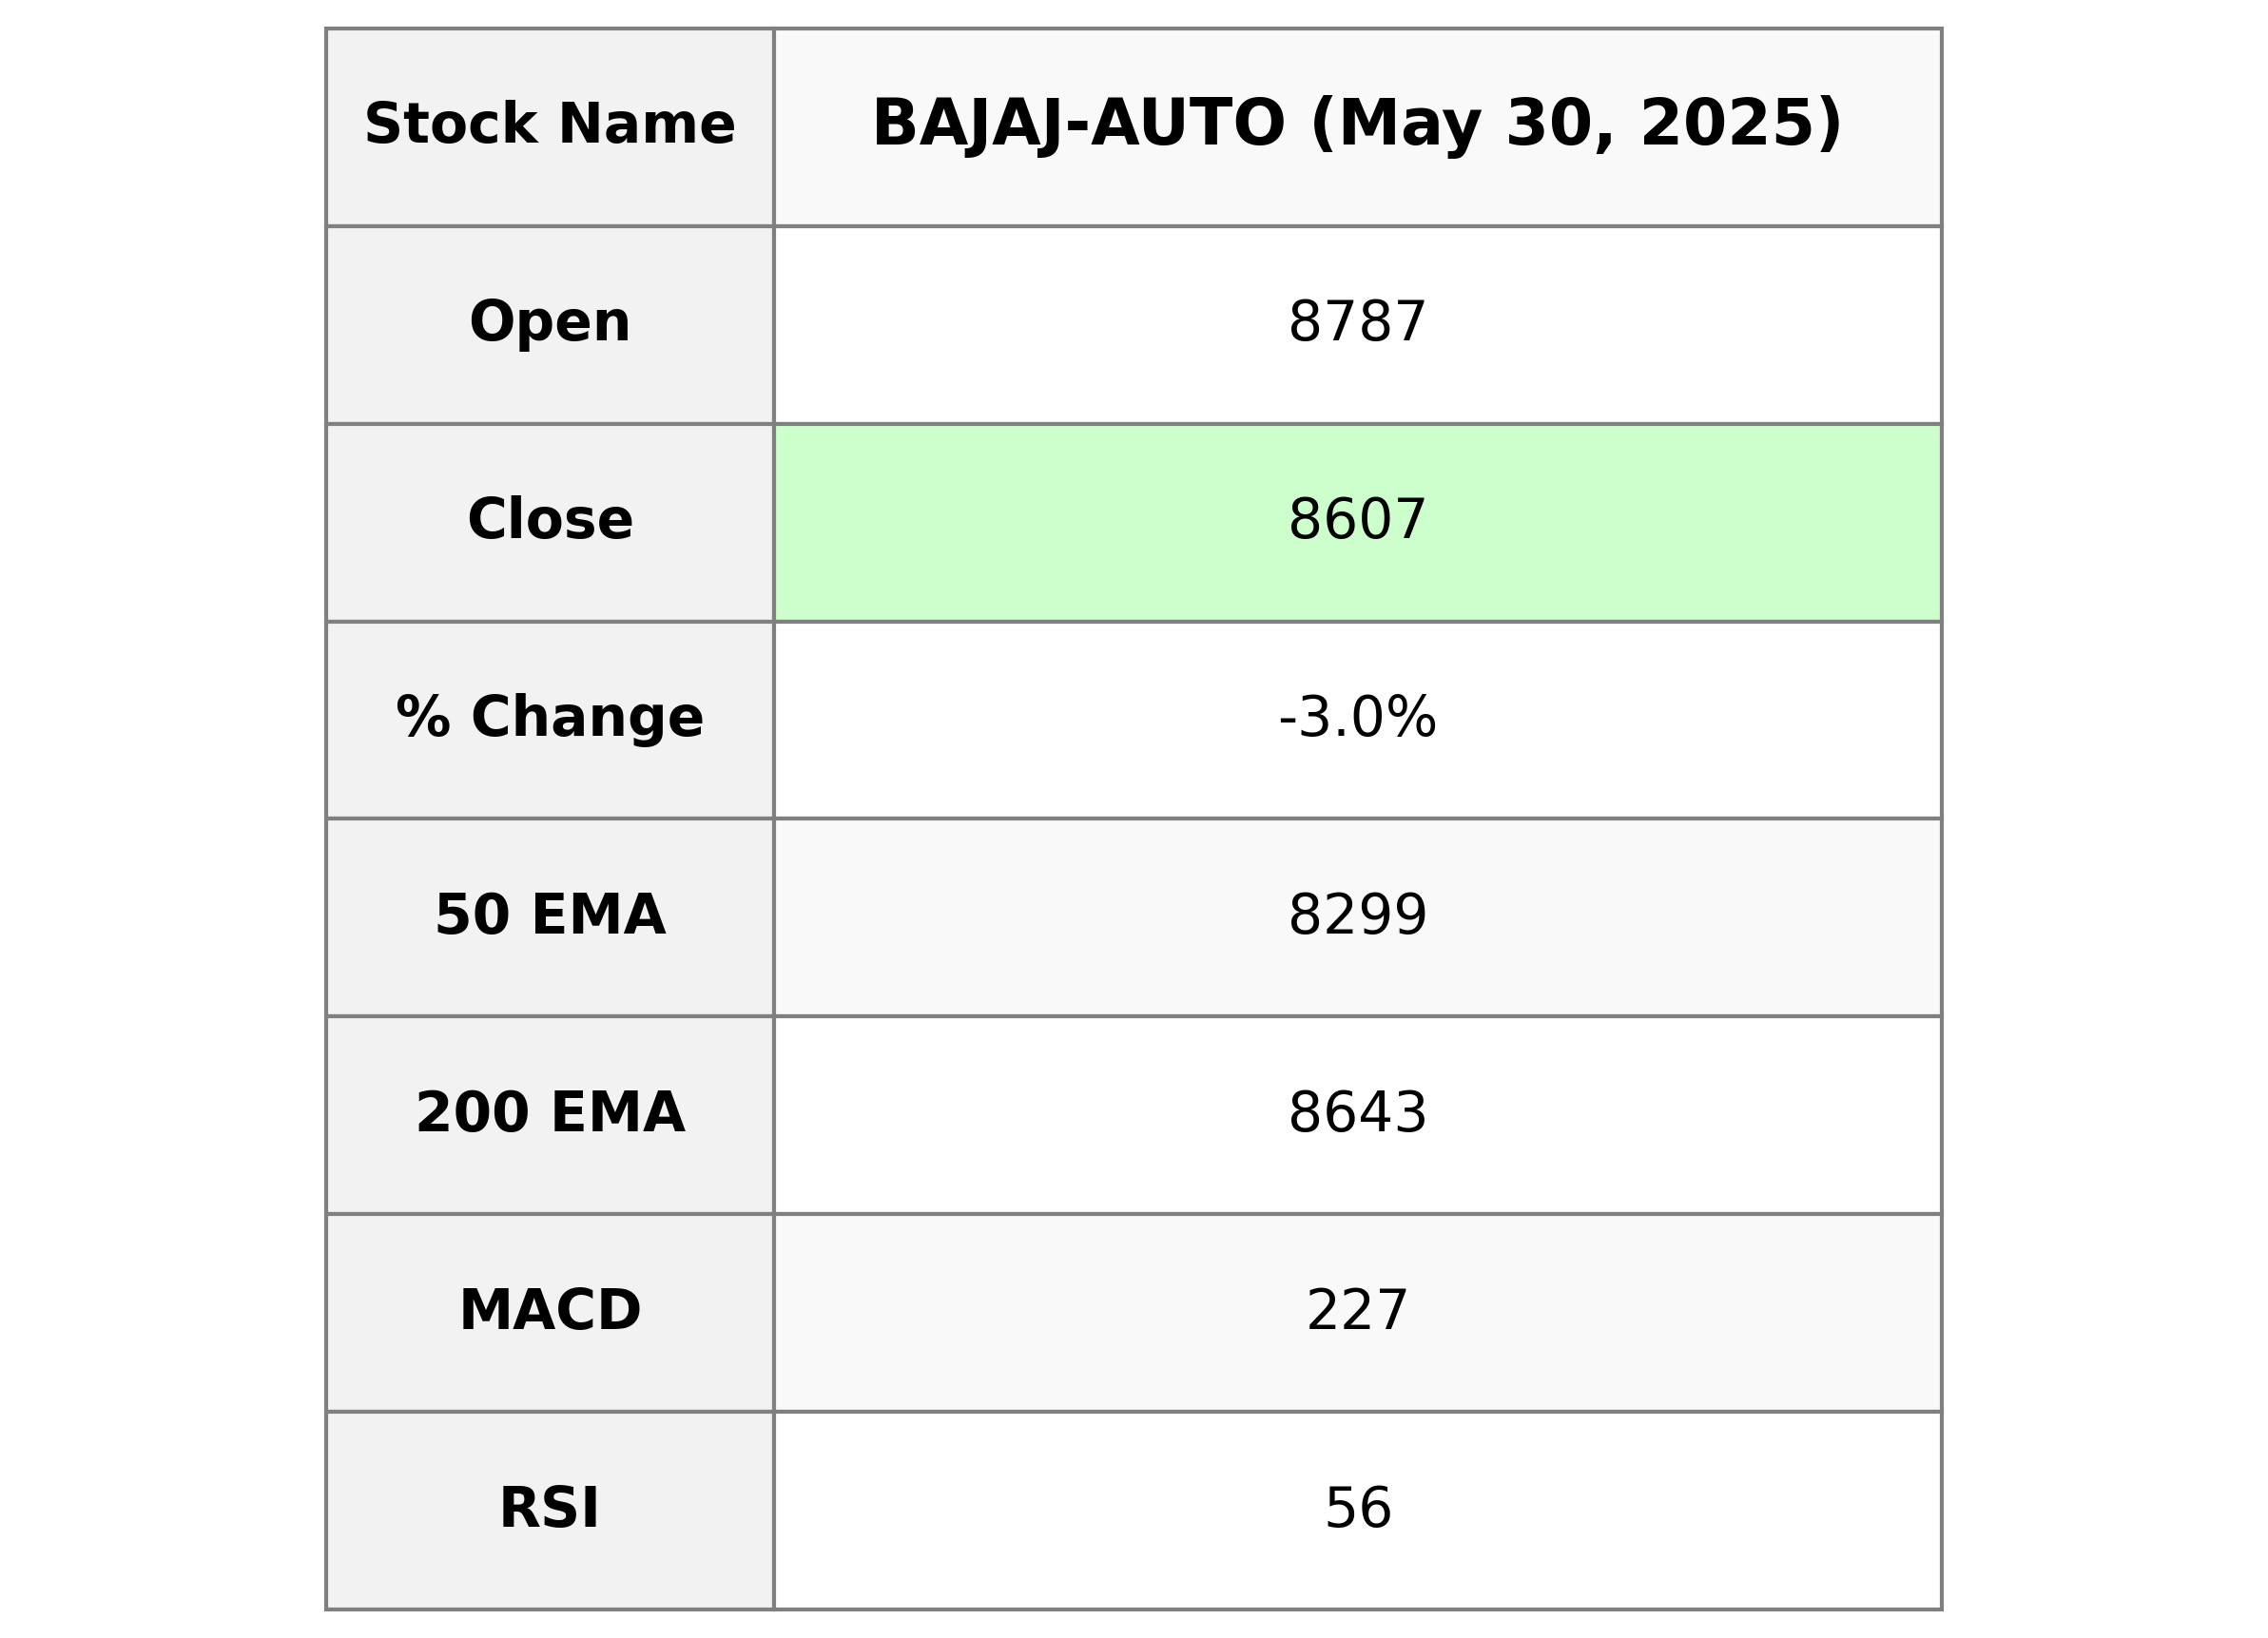
Bajaj Auto posted a decline with a 3.01% decrease from its previous close, settling at 8607.0. Despite this dip, the stock maintains an upward trend over its 50-day EMA at 8298.74. As a strong player in the Consumer Cyclical sector, the company holds a significant market cap of ₹2.40 trillion.
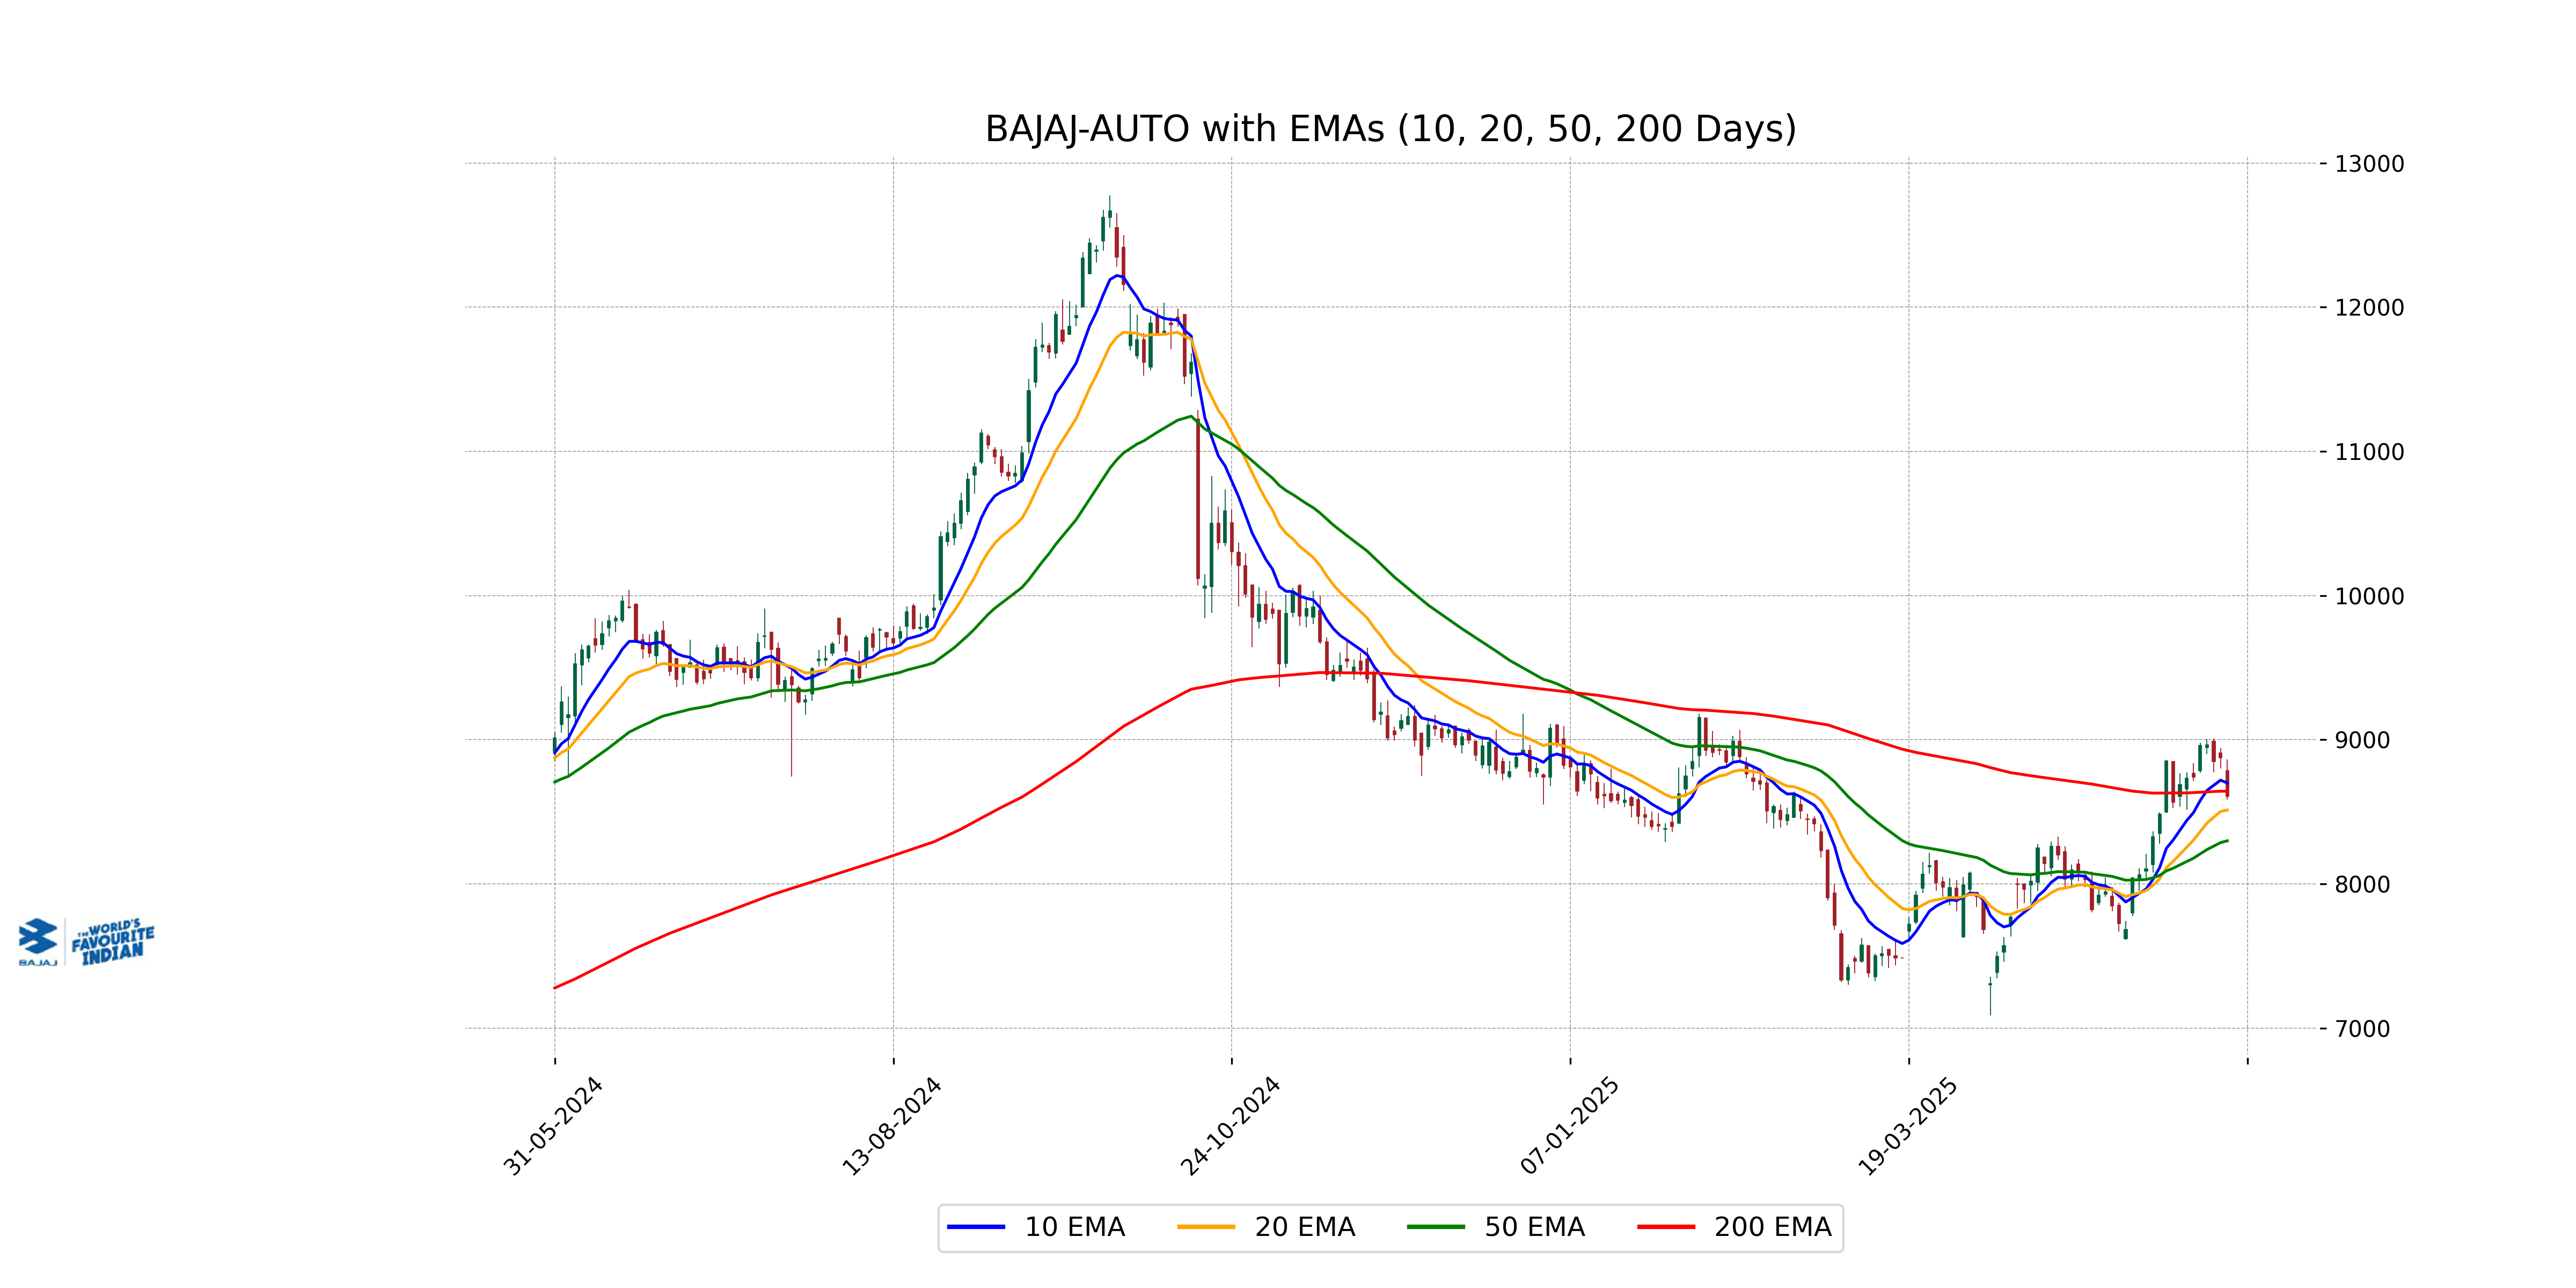
Relationship with Key Moving Averages
The closing price of Bajaj Auto is 8607.0, which is below the 200 EMA at 8642.71 but above the 50 EMA at 8298.74. It is also below the 10 EMA at 8699.02 but above the 20 EMA at 8512.30. This indicates mixed short-term and long-term trends.
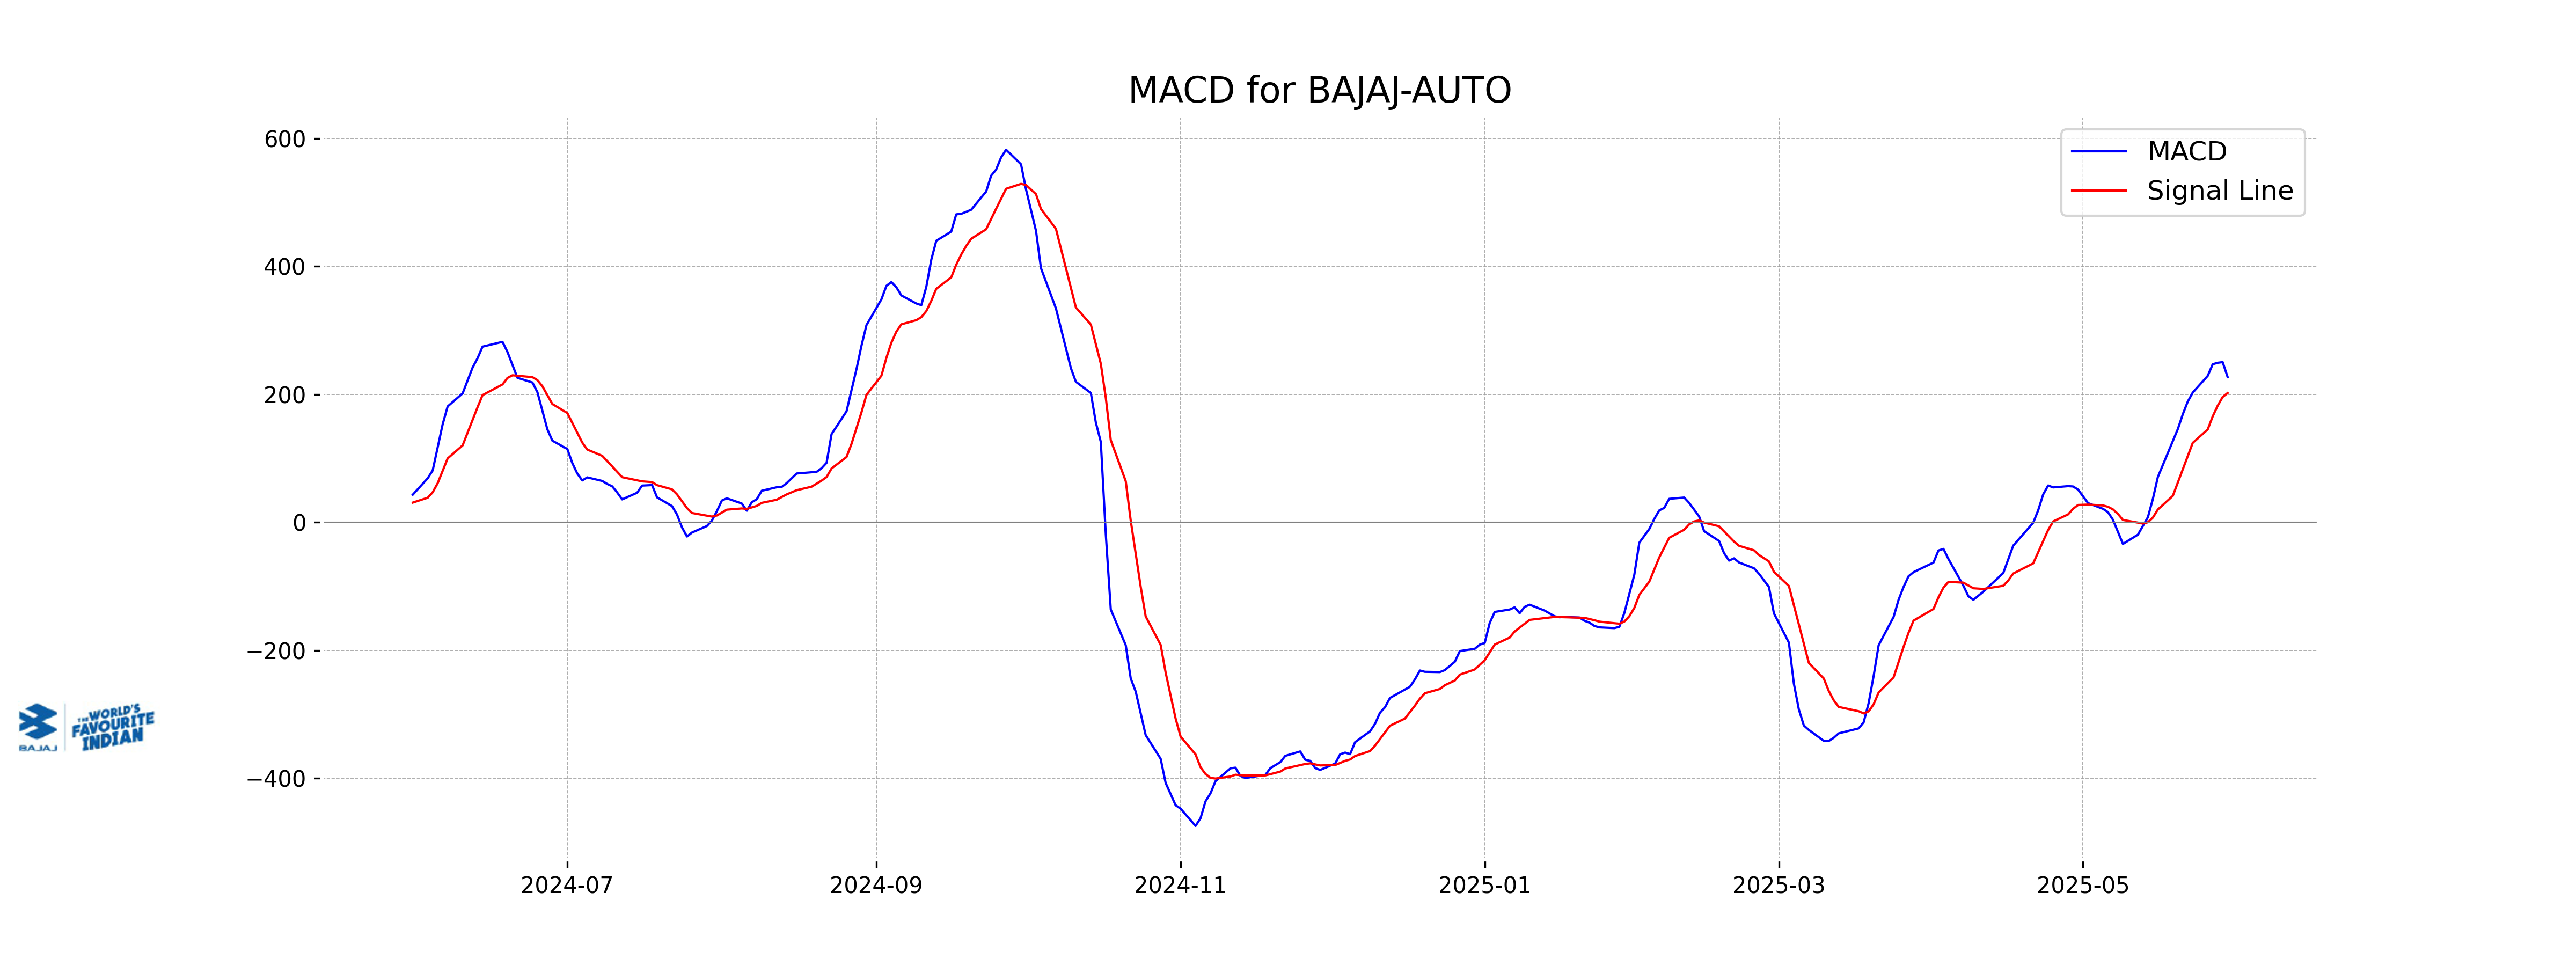
Moving Averages Trend (MACD)
Bajaj Auto's MACD value is 226.95, which is above its MACD Signal line at 202.08, indicating positive momentum and a potential uptrend in the stock price. However, given the recent price drop, caution is advised as market sentiment can change.
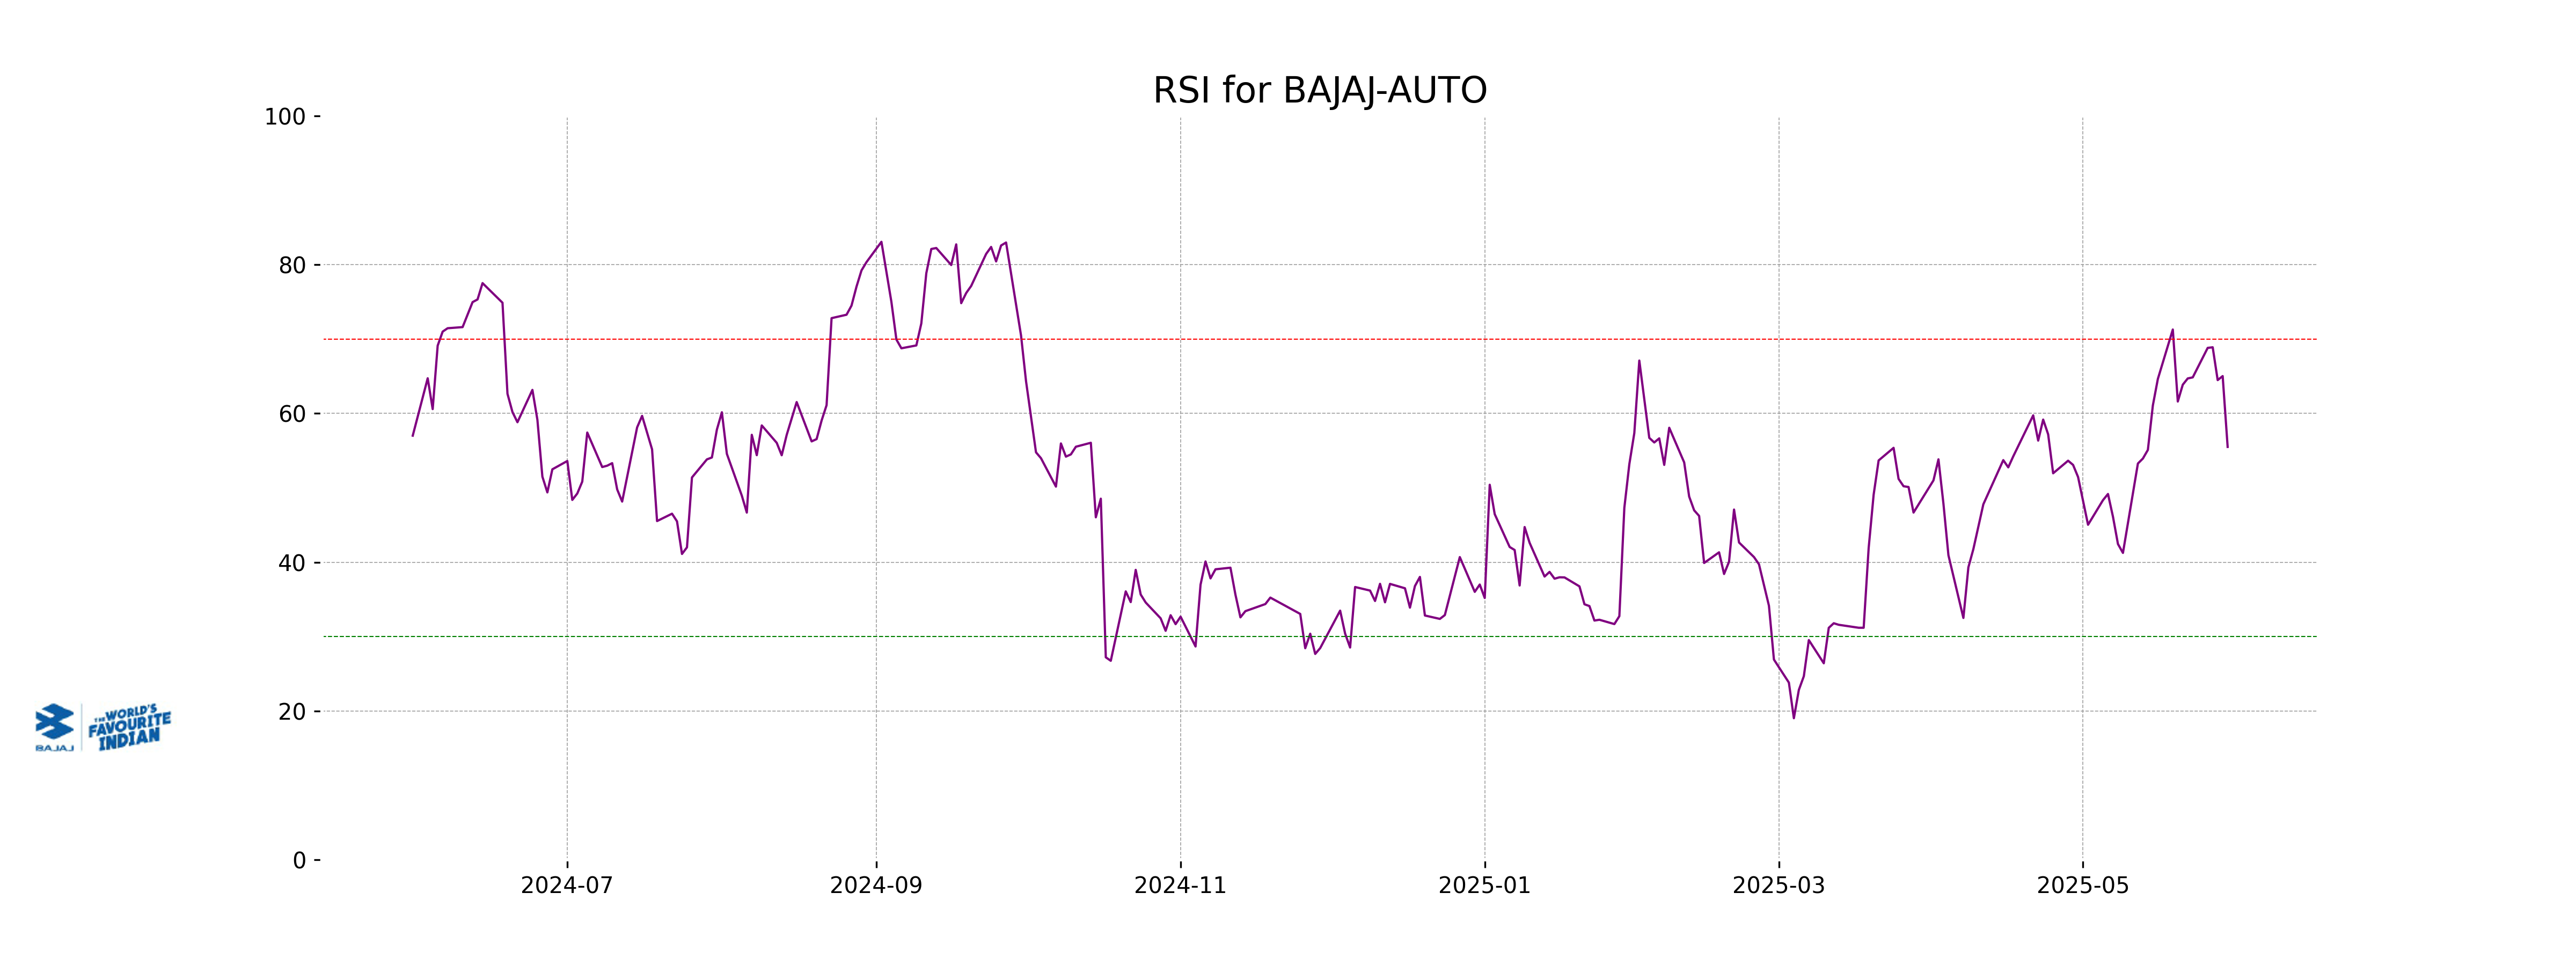
RSI Analysis
Bajaj Auto's RSI (Relative Strength Index) is 55.50, which indicates a neutral market sentiment. It is neither in the overbought (>70) nor in the oversold (<30) zone, suggesting balanced momentum without strong bullish or bearish trends.
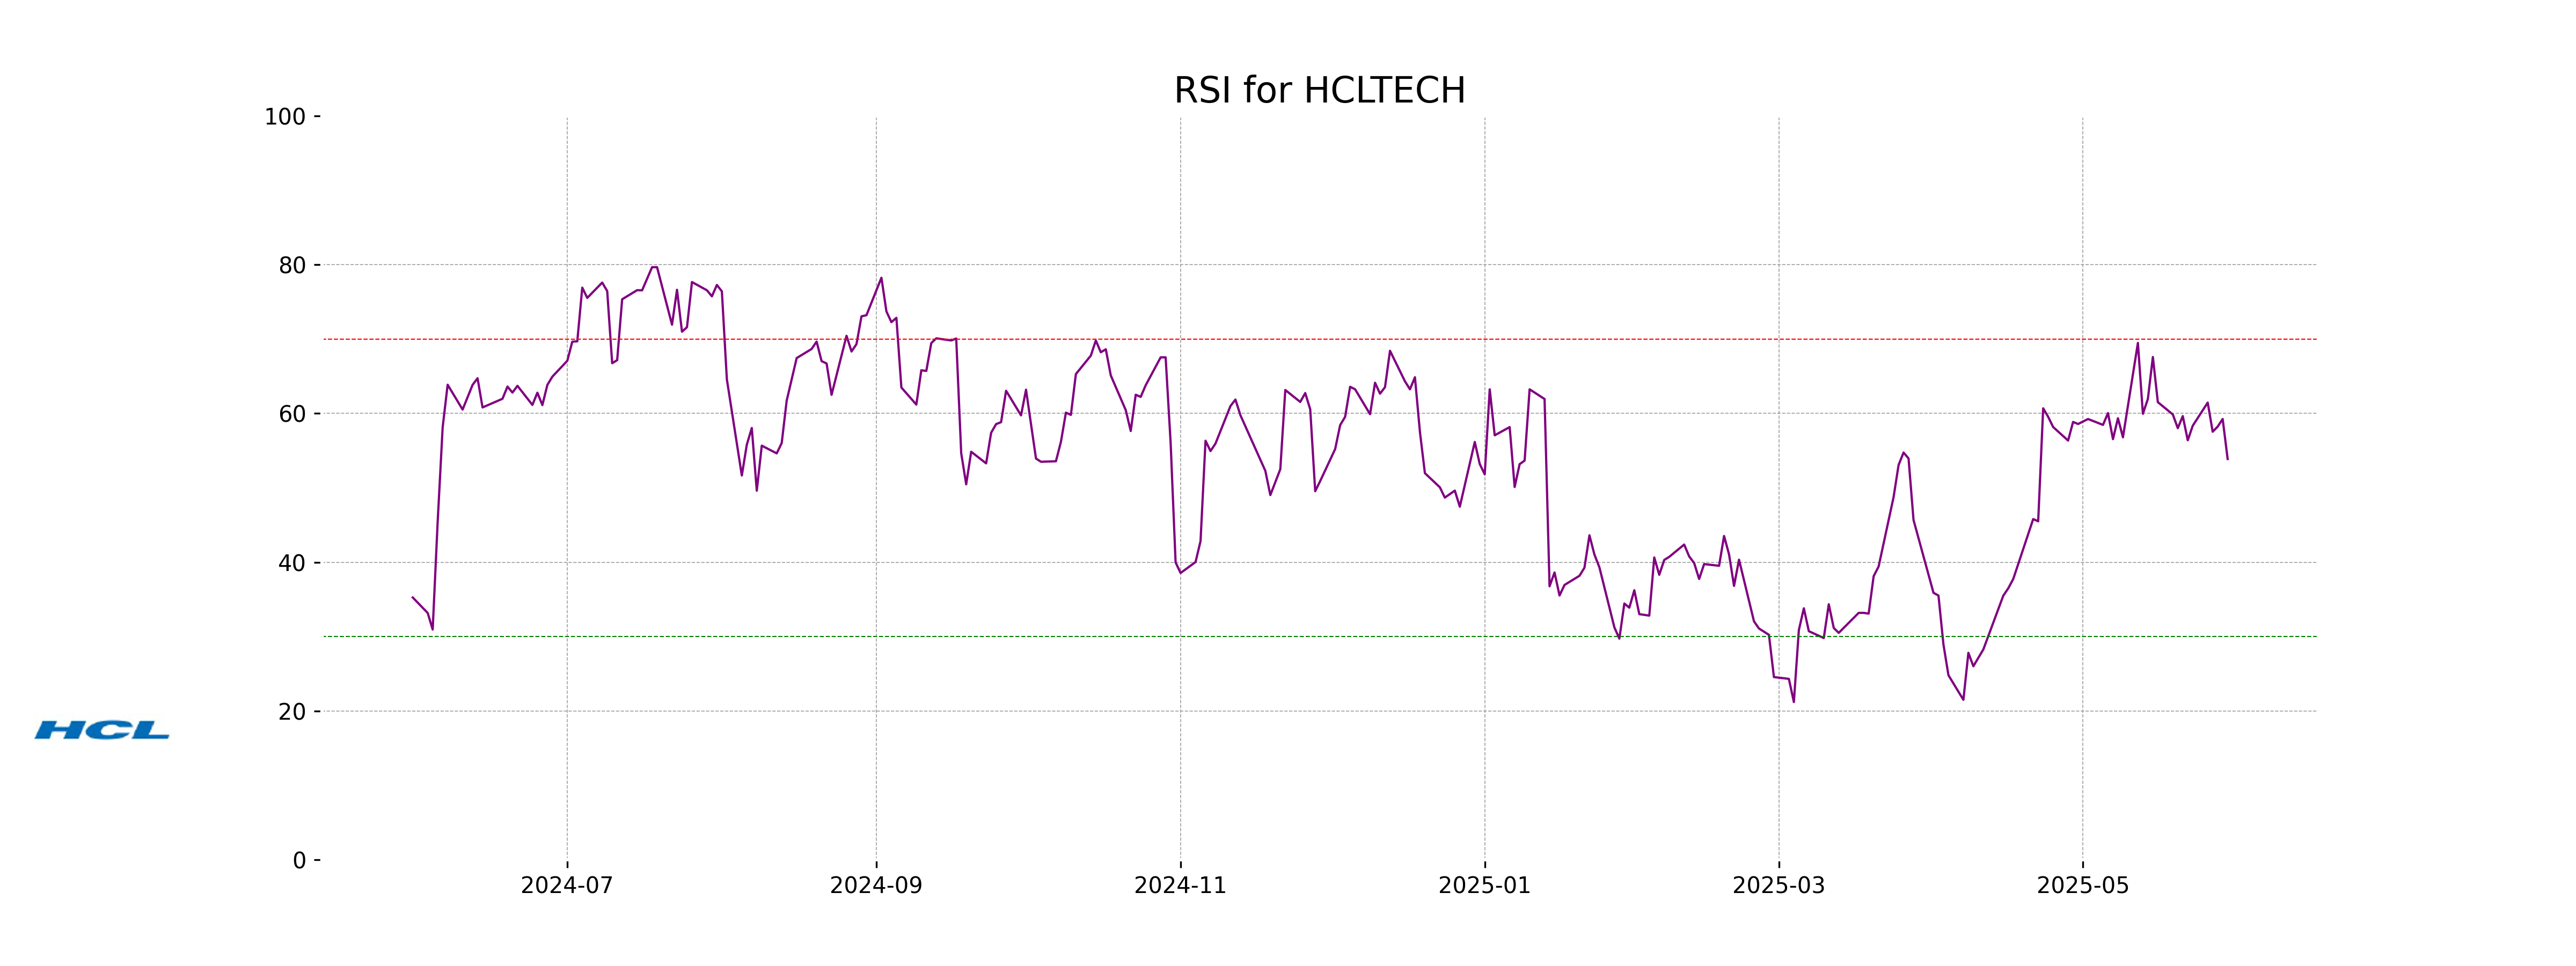
Analysis for HCL Technologies - May 30, 2025
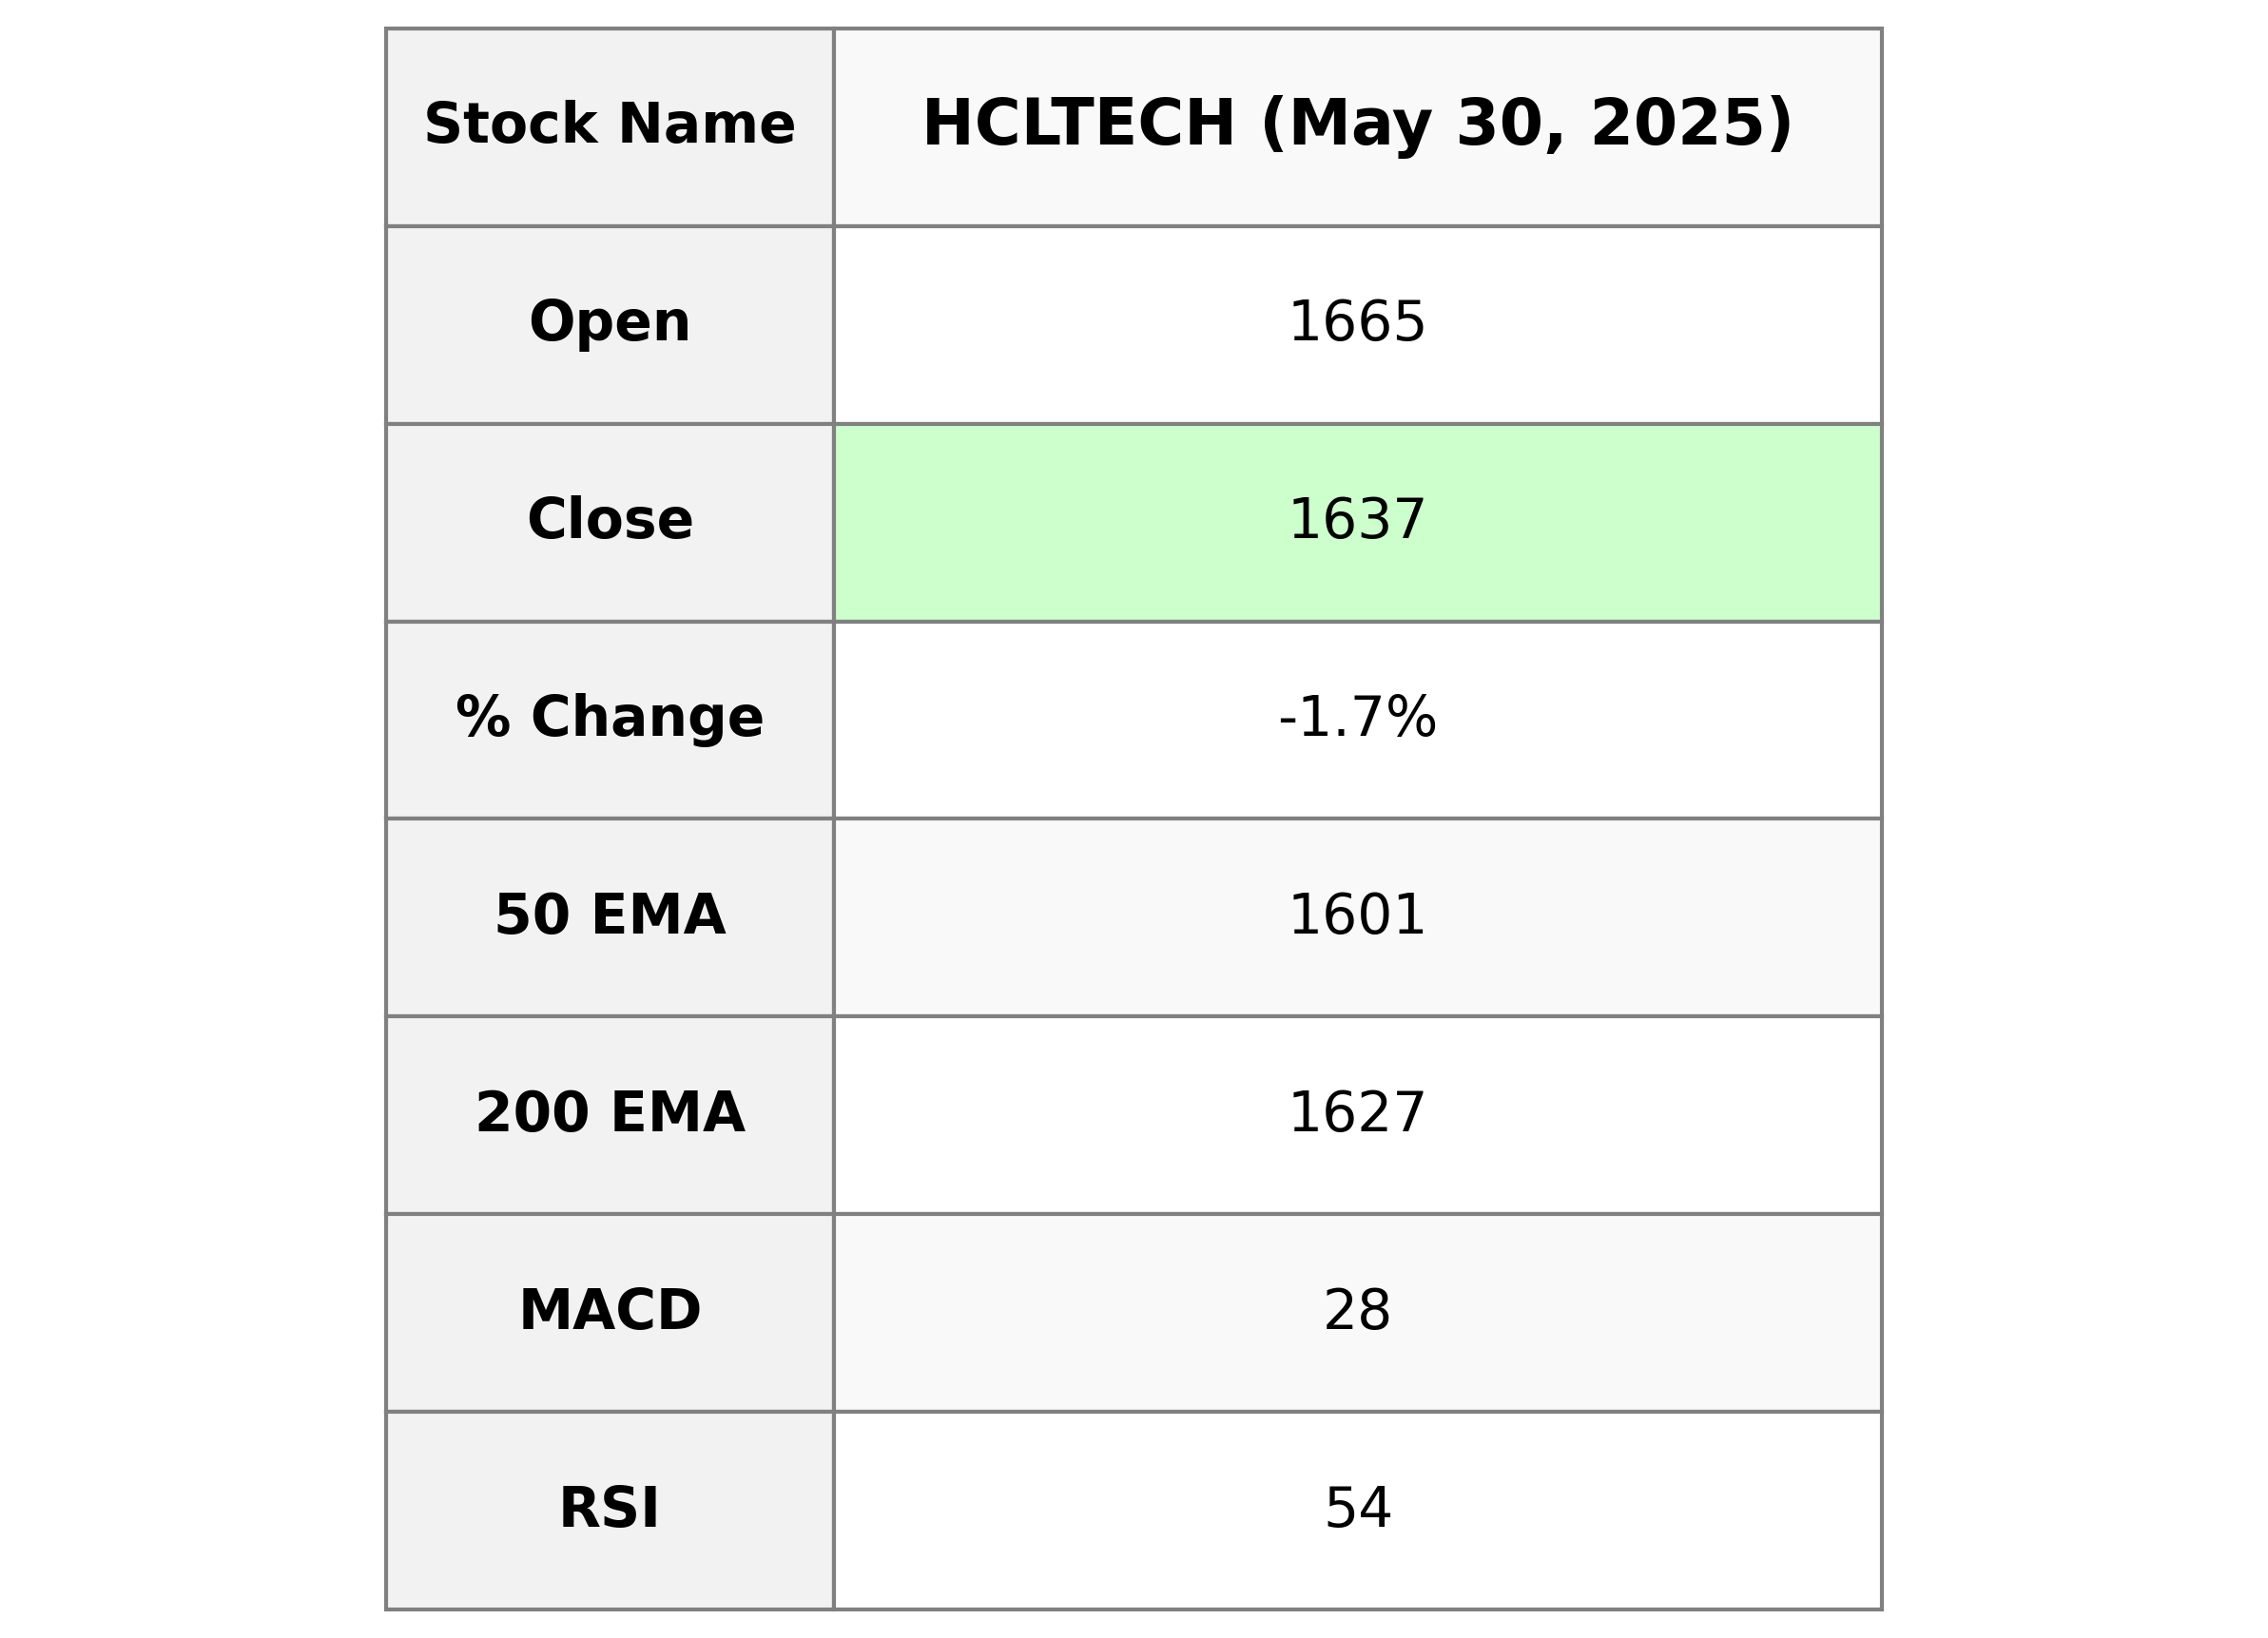
HCL Technologies experienced a decline, with its stock closing at 1636.6 compared to the previous close of 1664.7, marking a -1.69% change. The company's market cap stands at ₹4,433,402,396,672, and it operates in the Information Technology Services industry within the Technology sector in India. Key technical indicators such as the RSI at 53.87 suggest neutral momentum, while the MACD is below the signal line, indicating bearish sentiment.
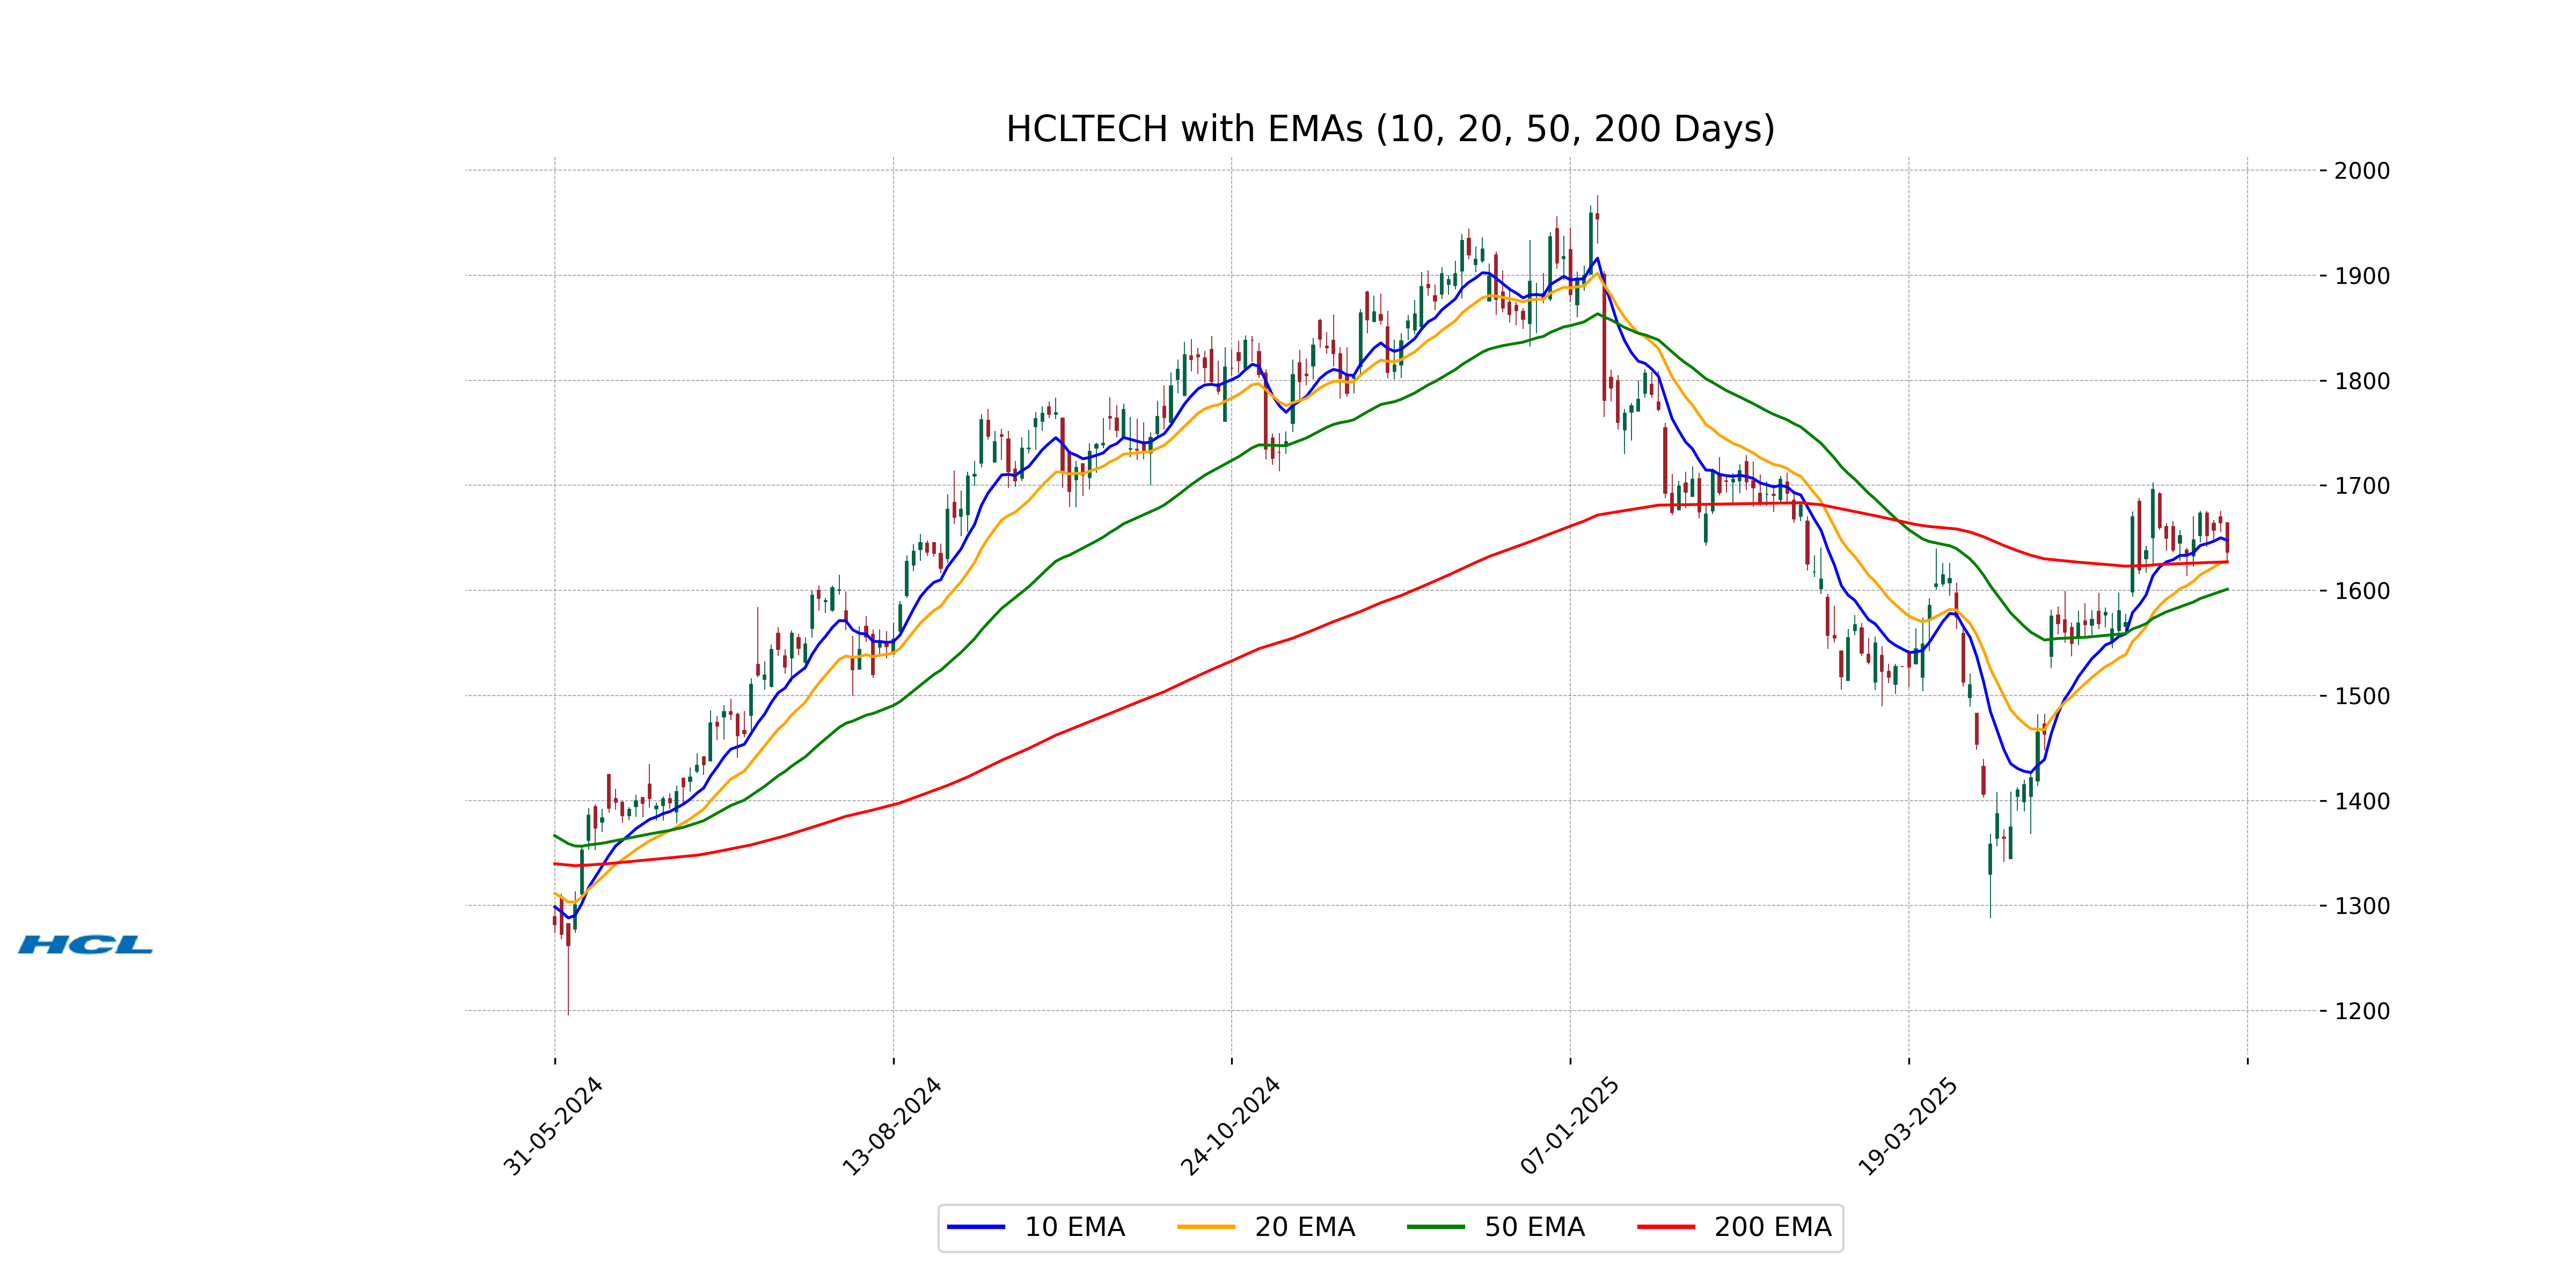
Relationship with Key Moving Averages
HCL Technologies' current stock price is below its 10-day EMA of 1647.65 and slightly above its 50-day EMA of 1601.21, indicating short-term weakness but longer-term stability above the 200-day EMA of 1627.25. The recent closing price of 1636.60 suggests it is trading close to the 200-day EMA level.
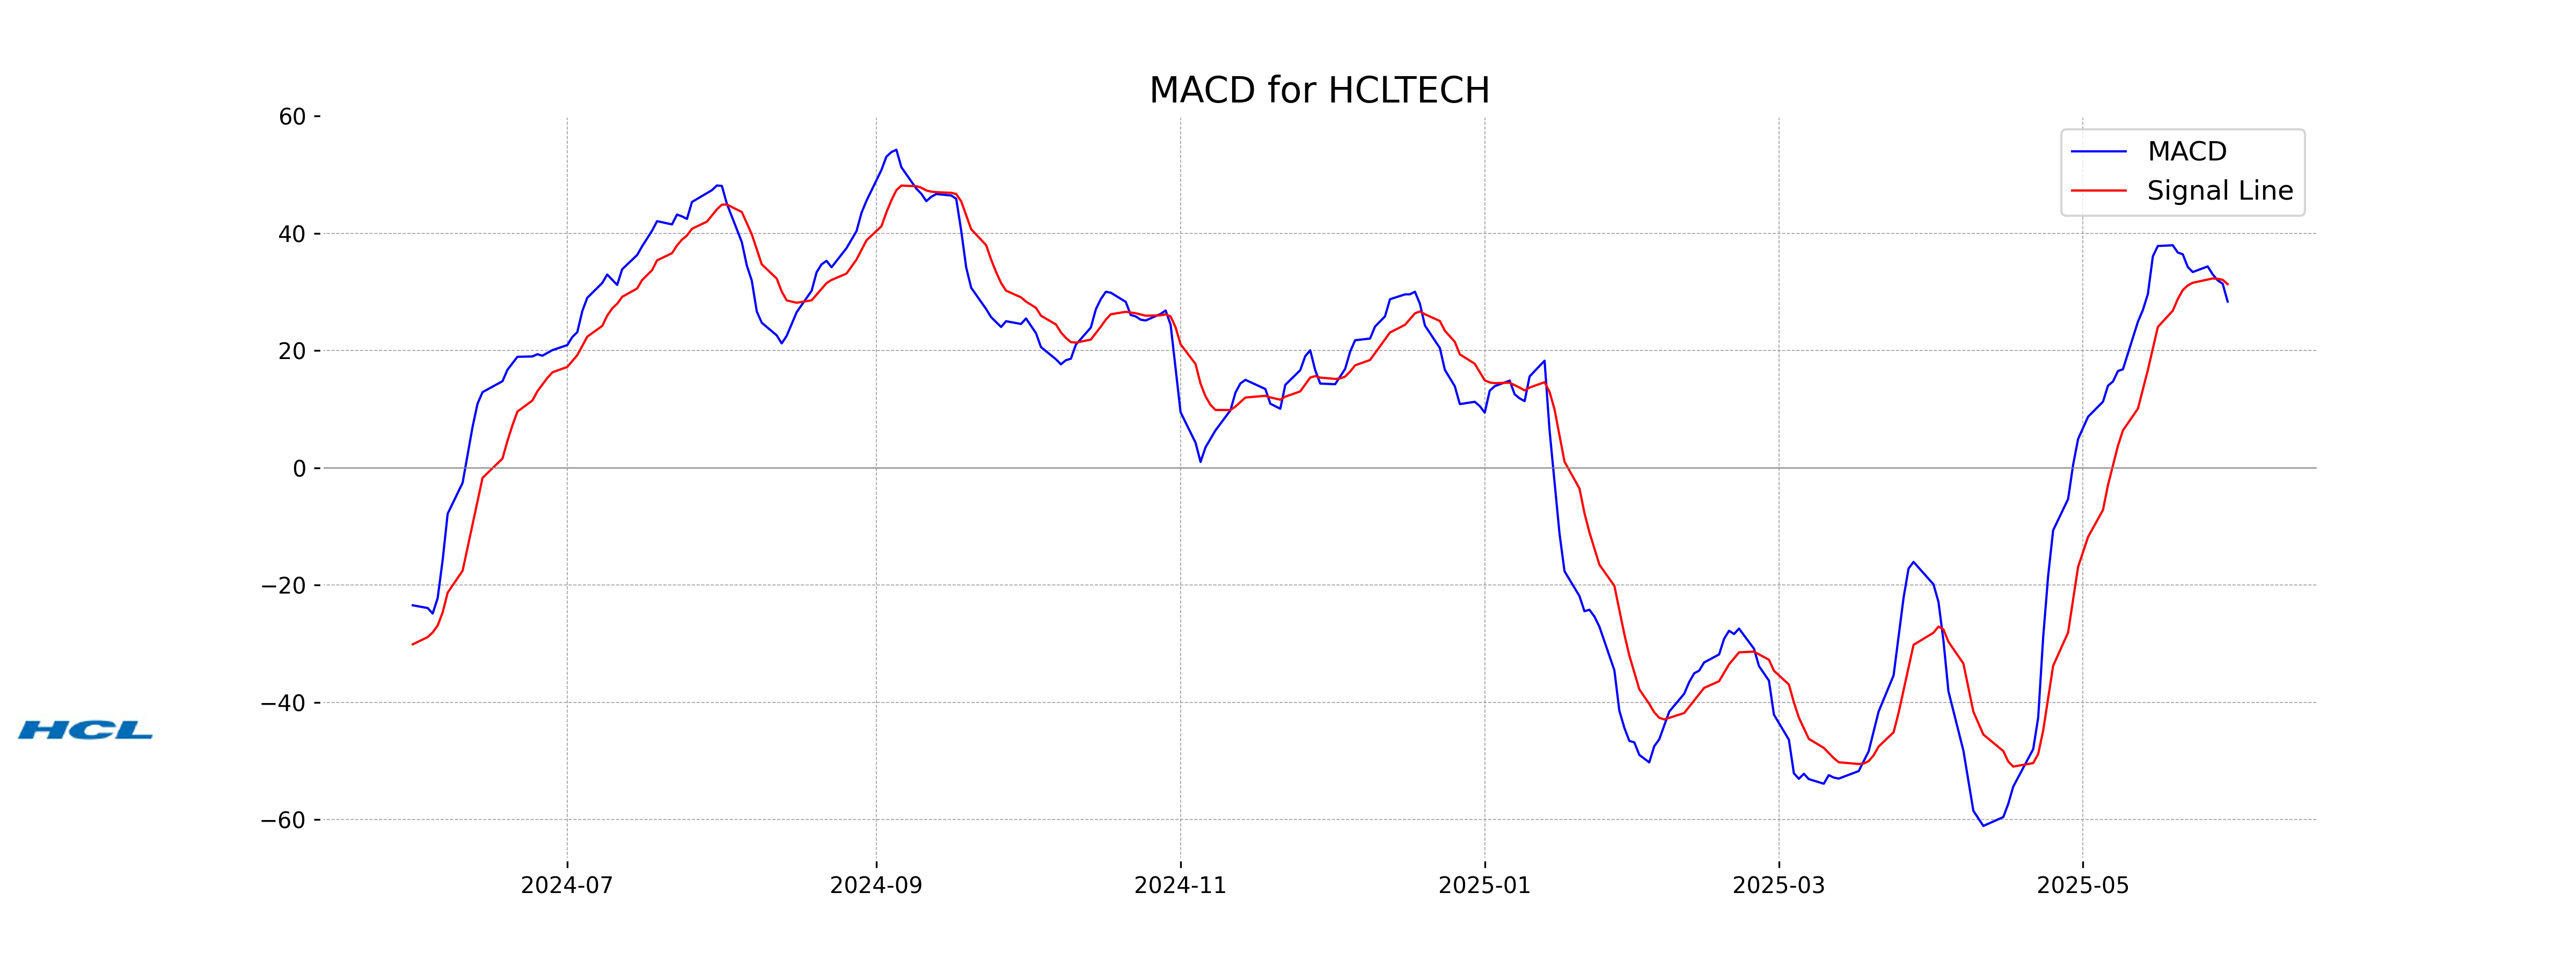
Moving Averages Trend (MACD)
The MACD analysis for HCL Technologies shows that the MACD value is lower than the MACD Signal, which could indicate a potential bearish trend. Traders may interpret this as a signal to watch for further weakness unless the MACD value crosses above the Signal line.
RSI Analysis
The RSI (Relative Strength Index) for HCL Technologies is 53.87, which indicates a neutral position. An RSI value between 30 and 70 generally suggests that the stock is neither overbought nor oversold.
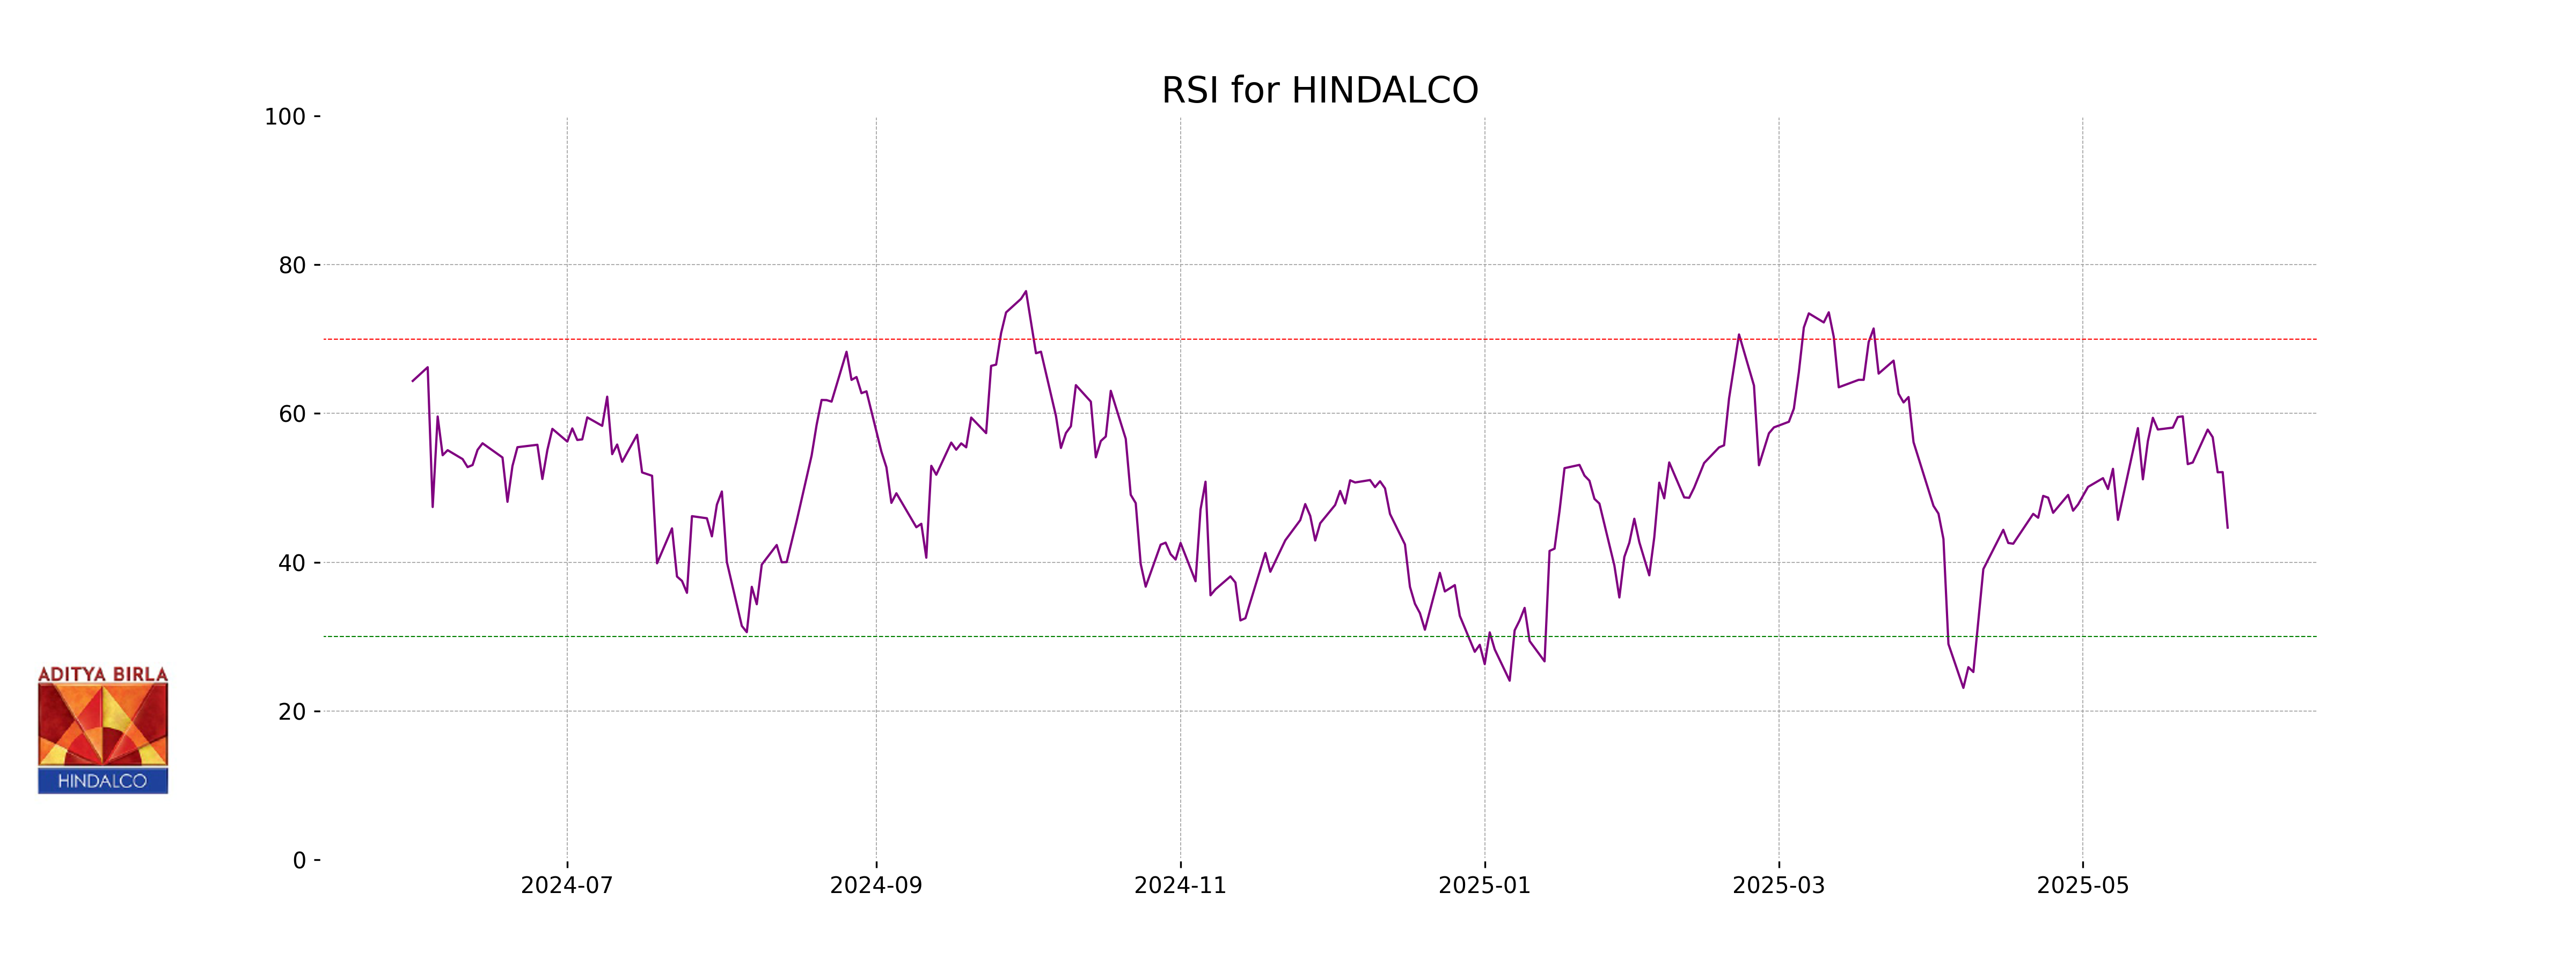
Analysis for HINDALCO - May 30, 2025
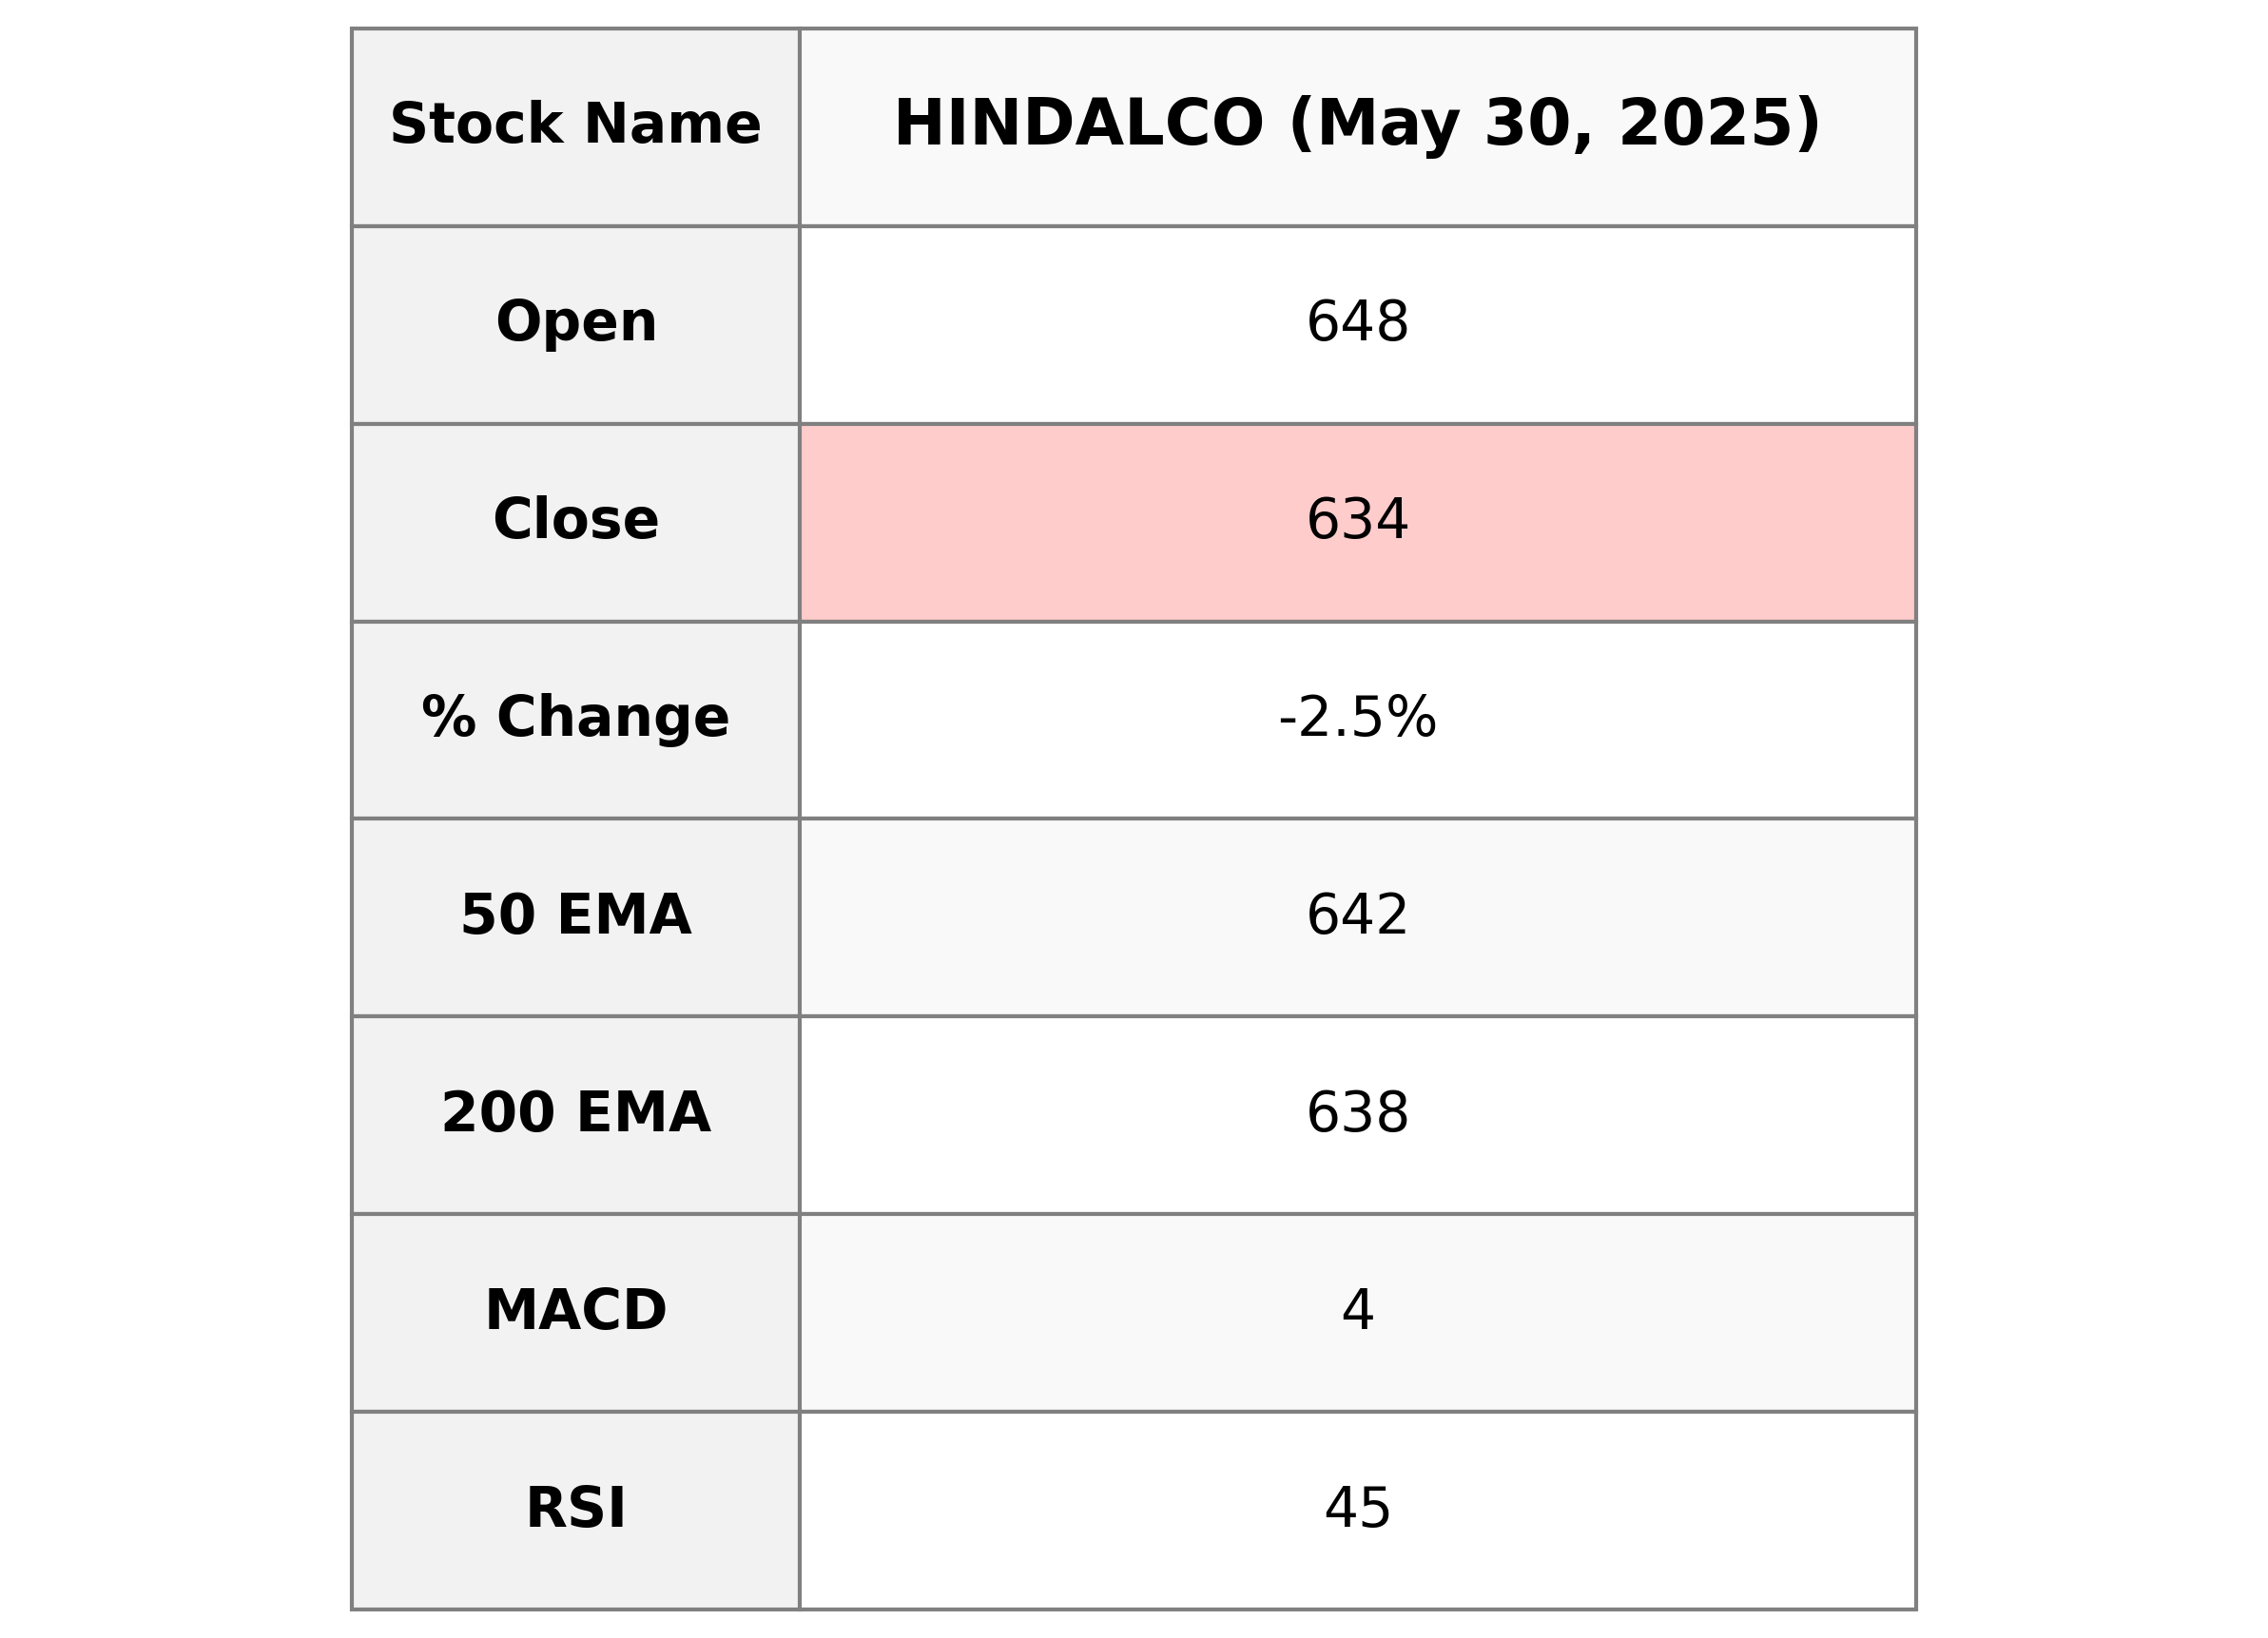
Hindalco, a major player in the Basic Materials sector under the Aluminum industry, has shown a decline in its stock performance recently. The stock closed at 633.5, down from its previous close of 650.0, reflecting a negative change of -2.54%. Despite this decline, it maintains a strong market position with a significant market capitalization of 1,416,987,541,504 INR, and a favorable PE Ratio of 8.81, indicating potential investment appeal.
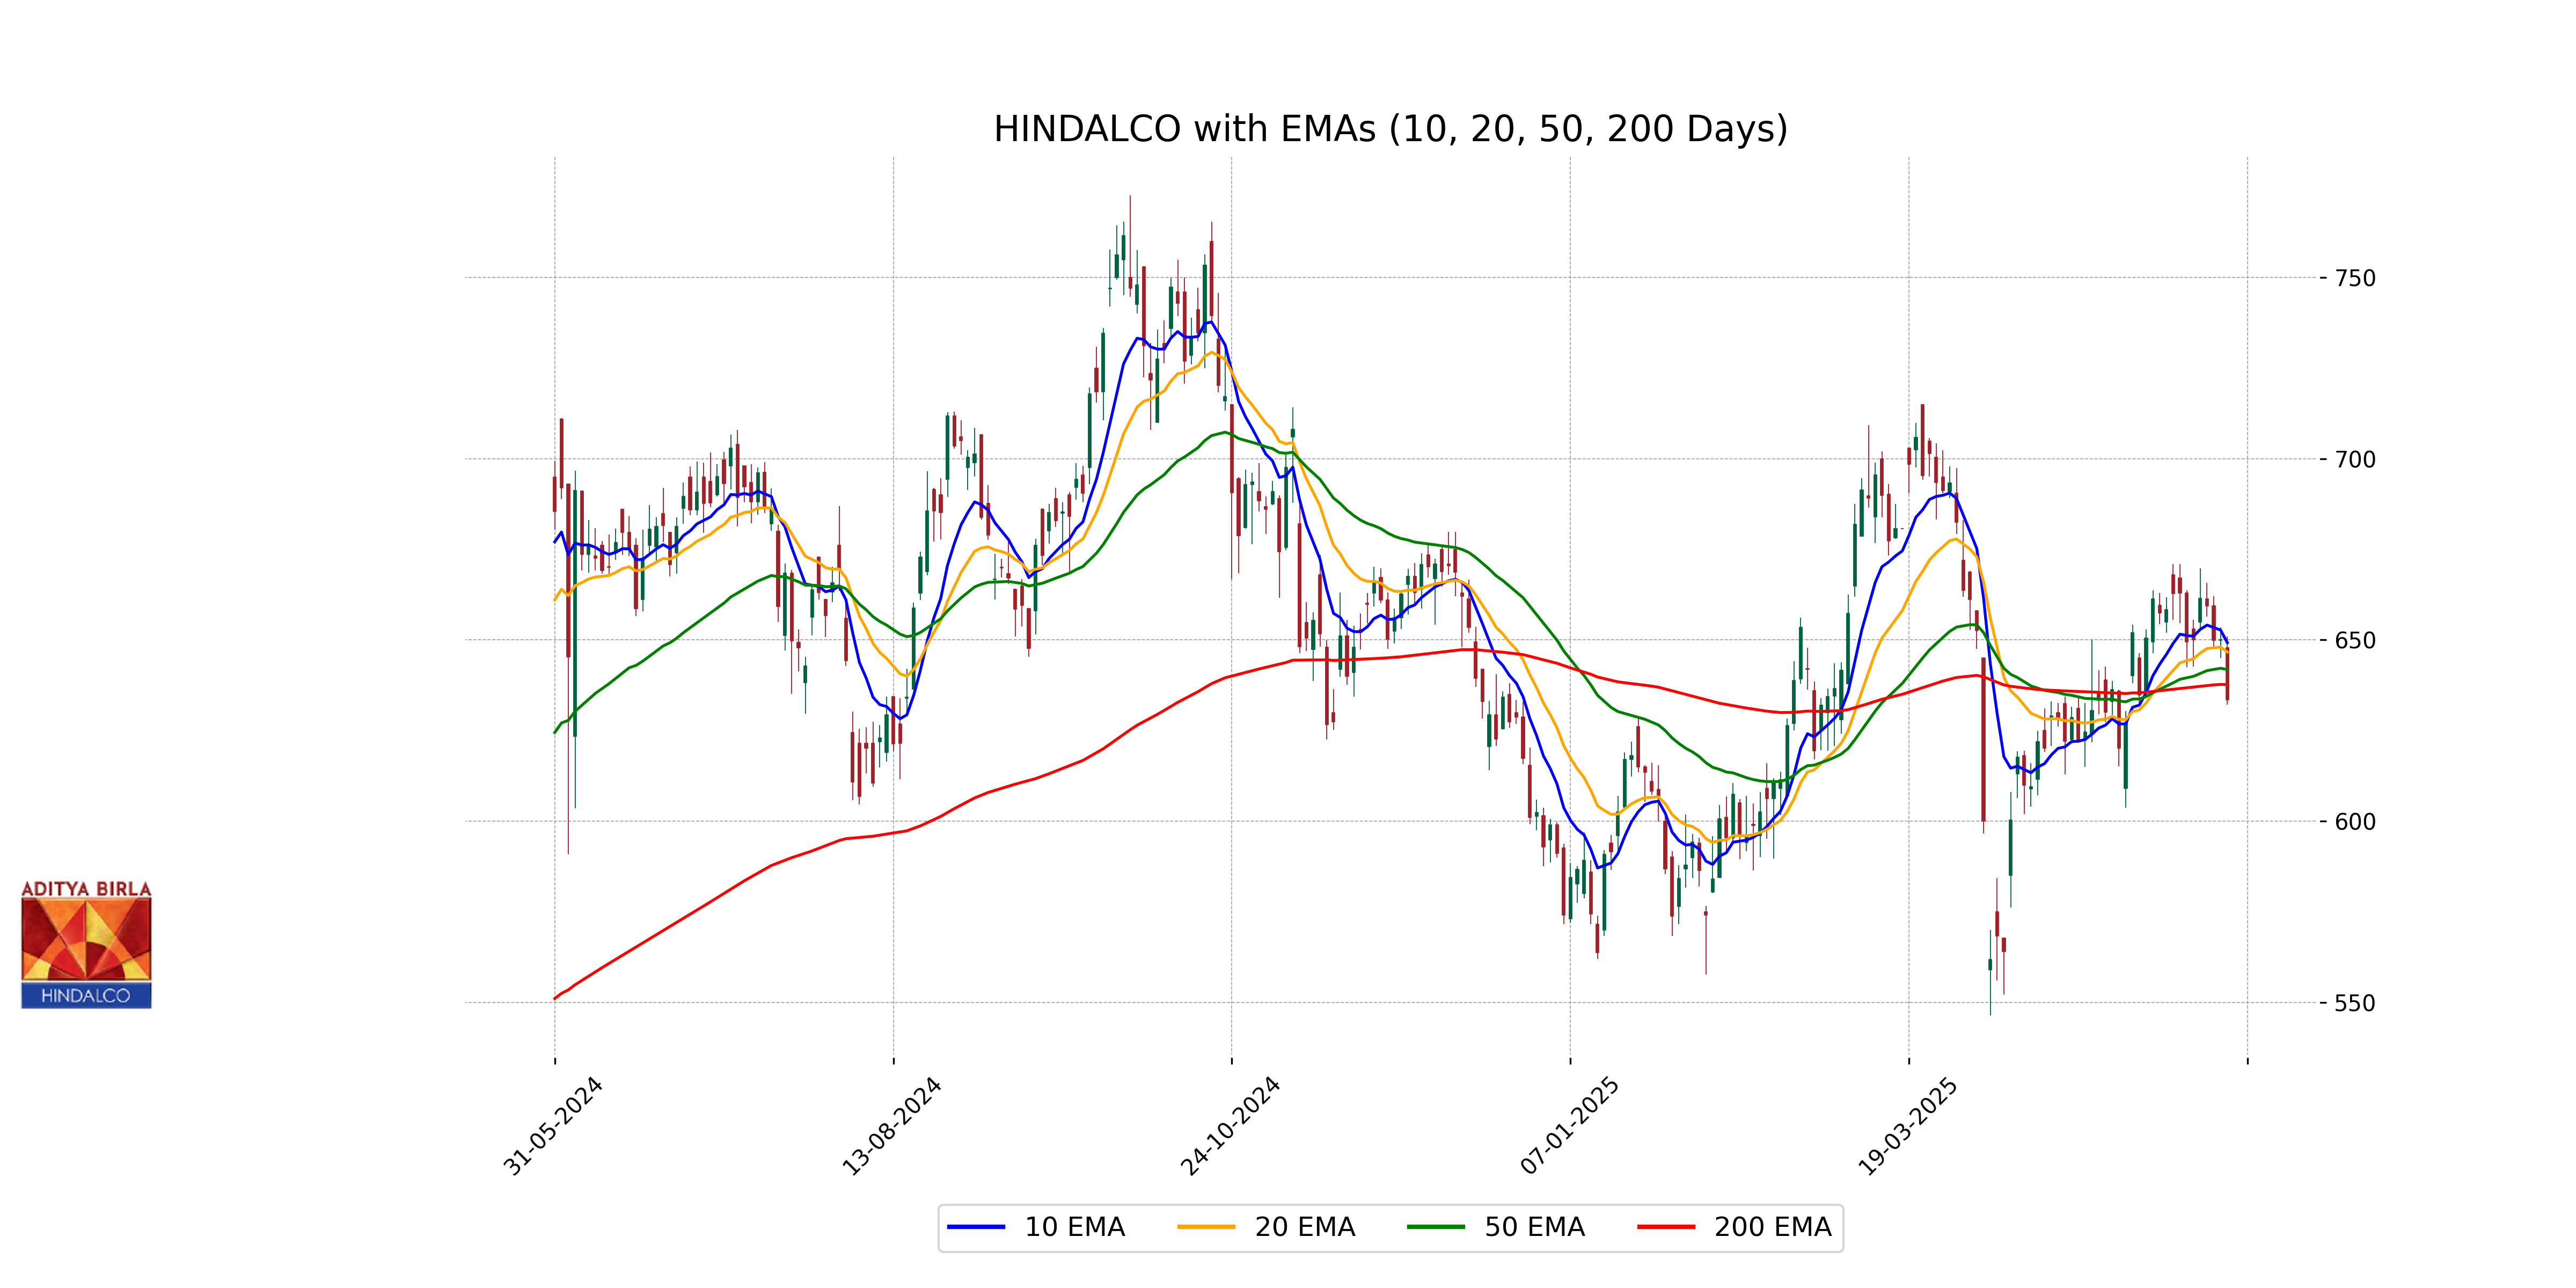
Relationship with Key Moving Averages
Hindalco's current close price of 633.5 is below its 10 EMA (649.24) and 20 EMA (646.67), indicating short-term bearish pressure. It is also slightly below the 50 EMA (641.85) but still higher than the 200 EMA (637.69), suggesting mixed sentiment with potential longer-term support.
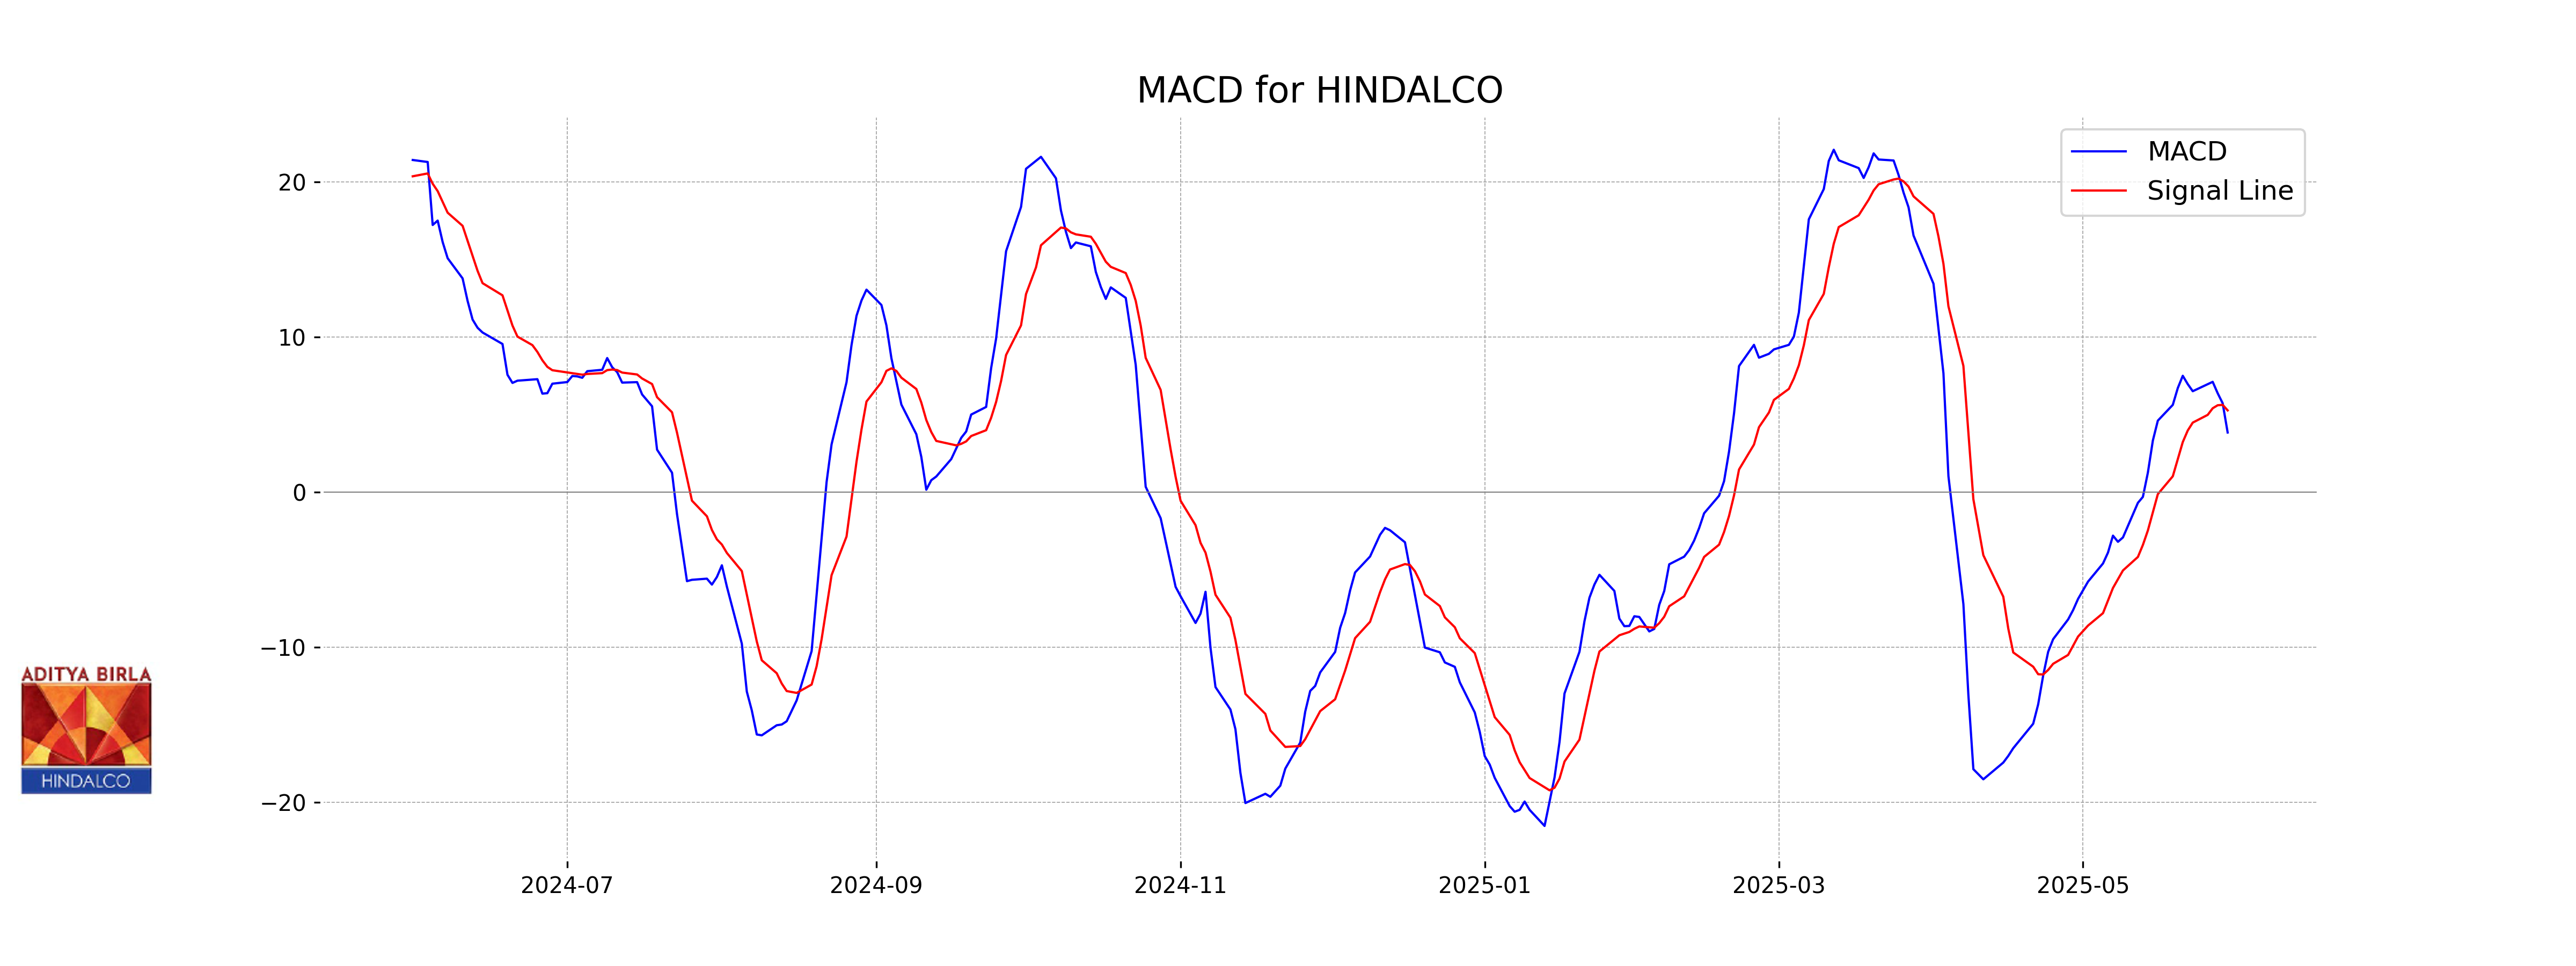
Moving Averages Trend (MACD)
Hindalco: The MACD line for Hindalco is currently at 3.85, below the MACD Signal line at 5.28, indicating a bearish trend. This suggests potential downward momentum in the stock's price.
RSI Analysis
The RSI for Hindalco indicates a value of 44.65, which suggests that the stock is currently in a neutral zone. It is neither overbought nor oversold, indicating a balanced momentum in recent trading sessions.
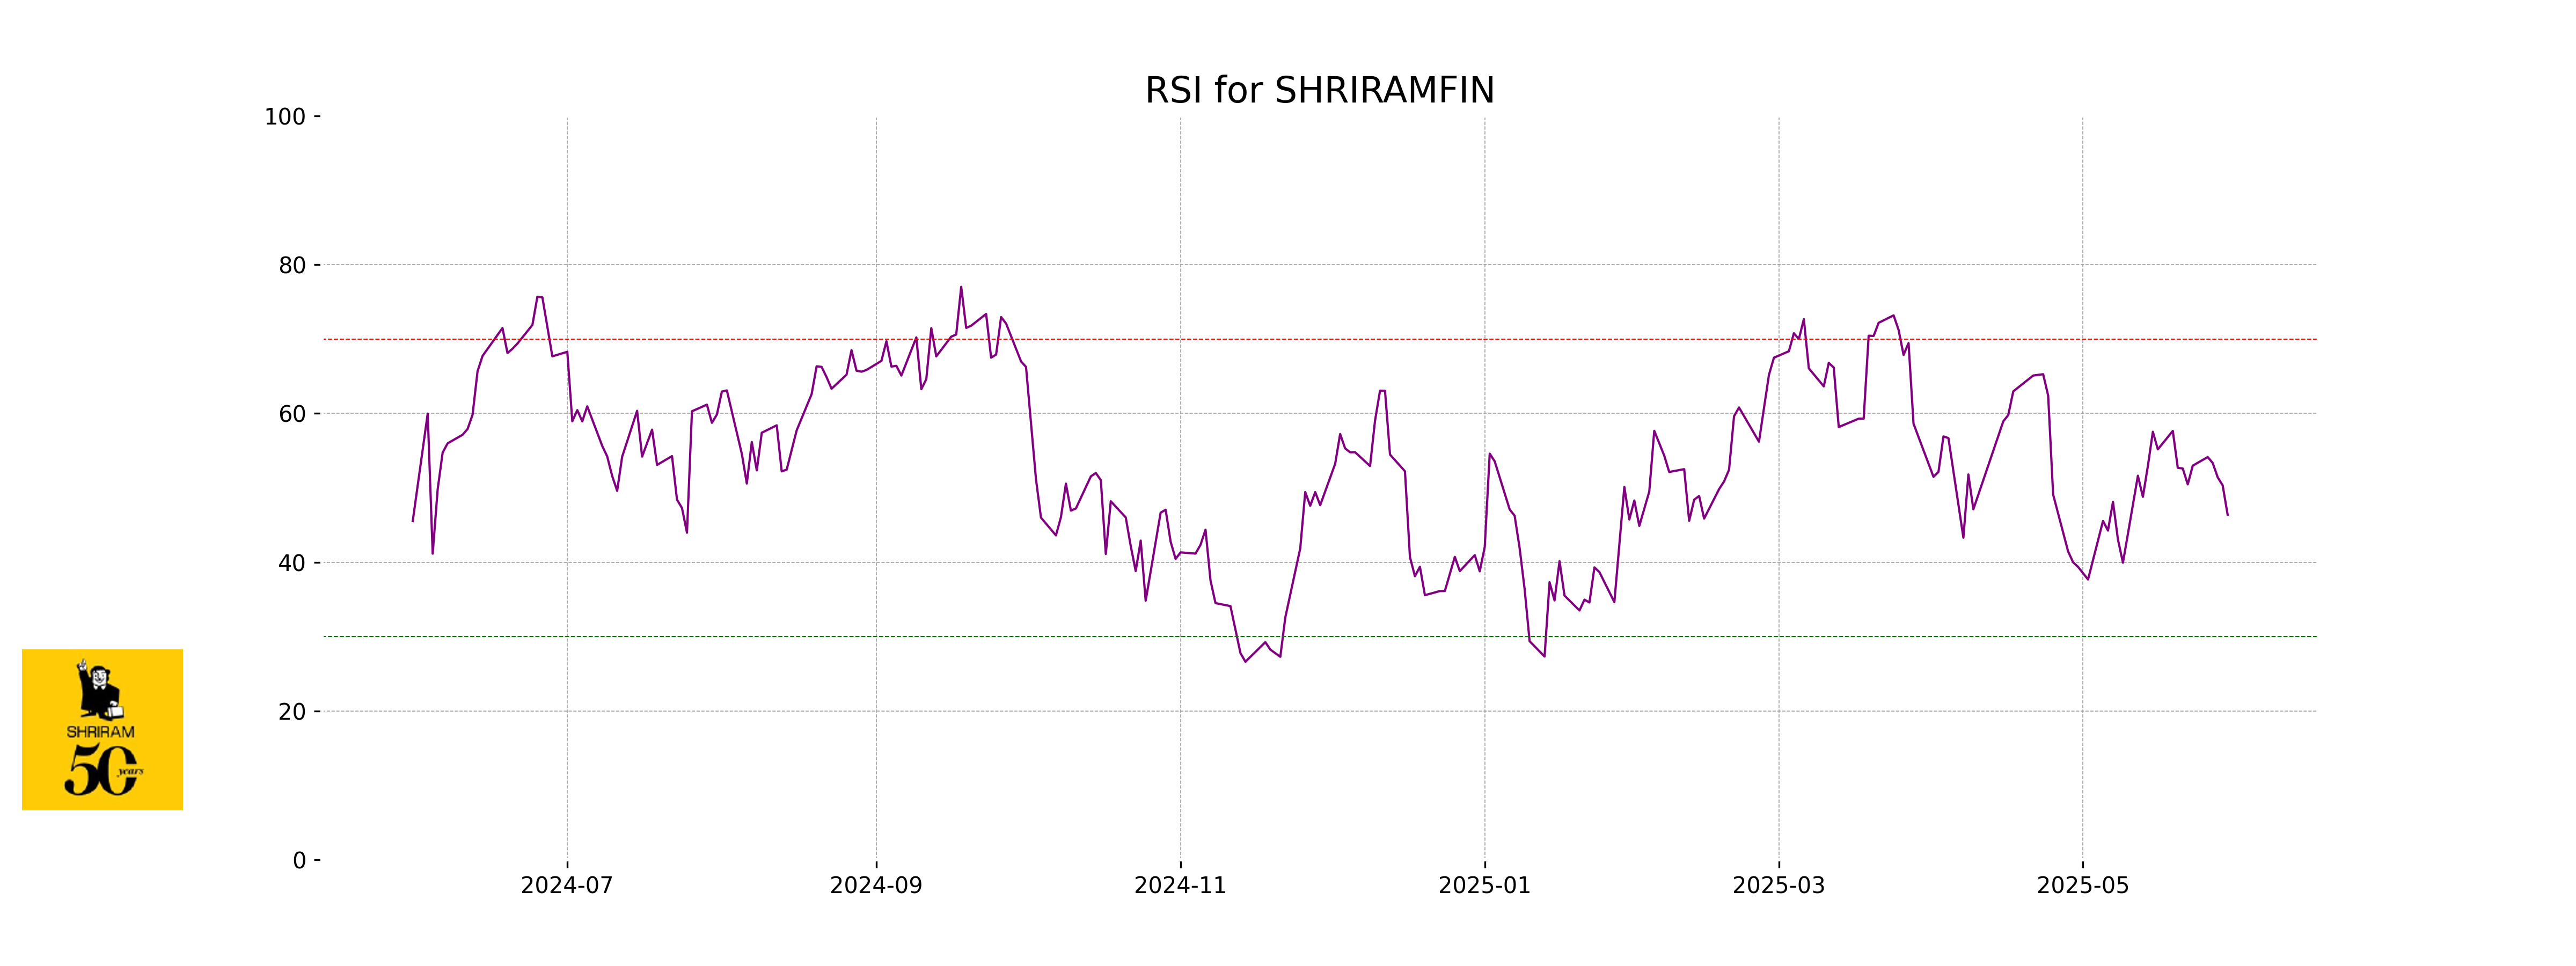
Analysis for Shriram Finance - May 30, 2025
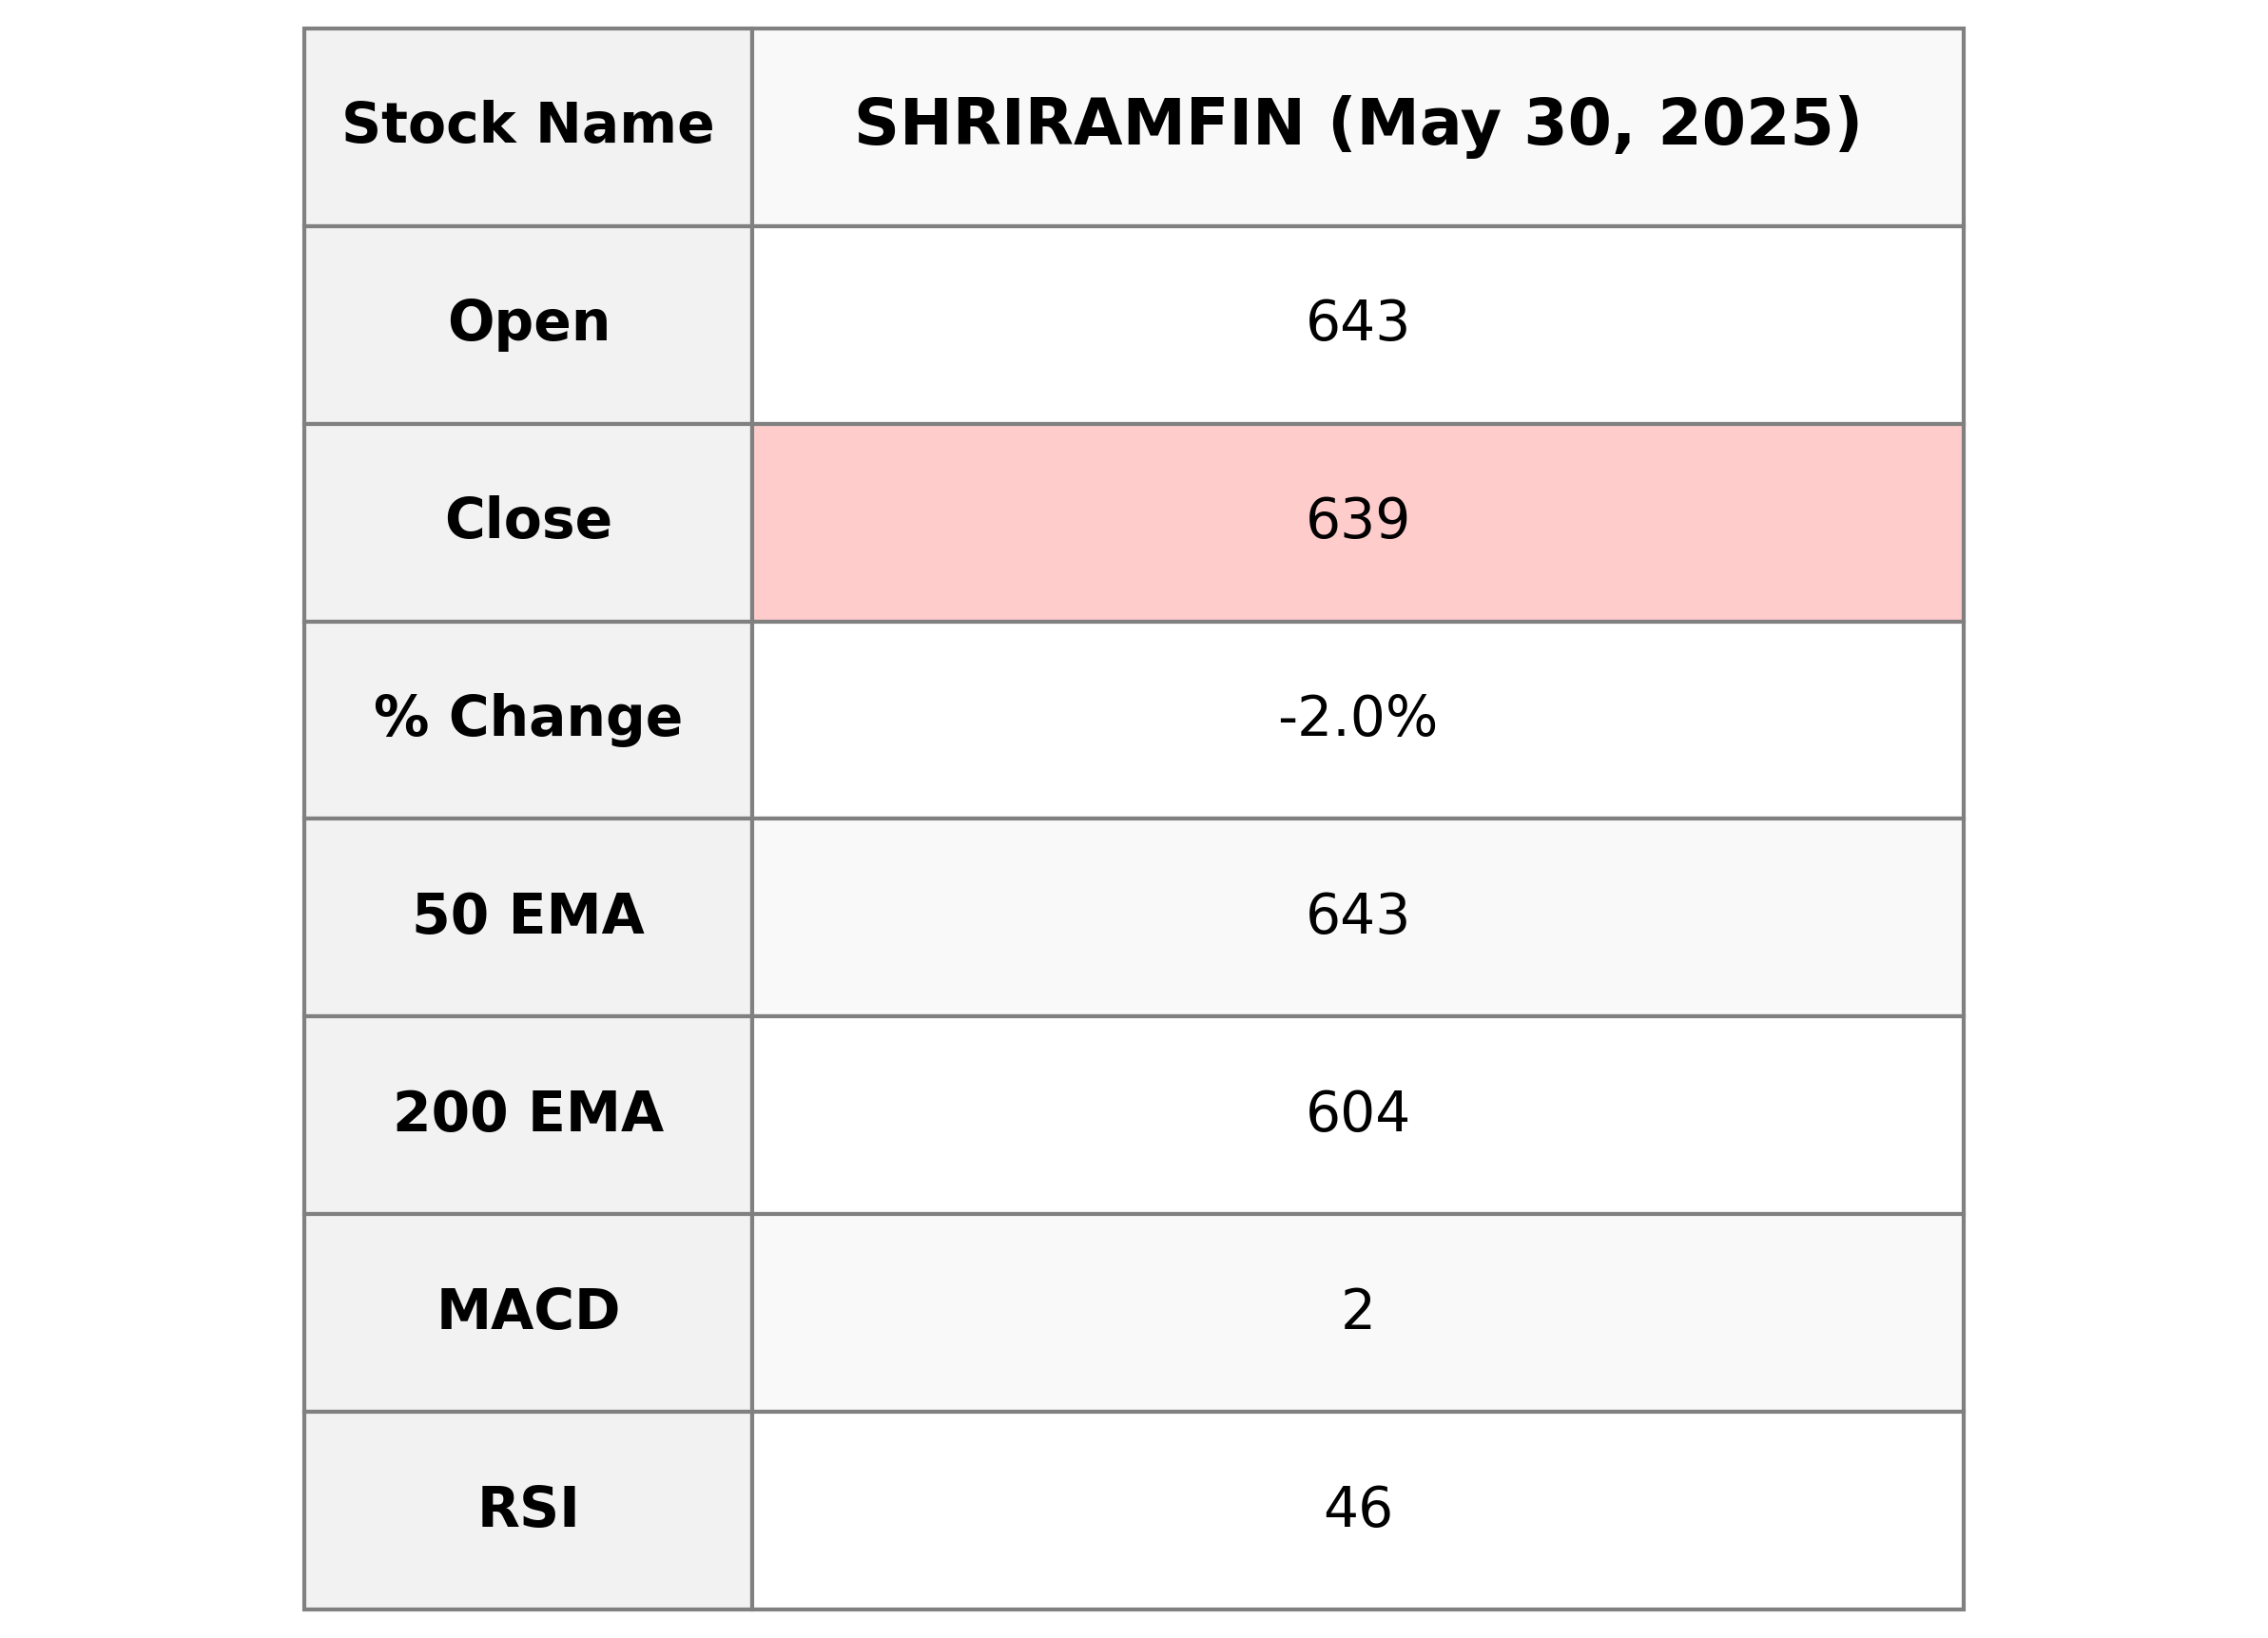
Stock Name: Shriram Finance Performance Summary: Shriram Finance opened at 643.10 and closed at 639.35, showing a decrease of approximately 1.98%. The stock's current performance is below its 10-day and 20-day EMA, indicating a short-term bearish trend, while its RSI of 46.38 suggests it is nearing the oversold territory. The PE Ratio stands at 12.76, reflective of its valuation within the financial services sector.
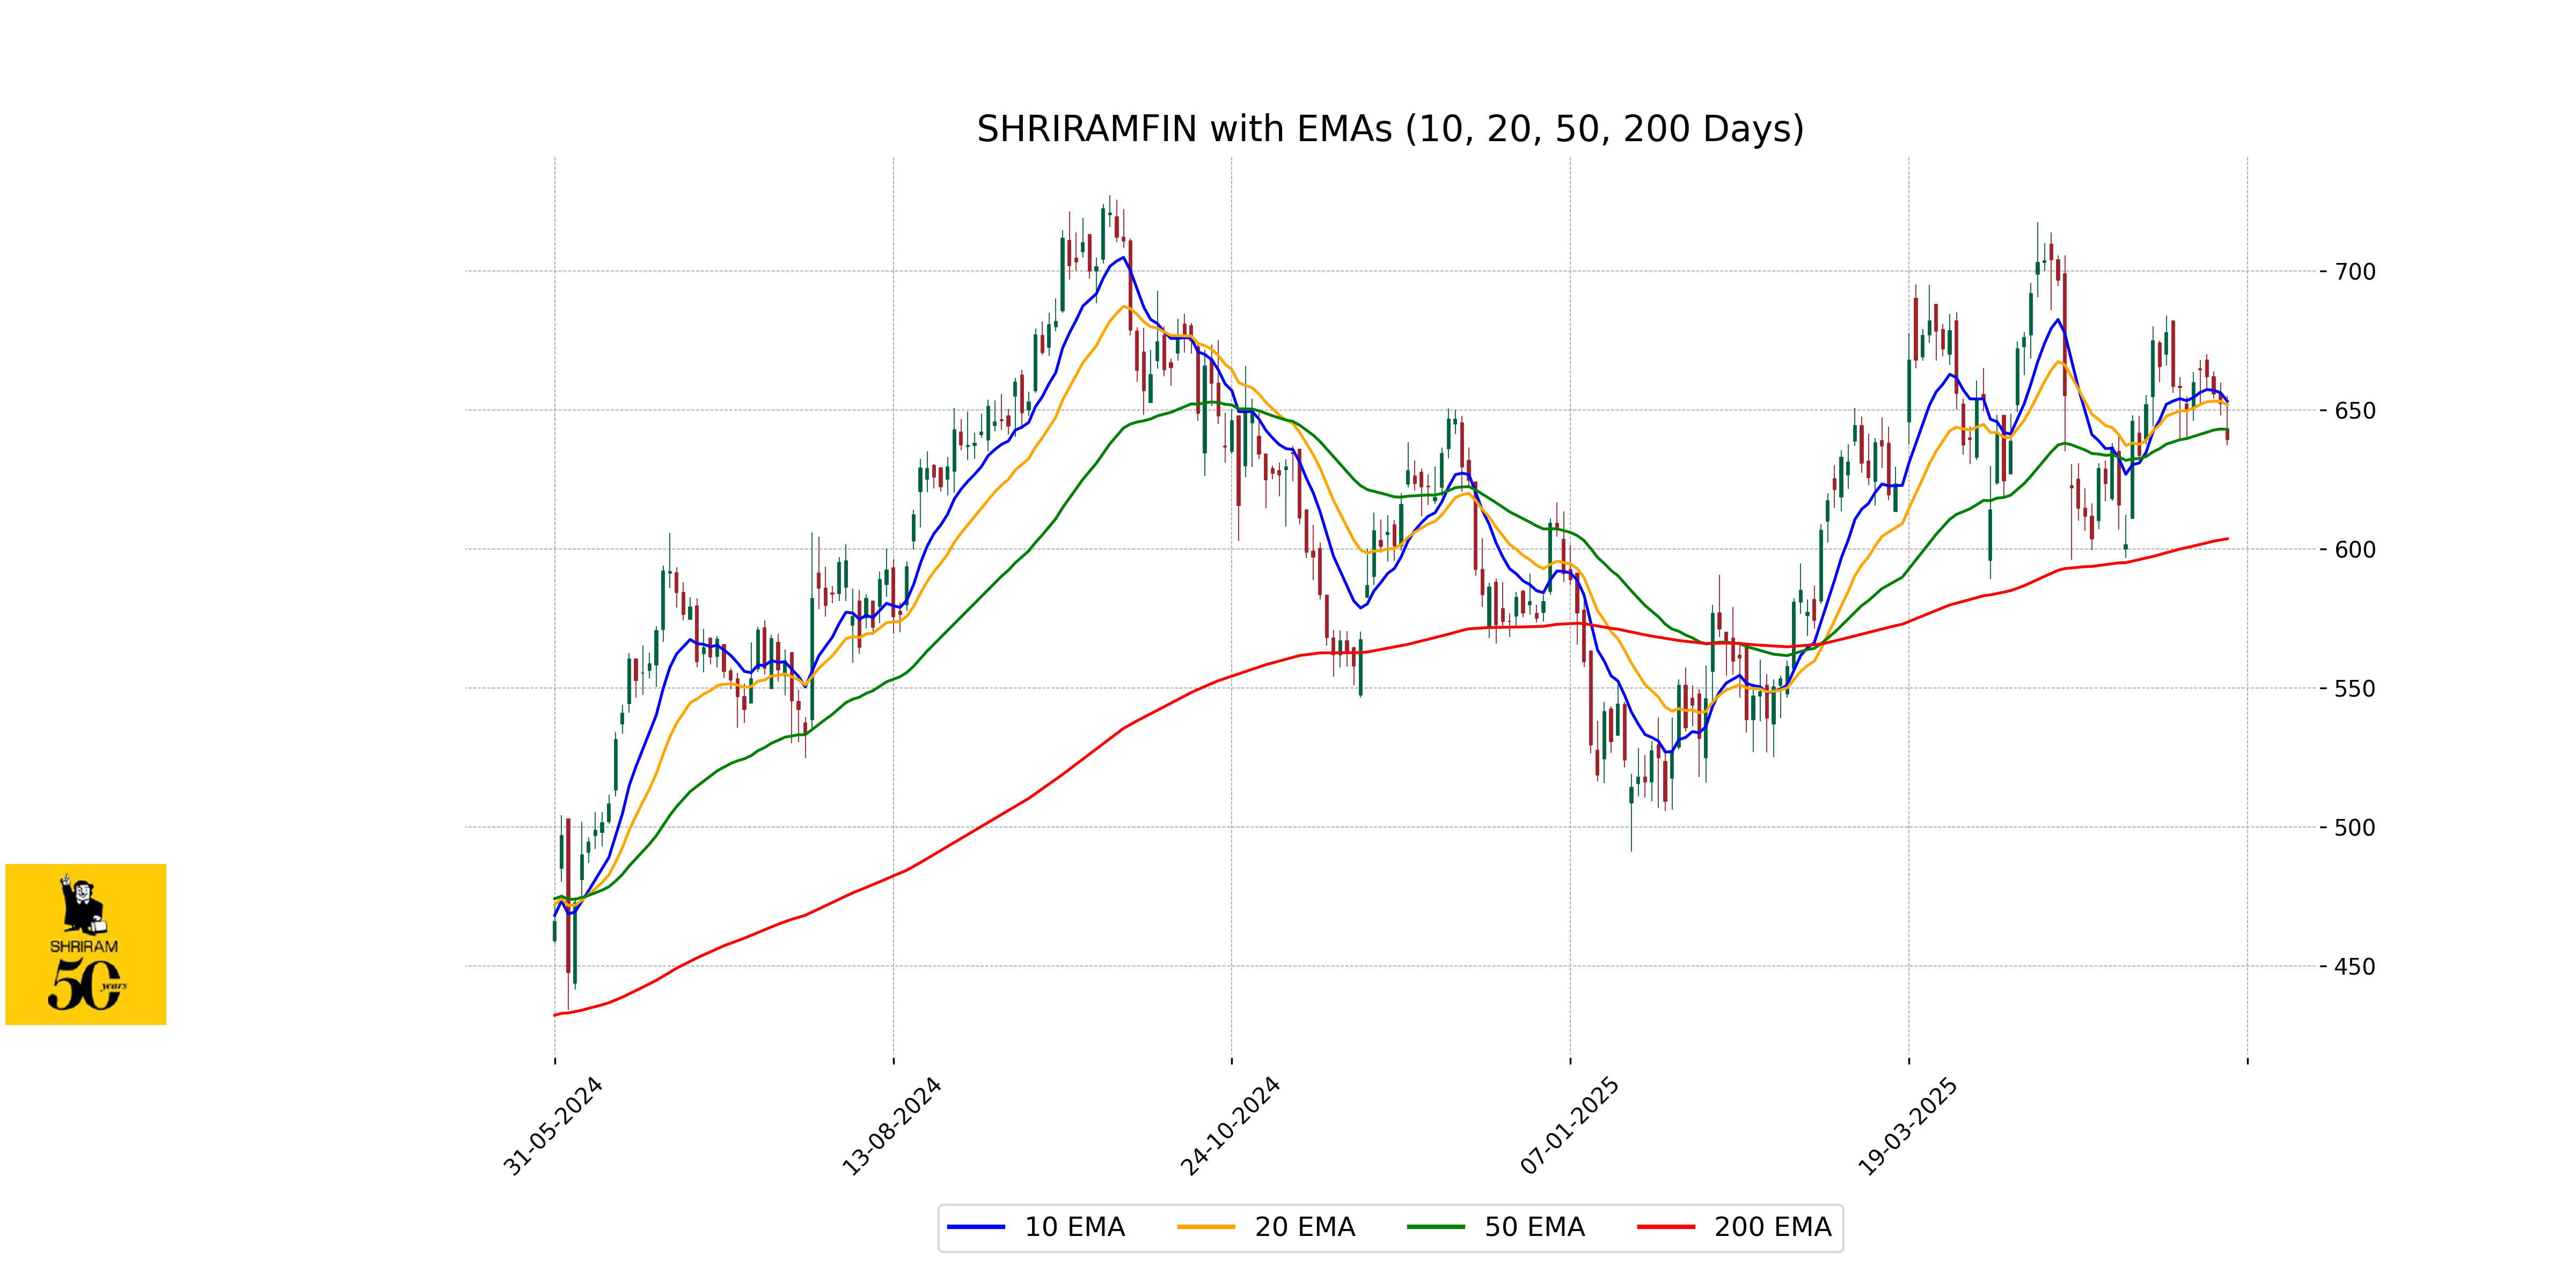
Relationship with Key Moving Averages
Shriram Finance's close price of 639.35 is slightly below its 50-day EMA of 642.96, indicating potential weakness relative to this key average. It is also below the 10-day and 20-day EMAs of 653.10 and 651.77, respectively, which suggests recent downward momentum. However, the close is above the 200-day EMA of 603.65, indicating a longer-term uptrend might still be intact.
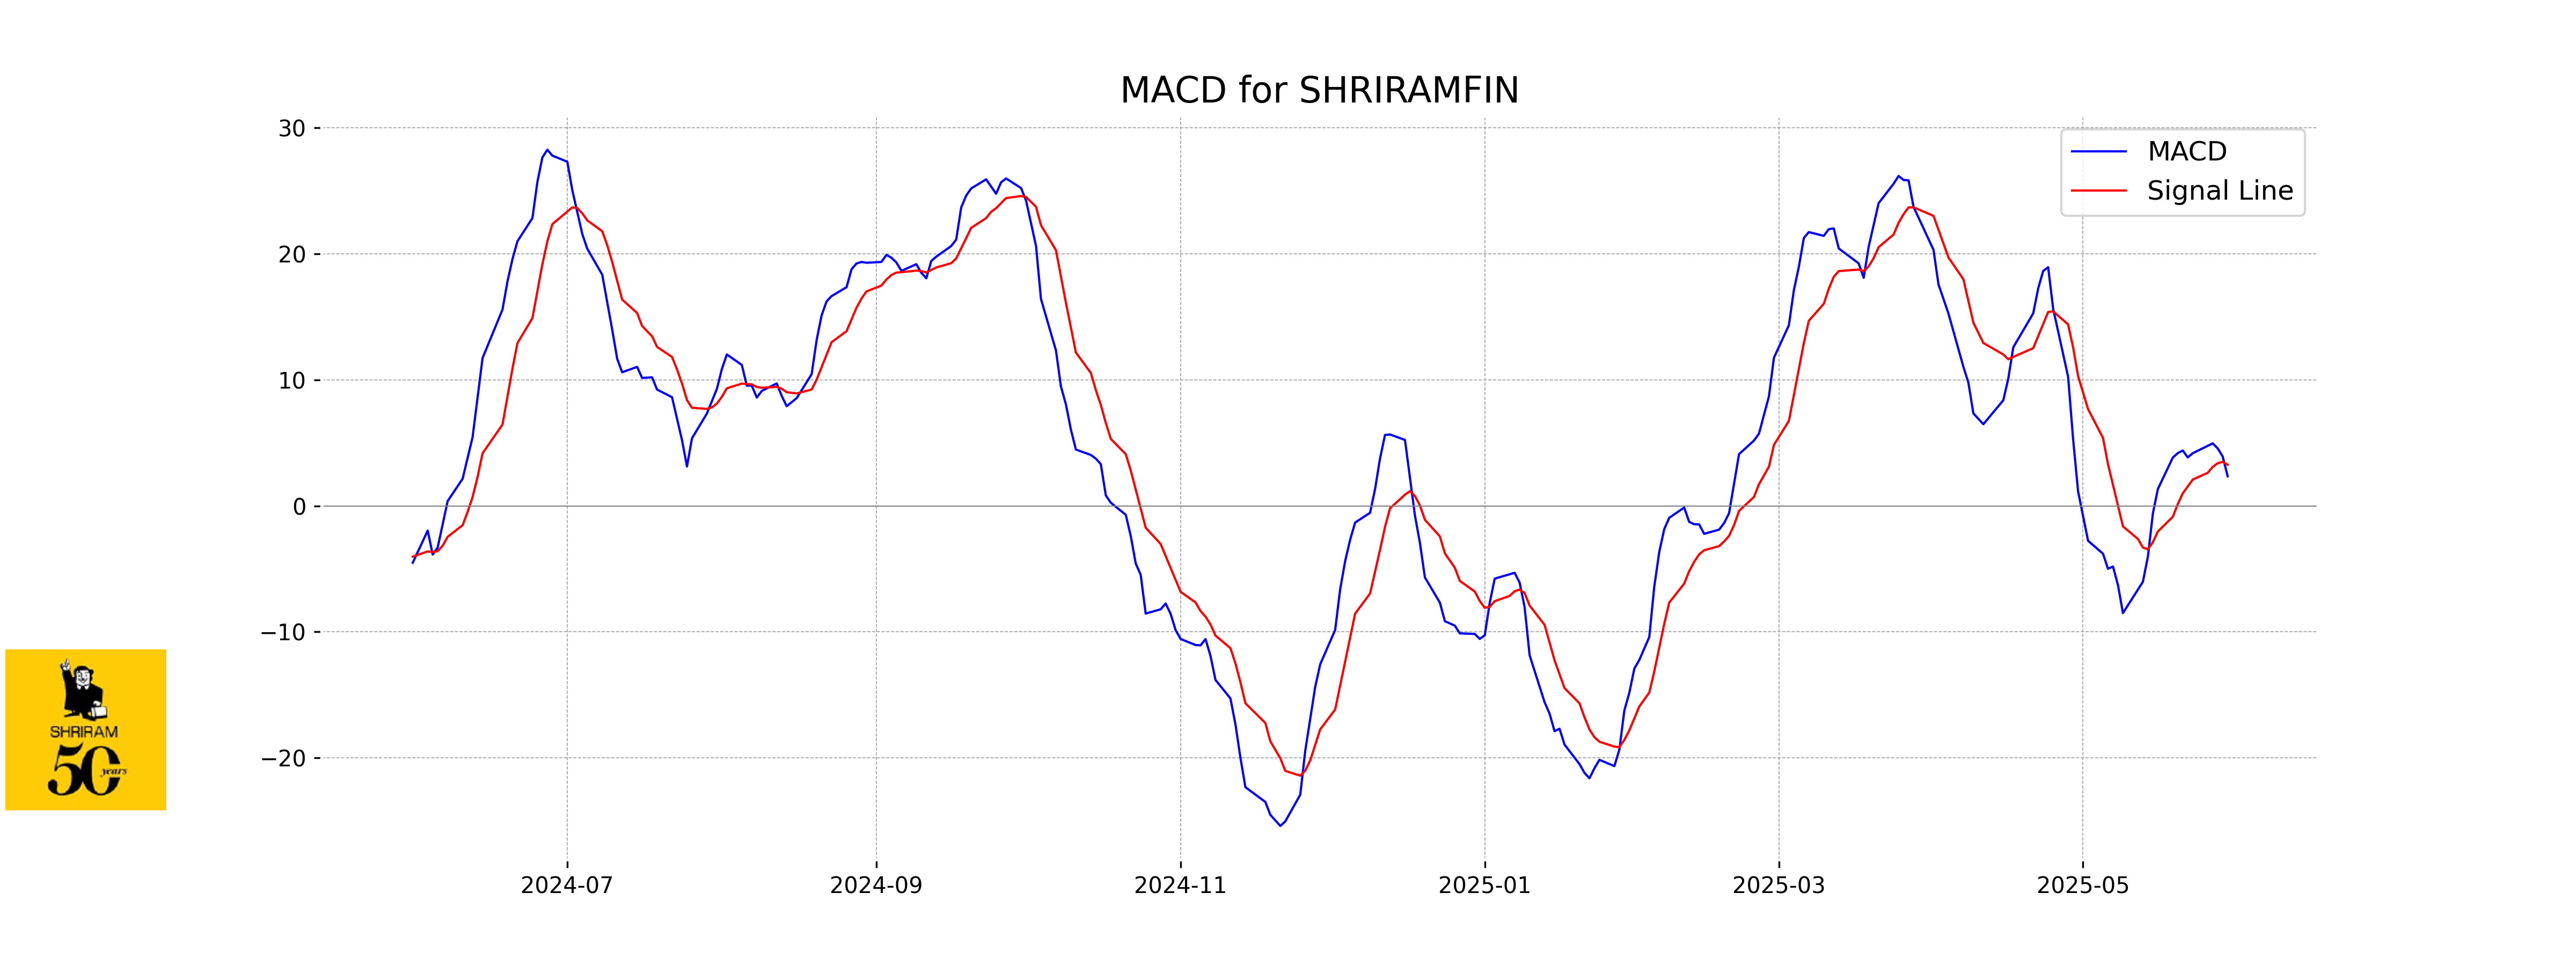
Moving Averages Trend (MACD)
The MACD for Shriram Finance is 2.35, with a signal line of 3.26, indicating a potential bearish crossover as the MACD is below the signal line. This suggests that the stock might experience a downward momentum in the near term.
RSI Analysis
Shriram Finance currently has an RSI of 46.38, indicating that it is neither in the overbought nor the oversold territory. This suggests that the stock is in a neutral zone, and no immediate reversal signals are present based on RSI alone.
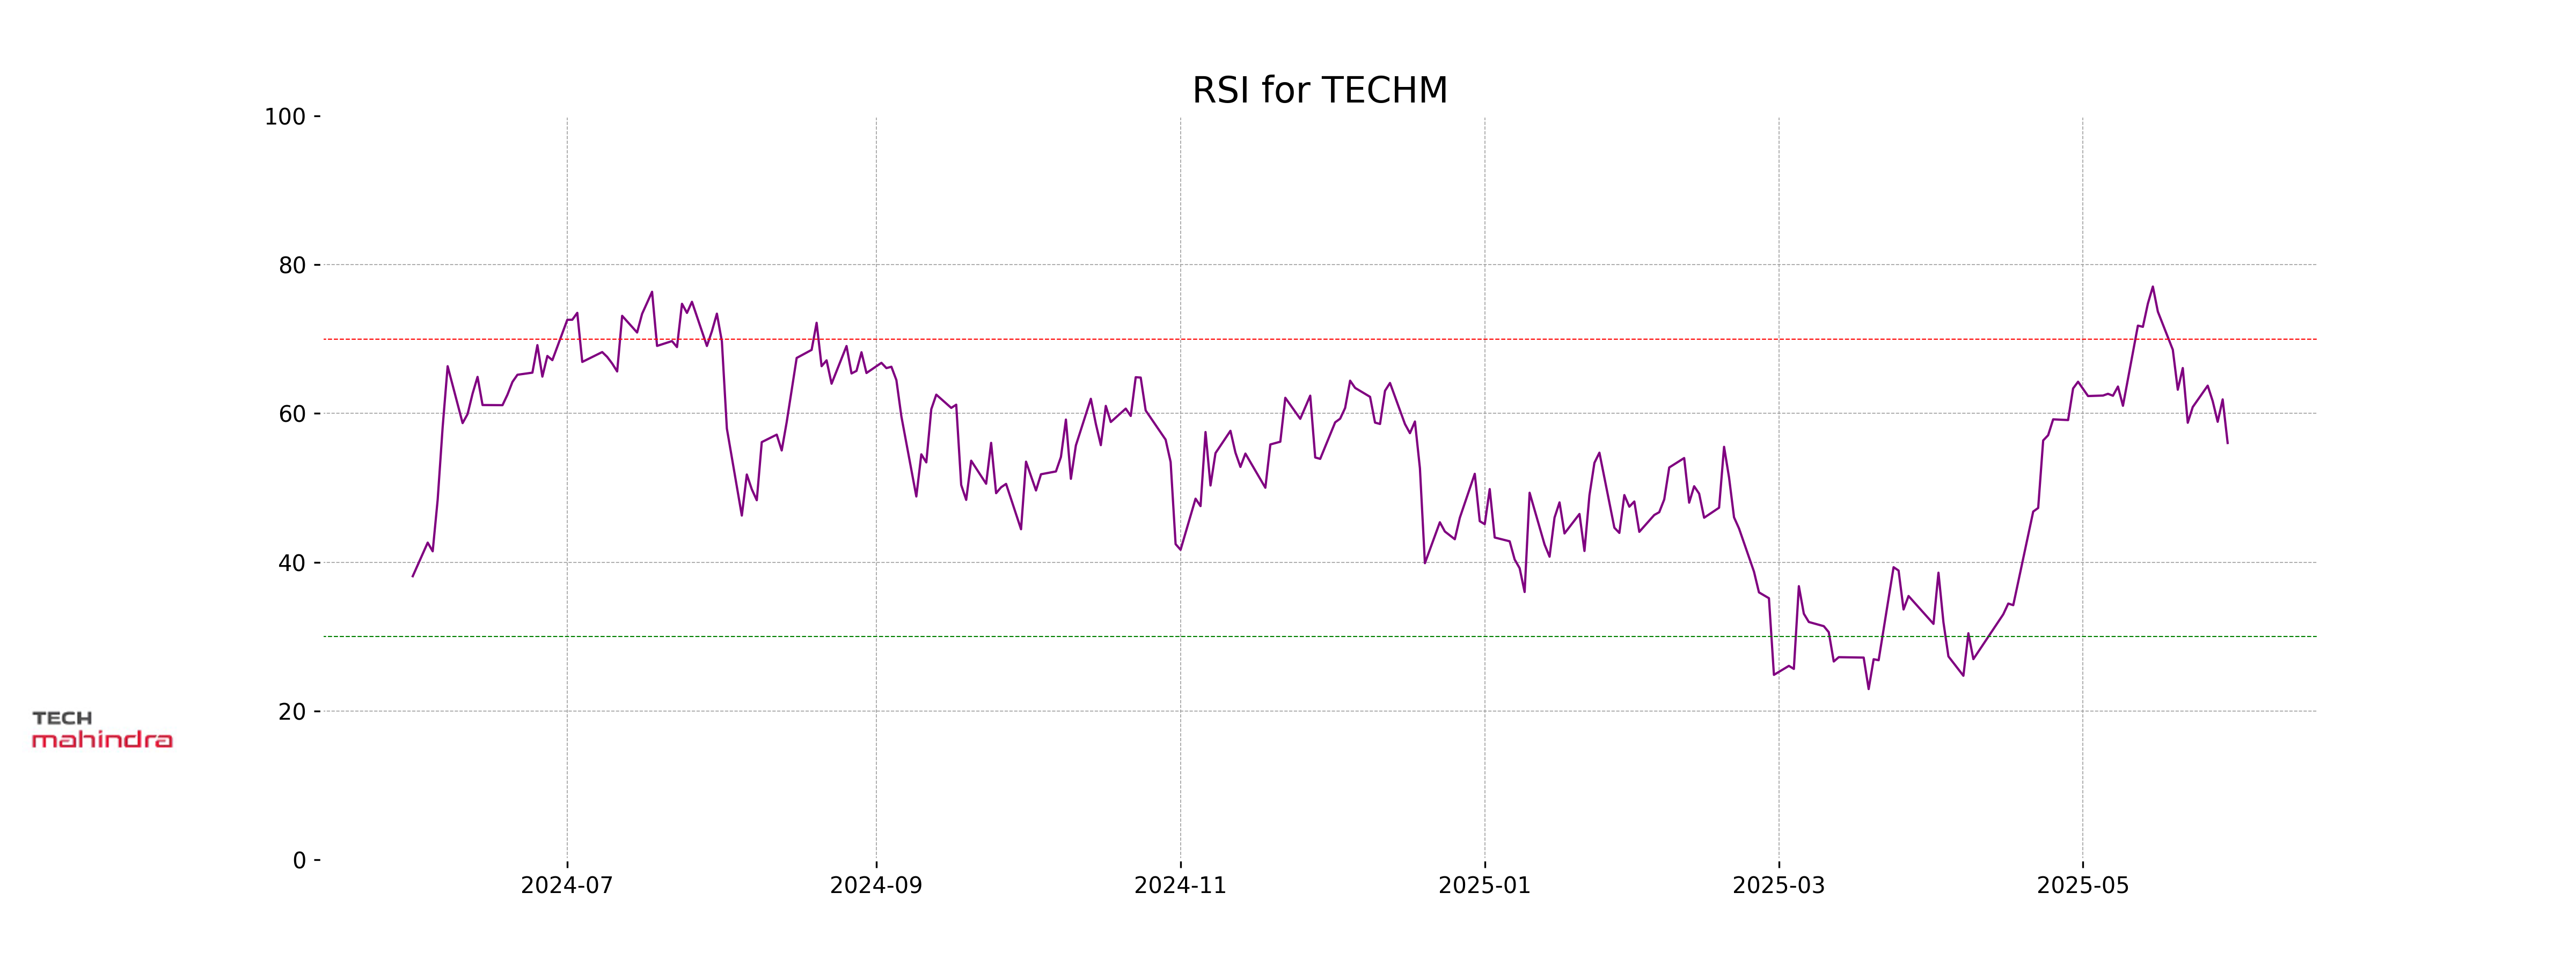
Analysis for Tech Mahindra - May 30, 2025
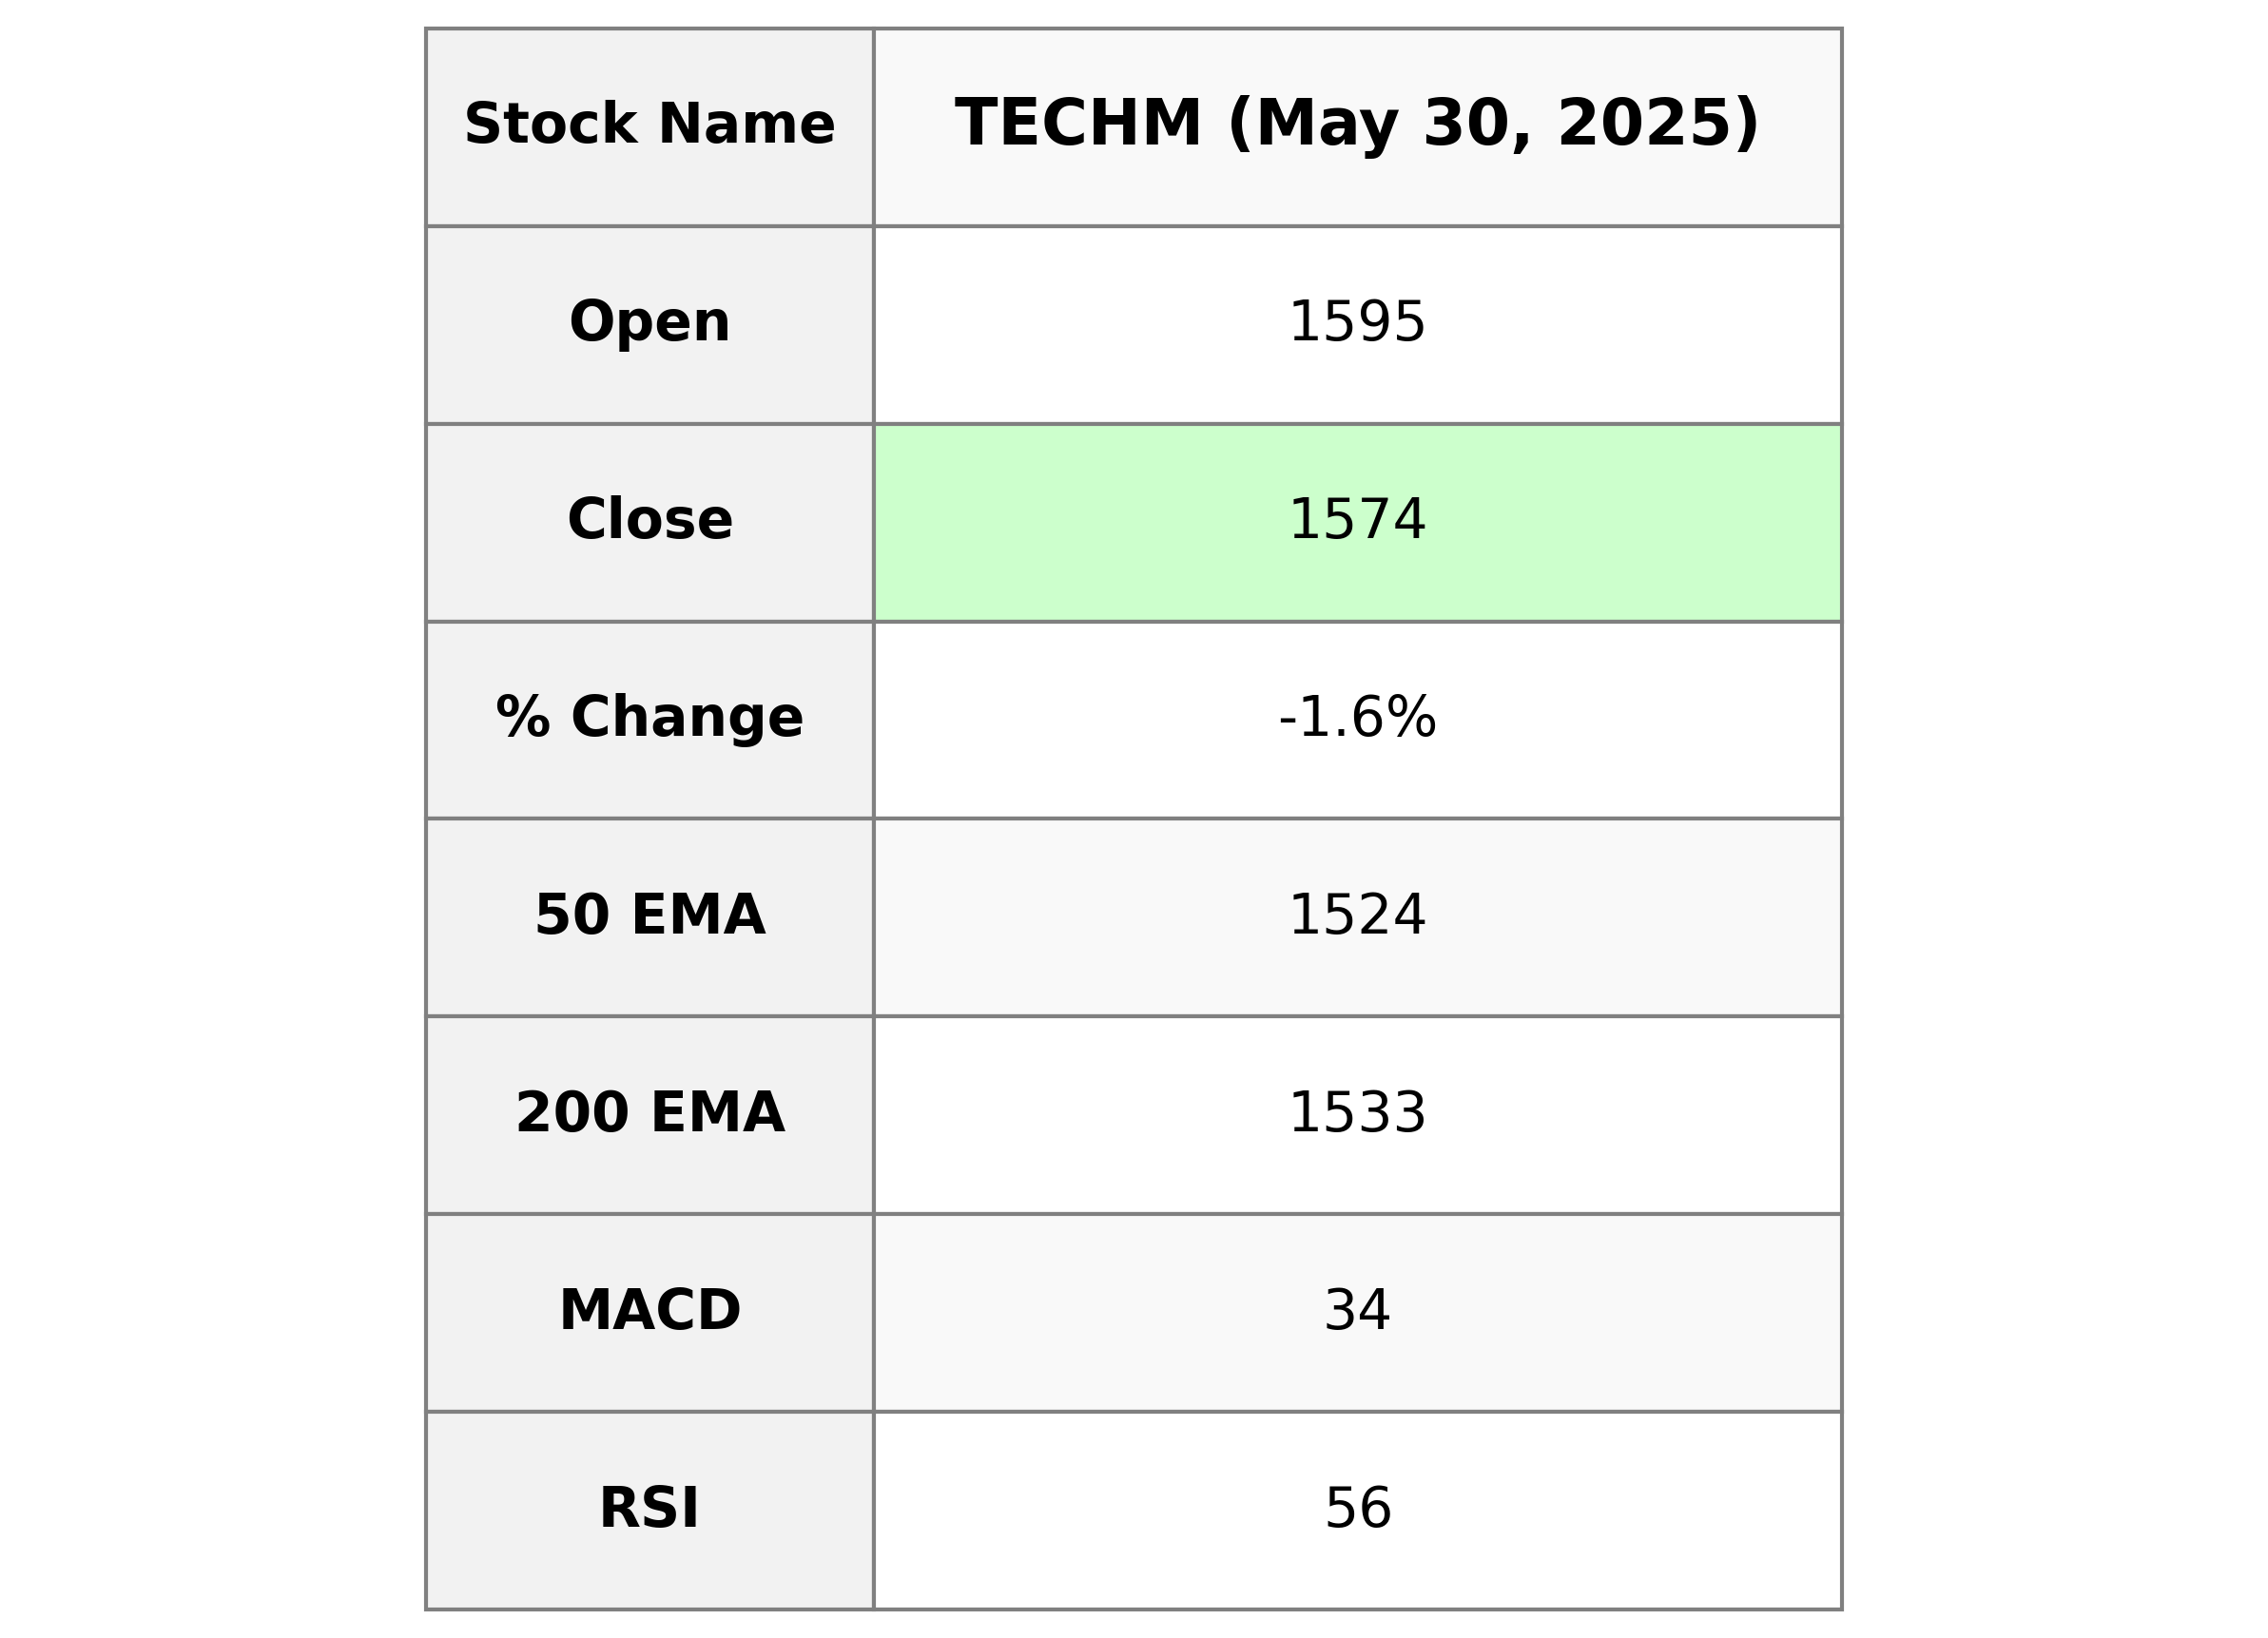
Tech Mahindra, a major player in the Technology sector from India, showed a decline in performance with its stock closing at 1573.9, down by 1.63% from the previous close. The company has a strong market presence with a market cap of 1,392.76 billion INR. Despite the recent drop, the stock's relative strength index (RSI) at 56.03 suggests a relatively stable market position.
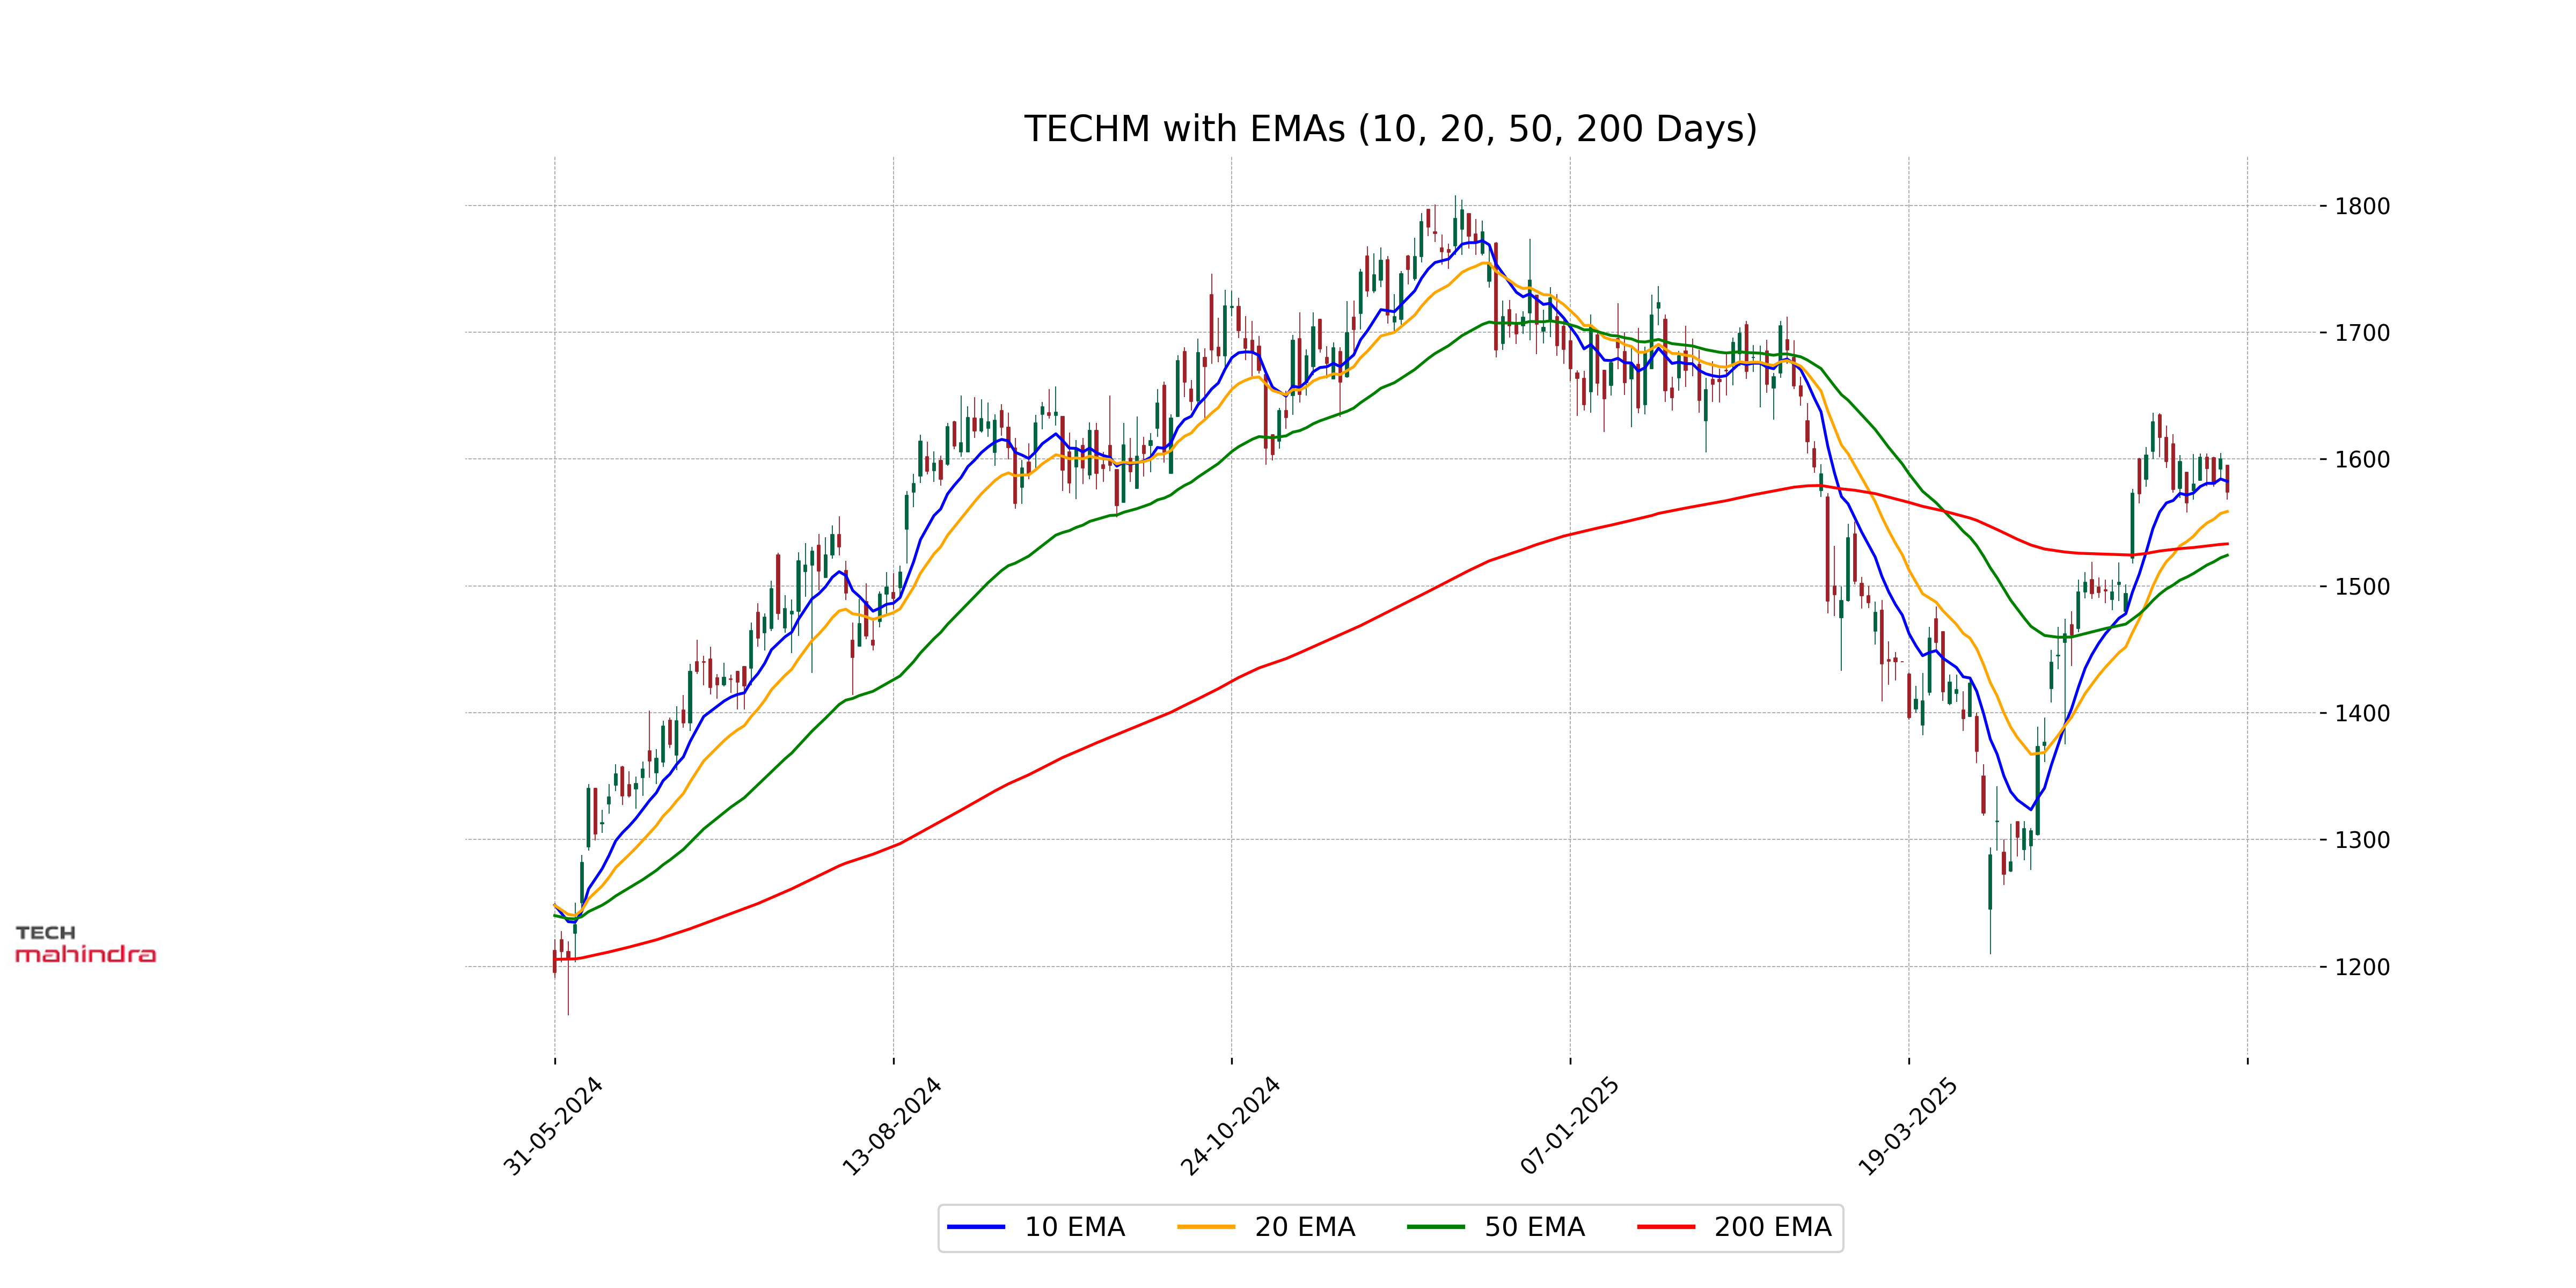
Relationship with Key Moving Averages
Tech Mahindra's closing price of 1573.90 is above its 50 EMA of 1524.14 and its 200 EMA of 1533.10 but below its 10 EMA of 1582.38. This suggests a short-term weakness as the price is below the 10 EMA while maintaining strength above the longer-term averages.
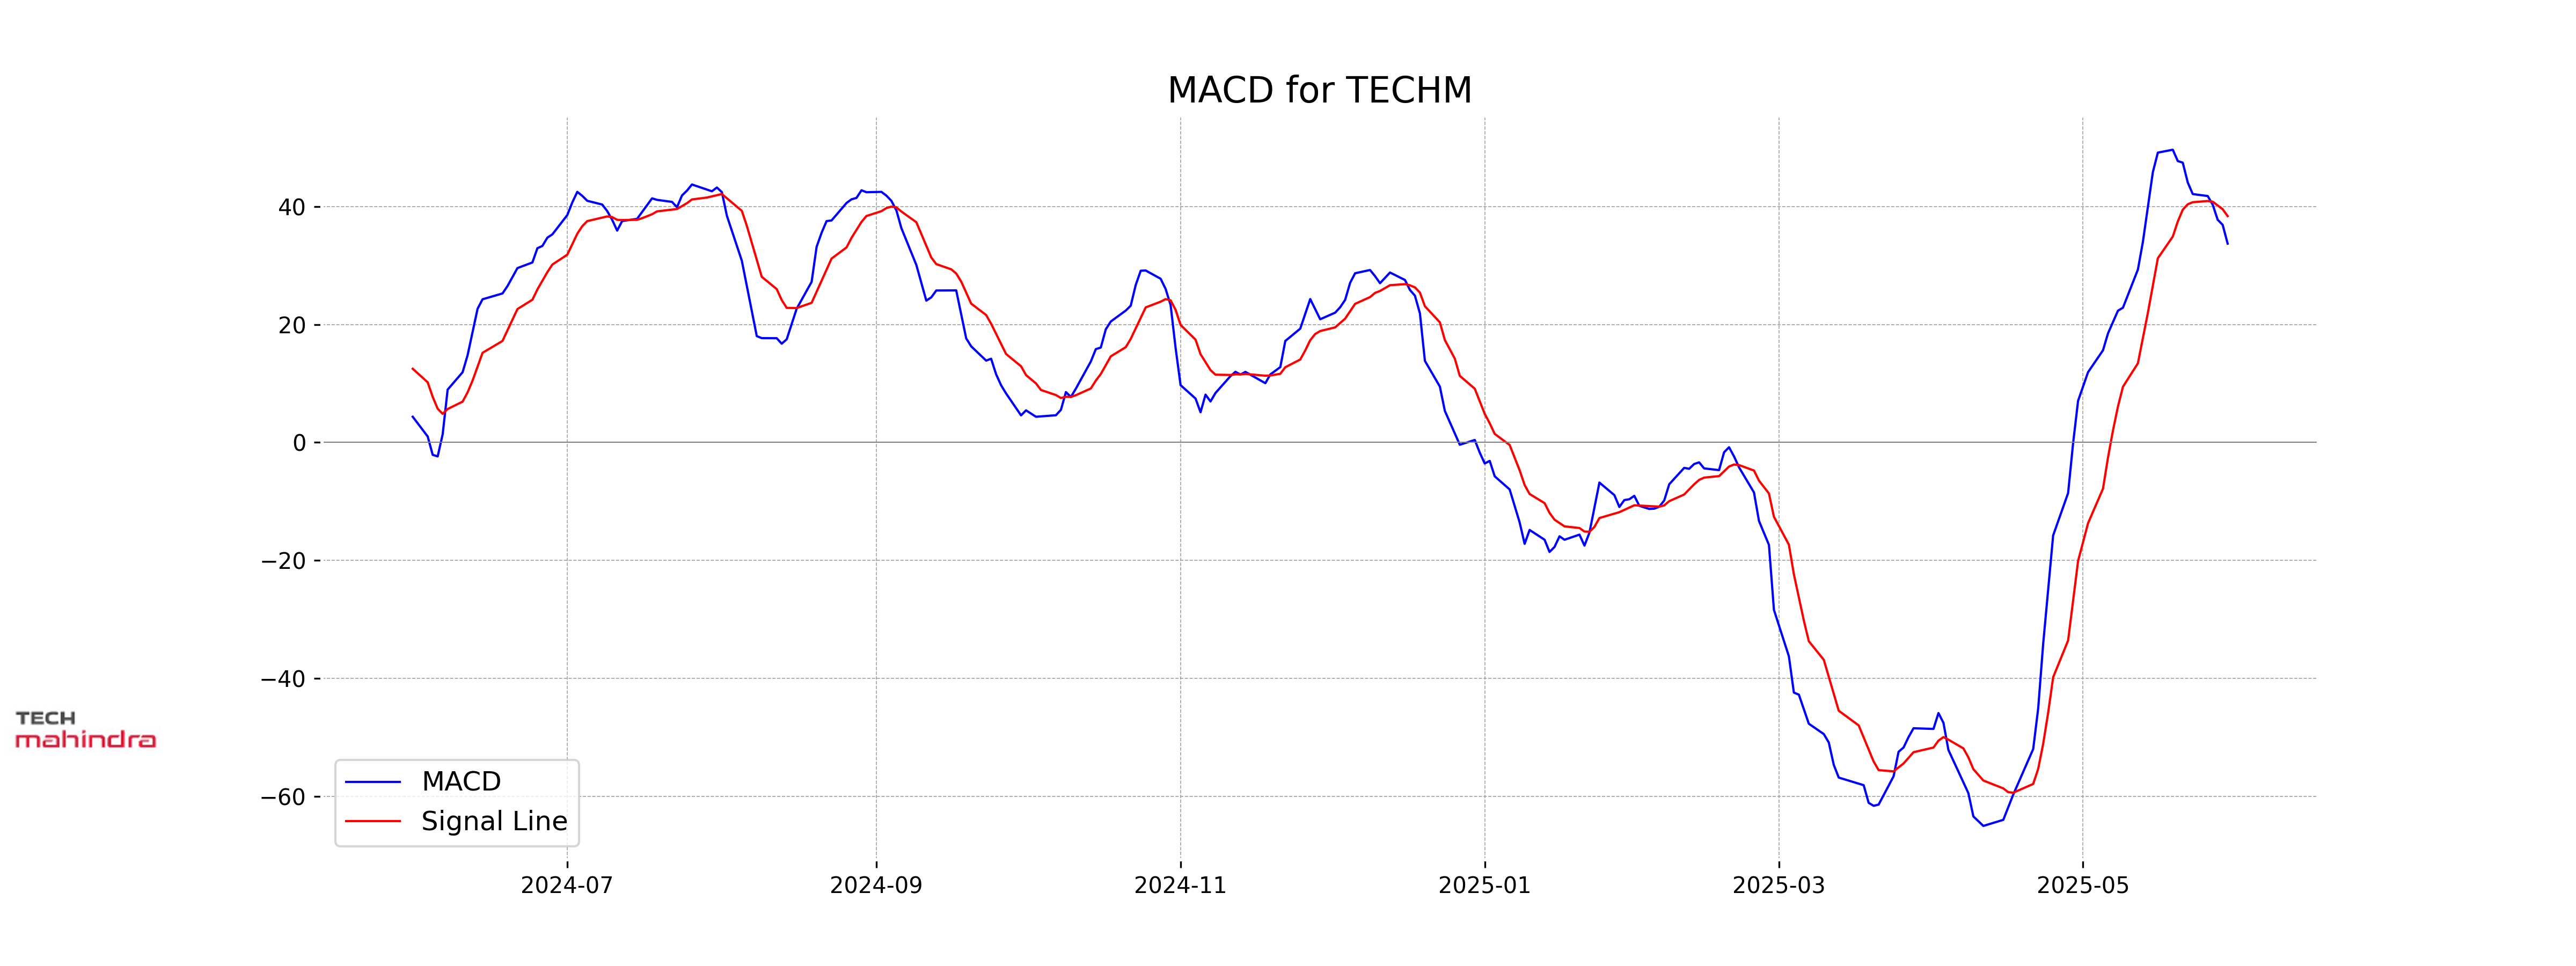
Moving Averages Trend (MACD)
Tech Mahindra's MACD value is 33.72, which is below its MACD Signal of 38.39. This indicates a bearish signal as the MACD line is below the signal line, suggesting potential downward momentum in the stock price. Investors should consider this as a point of caution if they are planning trades based on MACD analysis.
RSI Analysis
Tech Mahindra's RSI stands at 56.03, suggesting that it is in a neutral zone. This value indicates that the stock is neither overbought nor oversold, providing a balanced signal for investors.
Up Next
NSE Nifty 50: Top 5 stock losers of May 30, 2025

India, New Zealand conclude FTA talks; pact to offer duty-free access, USD 20 bn FDI

FTA with New Zealand to significantly deepen bilateral economic engagement: Govt

Rupee breaches 91-mark against US dollar for first time in intra-day trade

Microsoft commits USD 17.5 billion investment in India: CEO Satya Nadella

CBI books Anil Ambani's son, Reliance Home Finance Ltd. in Rs 228 crore bank fraud case

More videos

RBI raises FY26 GDP growth projection to 7.3 pc

RBI trims policy interest rate by 25bps to 5.25pc, loans to get cheaper

Rupee slumps to all-time low of 90.25 against US dollar in intra-day trade

Reliance completes merger of Star Television Productions with Jiostar

India to lead emerging market growth with 7pc GDP rise in 2025: Moody’s

Nifty hits record high after 14 months; Sensex nears all-time peak

Reliance stops Russian oil use at its only-for-export refinery to comply with EU sanctions

ED attaches fresh assets worth over Rs 1,400 cr in case against Anil Ambani's Reliance Group

India signs one-year deal to import 2.2 million tonnes of LPG from US

India International Trade Fair begins at Pragati Maidan amid tight security