


Highlights
- Auto stocks show strength despite recent pullbacks
- MACD trend signals bullish momentum across board
- RSI levels indicate neutral to bullish sentiment
Latest news

Oppo Enco Buds3 Pro+ Review: ANC That Actually Works Under ₹2,500

Permission denied for Vijay Hazare trophy match at Chinnaswamy Stadium on December 24

Protesters march to Bangladesh Deputy High Commission in Kolkata to protest violence on Hindus

BJP’s national working president Nitin Nabin leads roadshow in Patna

Bangladesh summons Indian envoy over security concerns for missions

Passenger beaten by off-duty Air India Express pilot suffers nasal fracture, seeks justice

Over 270 flights delayed, 10 cancelled at Delhi airport

Fresh snowfall, rain hit parts of Kashmir as temperatures stay above freezing point
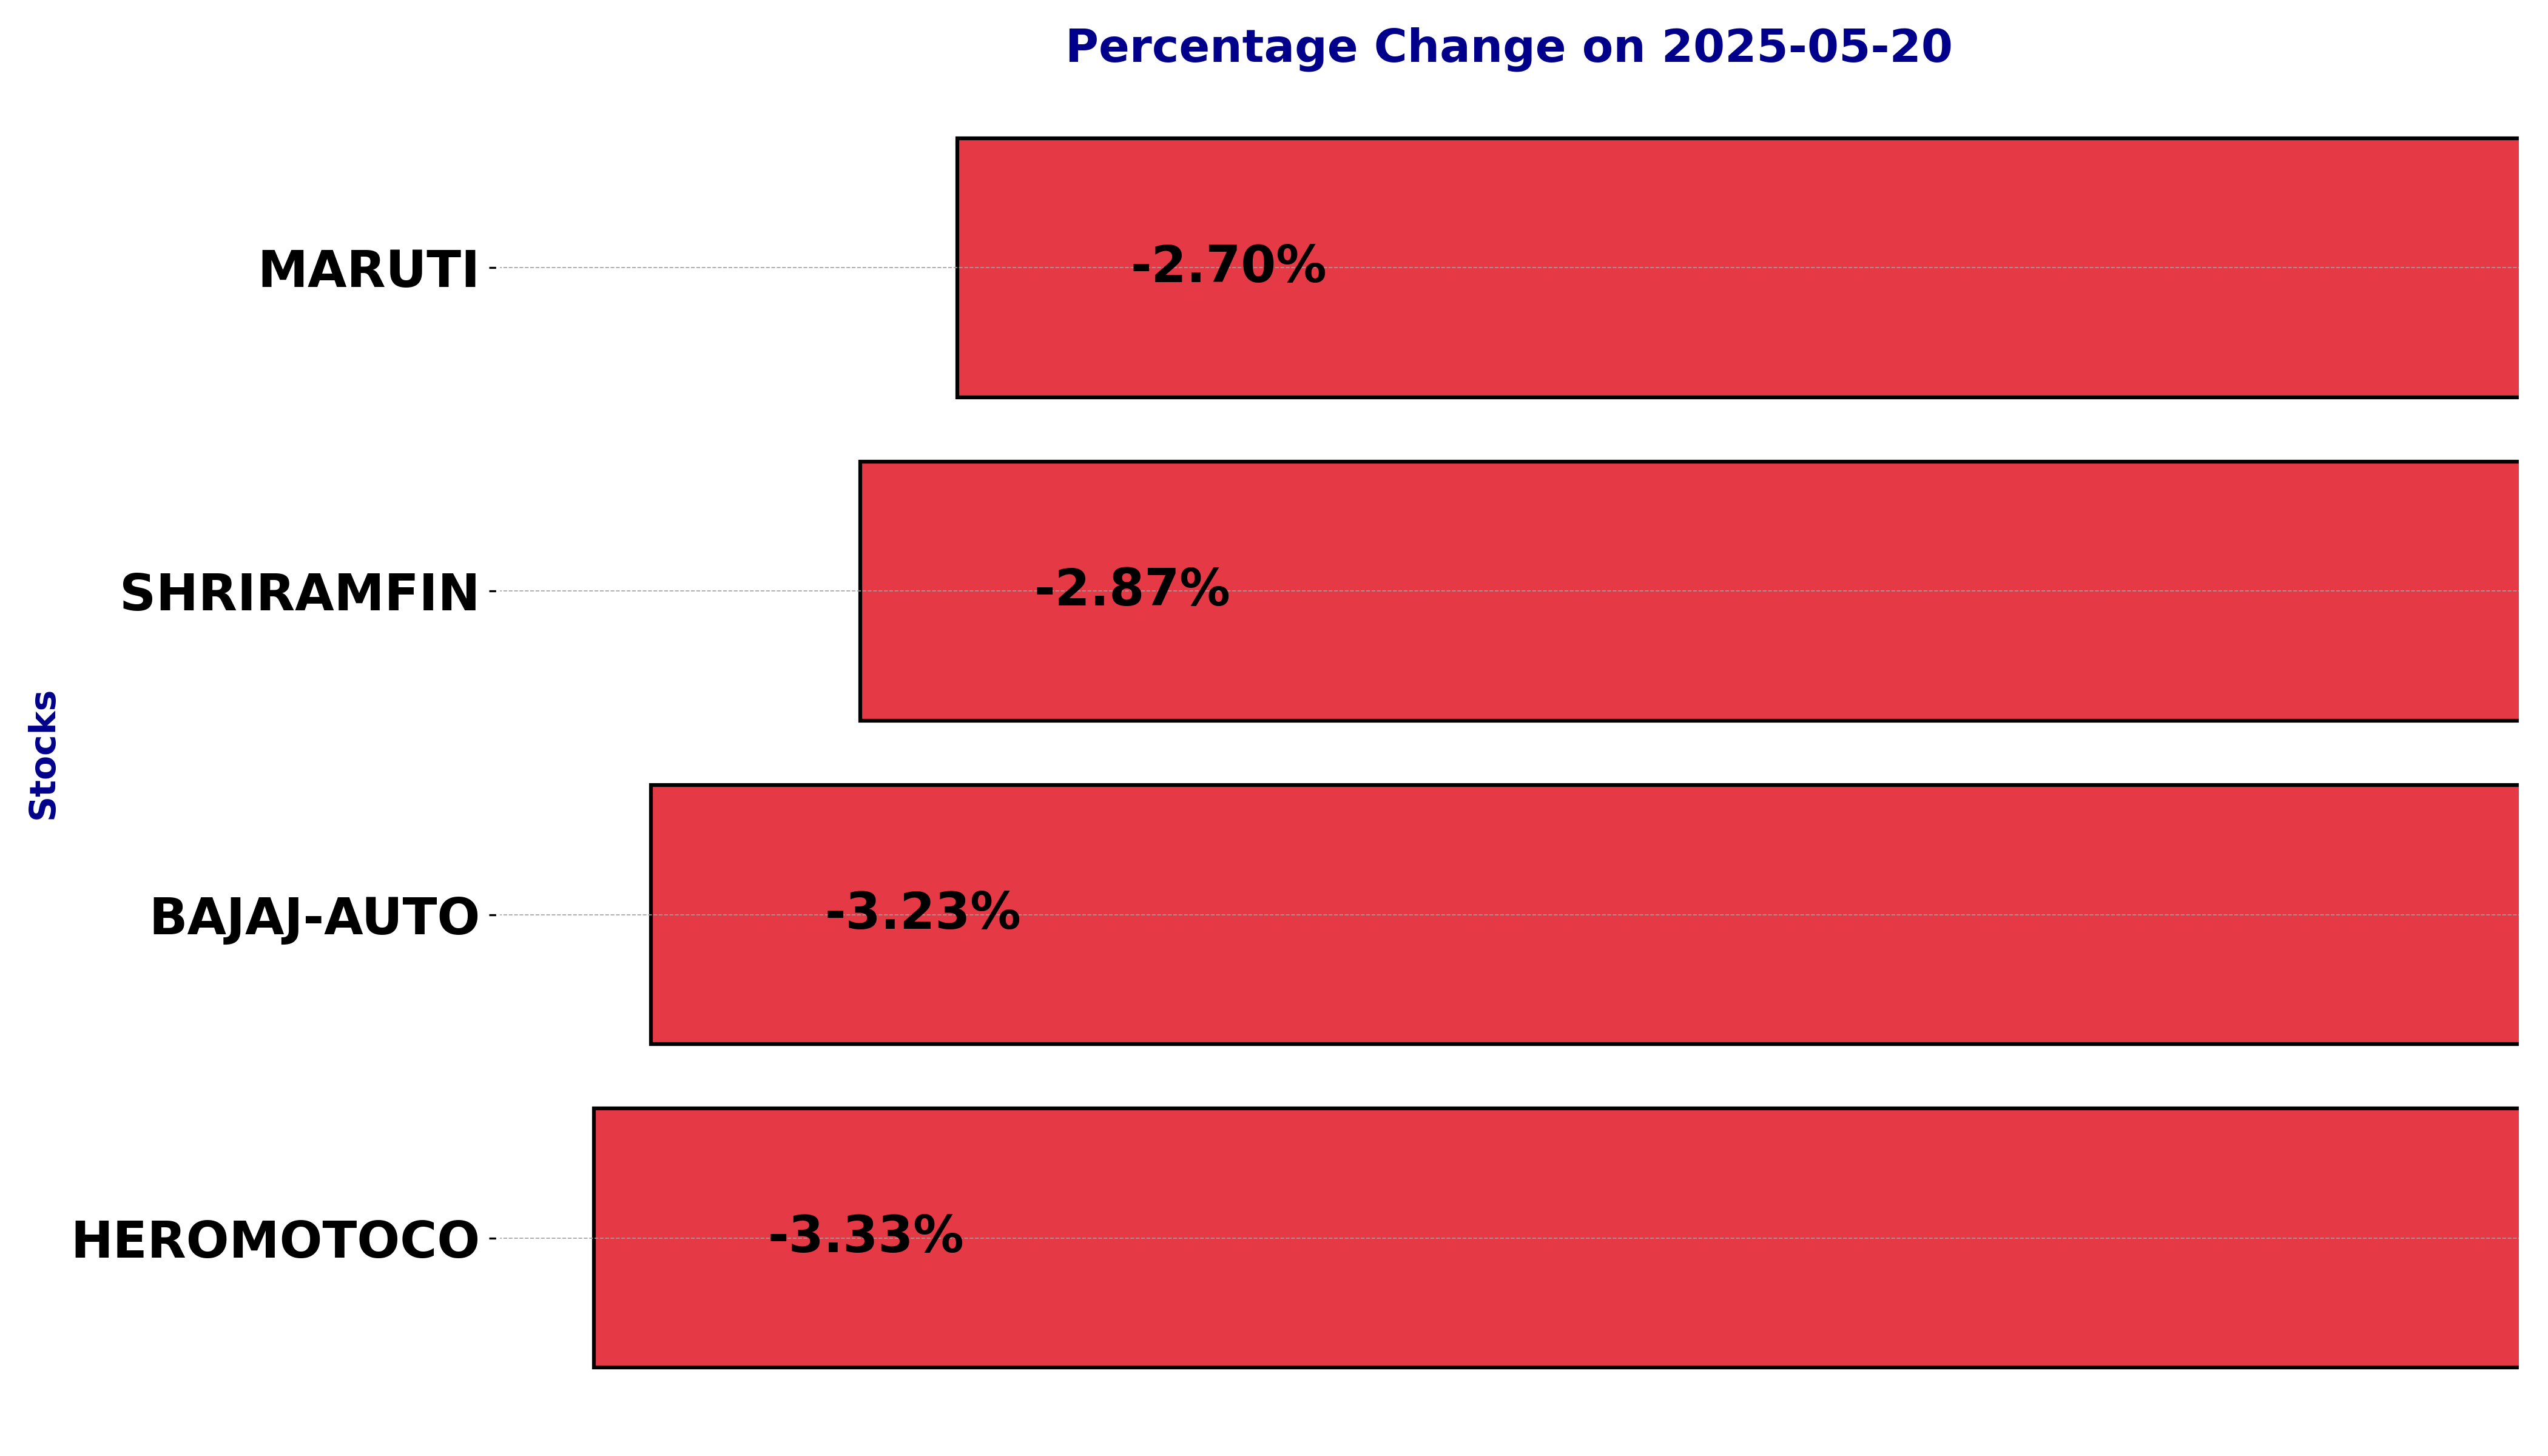
NSE Nifty 50: Top 5 stock losers of May 20, 2025


In this article, we will explore the technical indicators of some of the low-performing stocks on the Indian stock market, including BAJAJ-AUTO, HEROMOTOCO, MARUTI, and SHRIRAMFIN.
By looking at these stocks through the lens of key technical factors, we aim to better understand their price movements, trends, and potential future performance.
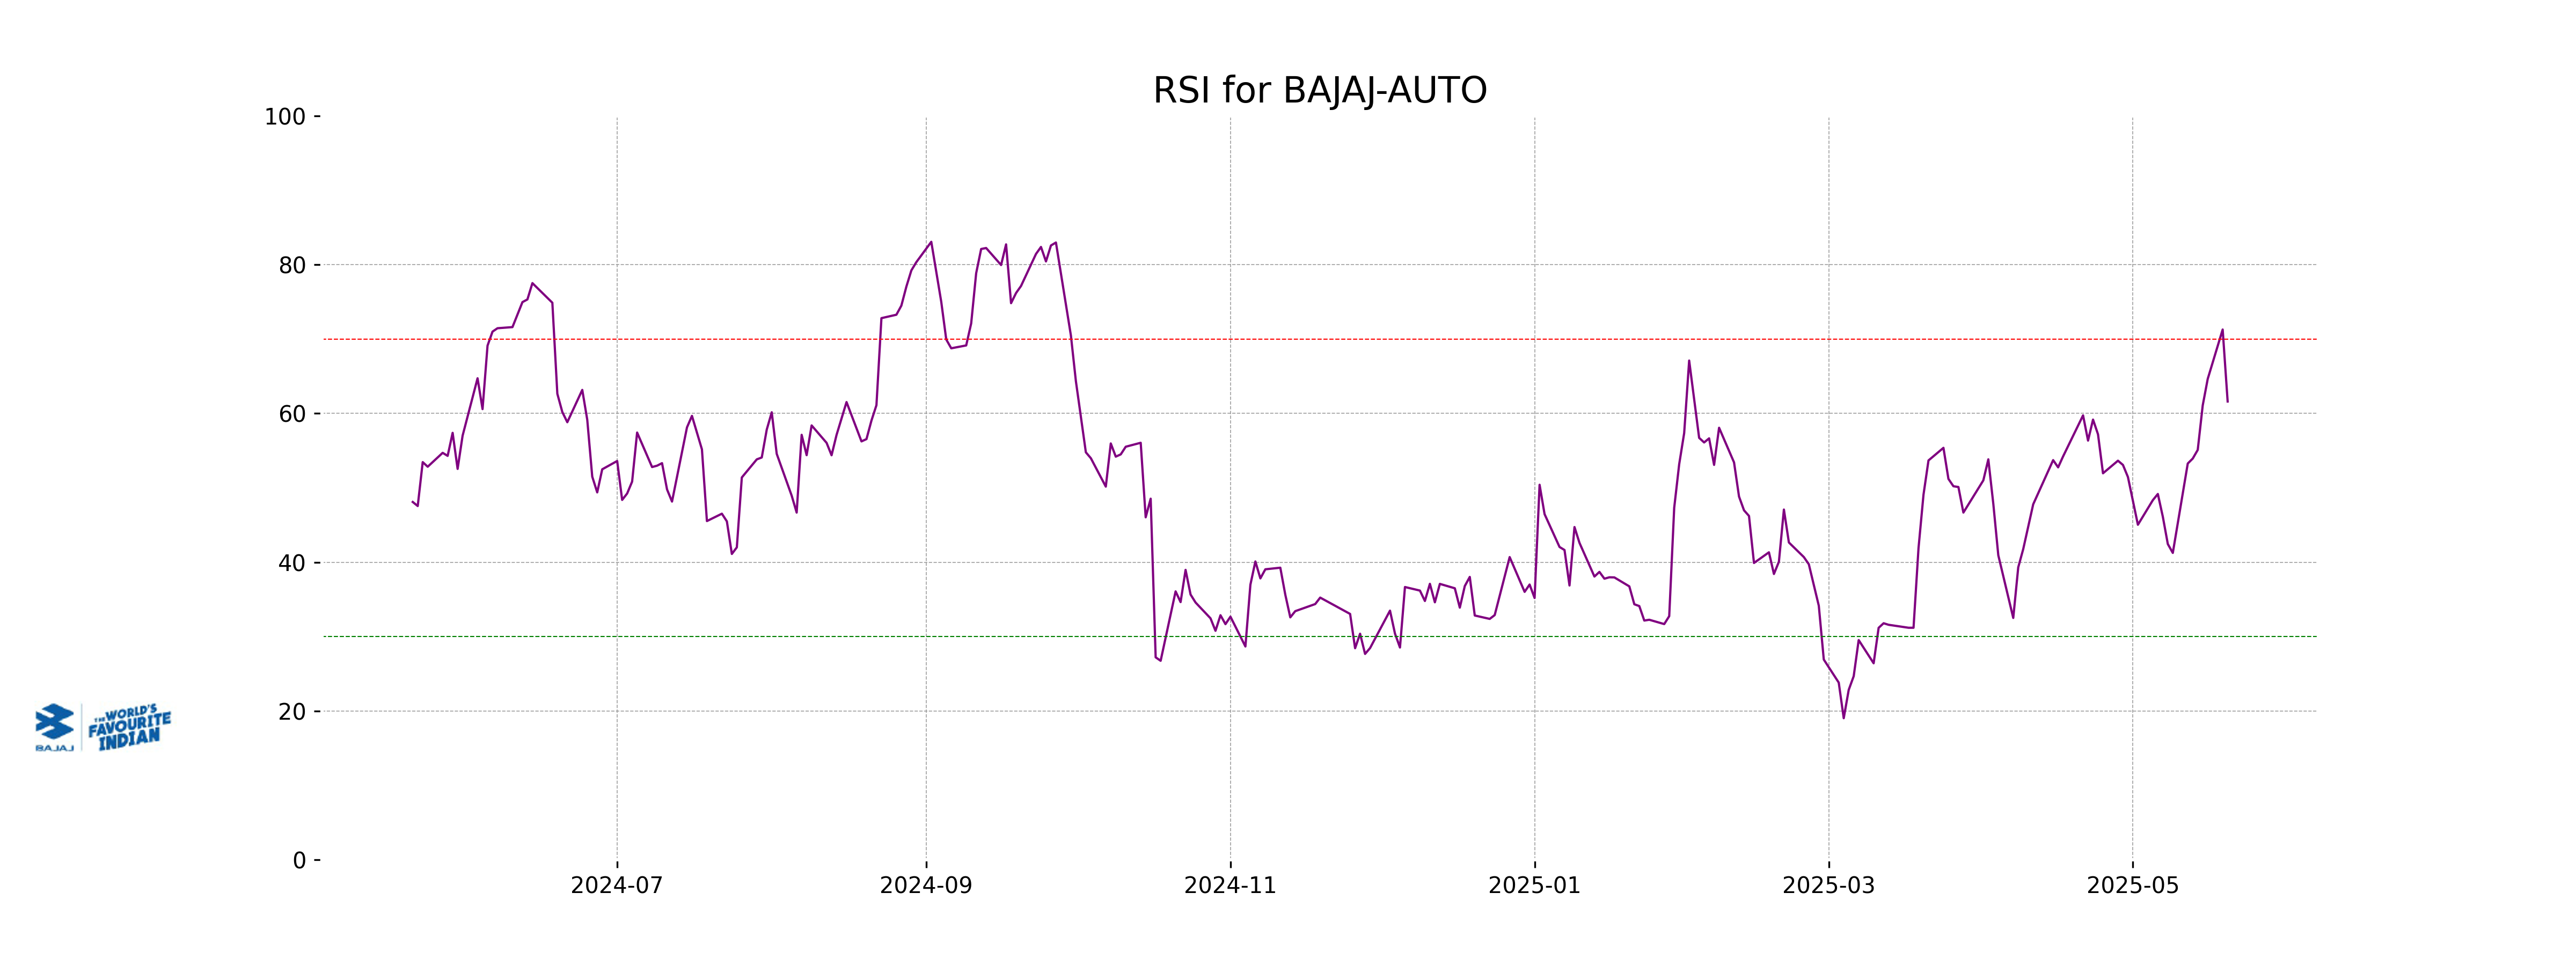
Analysis for Bajaj Auto - May 20, 2025
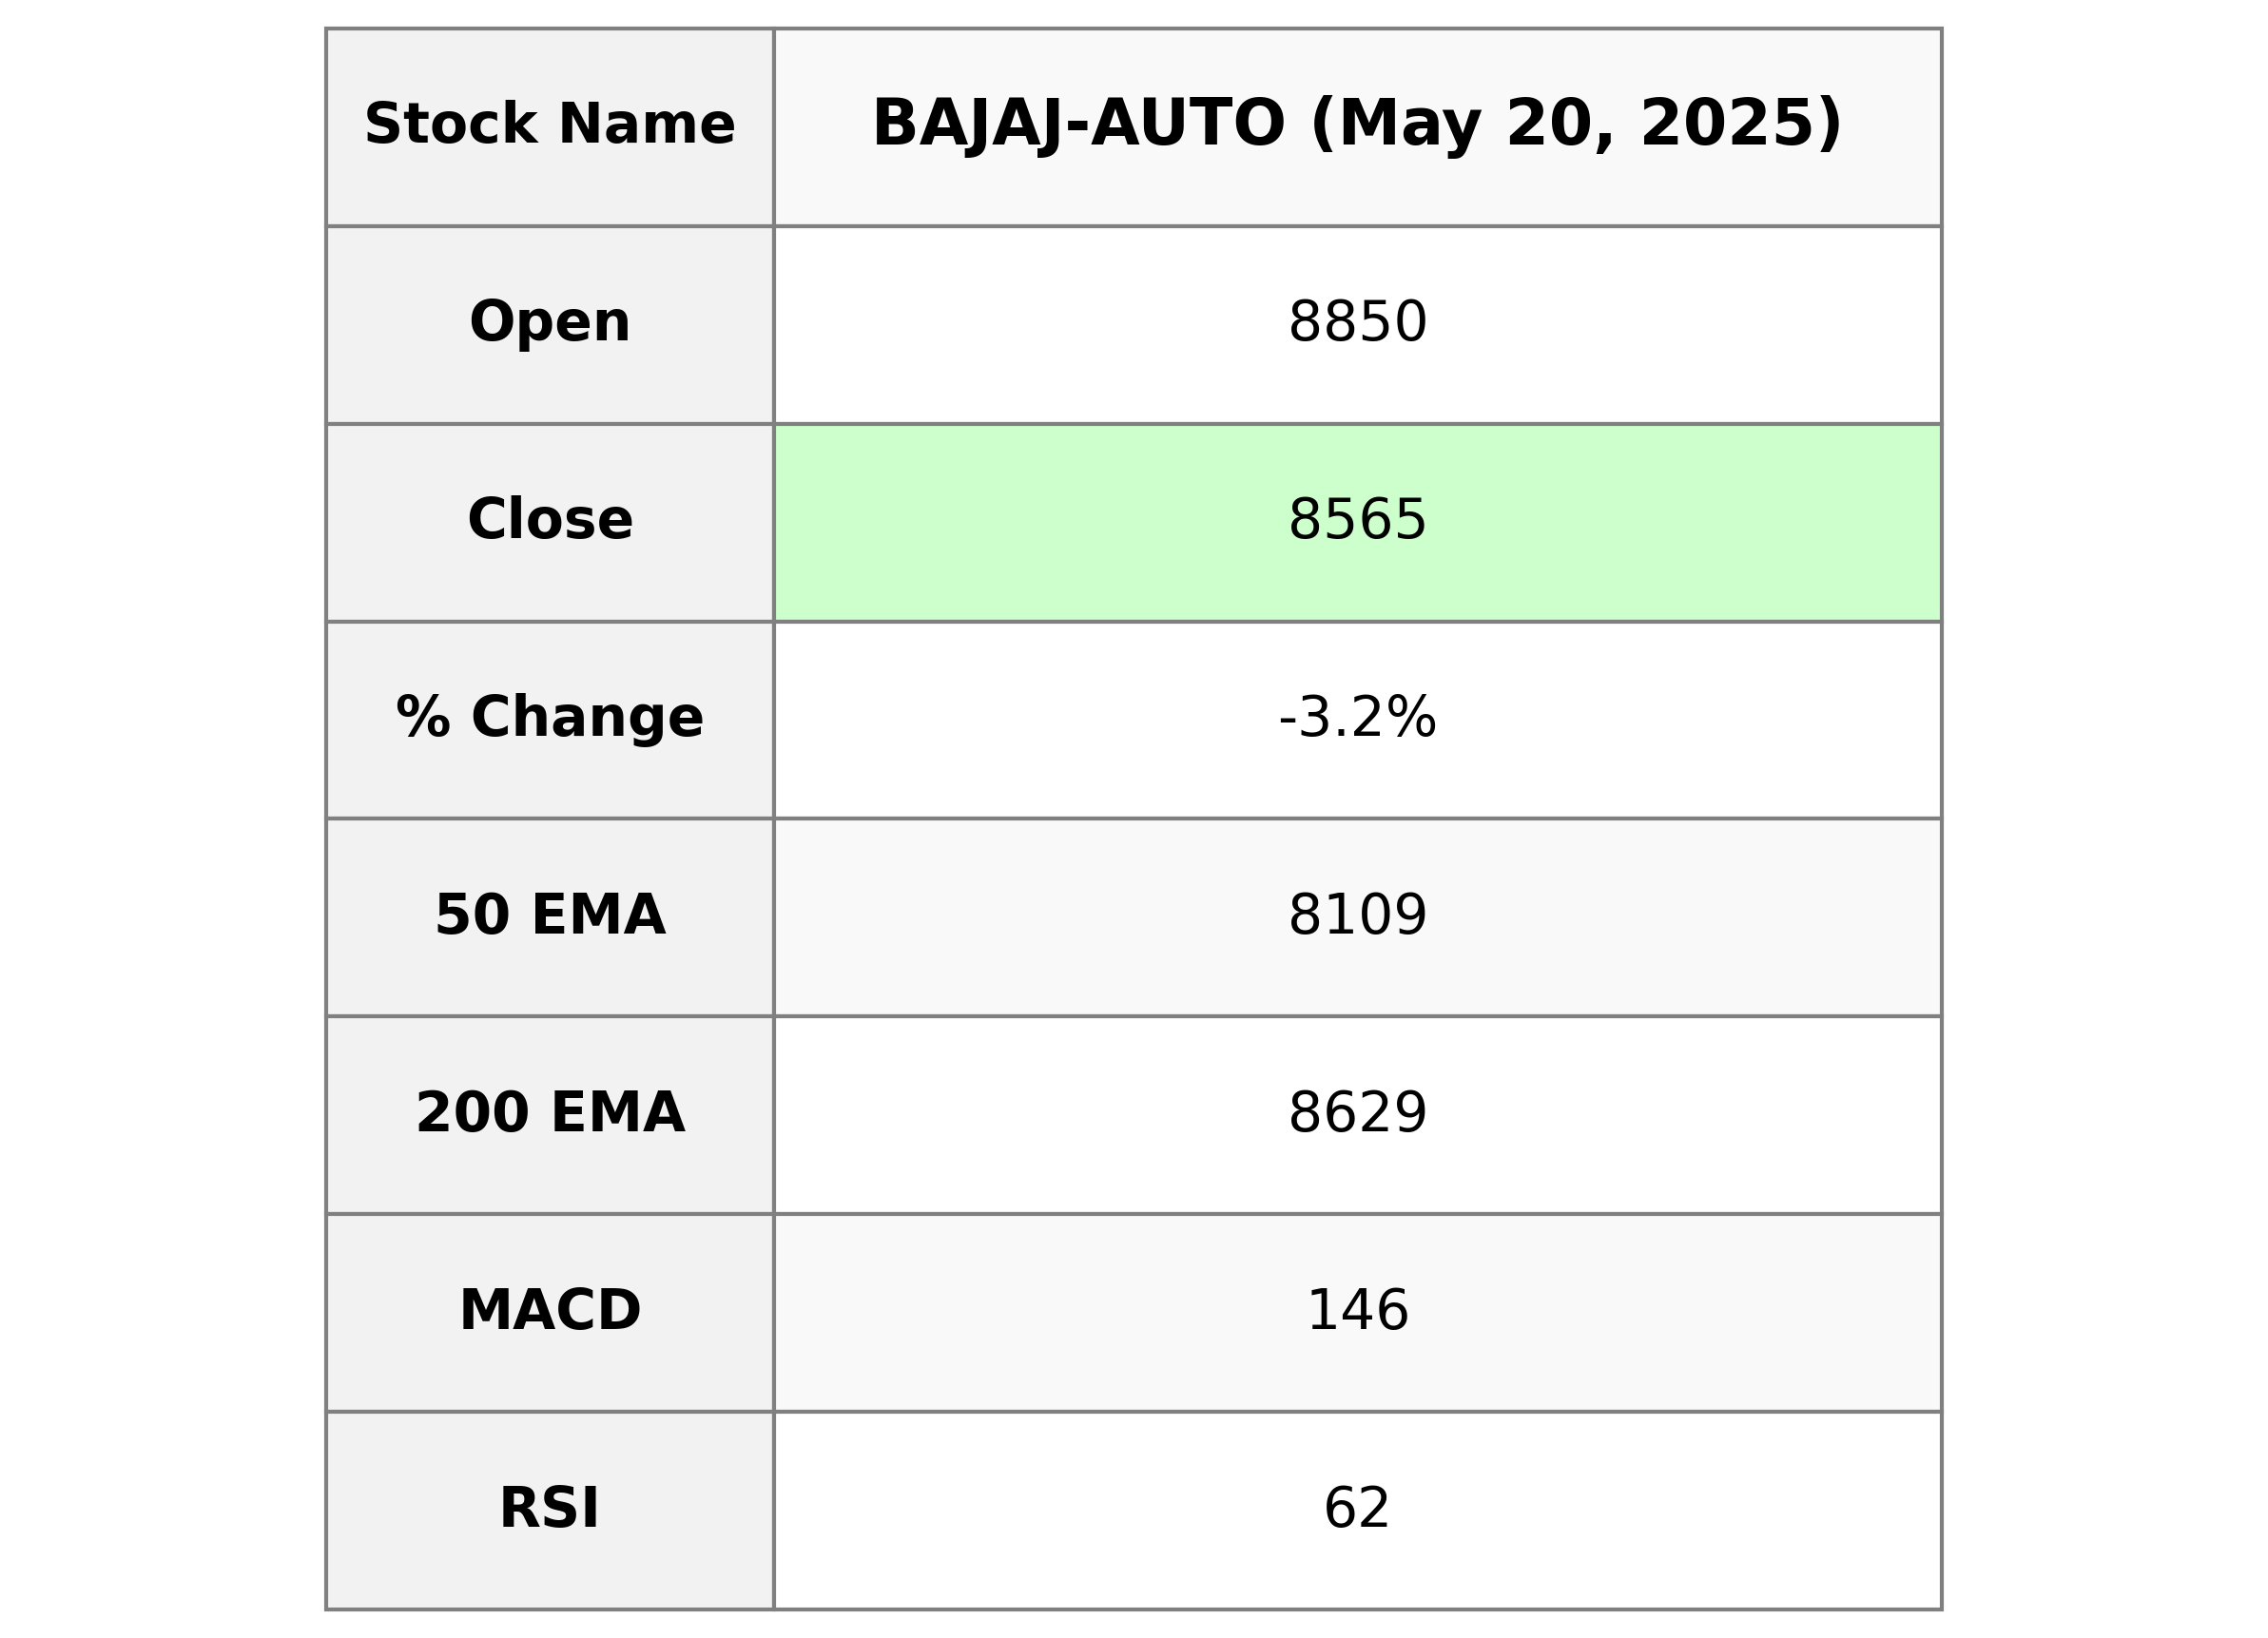
Bajaj Auto experienced a decline in its stock price, with the closing price at 8565.0, down from a previous close of 8851.0, reflecting a percentage change of -3.23%. Despite this drop, the stock remains above its 50-day EMA of 8108.71, indicating a relatively strong position in the short-term market. With an RSI of 61.60, the stock is neither overbought nor oversold, suggesting a stable market sentiment.
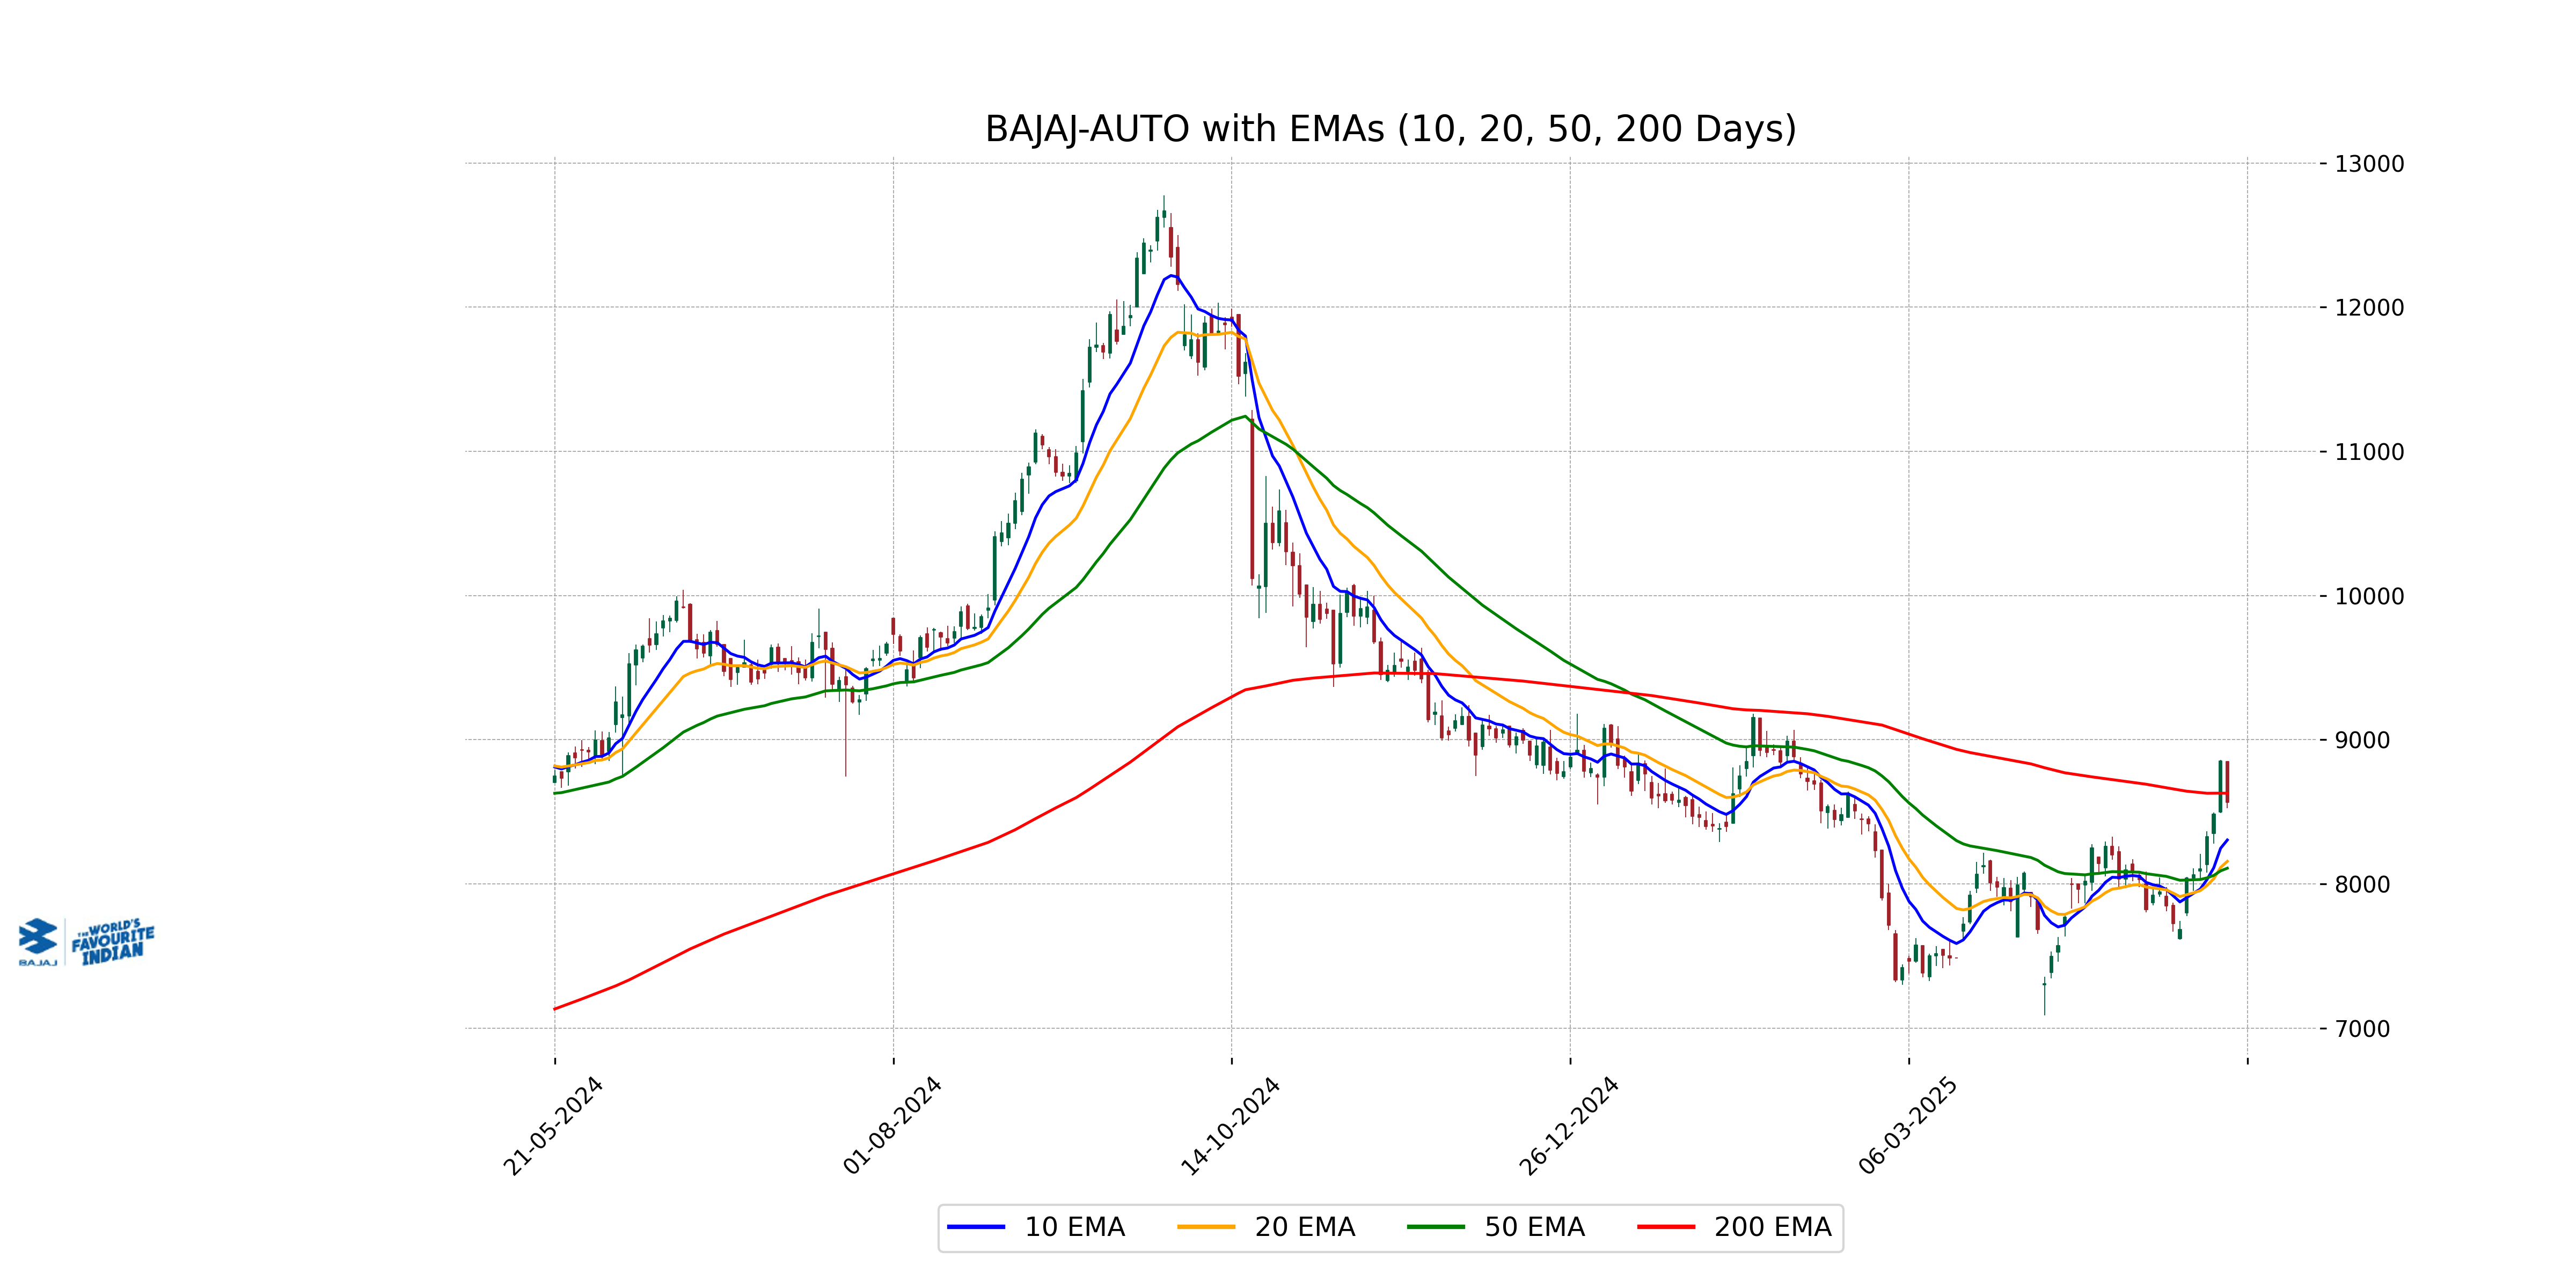
Relationship with Key Moving Averages
Bajaj Auto is currently trading close to the 200-day EMA of 8628.67 but significantly above the 50-day EMA of 8108.71, indicating a generally bullish trend over the medium term despite the recent decline. The stock's price is also above the 10-day and 20-day EMAs, reflecting recent upward momentum before the current pullback.
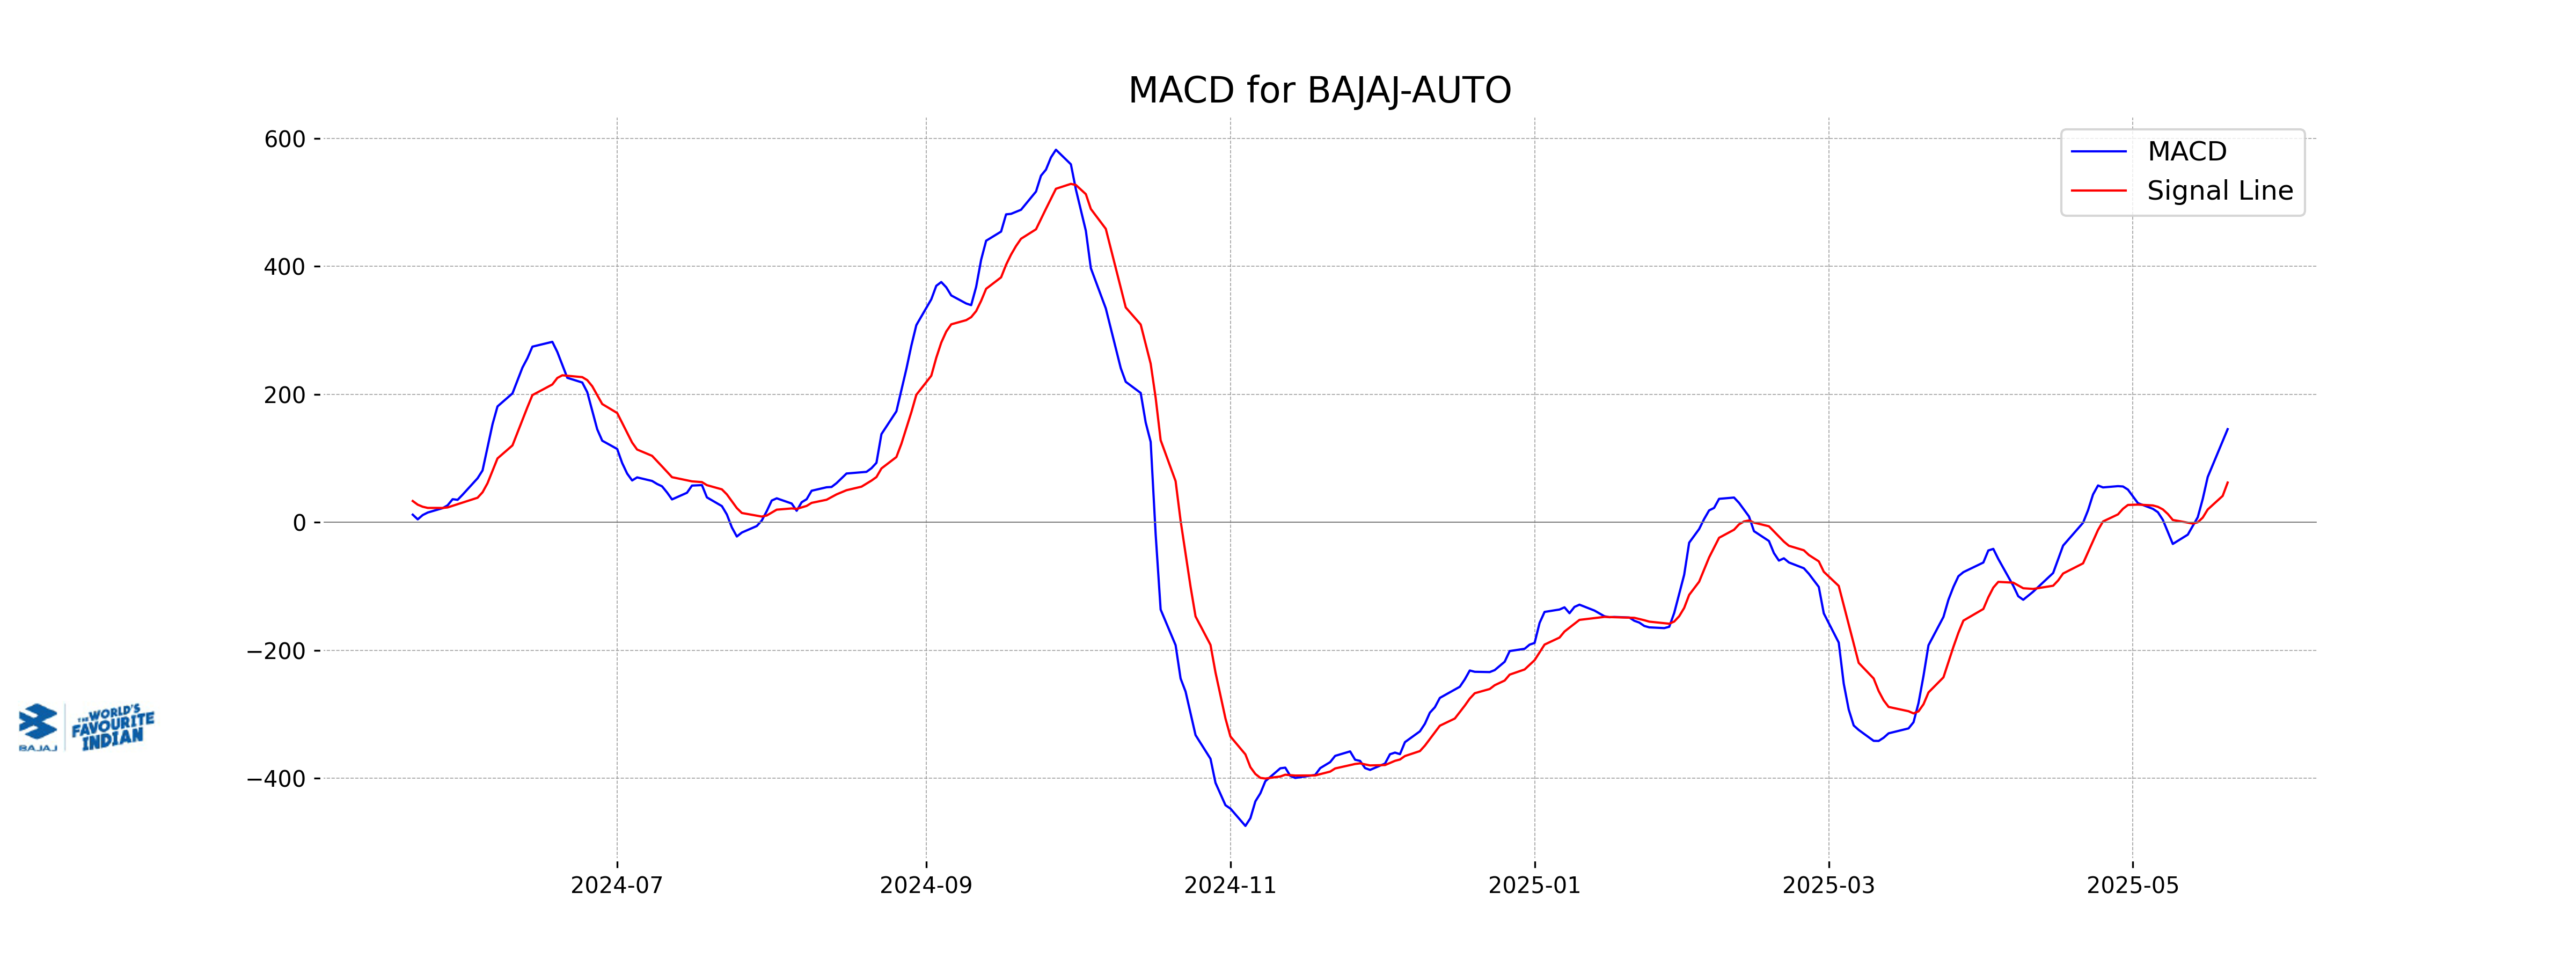
Moving Averages Trend (MACD)
Bajaj Auto shows a positive MACD value of 145.58, which is significantly above the MACD signal line at 62.10. This suggests a bullish trend, indicating that the stock's momentum may continue upward if the trend persists.
RSI Analysis
Bajaj Auto's RSI is 61.60, which is typically interpreted as neutral or indicating no strong momentum in either direction. With an RSI above 50, it leans slightly towards being overbought, suggesting some caution might be warranted for bullish positions. However, it is not in the overbought territory (above 70) yet.
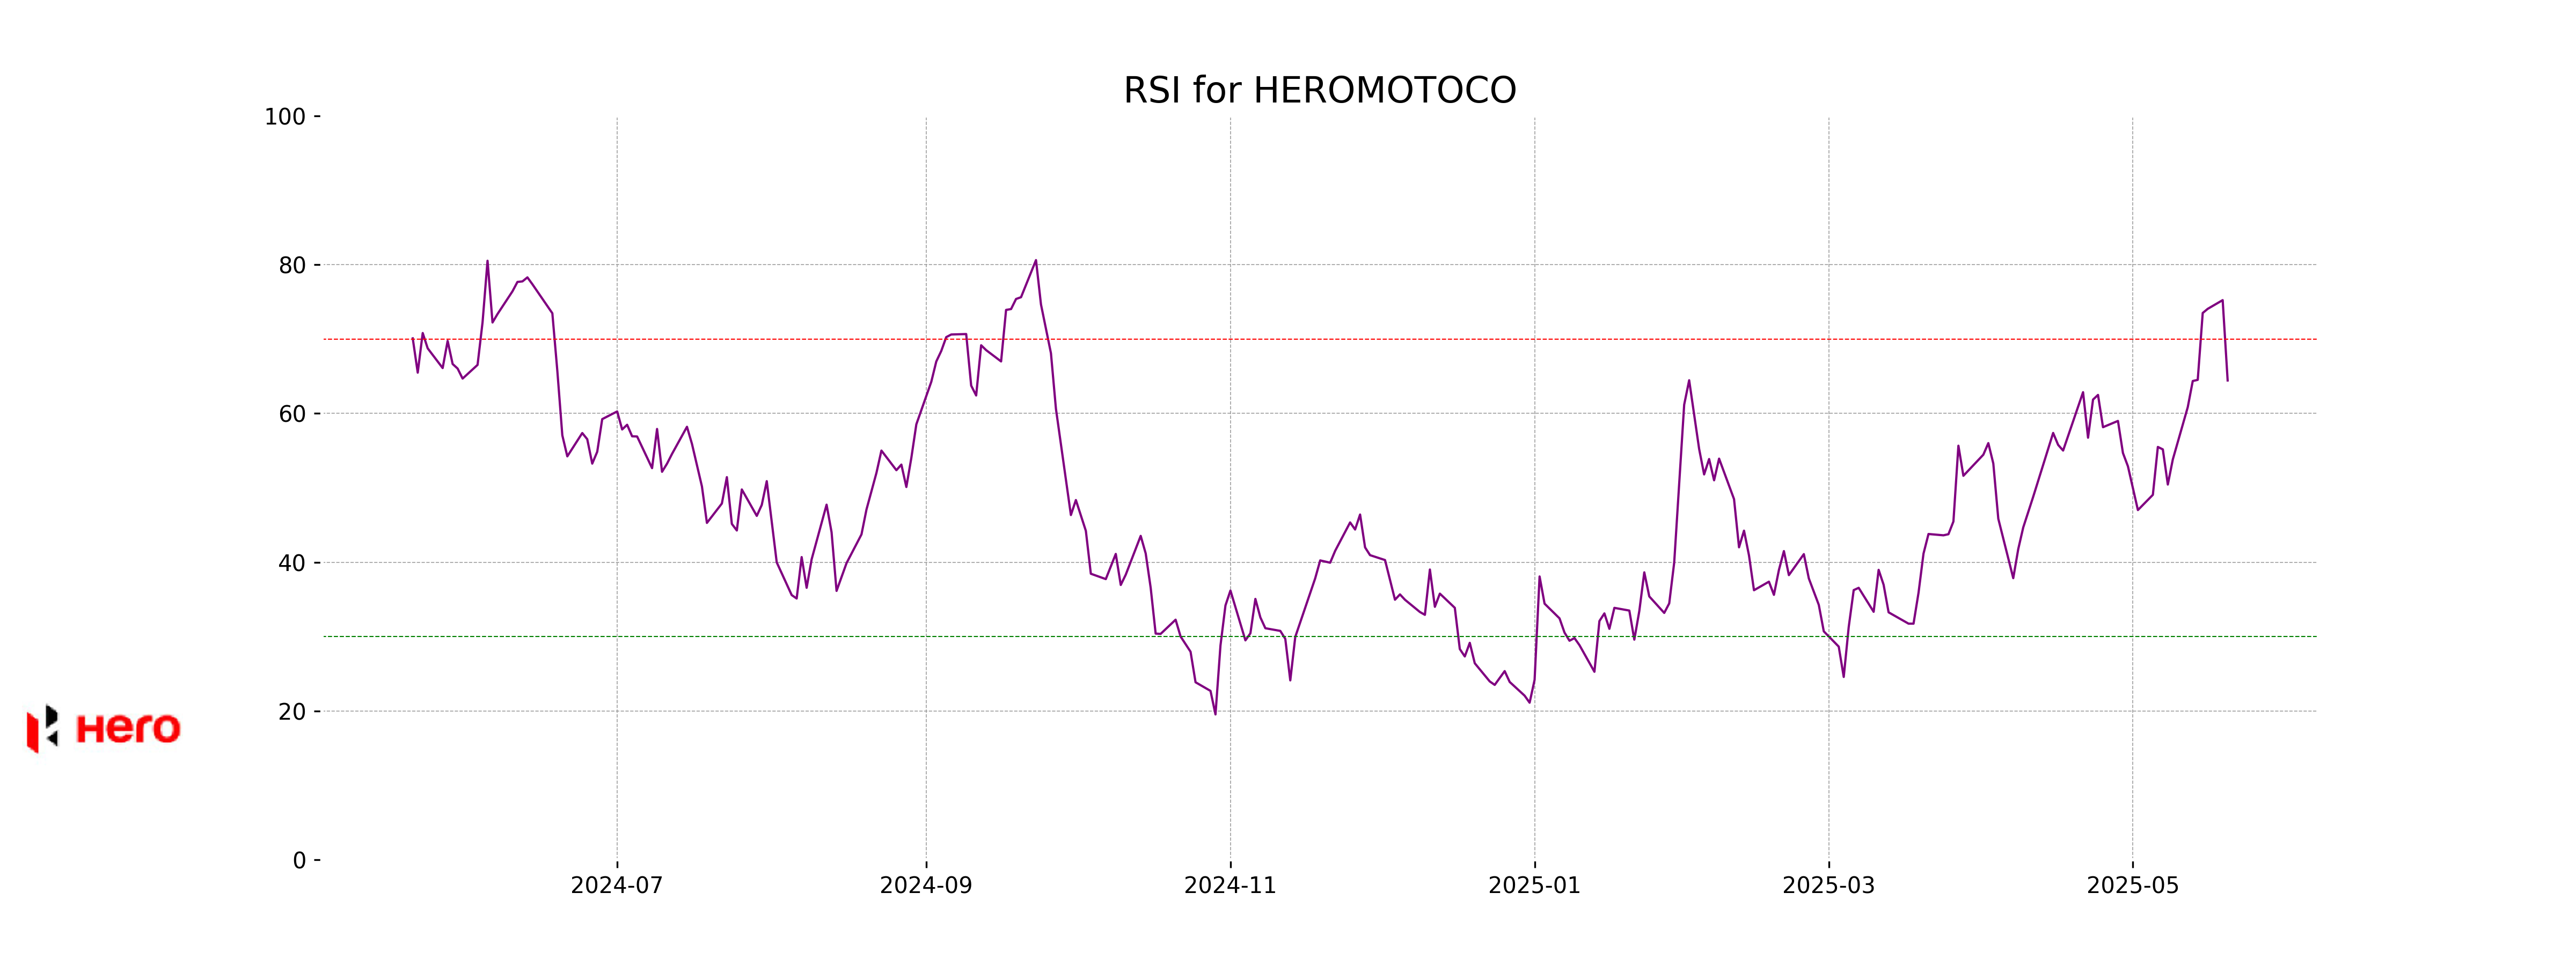
Analysis for Hero MotoCorp - May 20, 2025
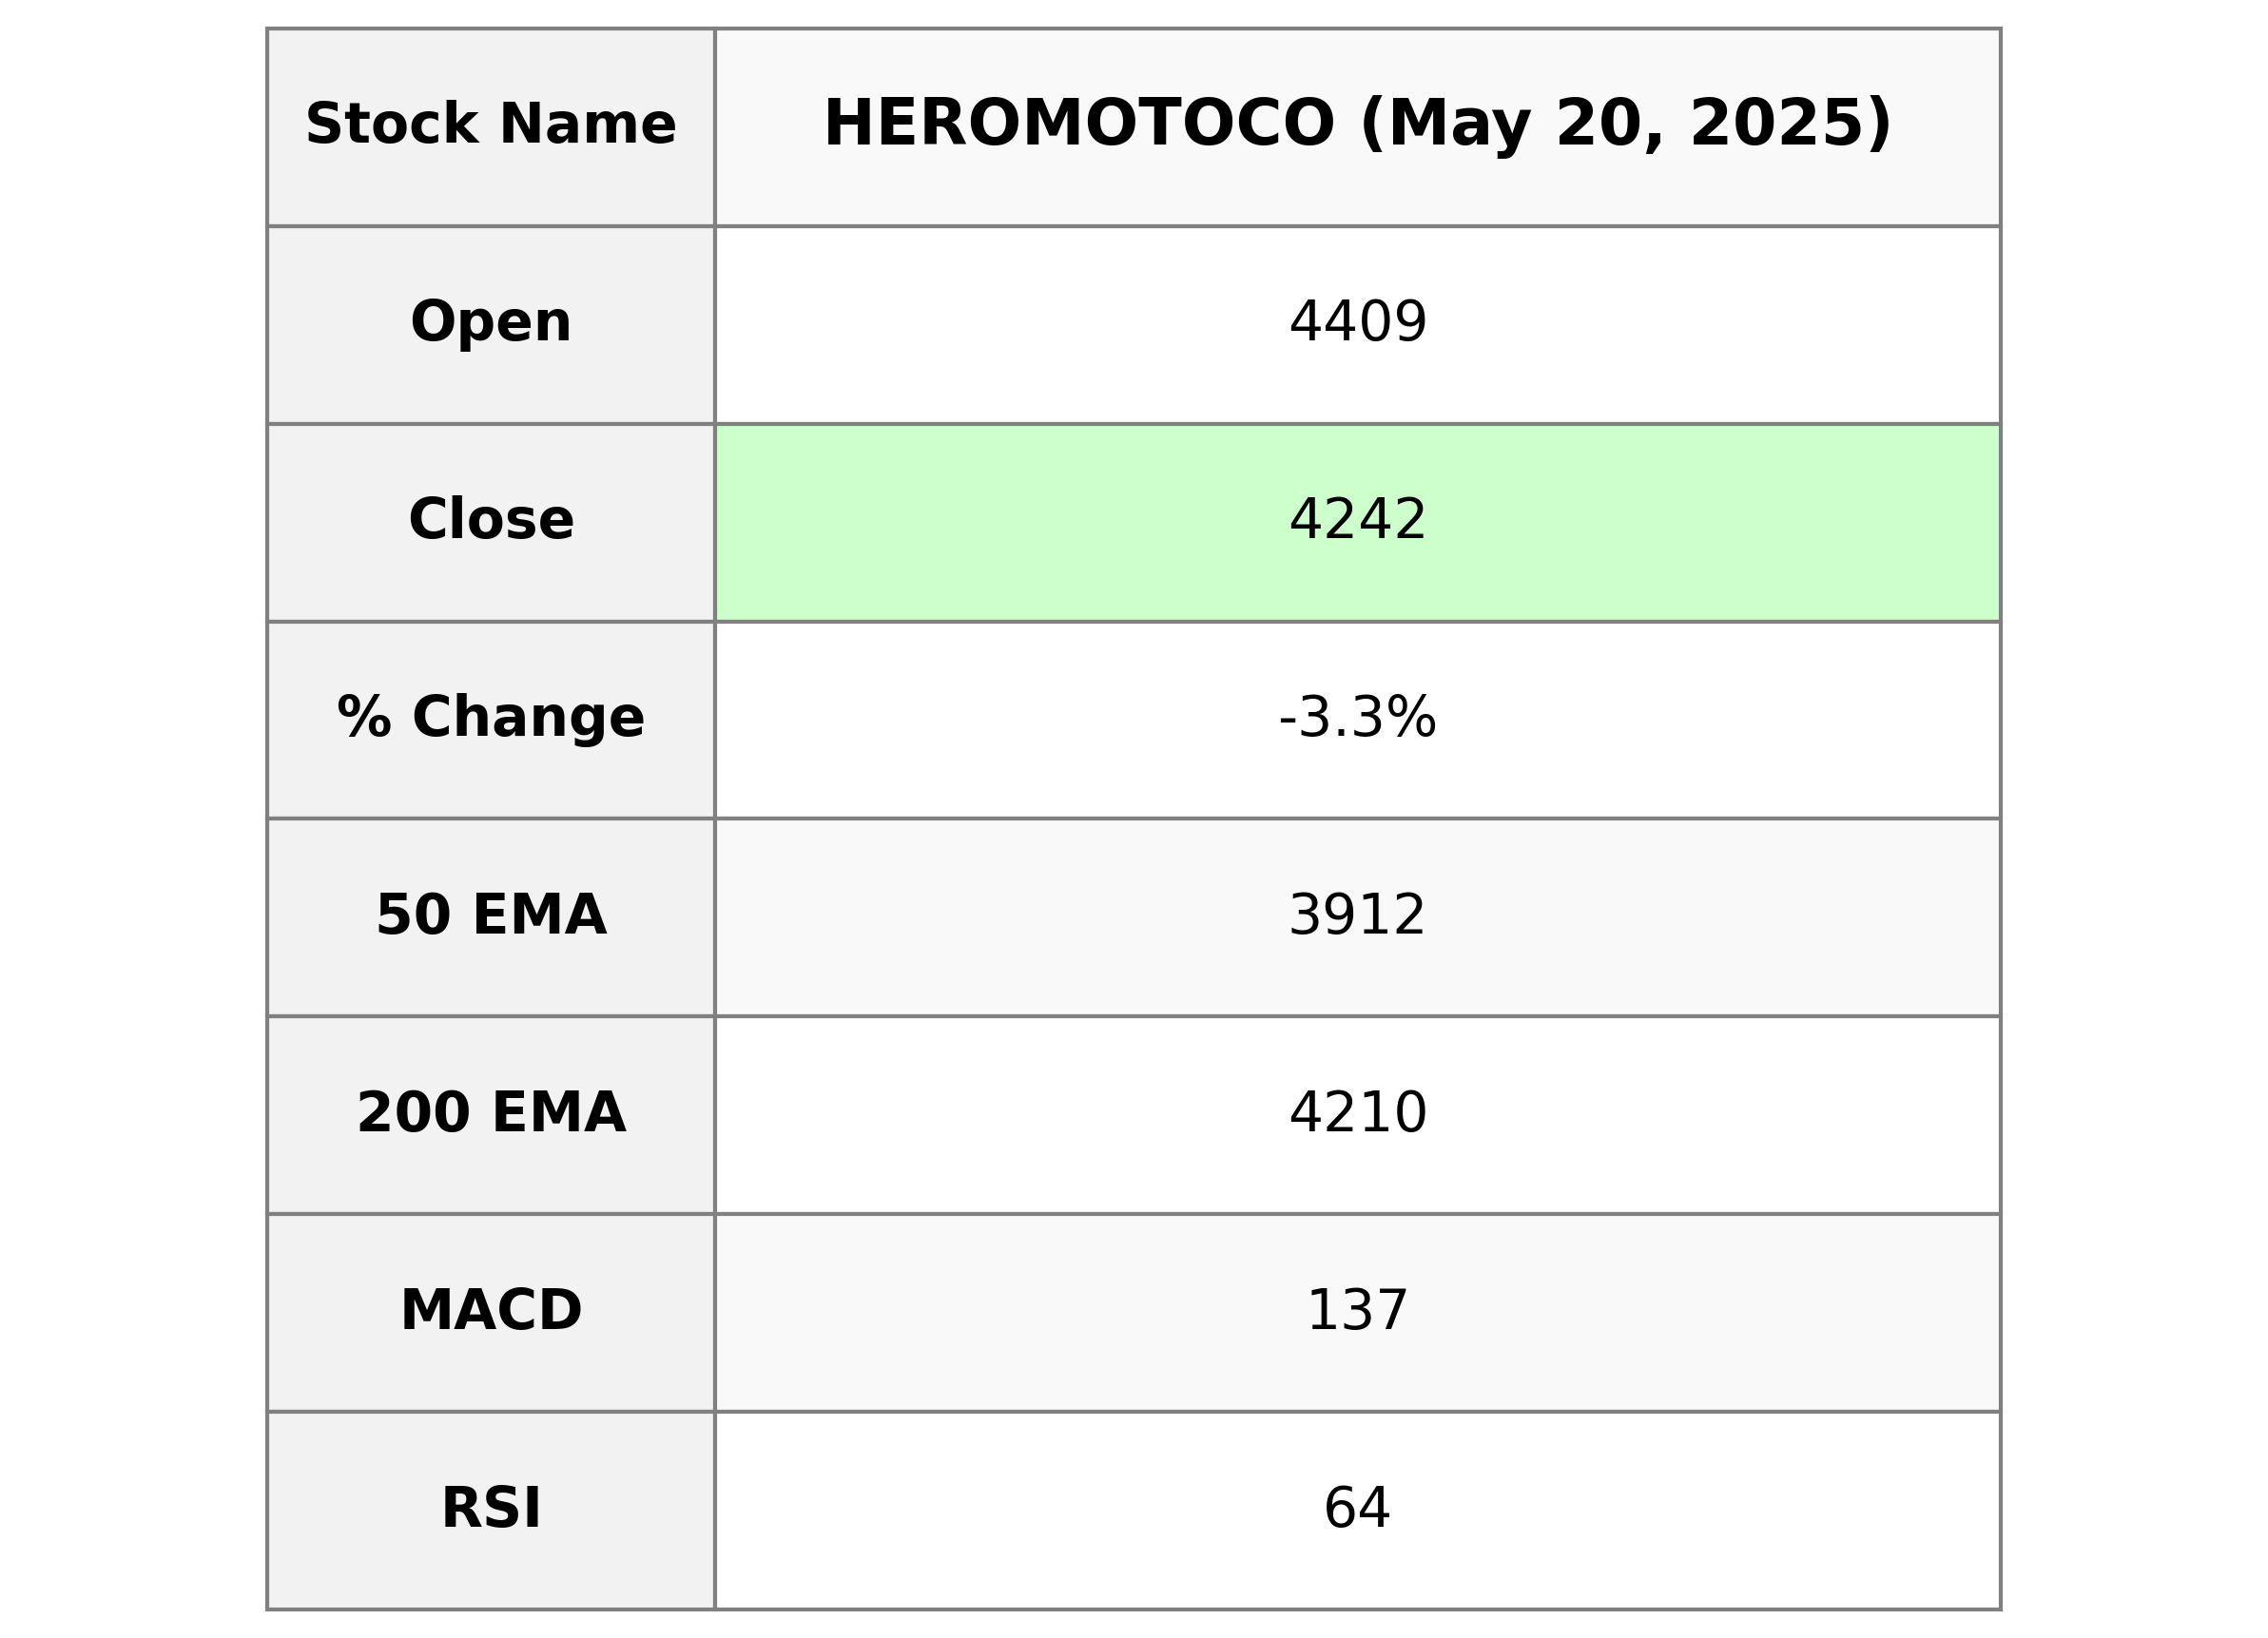
Hero MotoCorp Hero MotoCorp's stock saw a downturn with a closing price of 4241.60 INR, down by 3.33% from its previous close. Despite recently high trading volumes, its RSI indicates a relatively strong position, while MACD shows bullish momentum. With a P/E ratio of 19.41, the company is positioned in the consumer cyclical sector, focused on auto manufacturing in India.
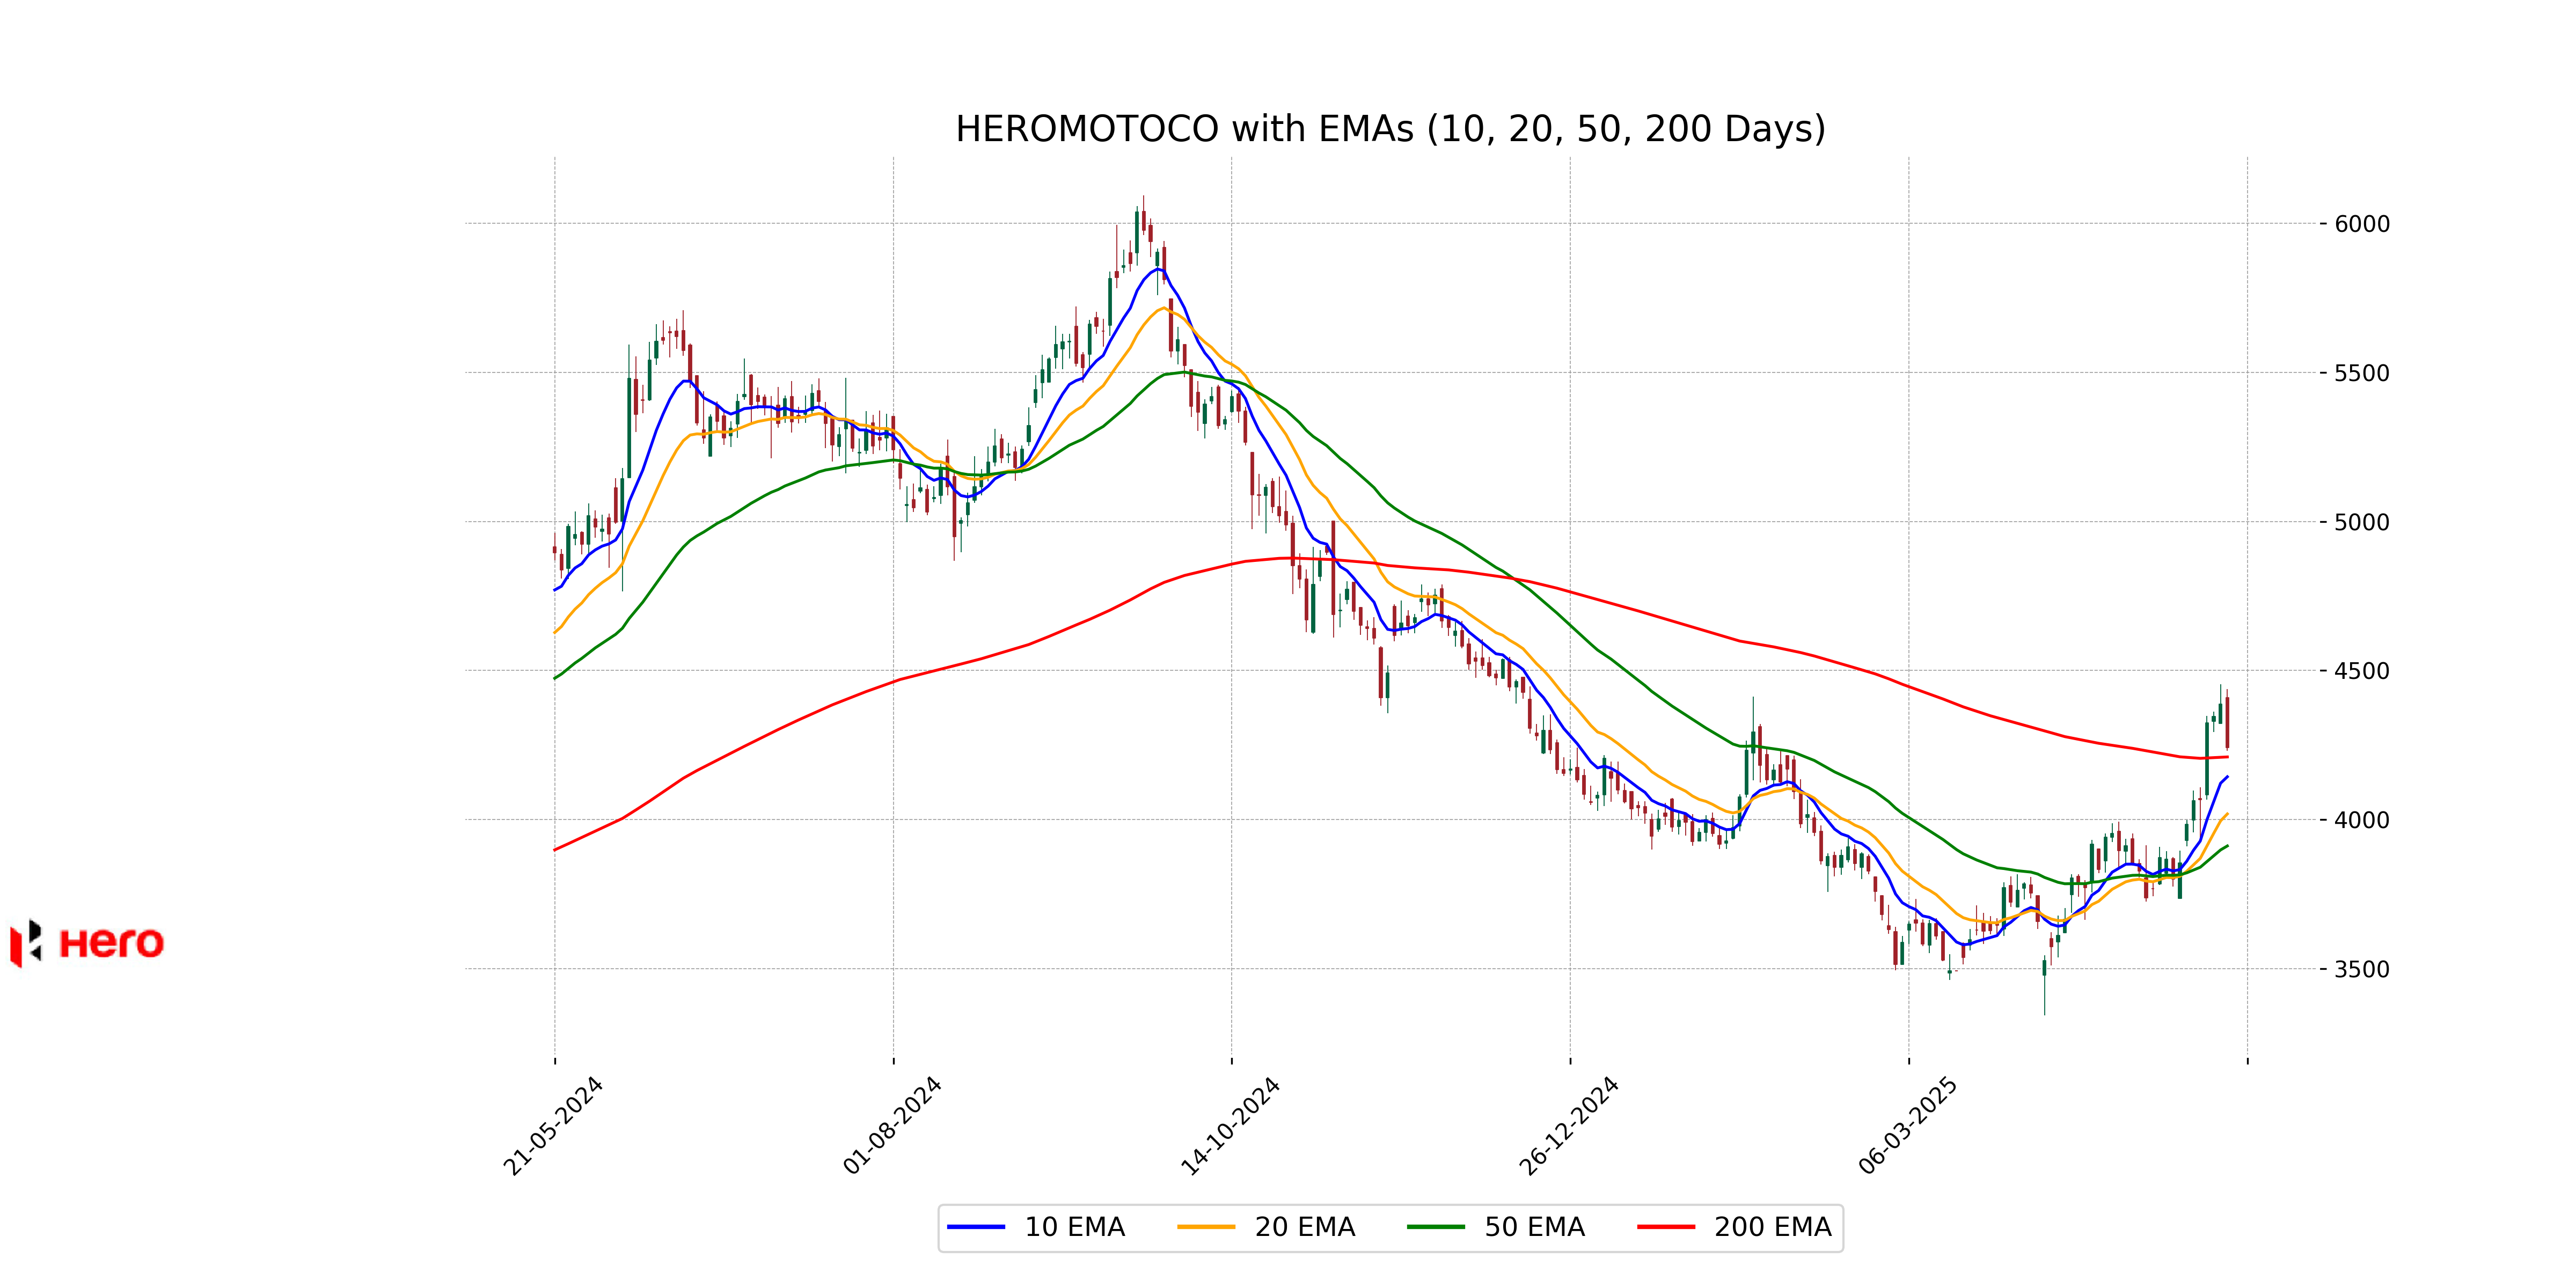
Relationship with Key Moving Averages
Hero MotoCorp's closing price of 4241.60 is above its 50-day EMA of 3911.71 and its 20-day EMA of 4019.11, indicating short-term bullish momentum. However, it is slightly above the 200-day EMA of 4210.23, suggesting some potential for reversal or consolidation in the longer term.
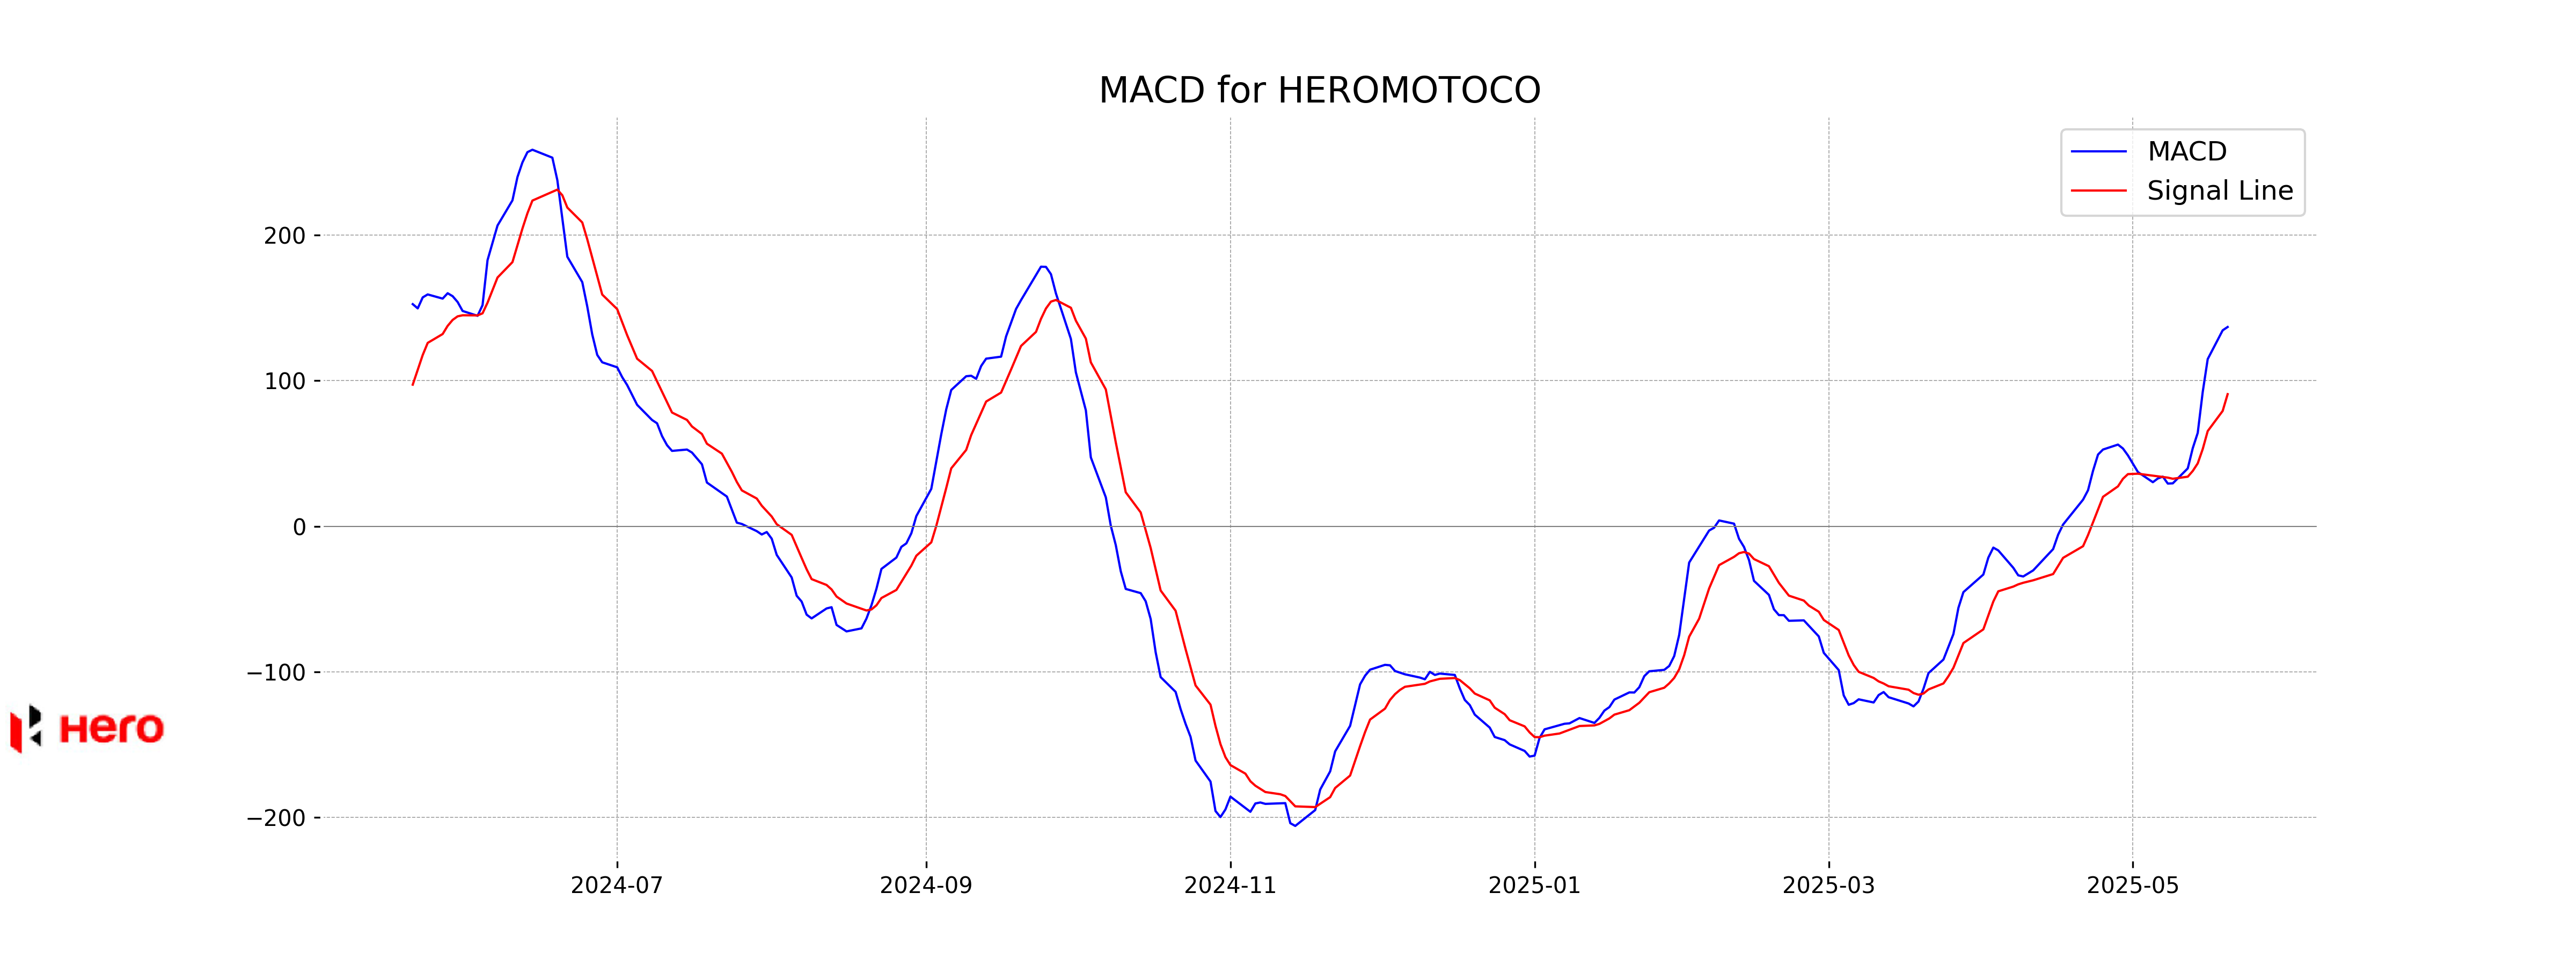
Moving Averages Trend (MACD)
MACD Analysis for Hero MotoCorp: The MACD value of 136.87 is above its signal line at 90.74, indicating a bullish momentum. However, the recent decrease in stock price and negative change percentage suggest caution is warranted.
RSI Analysis
RSI Analysis for Hero MotoCorp: The Relative Strength Index (RSI) for Hero MotoCorp stands at 64.43. RSI values above 70 may indicate that a stock is overbought, while values below 30 may suggest it is oversold. Thus, an RSI of 64.43 suggests that Hero MotoCorp is nearing an overbought condition, but is not there yet, indicating potential for further upward movement, though investors should proceed with caution.
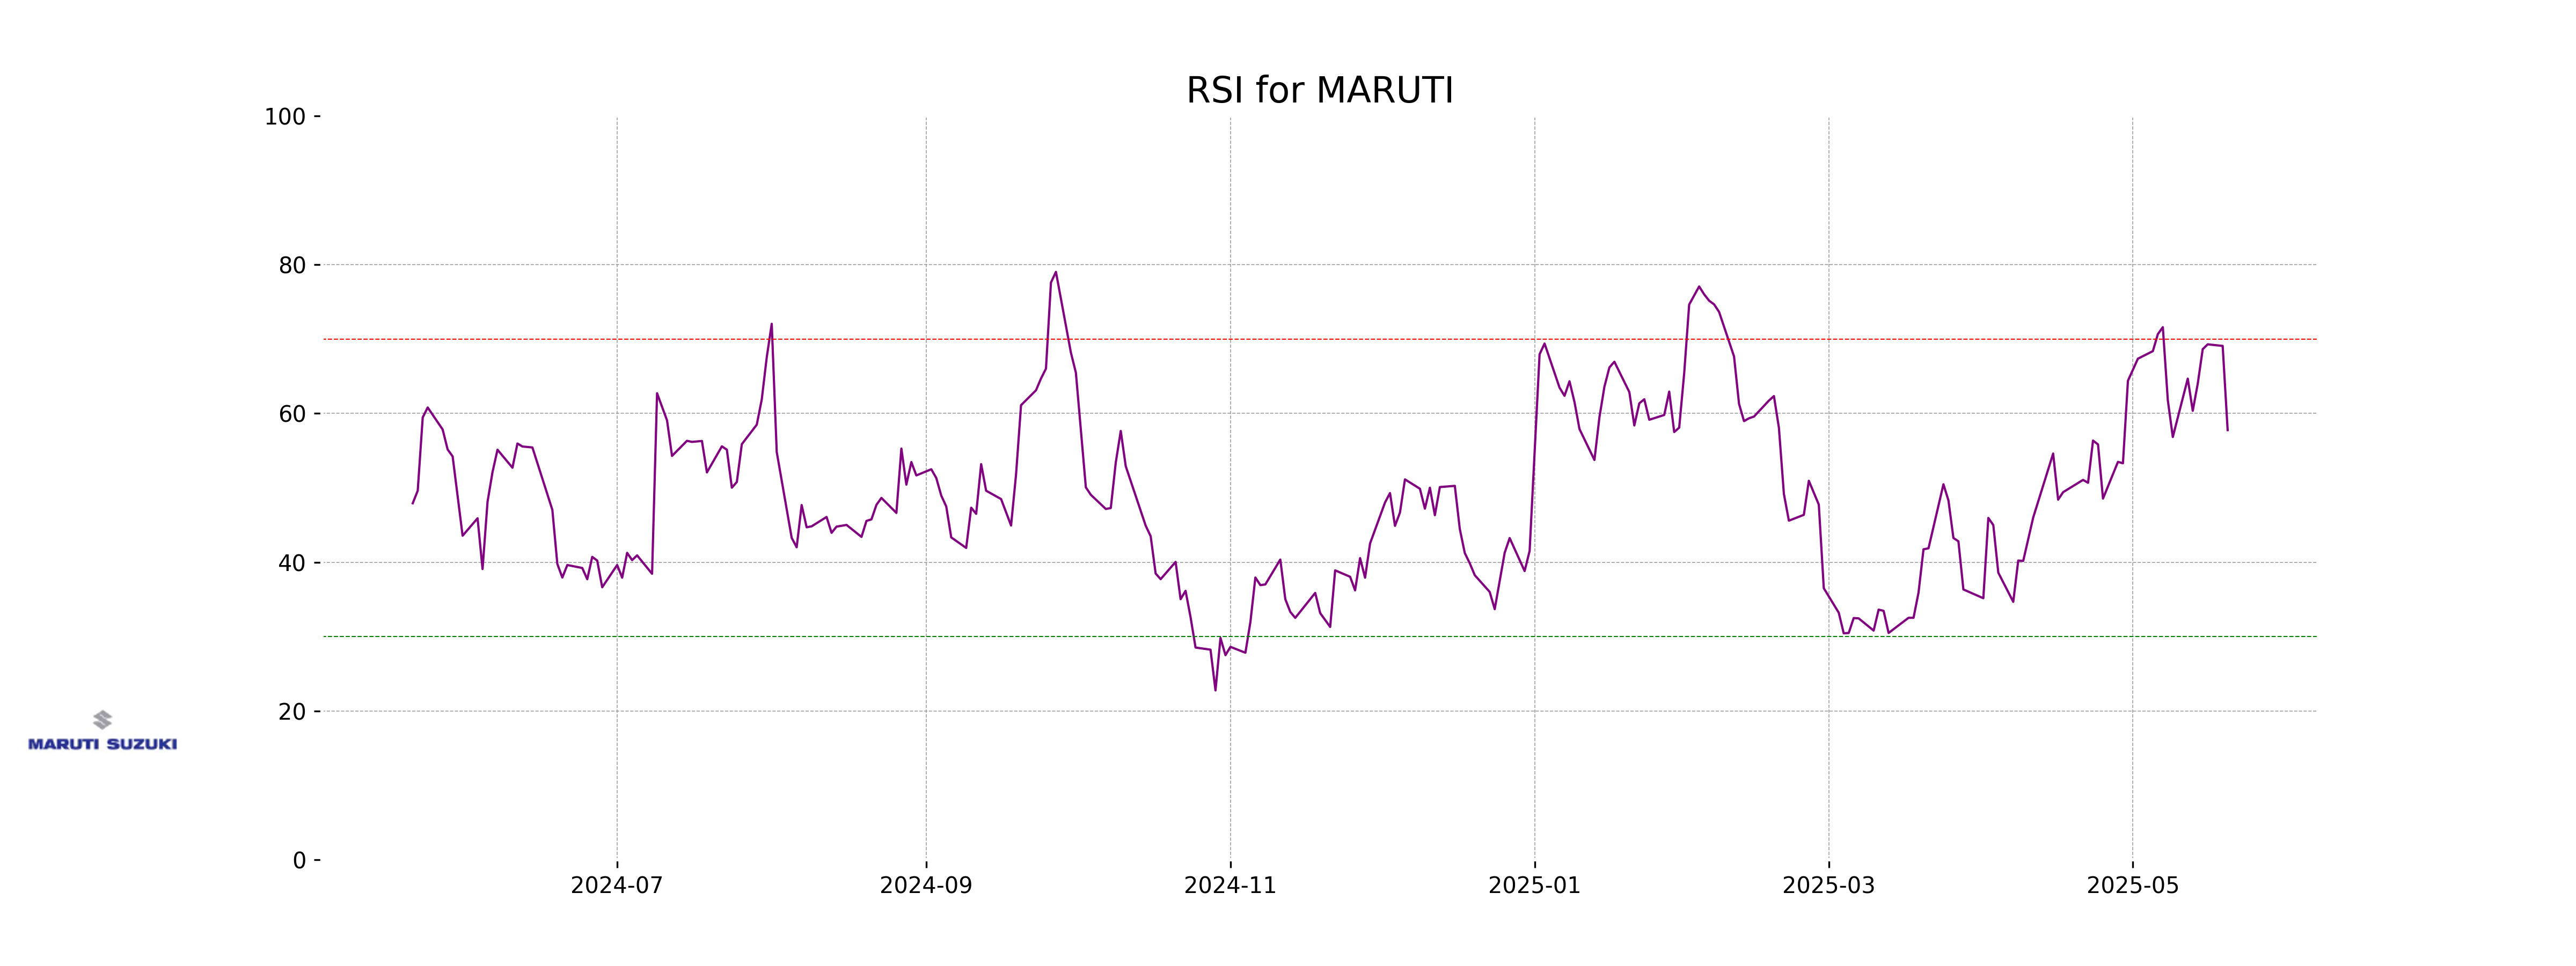
Analysis for Maruti Suzuki - May 20, 2025
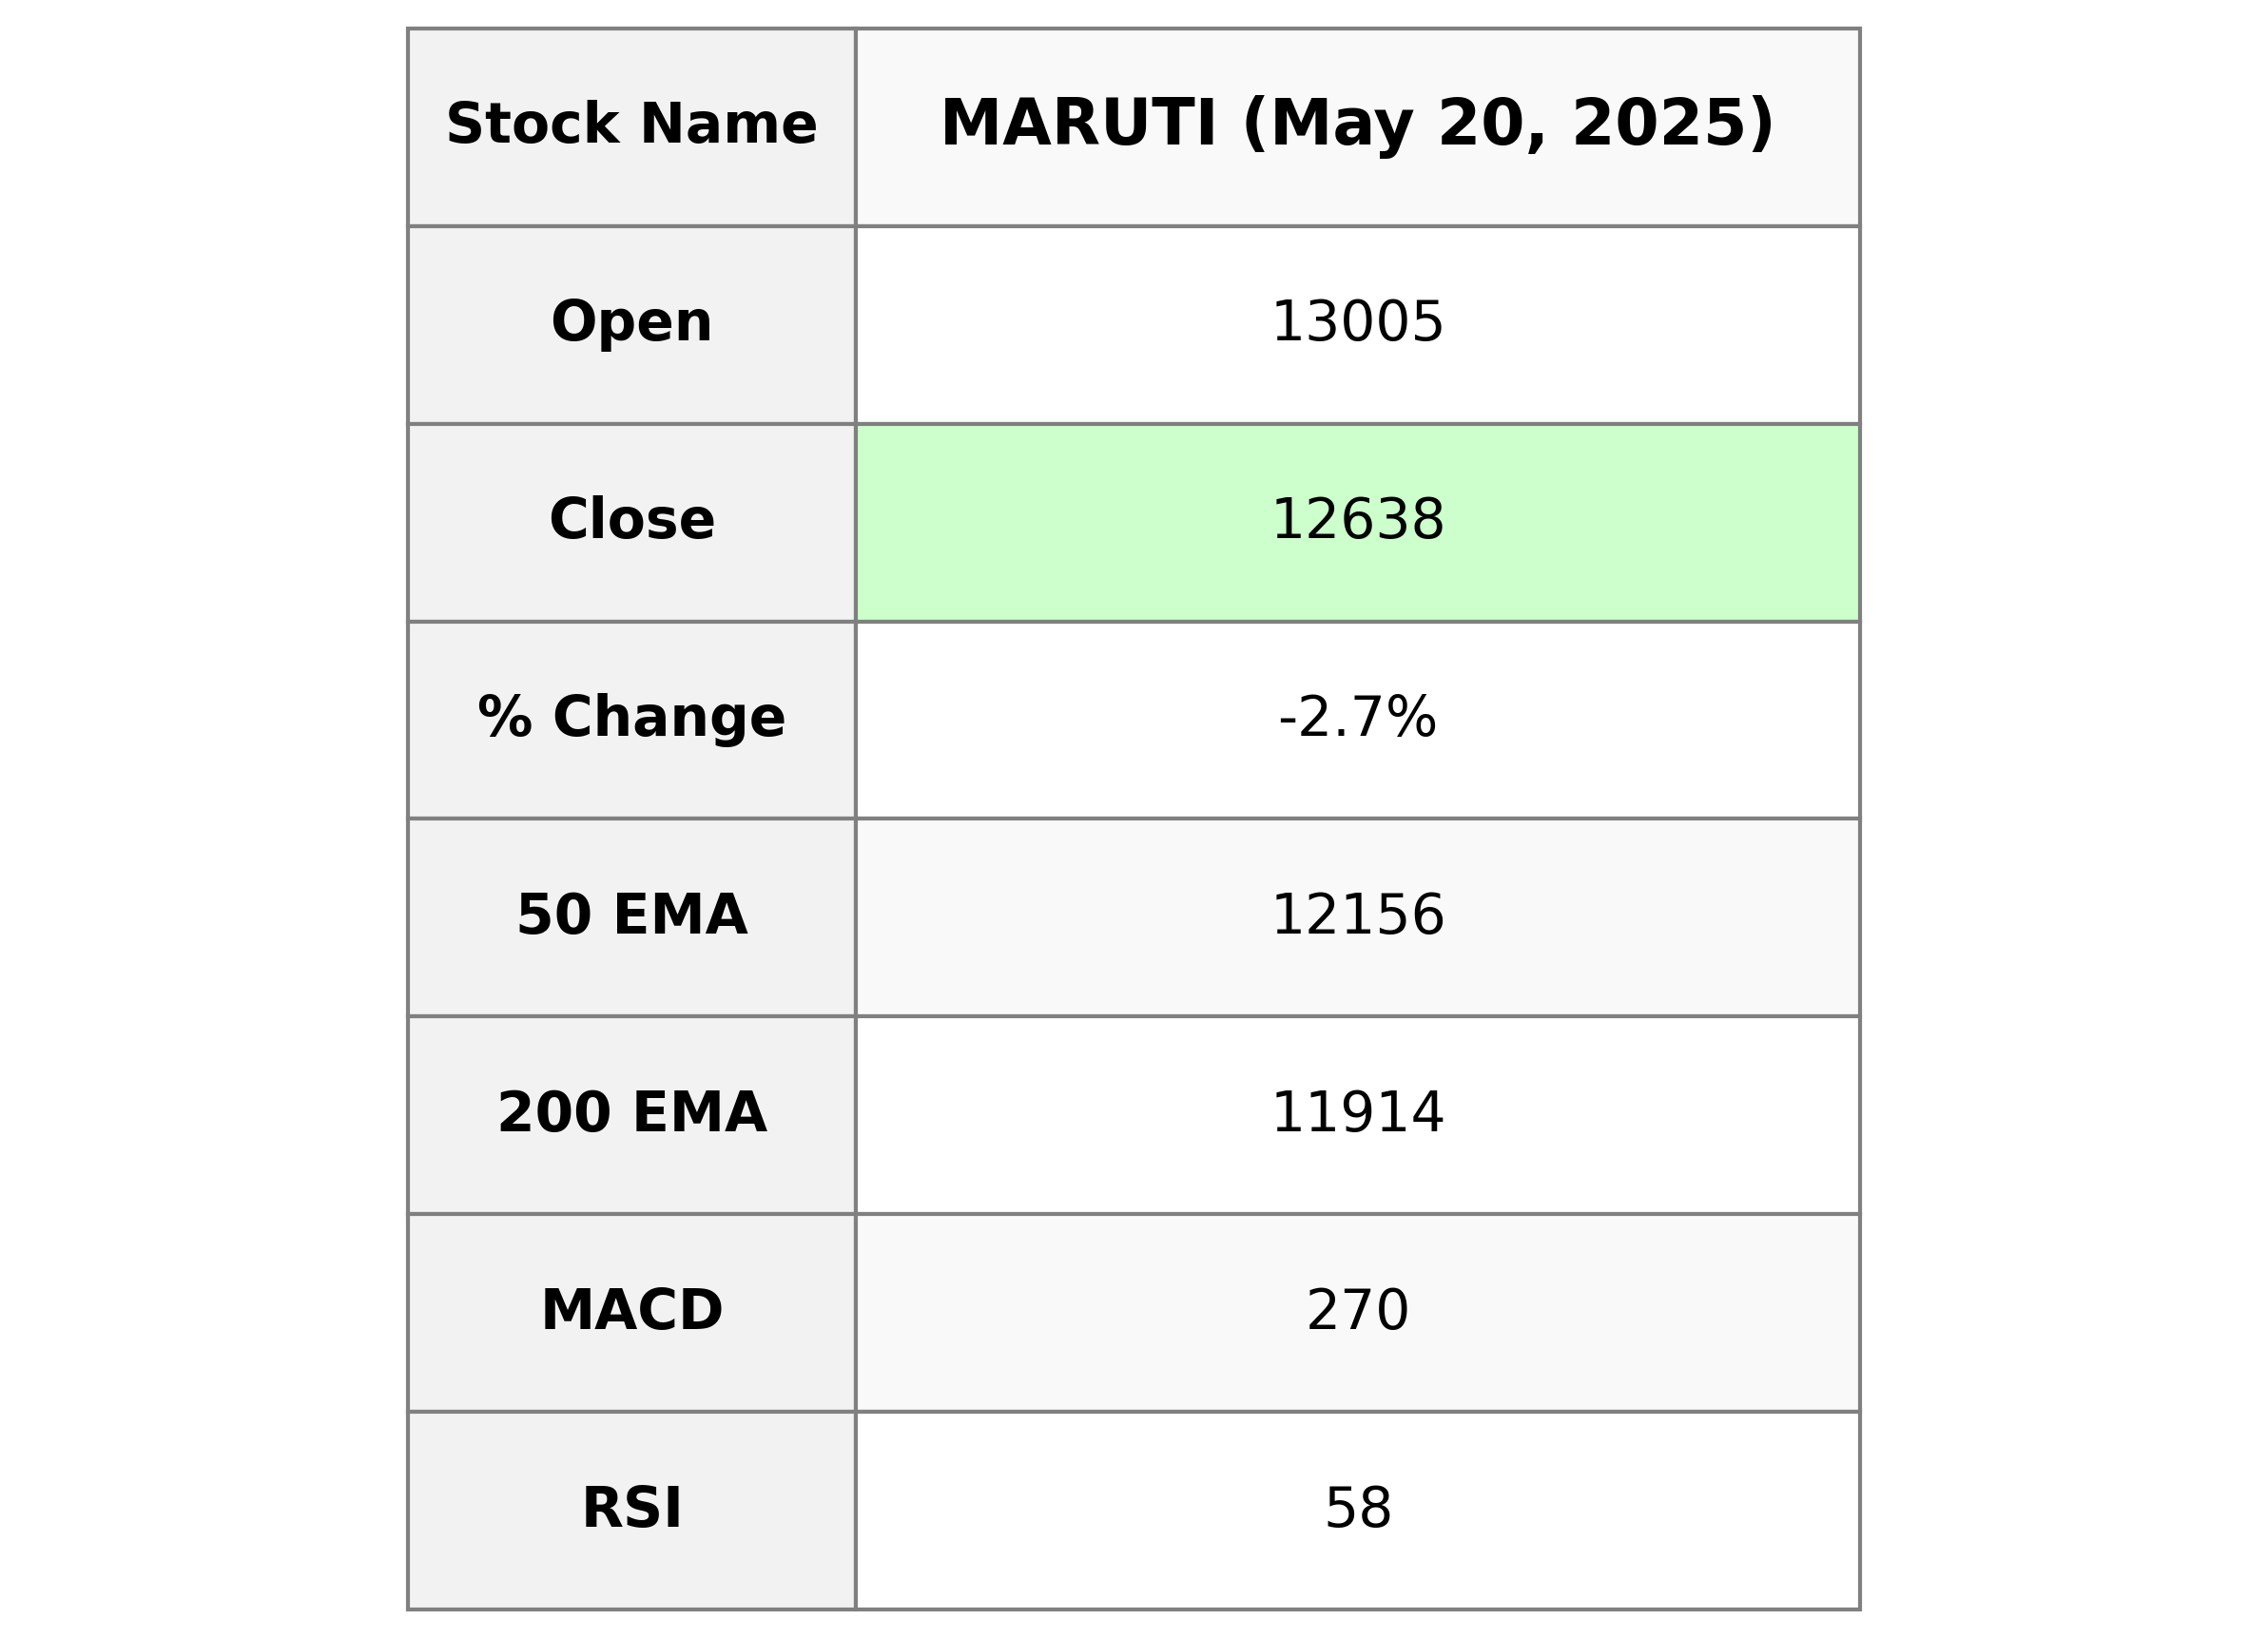
Maruti Suzuki's stock opened at 13,005, reached a high of 13,010, and closed at 12,638, showing a decline of 2.70% from the previous close of 12,989. The company's PE Ratio is 27.41, with an EPS of 461.11. With a market cap of 3,973,425,135,616, Maruti Suzuki operates within the Consumer Cyclical sector, specifically in the Auto Manufacturers industry, in India. The Relative Strength Index (RSI) of 57.76 indicates moderate momentum, while the Moving Average Convergence Divergence (MACD) suggests a bullish trend with a gap of 41.97 over the signal.
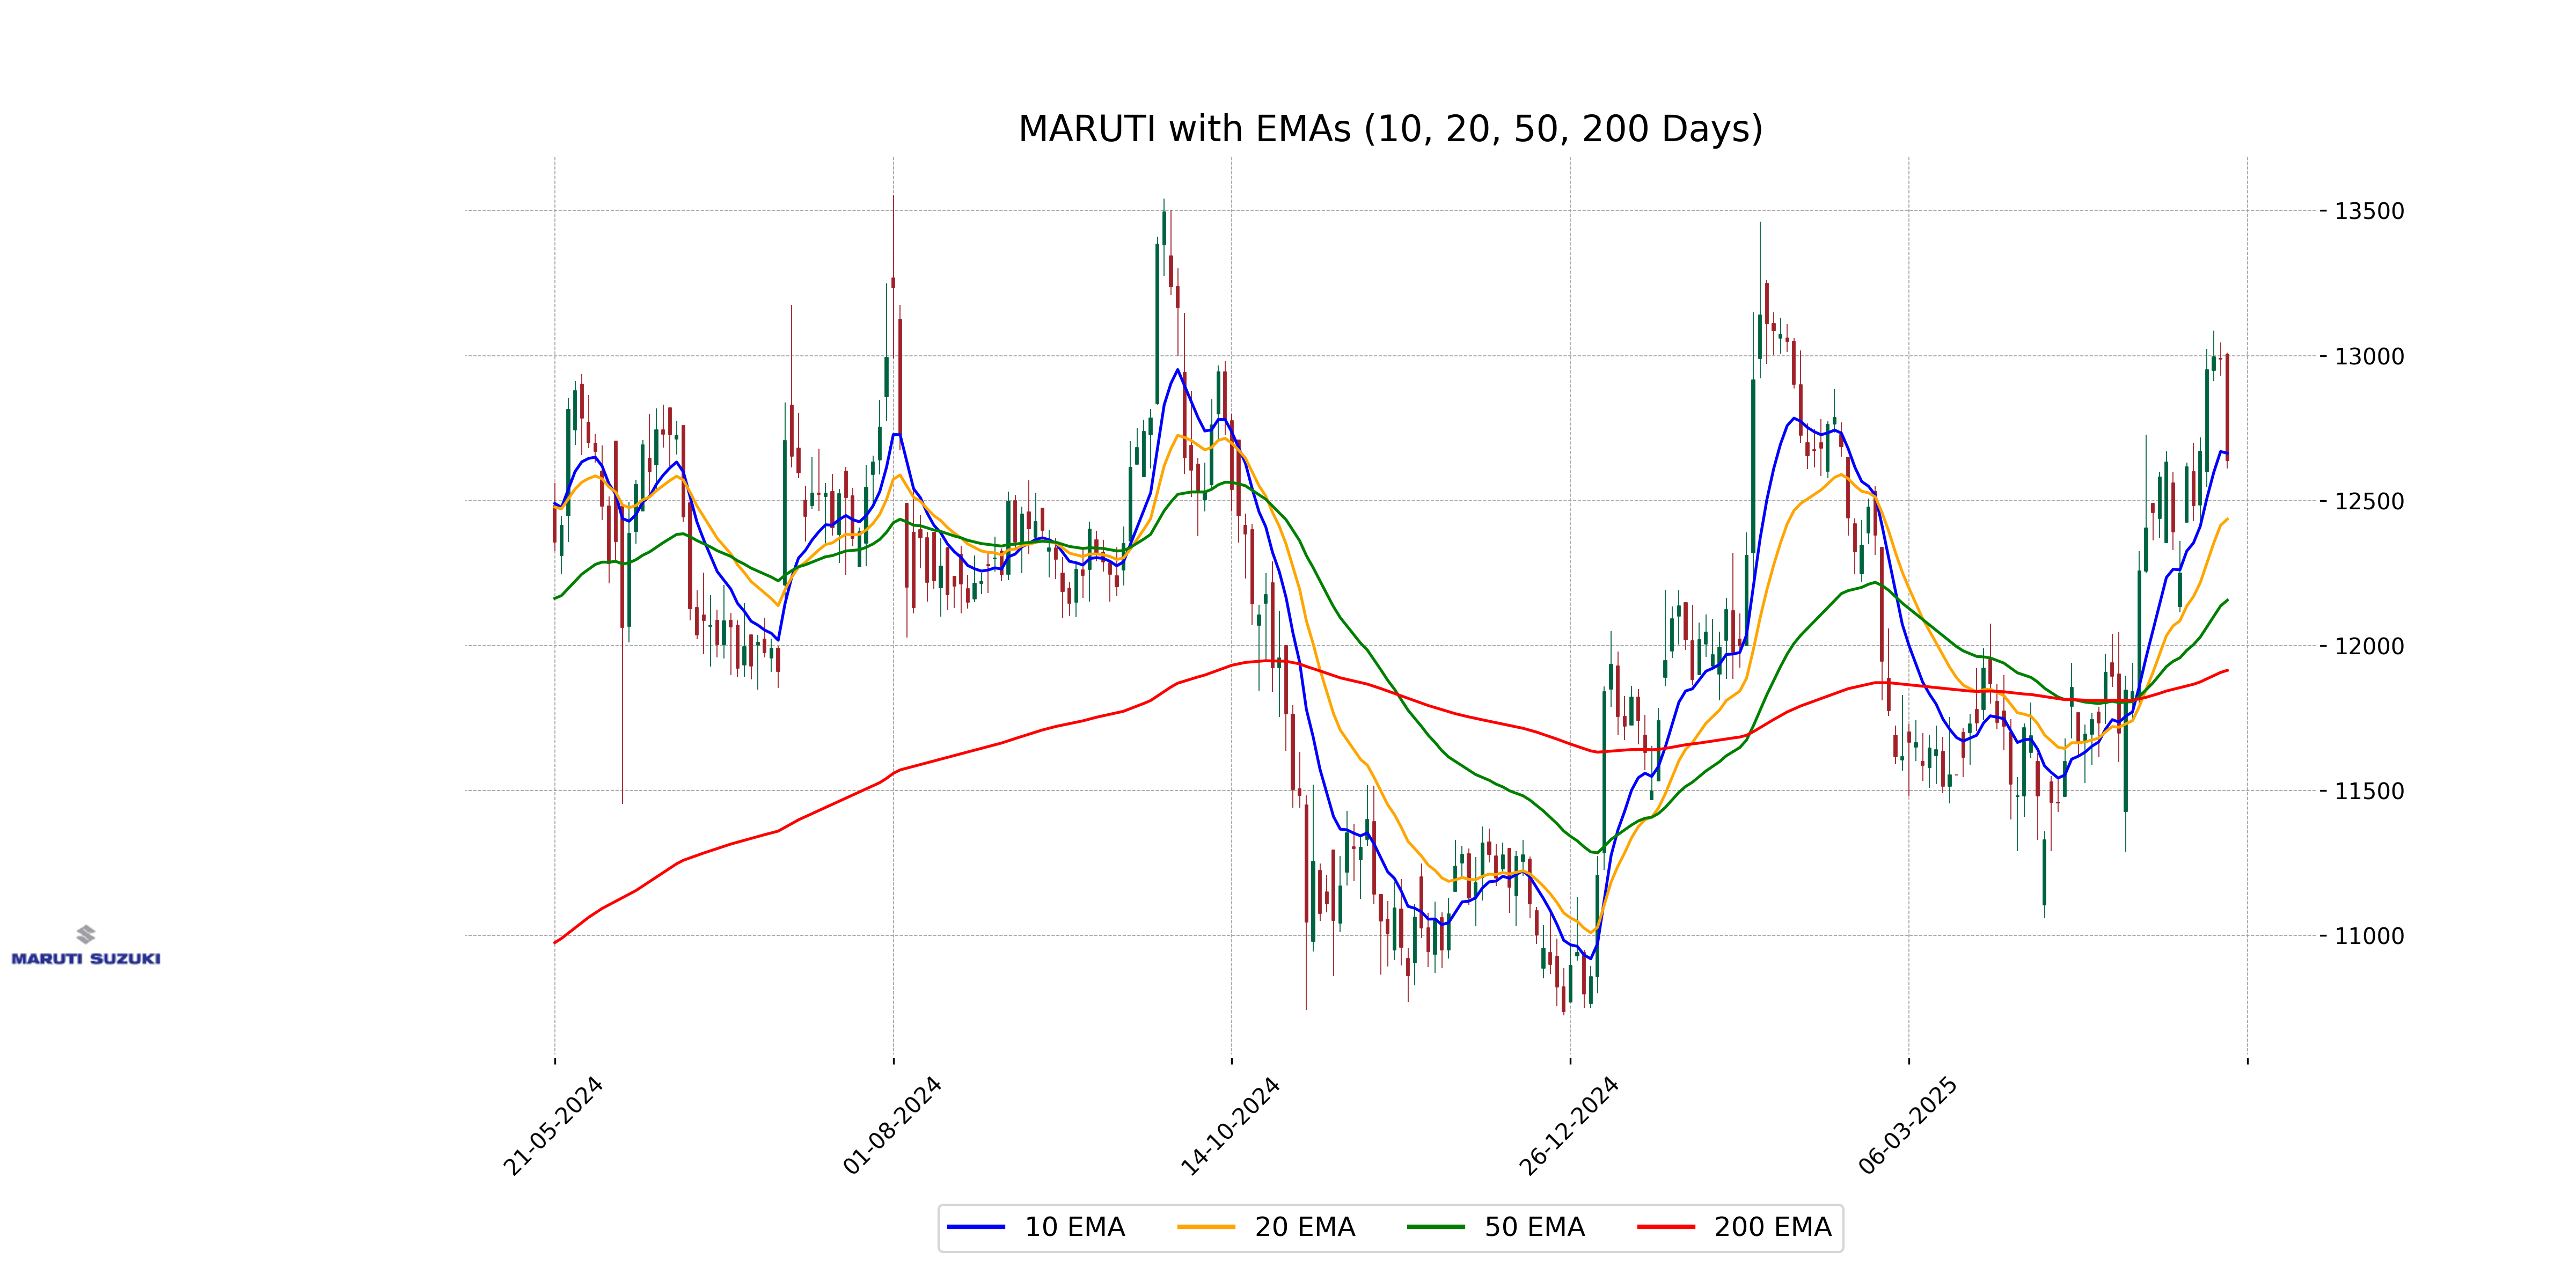
Relationship with Key Moving Averages
Maruti Suzuki's current close price of 12,638.0 is above its 50-day EMA of 12,156.21 and its 200-day EMA of 11,914.43, indicating a bullish trend over these time frames. However, it is slightly below its 10-day EMA of 12,663.38, suggesting some recent bearish movement.
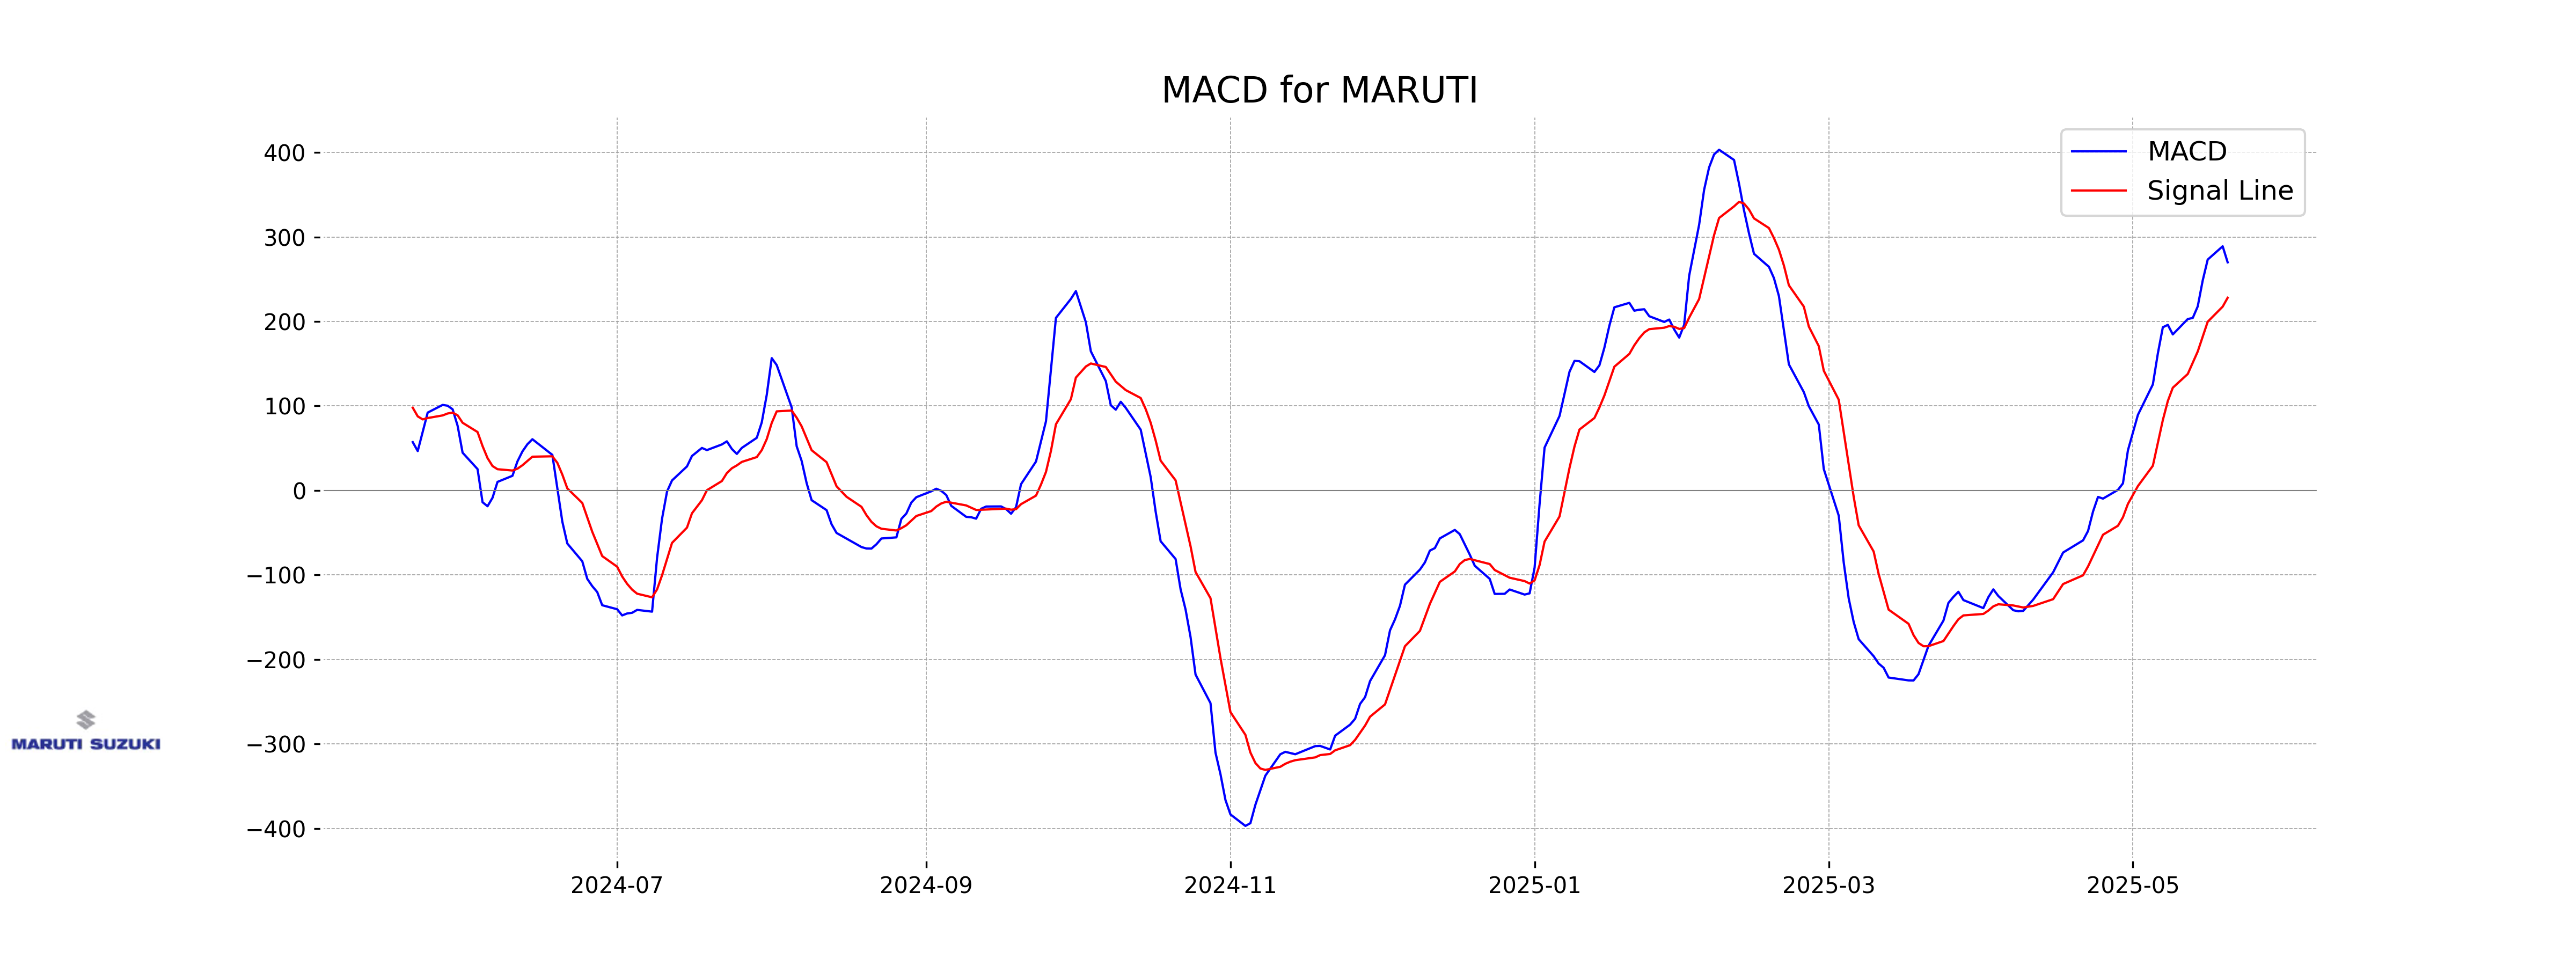
Moving Averages Trend (MACD)
The MACD for Maruti Suzuki is at 269.99 with a MACD Signal of 228.02, indicating bullish momentum as the MACD line is above the signal line. This suggests potential upward movement in the stock price, although it is important to note the overall market condition and other indicators for a comprehensive analysis.
RSI Analysis
The Relative Strength Index (RSI) for Maruti Suzuki is 57.76, indicating a neutral momentum. Typically, an RSI above 70 suggests that a stock is overbought, while below 30 suggests it is oversold. At this level, the stock is neither overbought nor oversold, suggesting a balanced market sentiment.
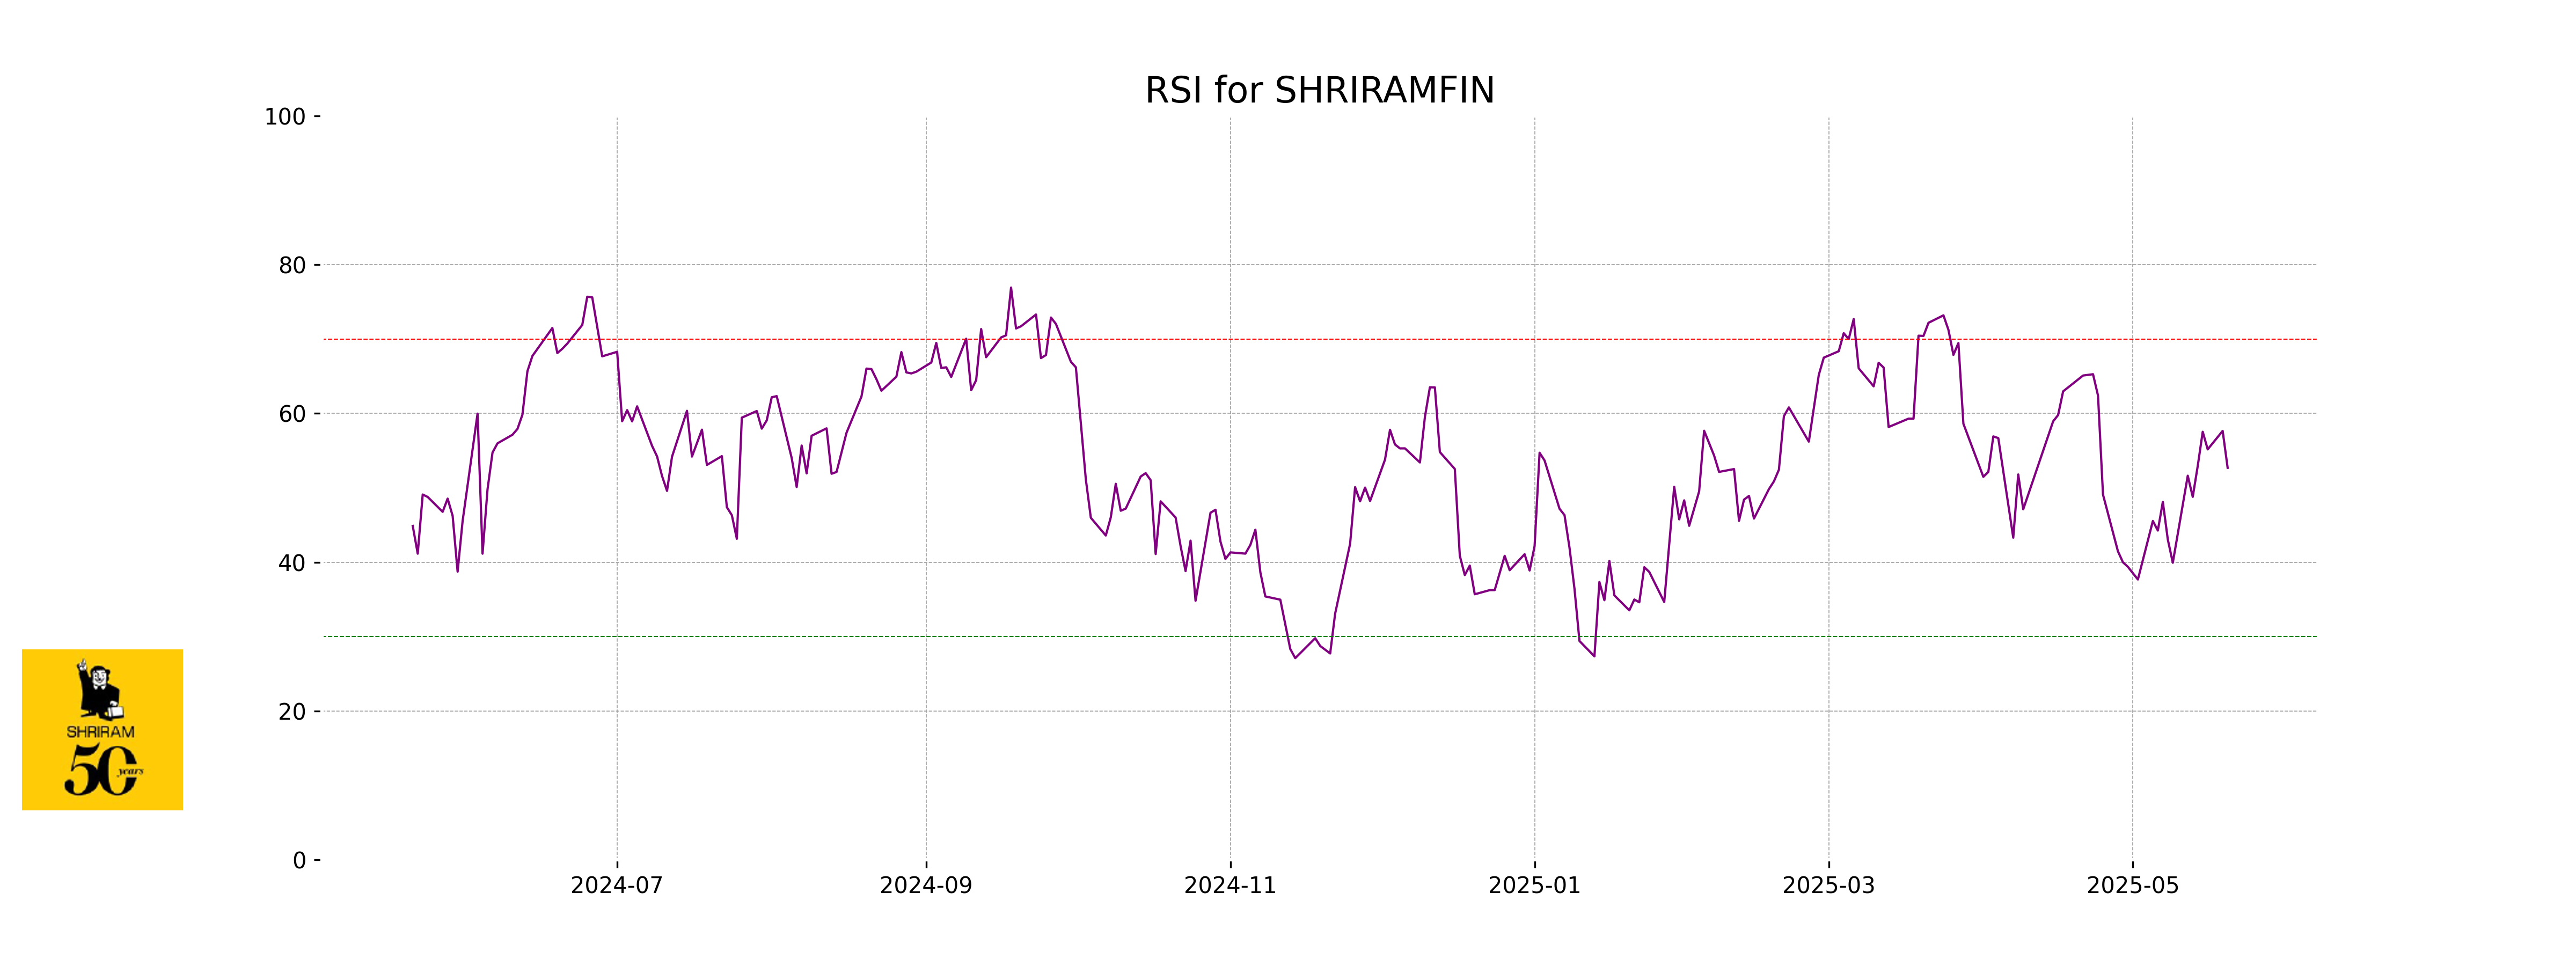
Analysis for Shriram Finance - May 20, 2025
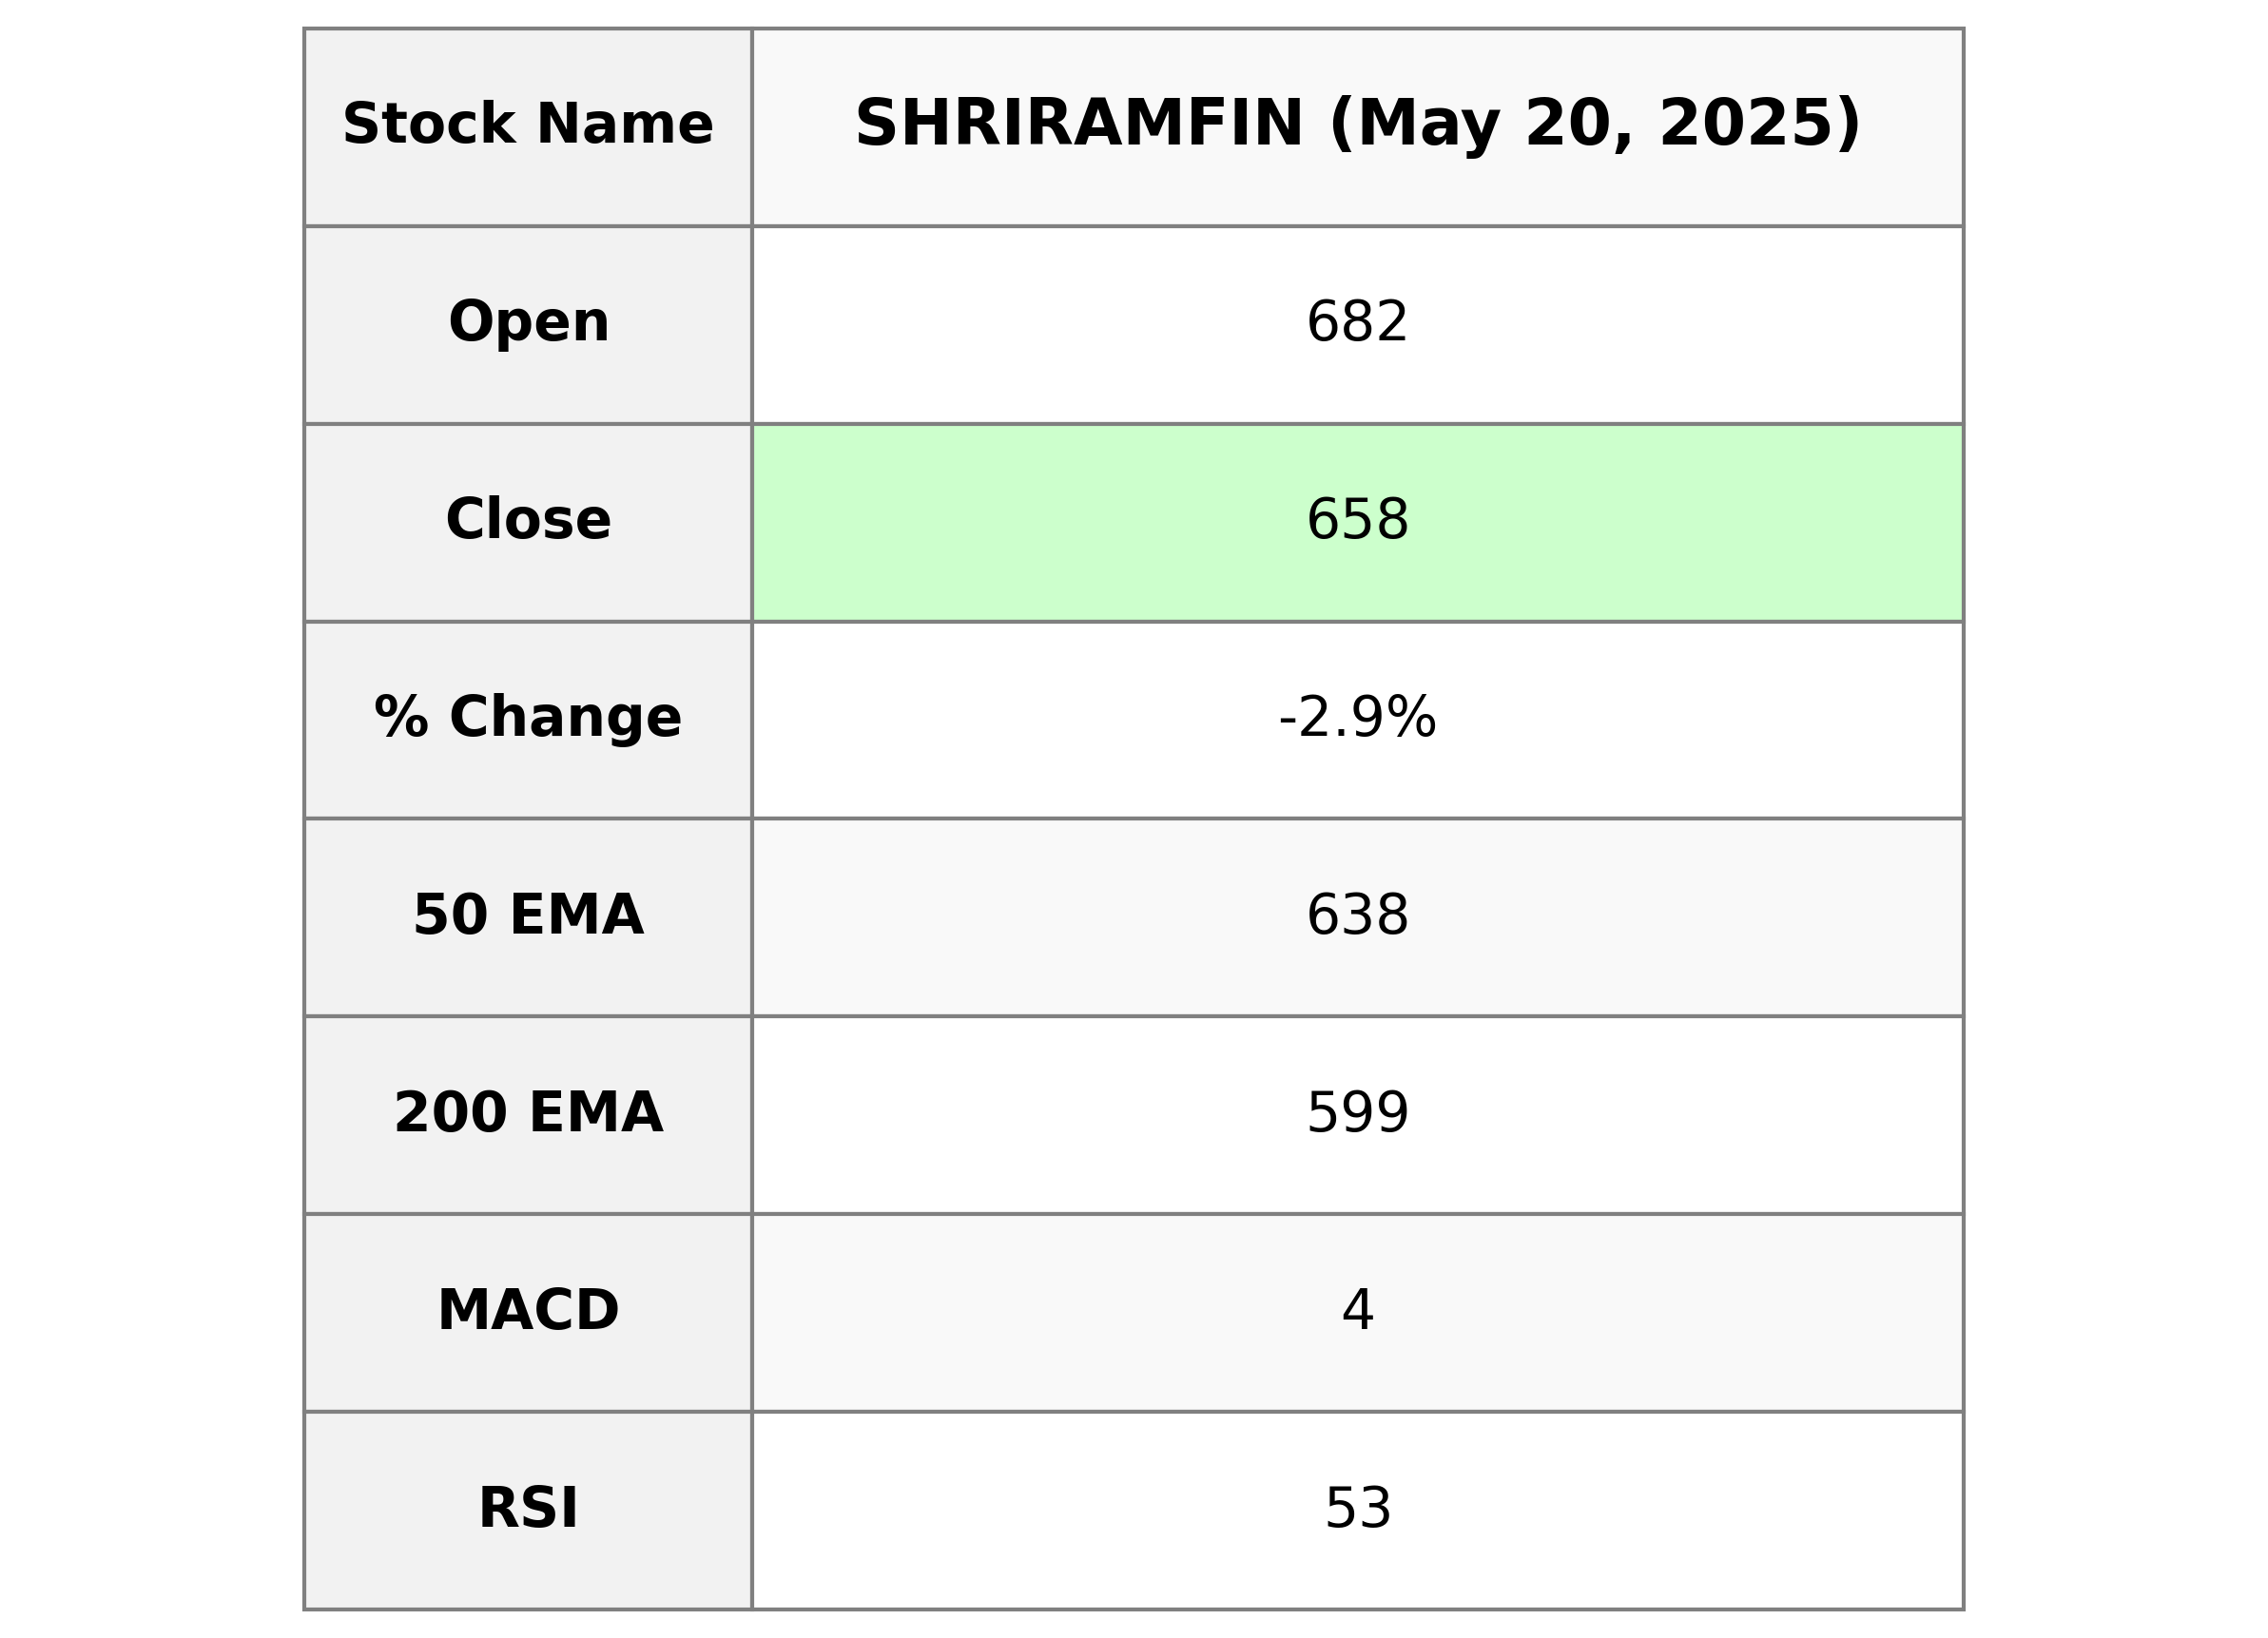
Shriram Finance experienced a decrease in its stock performance, with a closing price of 658.35, marking a -2.87% change from the previous close. The company's market cap stands at 1,238,046,867,456, and it operates within the Financial Services sector, specifically in Credit Services, in India. Additionally, the company's RSI indicates a moderate momentum at 52.69, and the MACD suggests a bullish signal above its MACD Signal line.
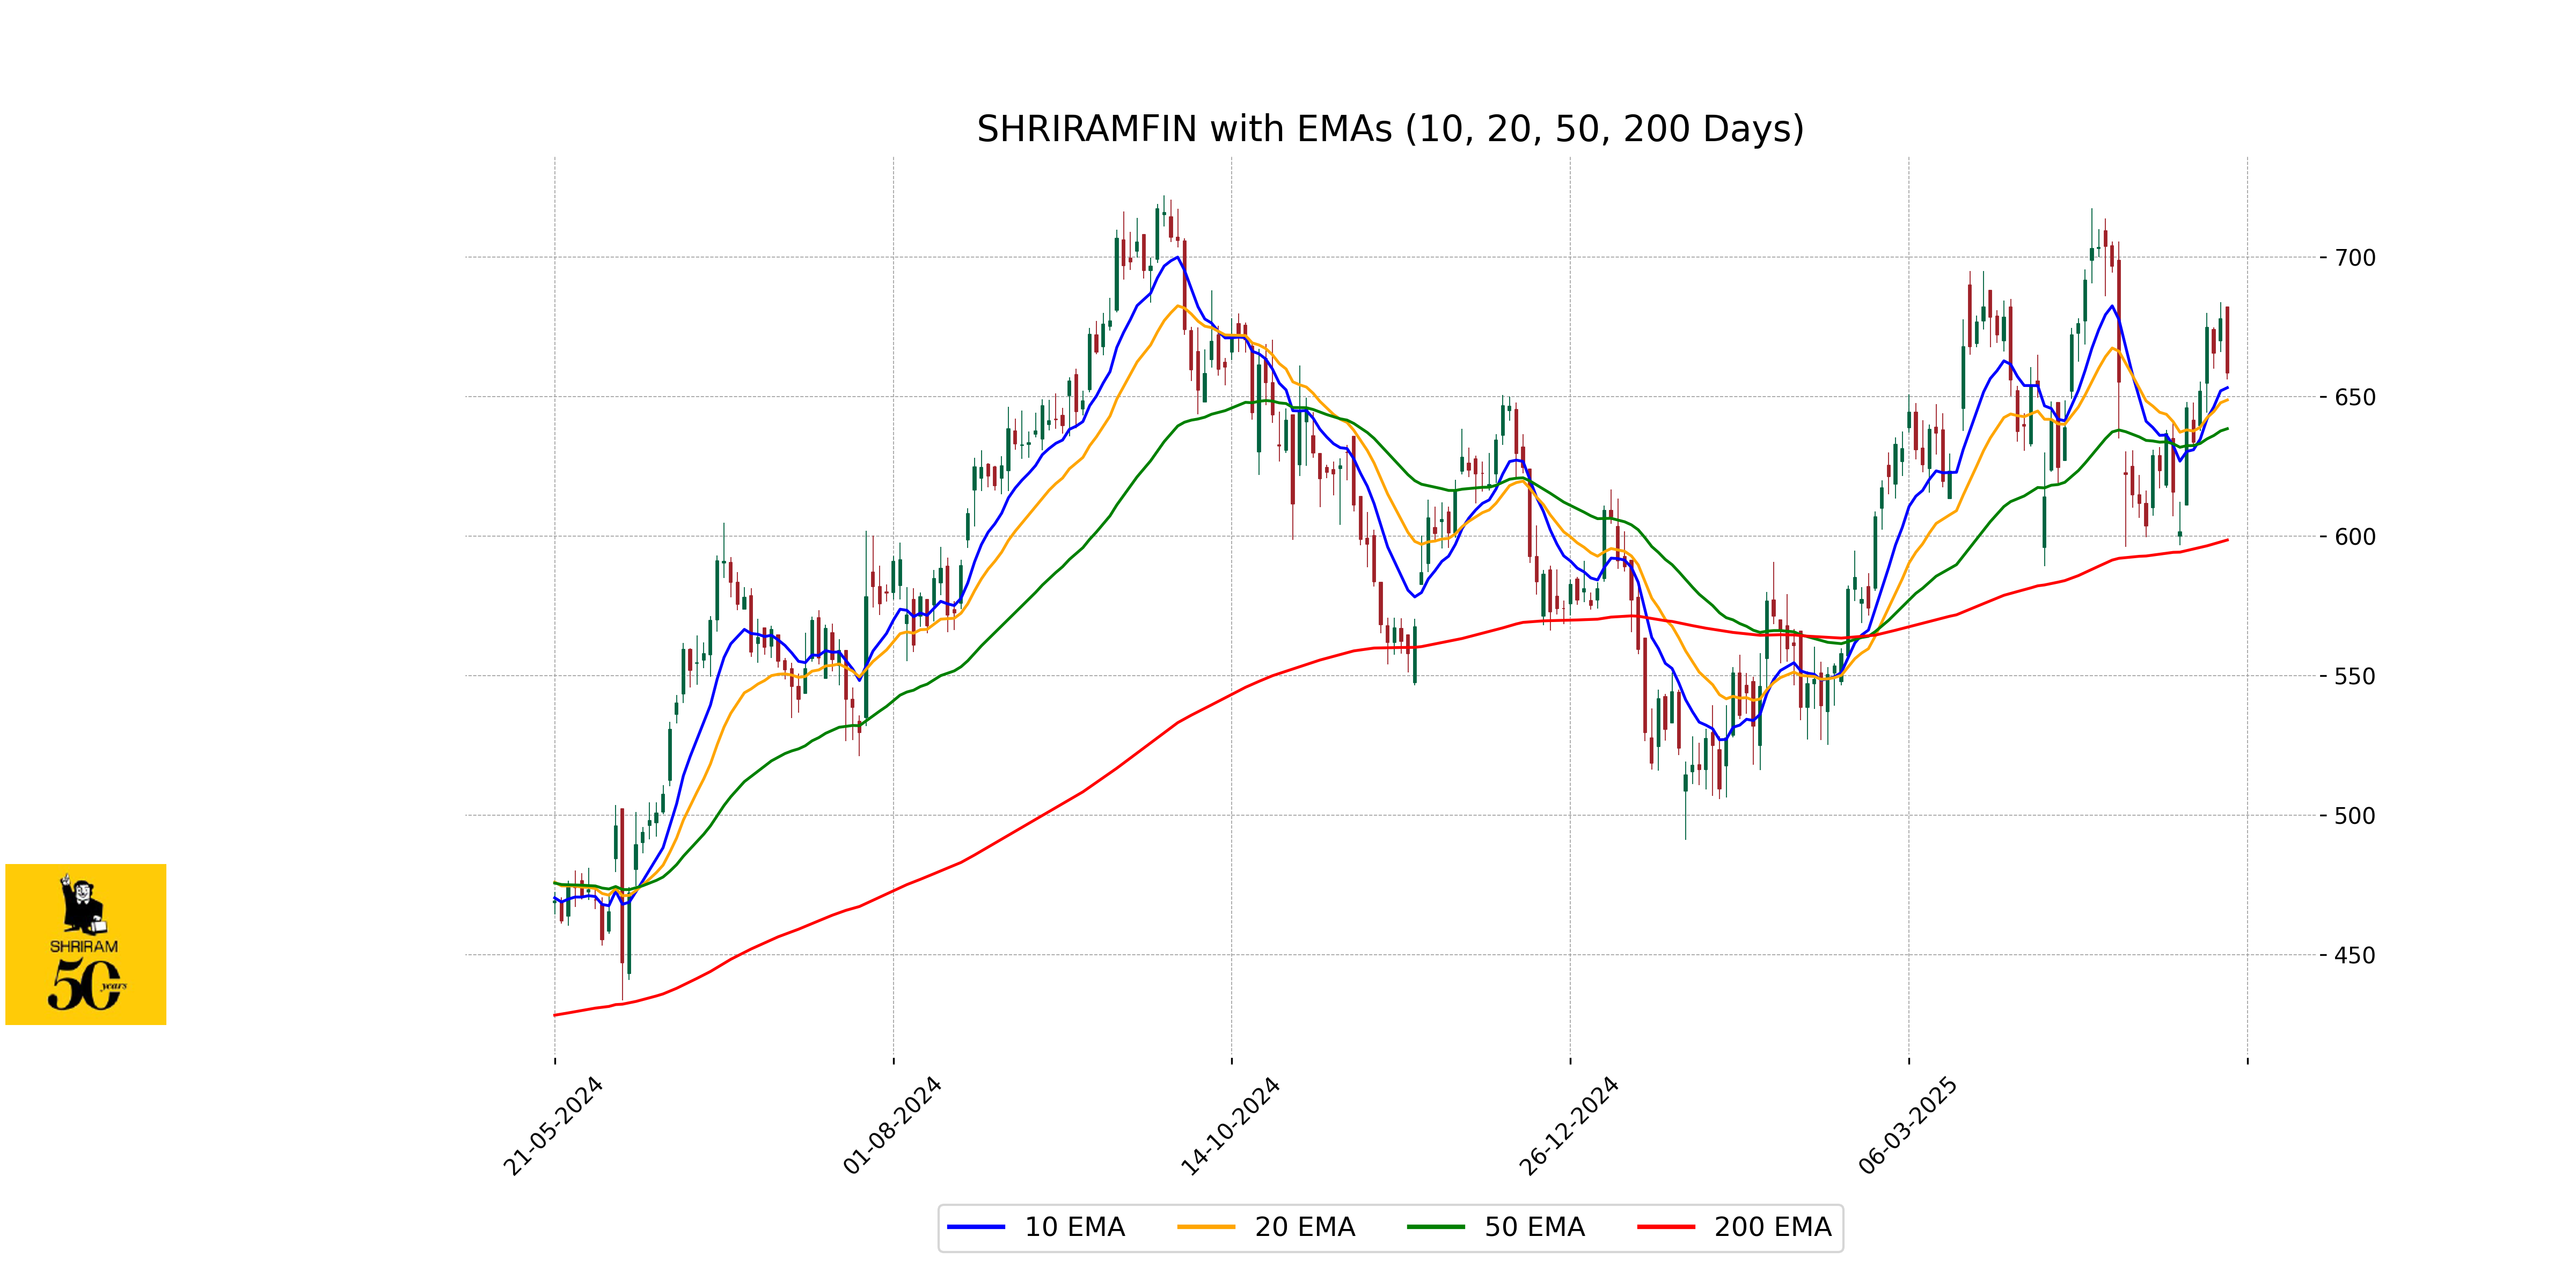
Relationship with Key Moving Averages
Shriram Finance is trading above its 50-day EMA and 200-day EMA, indicating a potential bullish trend, while it remains slightly above the 10-day and 20-day EMAs, showing recent strength despite a recent drop in price. This positioning suggests continued investor interest and support at current levels.
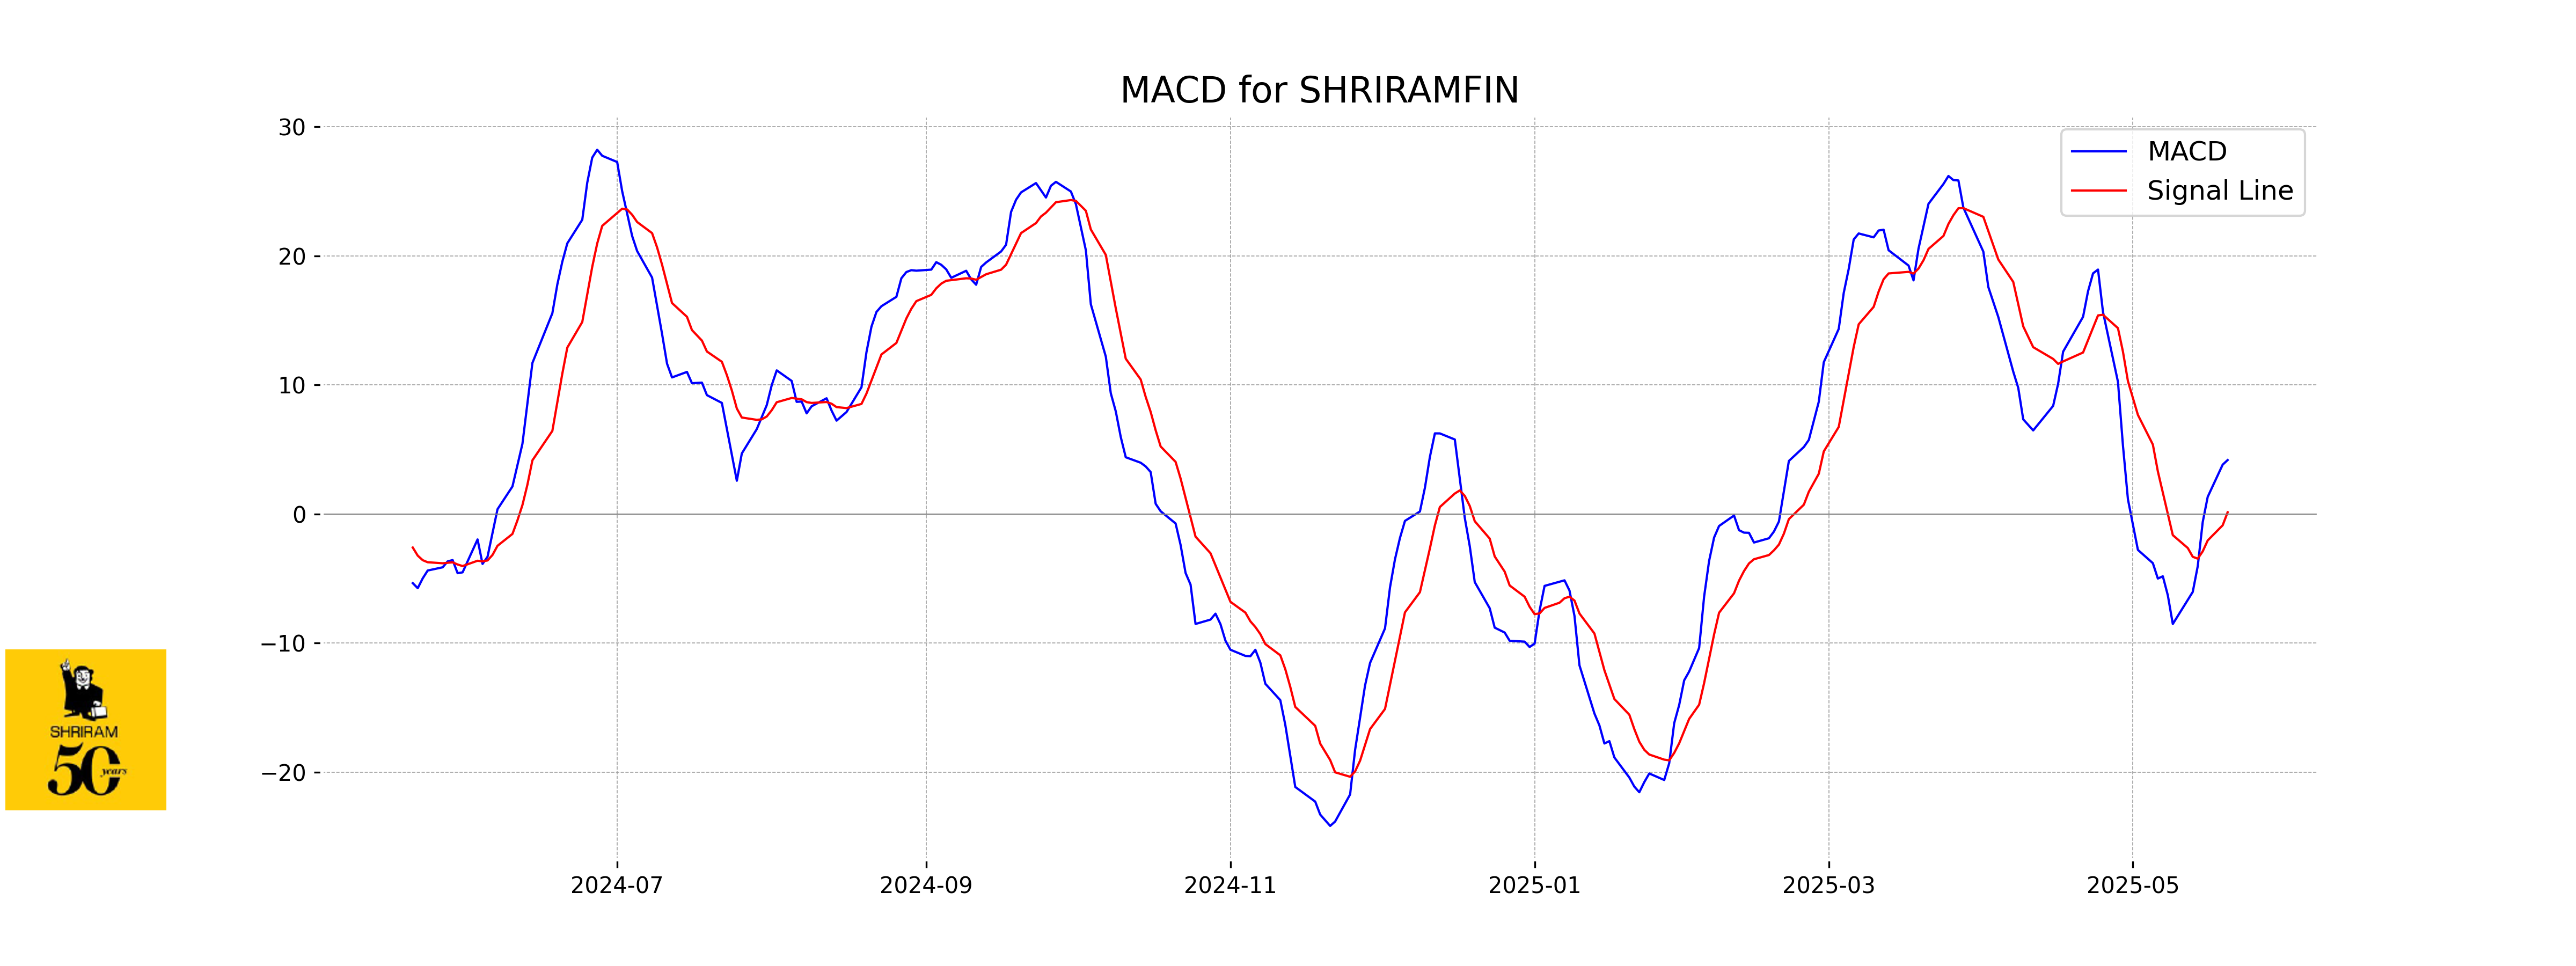
Moving Averages Trend (MACD)
Shriram Finance MACD Analysis: The MACD value of 4.19 is above the MACD Signal line of 0.14, suggesting a bullish momentum in Shriram Finance's stock price. However, investors should consider other indicators to confirm the trend.
RSI Analysis
RSI Analysis for Shriram Finance: The Relative Strength Index (RSI) for Shriram Finance is 52.69, which indicates a neutral position. With an RSI around the midpoint of the scale (typically between 30 and 70), Shriram Finance is neither overbought nor oversold, suggesting a balanced trading environment.
Up Next
NSE Nifty 50: Top 5 stock losers of May 20, 2025

New Zealand commits USD 20 bn investment in India under FTA in 15 yrs; on lines of EFTA pact

India, New Zealand conclude FTA talks; pact to offer duty-free access, USD 20 bn FDI

FTA with New Zealand to significantly deepen bilateral economic engagement: Govt

Rupee breaches 91-mark against US dollar for first time in intra-day trade

Microsoft commits USD 17.5 billion investment in India: CEO Satya Nadella

More videos

CBI books Anil Ambani's son, Reliance Home Finance Ltd. in Rs 228 crore bank fraud case

RBI raises FY26 GDP growth projection to 7.3 pc

RBI trims policy interest rate by 25bps to 5.25pc, loans to get cheaper

Rupee slumps to all-time low of 90.25 against US dollar in intra-day trade

Reliance completes merger of Star Television Productions with Jiostar

India to lead emerging market growth with 7pc GDP rise in 2025: Moody’s

Nifty hits record high after 14 months; Sensex nears all-time peak

Reliance stops Russian oil use at its only-for-export refinery to comply with EU sanctions

ED attaches fresh assets worth over Rs 1,400 cr in case against Anil Ambani's Reliance Group

India signs one-year deal to import 2.2 million tonnes of LPG from US