


Highlights
- Cipla trades below key EMAs, signaling bearish momentum
- IndusInd Bank's RSI 25.98 suggests possible oversold rebound
- Wipro nears oversold zone with RSI at 36.63
Latest news

HCLTech named as one of the World's Most Ethical Companies® by Ethisphere for third consecutive year

Allianz Partners Australia's 2025 State of Student Healthcare Report Unpacks the Complex Realities of International Students

India Smart Utility Week 2026 held in New Delhi with 2000+ Delegates, 230+ experts and Speakers and Participation from 40+ Utilities
, Learning Links Foundation & Shell India Launch NXplorers Blended Learning Model to Strengthen STEM Innovation in Schools")
Atal Innovation Mission (AIM), Learning Links Foundation & Shell India Launch NXplorers Blended Learning Model to Strengthen STEM Innovation in Schools

"Revenge ho toh Dhurandhar jaisa": Preity Zinta is all praise for Ranveer Singh's 'Dhurandhar 2'

"Patriotism with swag": Allu Arjun praises Ranveer Singh's 'Dhurandhar 2' ahead of release

Bloodbath in markets, Sensex crashes by 1,953 pts at open amid attacks on energy infra in West Asia

Meet FurryScan - The Smart AI Assistant for Pet Parents
NSE Nifty 50: Top 5 stock losers of March 31, 2025


In this article, we will explore the technical indicators of some of the low-performing stocks on the Indian stock market, including CIPLA, INDUSINDBK, M&M, SHRIRAMFIN, and WIPRO.
By looking at these stocks through the lens of key technical factors, we aim to better understand their price movements, trends, and potential future performance.

Analysis for Cipla - March 31, 2025
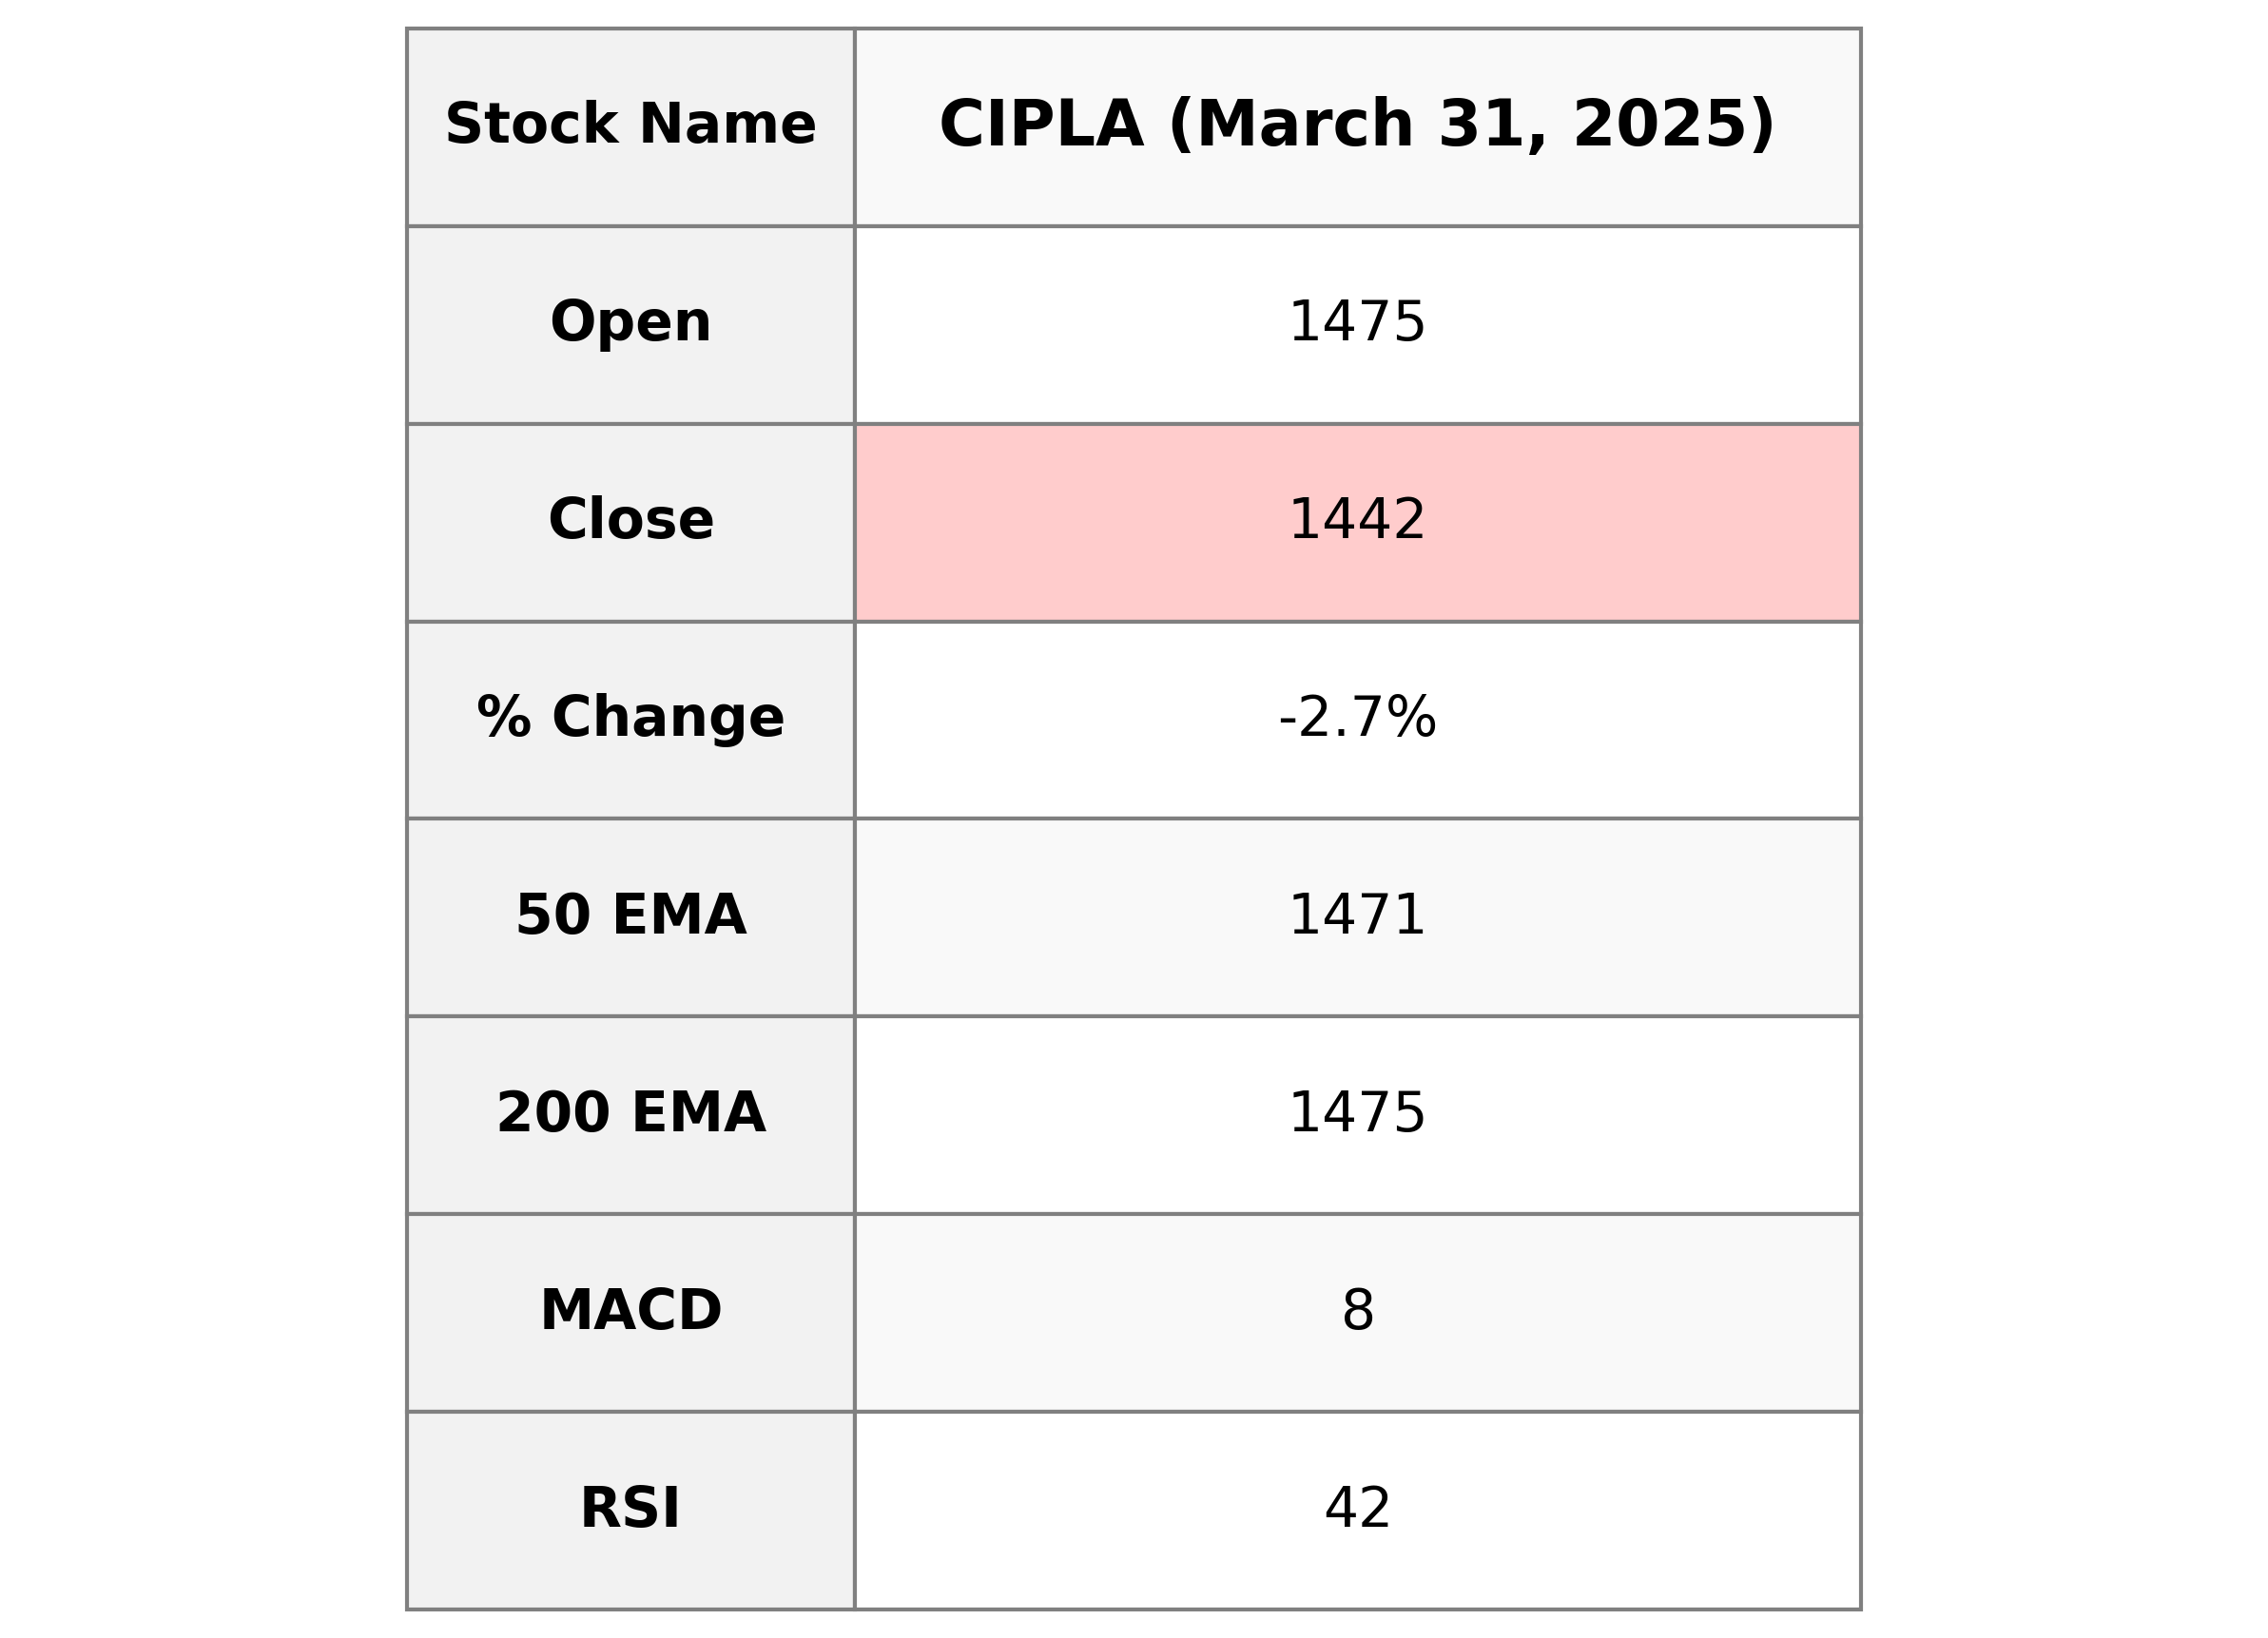
Cipla's stock performance experienced a decline with a closing price of 1442.20 INR, showing a percentage change of -2.74% from the previous close. With a volume of 1,495,932 shares traded, the stock's Relative Strength Index (RSI) stands at 42.25, indicating it is approaching an oversold level. Cipla operates in the Healthcare sector, specifically in the Drug Manufacturers - Specialty & Generic industry.

Relationship with Key Moving Averages
Cipla is currently trading below its 50-day EMA at 1442.20, compared to the average of 1470.75. It's also under both the 200-day EMA of 1475.06 and the 10-day EMA of 1482.15, indicating a bearish trend in the short to long term.
Moving Averages Trend (MACD)
Cipla's MACD value is 7.87, which is slightly below the MACD Signal value of 9.98. This indicates a bearish signal, suggesting potential downward momentum in the stock price. Investors should be cautious and consider other indicators before making a decision.

RSI Analysis
Cipla's RSI (Relative Strength Index) is 42.25, indicating that the stock is currently in the neutral zone closer to being oversold. Generally, an RSI below 30 is considered oversold, while above 70 is considered overbought.

Analysis for IndusInd Bank - March 31, 2025
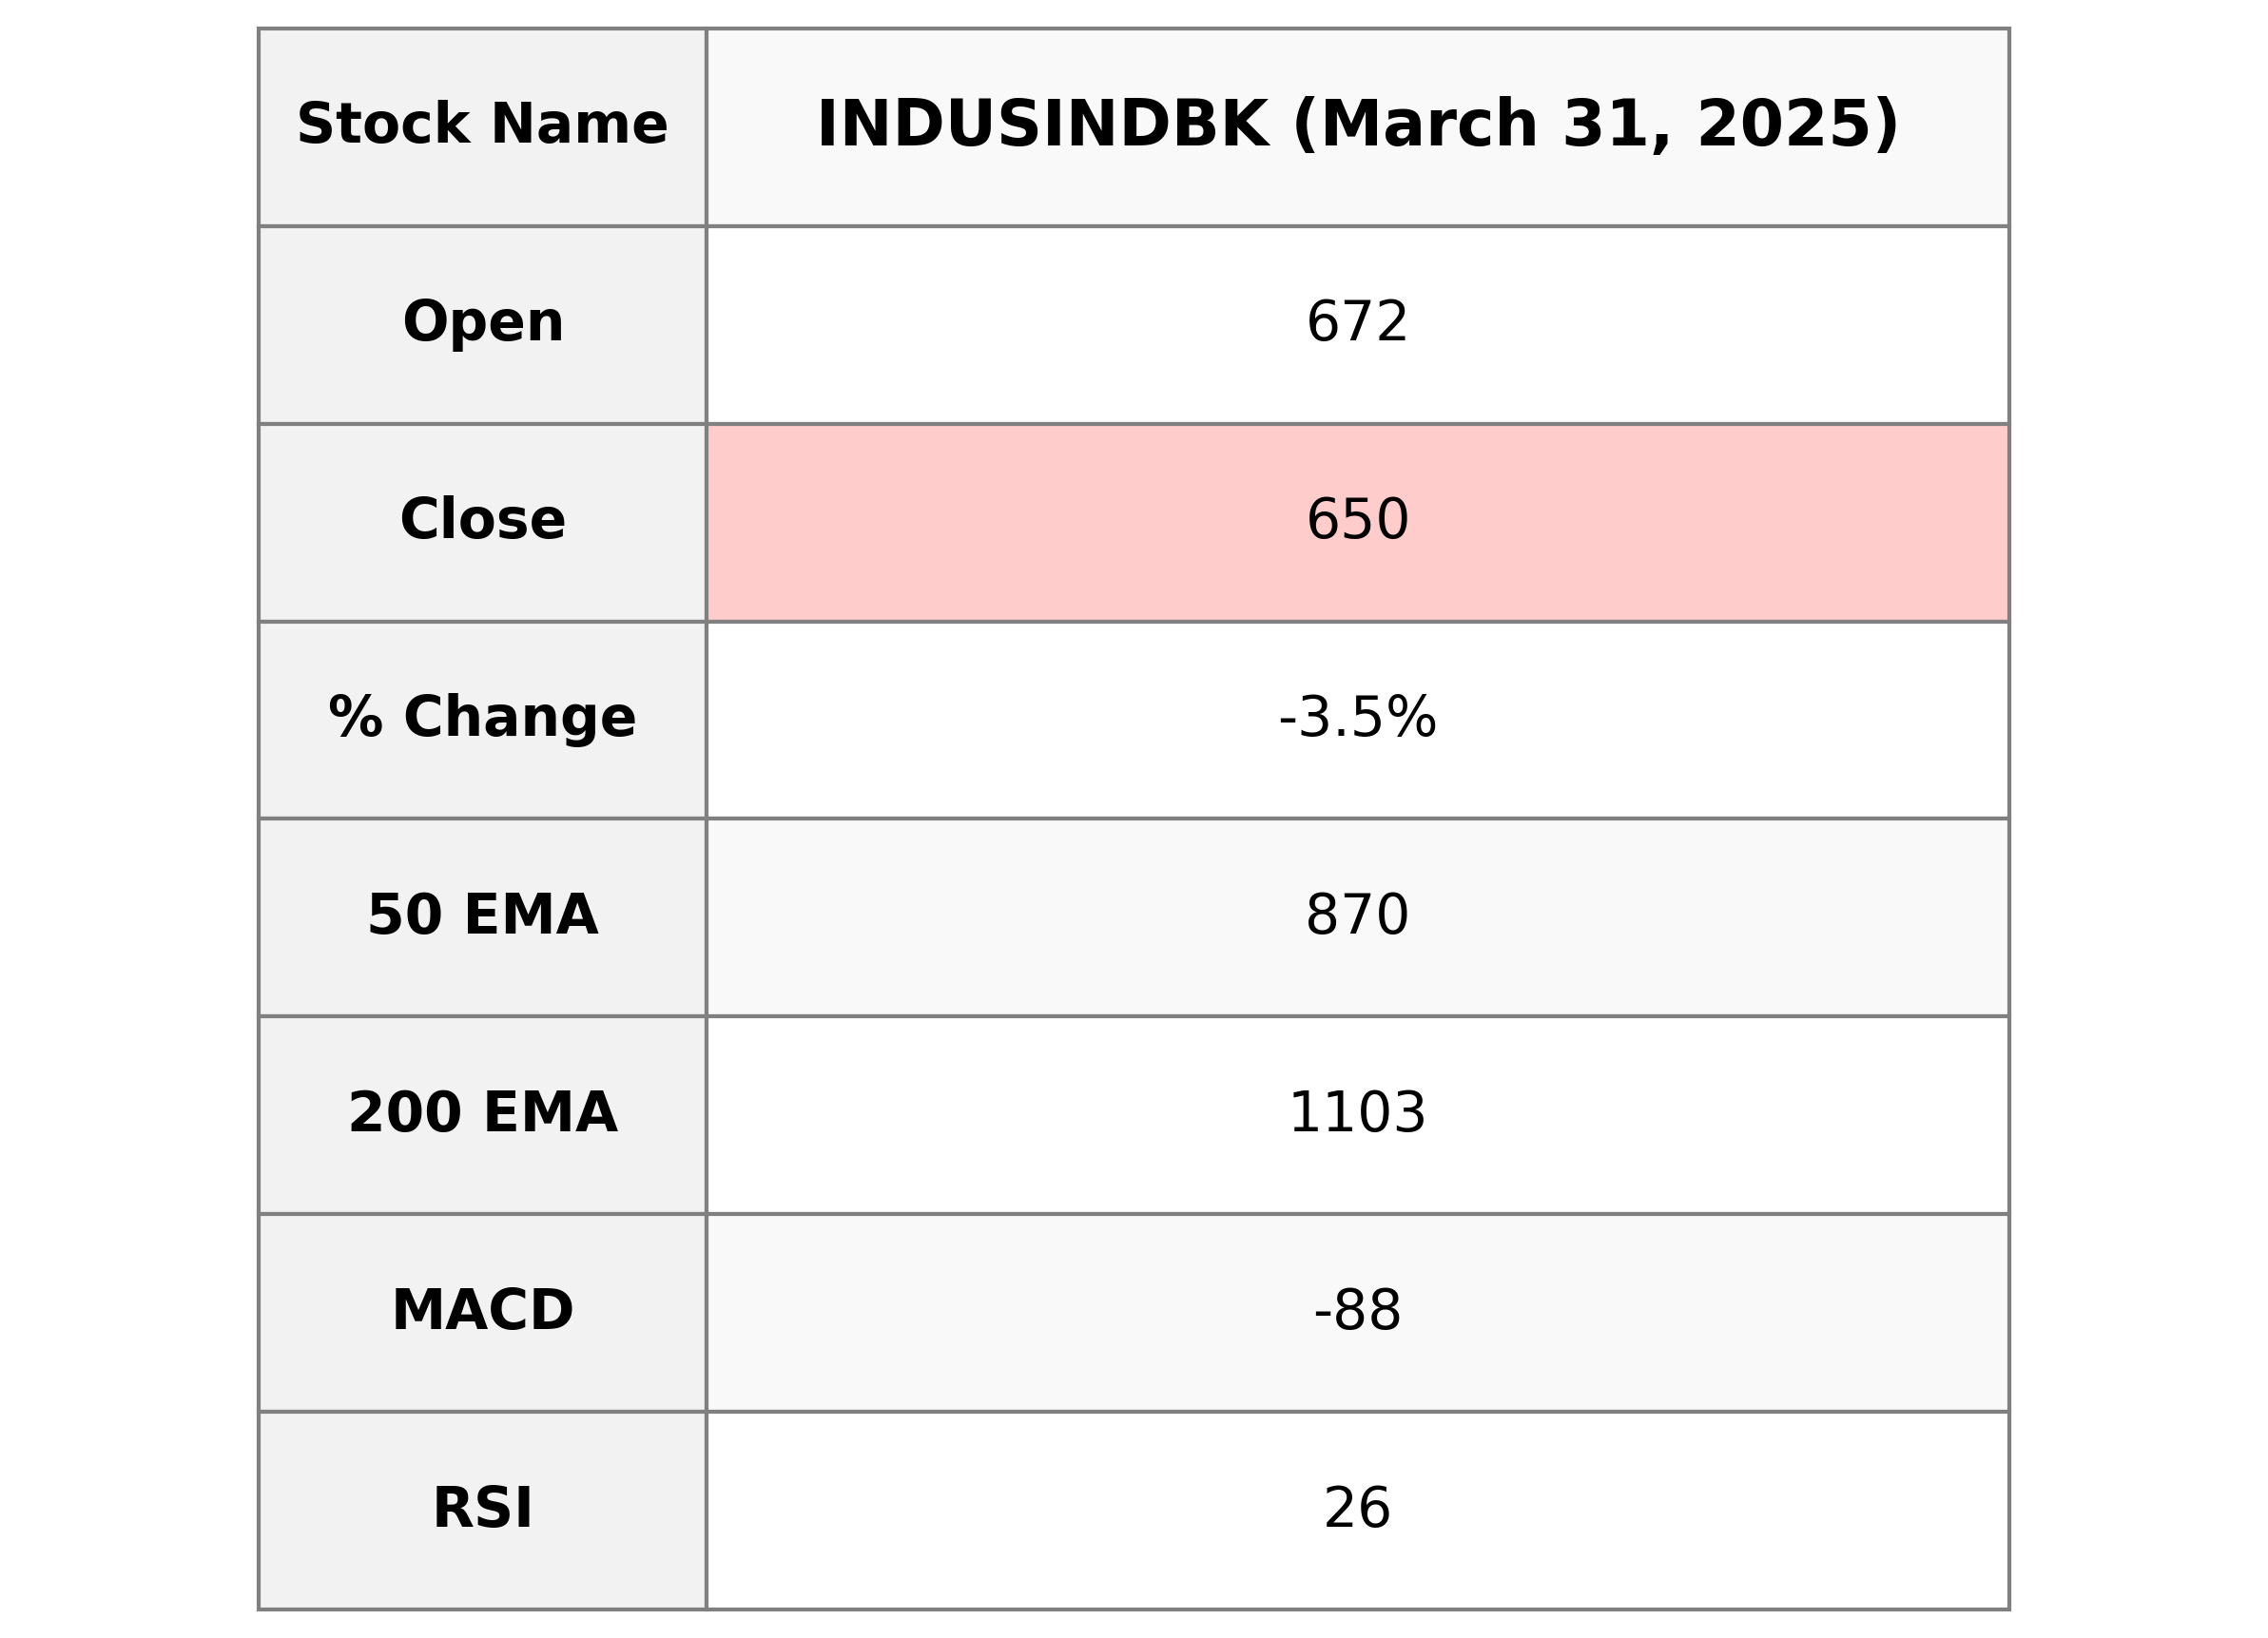
IndusInd Bank has experienced a decline with a closing price of ₹649.85, down 3.52% from the previous close of ₹673.55. The stock's RSI is at 25.98, indicating it may be oversold. The MACD shows a negative divergence, suggesting bearish sentiment. Its market cap stands at ₹505.6 billion, and it has a PE ratio of 6.97, highlighting potential undervaluation compared to industry averages.

Relationship with Key Moving Averages
IndusInd Bank's trading price is significantly below its key moving averages, with the current close price of 649.85 compared to the 50-day EMA at 870.36, and the 200-day EMA at 1102.92, indicating a bearish trend. Additionally, the 10-day and 20-day EMAs also reveal a declining pattern, with values higher than the closing price, at 687.59 and 756.48 respectively.
Moving Averages Trend (MACD)
The MACD for IndusInd Bank indicates bearish momentum as the MACD line (-87.73) is below the signal line (-83.78), suggesting a continued downtrend. With the RSI at 25.98, the stock is potentially oversold.

RSI Analysis
RSI Analysis for IndusInd Bank The Relative Strength Index (RSI) for IndusInd Bank stands at 25.98, which is below the typical oversold threshold of 30. This suggests the stock might be oversold and could be primed for a potential rebound, indicating a possible buying opportunity for investors.

Analysis for Mahindra & Mahindra - March 31, 2025

Mahindra & Mahindra displayed a negative performance with a closing price of 2665.80, marking a 2.46% drop from its previous close. The stock's RSI of 40.94 suggests it is moving towards an oversold territory, while MACD indicates a bearish trend.

Relationship with Key Moving Averages
Mahindra & Mahindra is currently trading below its 50-day EMA of 2816.92 and its 200-day EMA of 2755.74, as its closing price is 2665.80. The stock is also below the 10-day EMA of 2729.86 and 20-day EMA of 2744.35, indicating a bearish trend.
Moving Averages Trend (MACD)
The MACD value for Mahindra & Mahindra is -28.29, which is above the MACD Signal line at -36.84. This crossover indicates a potential bullish signal, suggesting the stock might experience upward momentum, despite the recent downward price movement.

RSI Analysis
RSI Analysis for Mahindra & Mahindra The current RSI (Relative Strength Index) for Mahindra & Mahindra is 40.94, which suggests that the stock is approaching the oversold territory. This might indicate a potential buying opportunity if the trend reverses, but it's important to consider other indicators and market conditions before making investment decisions.

Analysis for Shriram Finance - March 31, 2025

Shriram Finance experienced a decline in its stock price, closing at 656.0 with a -3.32% change from the previous close of 678.5. Despite the decrease, it maintains a strong position in financial services, evidenced by its MACD slightly above the signal line and a market cap of 1,233,999,364,096 INR.

Relationship with Key Moving Averages
Shriram Finance's current stock price of 656.0 is below its 10 EMA of 661.55 and significantly above the 50 EMA of 612.32 as well as the 200 EMA of 576.36. This suggests a short-term bearish momentum but a generally bullish trend in the longer term.
Moving Averages Trend (MACD)
The MACD for Shriram Finance is slightly above its signal line, with a value of 23.737 versus 23.703, indicating a potential bullish sentiment in the short term. The marginal difference suggests that close monitoring is required to determine future movements accurately.

RSI Analysis
RSI Analysis for Shriram Finance: The RSI (Relative Strength Index) for Shriram Finance is 58.62, which indicates a neutral to moderately strong position. Typically, an RSI above 70 is considered overbought, and below 30 is considered oversold. At 58.62, the stock is neither overbought nor oversold, suggesting a balanced trading momentum.

Analysis for Wipro - March 31, 2025

Wipro's recent stock performance shows a closing price at 262.25, marking a decline of approximately 3.66% from its previous close. The stock has experienced a decrease in both price points and volume, as the negative MACD value suggests continued bearish momentum. Additionally, the RSI indicates that the stock is nearing oversold conditions. Its market cap stands at 2,745 billion INR, with a PE ratio of 22.19, signaling a potentially undervalued position in the Technology sector, specifically in the Information Technology Services industry.

Relationship with Key Moving Averages
The closing price of Wipro at 262.25 is below its short-term, medium-term, and long-term moving averages, with the 10 EMA at 268.56, the 50 EMA at 284.67, and the 200 EMA at 274.32. This suggests a potential bearish trend, as the stock is trading below these key moving averages.
Moving Averages Trend (MACD)
The MACD for Wipro is currently -7.97, which is below the MACD Signal line of -8.60, indicating a bearish trend. This suggests that the stock might be in a downward momentum phase. With a low RSI at 36.63, the stock may also be approaching oversold conditions.

RSI Analysis
The RSI (Relative Strength Index) for Wipro is 36.63, which indicates that the stock is approaching the oversold territory. Typically, an RSI below 30 is considered oversold, suggesting potential for a price correction or rebound in the near term.

Up Next
NSE Nifty 50: Top 5 stock losers of March 31, 2025

India's GDP expected to register over 8 pc growth in Sep-Dec: Report

Govt announces seven measures to help boost exports

RBI keeps interest rates on hold after US trade deal boosts outlook

RBI proposes to compensate customers up to Rs 25,000 loss due to fraud

RBI raises GDP growth projection of Q1, Q2 of FY27

More videos

RBI pauses rate cuts, retains interest rate at 5.25 pc

Rupee jumps 122 paise to close at 90.27 against US dollar on India-US trade deal

Stock markets cheer India-US trade deal: Sensex, Nifty surge 2.5 pc

UPI transactions hit record high of Rs 230 lakh crore in 2025-26 till Dec: Govt

Explained: India-US trade deal, tariffs and trade benefits

Trade deal with US adds momentum to India's growth ambition: Industry leaders

Rupee jumps 119 paise to 90.30 against the US dollar on India-US trade deal

President Trump announces US-India trade deal, lowers tariffs from 25 pc to 18 pc

Stock markets cheer India-US trade deal: Sensex jumps over 5 pc; Nifty nears all-time high

Sustaining 7–8% growth top priority to create jobs: FM Nirmala Sitharaman