


Highlights
Latest news

Indian cricket prodigy Vaibhav Suryavanshi honoured with 'Pradhan Mantri Rashtriya Bal Puraskar'

AAP Gujarat chief Isudan Gadhvi calls BJP allegations against MLA Chaitar Vasava as politically driven

Aditya Dhar's 'Dhurandhar' earns over Rs 1000 crore at box office

Australia lead England by 46 after 20 wickets fall on crazy day at MCG

Delhi HC asks Centre to respond on plea seeking GST cut on air purifiers amid worsening air quality

Congress pays tribute to former PM Manmohan Singh on first death anniversary

Ruled out of last two Ashes Tests, Cummins sets sights on T20 World Cup in Feb

CEO among three held for gangrape of woman IT firm manager in Udaipur
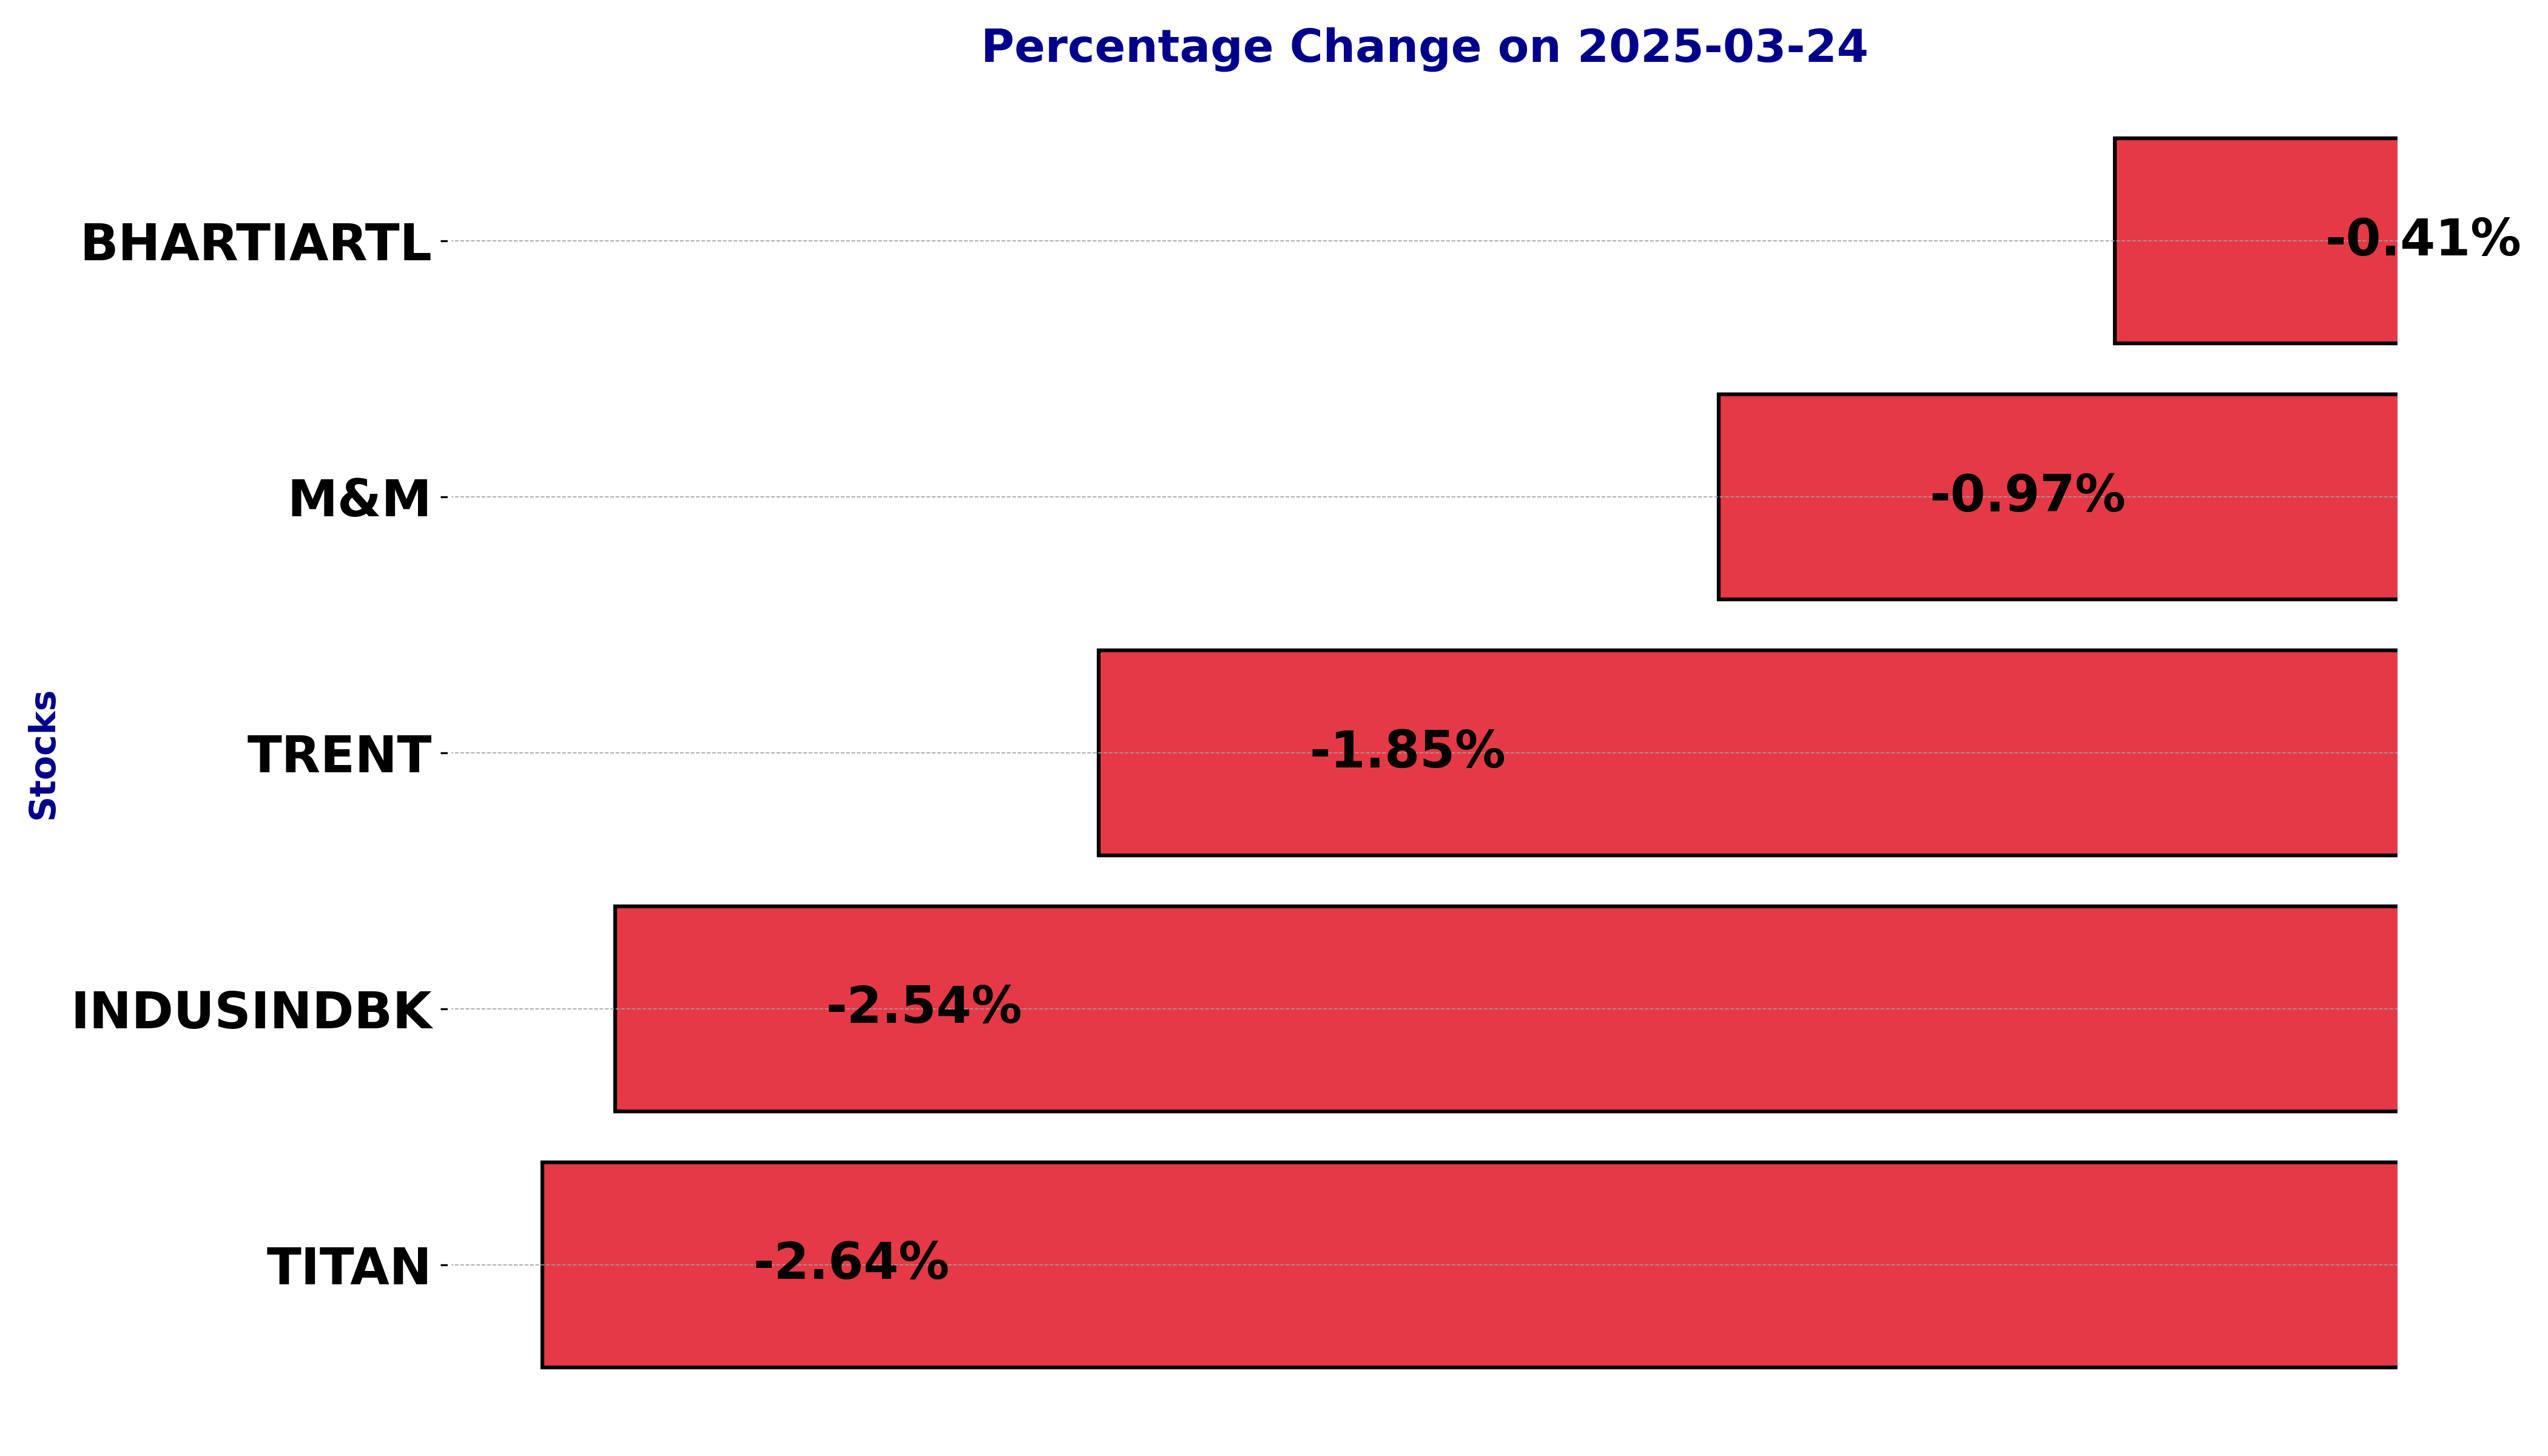
NSE Nifty 50 Top losers: What are the 5 Biggest Stock losers Today March 24, 2025


In this article, we will explore the technical indicators of some of the low-performing stocks on the Indian stock market, including BHARTIARTL, INDUSINDBK, M&M, TITAN, and TRENT.
By looking at these stocks through the lens of key technical factors, we aim to better understand their price movements, trends, and potential future performance.
Analysis for Bharti Airtel - March 24, 2025
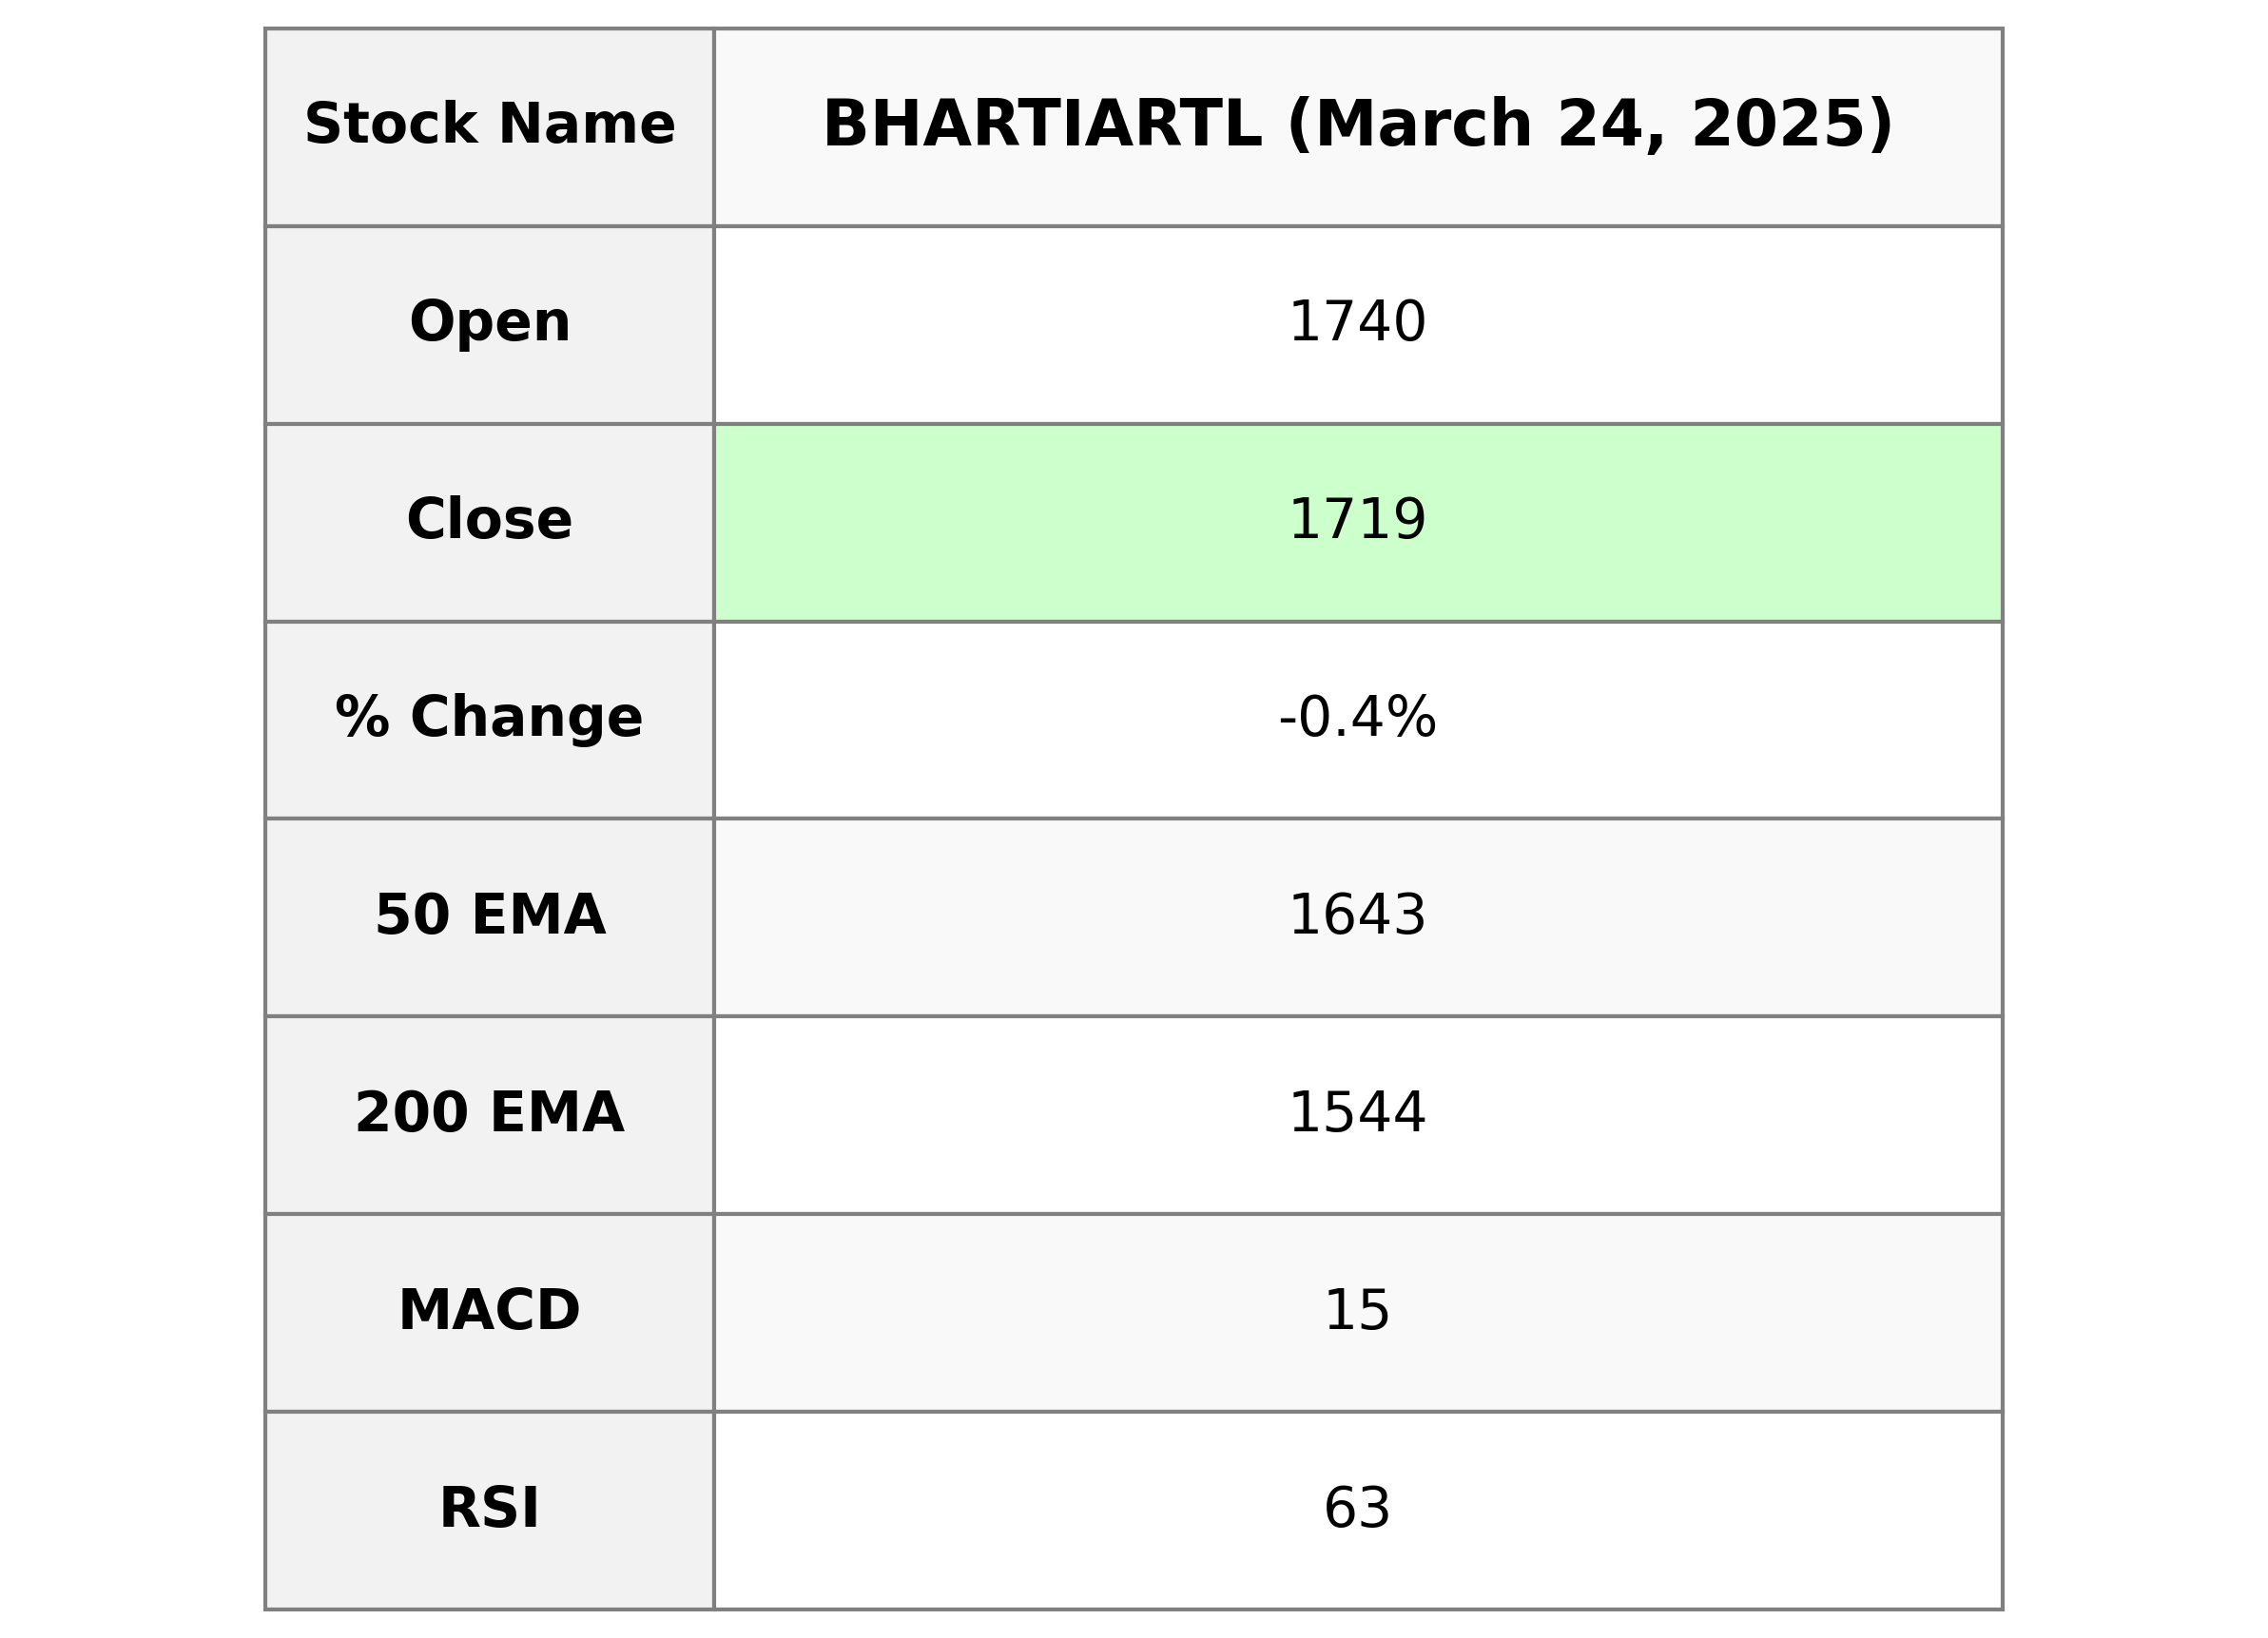
Bharti Airtel closed at 1718.8 with a slight decline of 0.41% from the previous close. The stock experienced a high volume of 4,120,701 shares, showing investor interest. It is trading above its 50-EMA of 1642.53, indicating an upward trend, supported by a positive MACD of 14.75, suggesting bullish momentum.
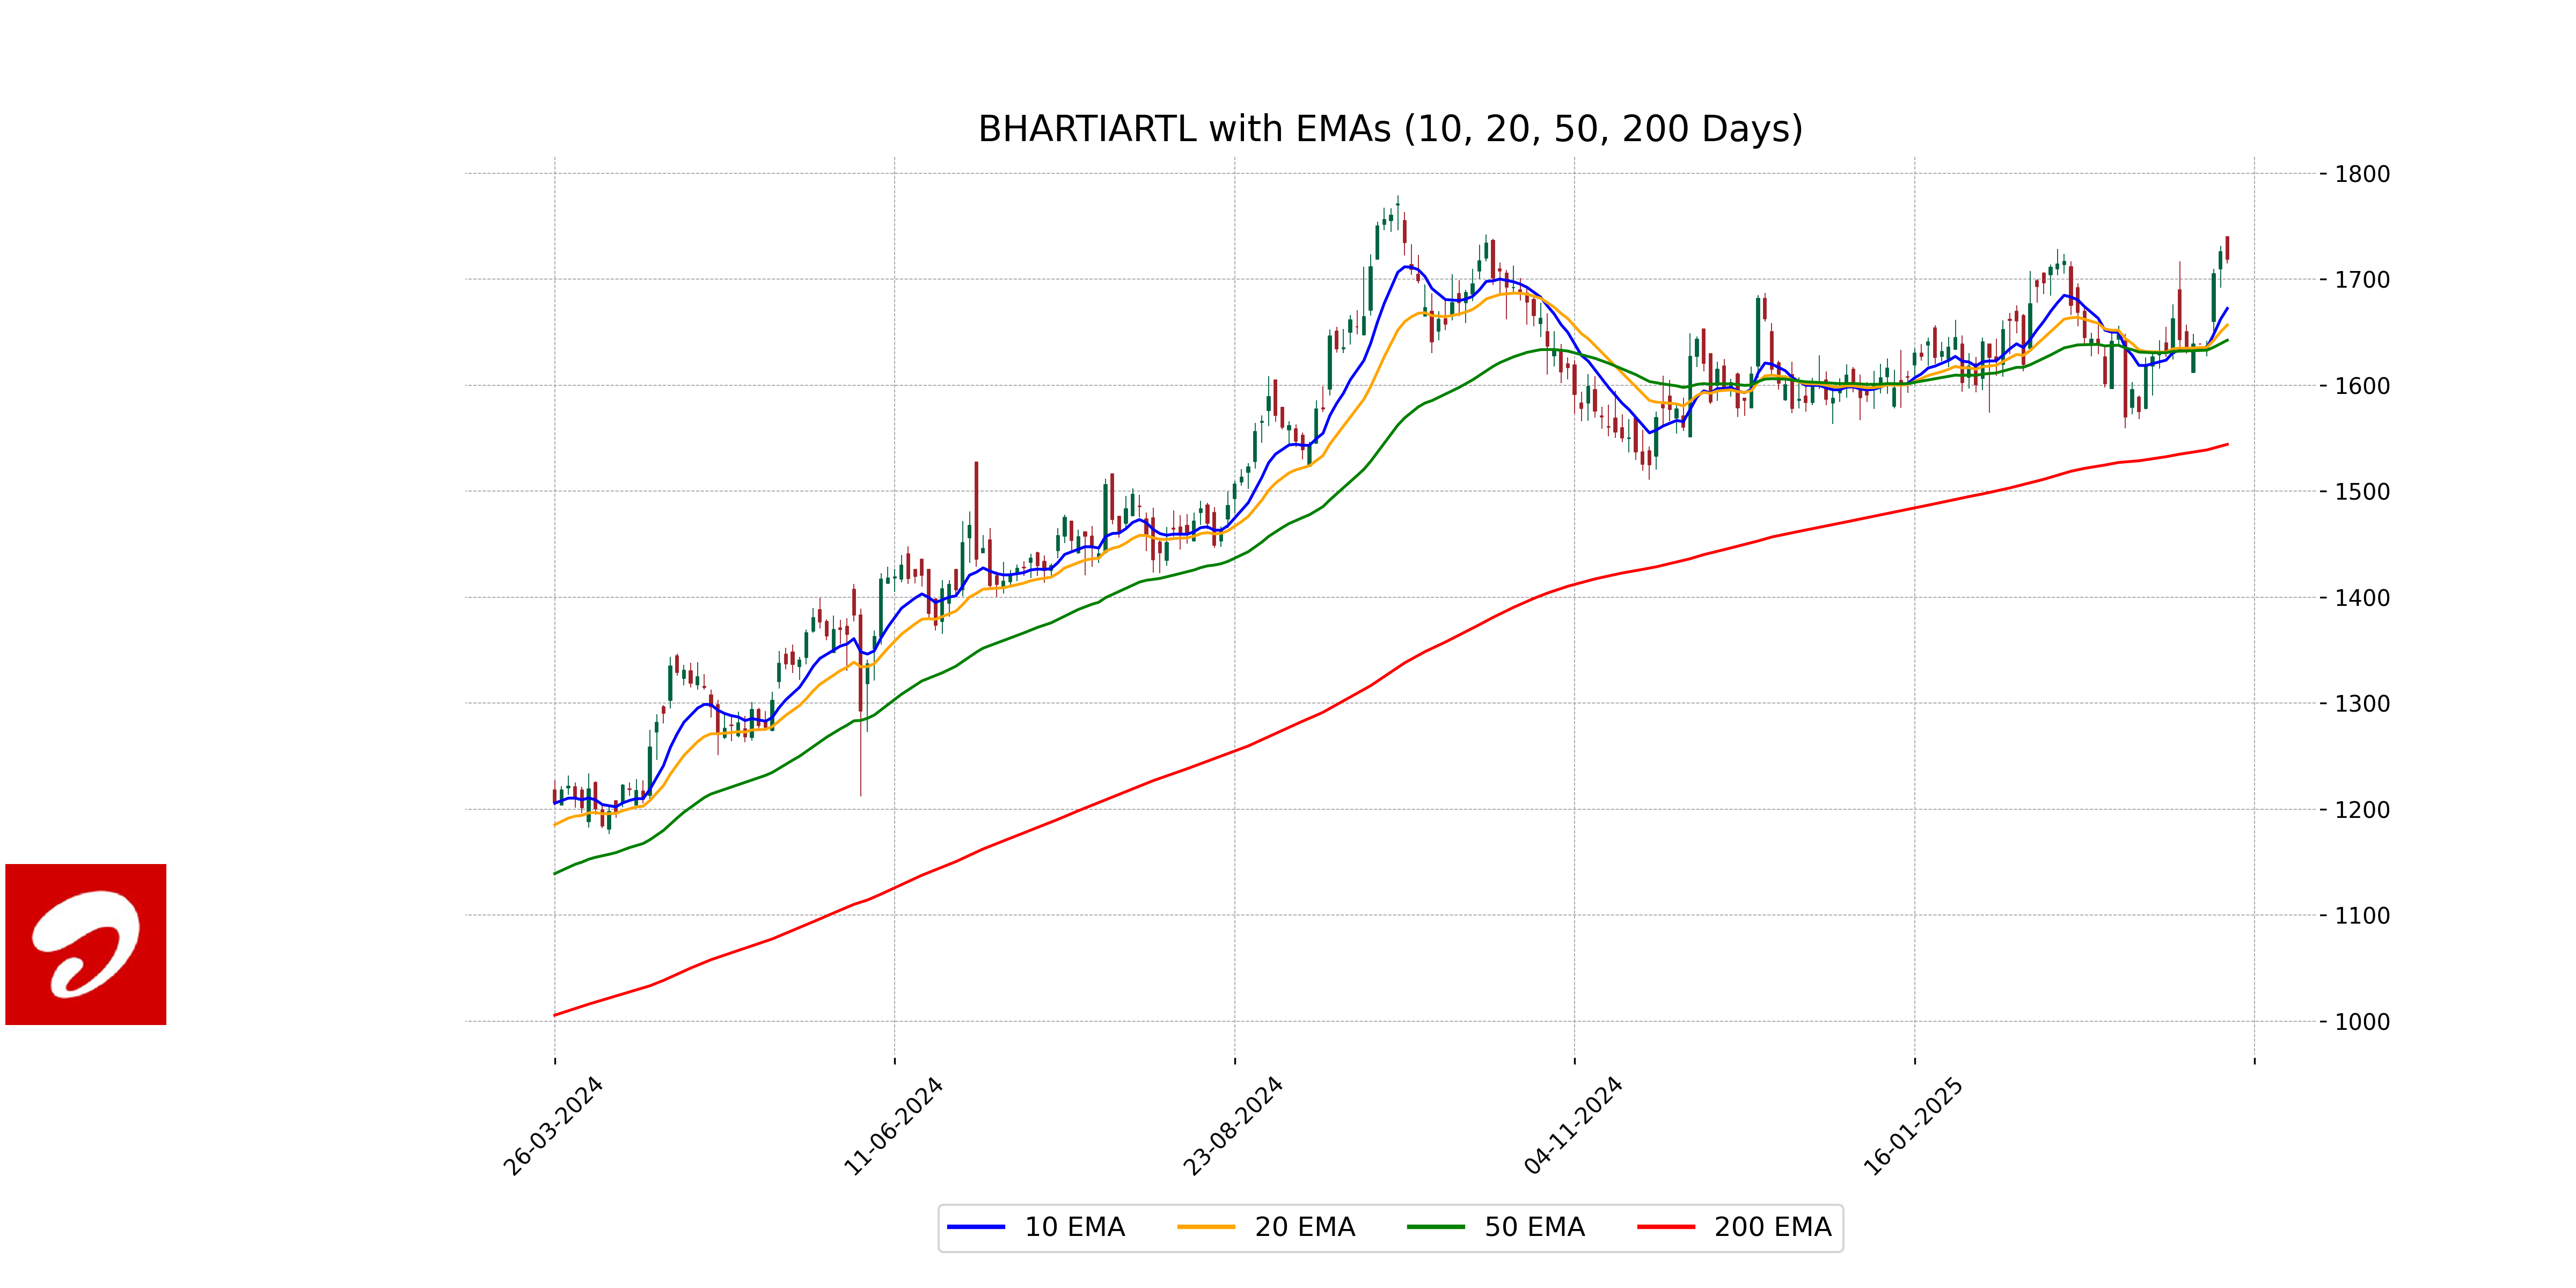
Relationship with Key Moving Averages
Based on the provided data for Bharti Airtel, the stock is trading above its 50-day EMA (1642.53) and 200-day EMA (1544.24), indicating a positive medium to long-term trend. However, the stock is below its 10-day EMA (1672.50) and 20-day EMA (1656.88), suggesting a recent pullback or consolidation in price.
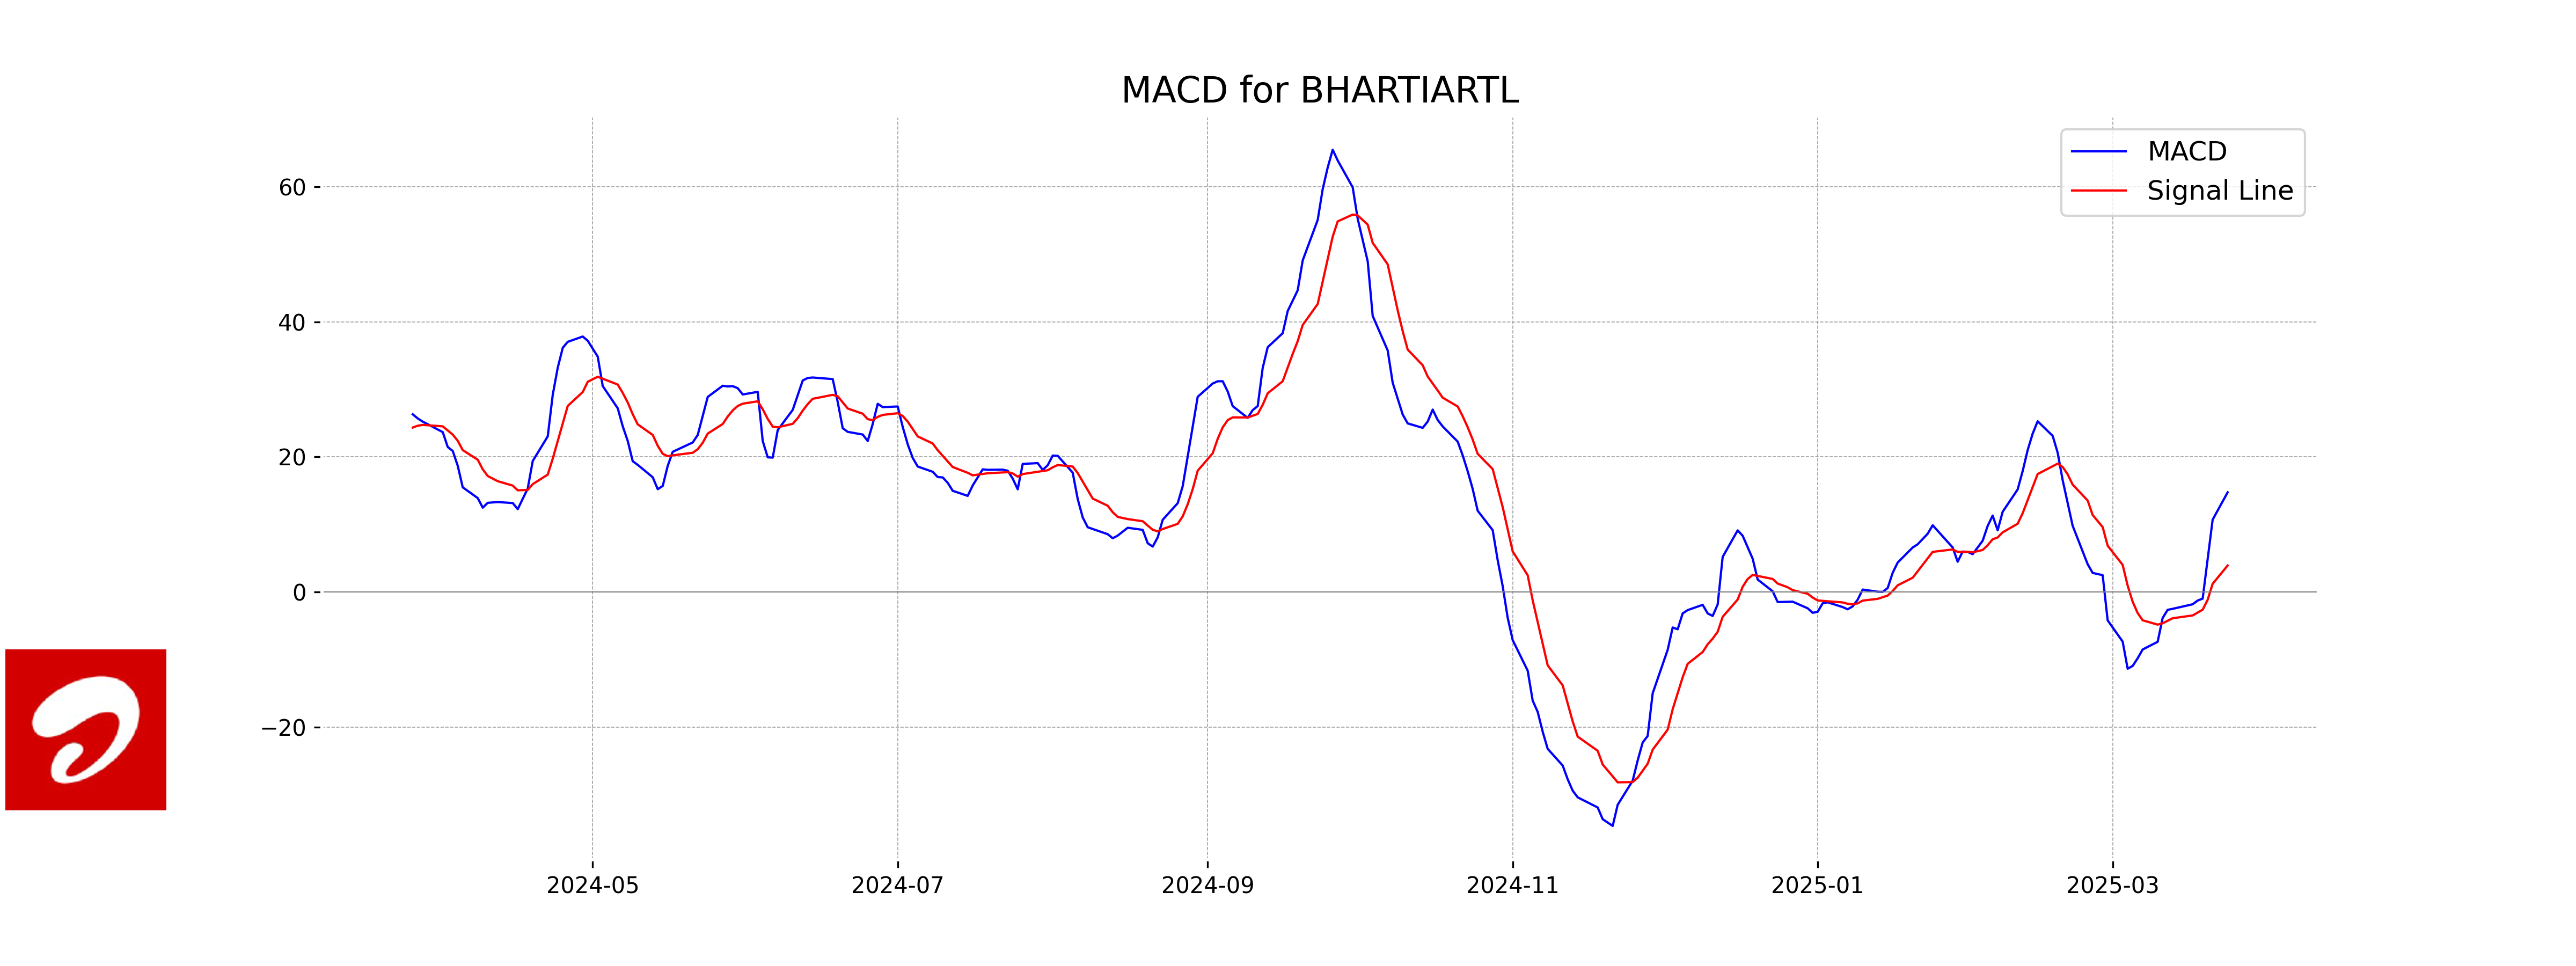
Moving Averages Trend (MACD)
MACD Analysis for Bharti Airtel: The MACD value is 14.75, which is above the MACD Signal of 3.92, indicating a bullish momentum. This suggests that Bharti Airtel may be experiencing positive price movement, supported by a relatively strong RSI of 63.27.
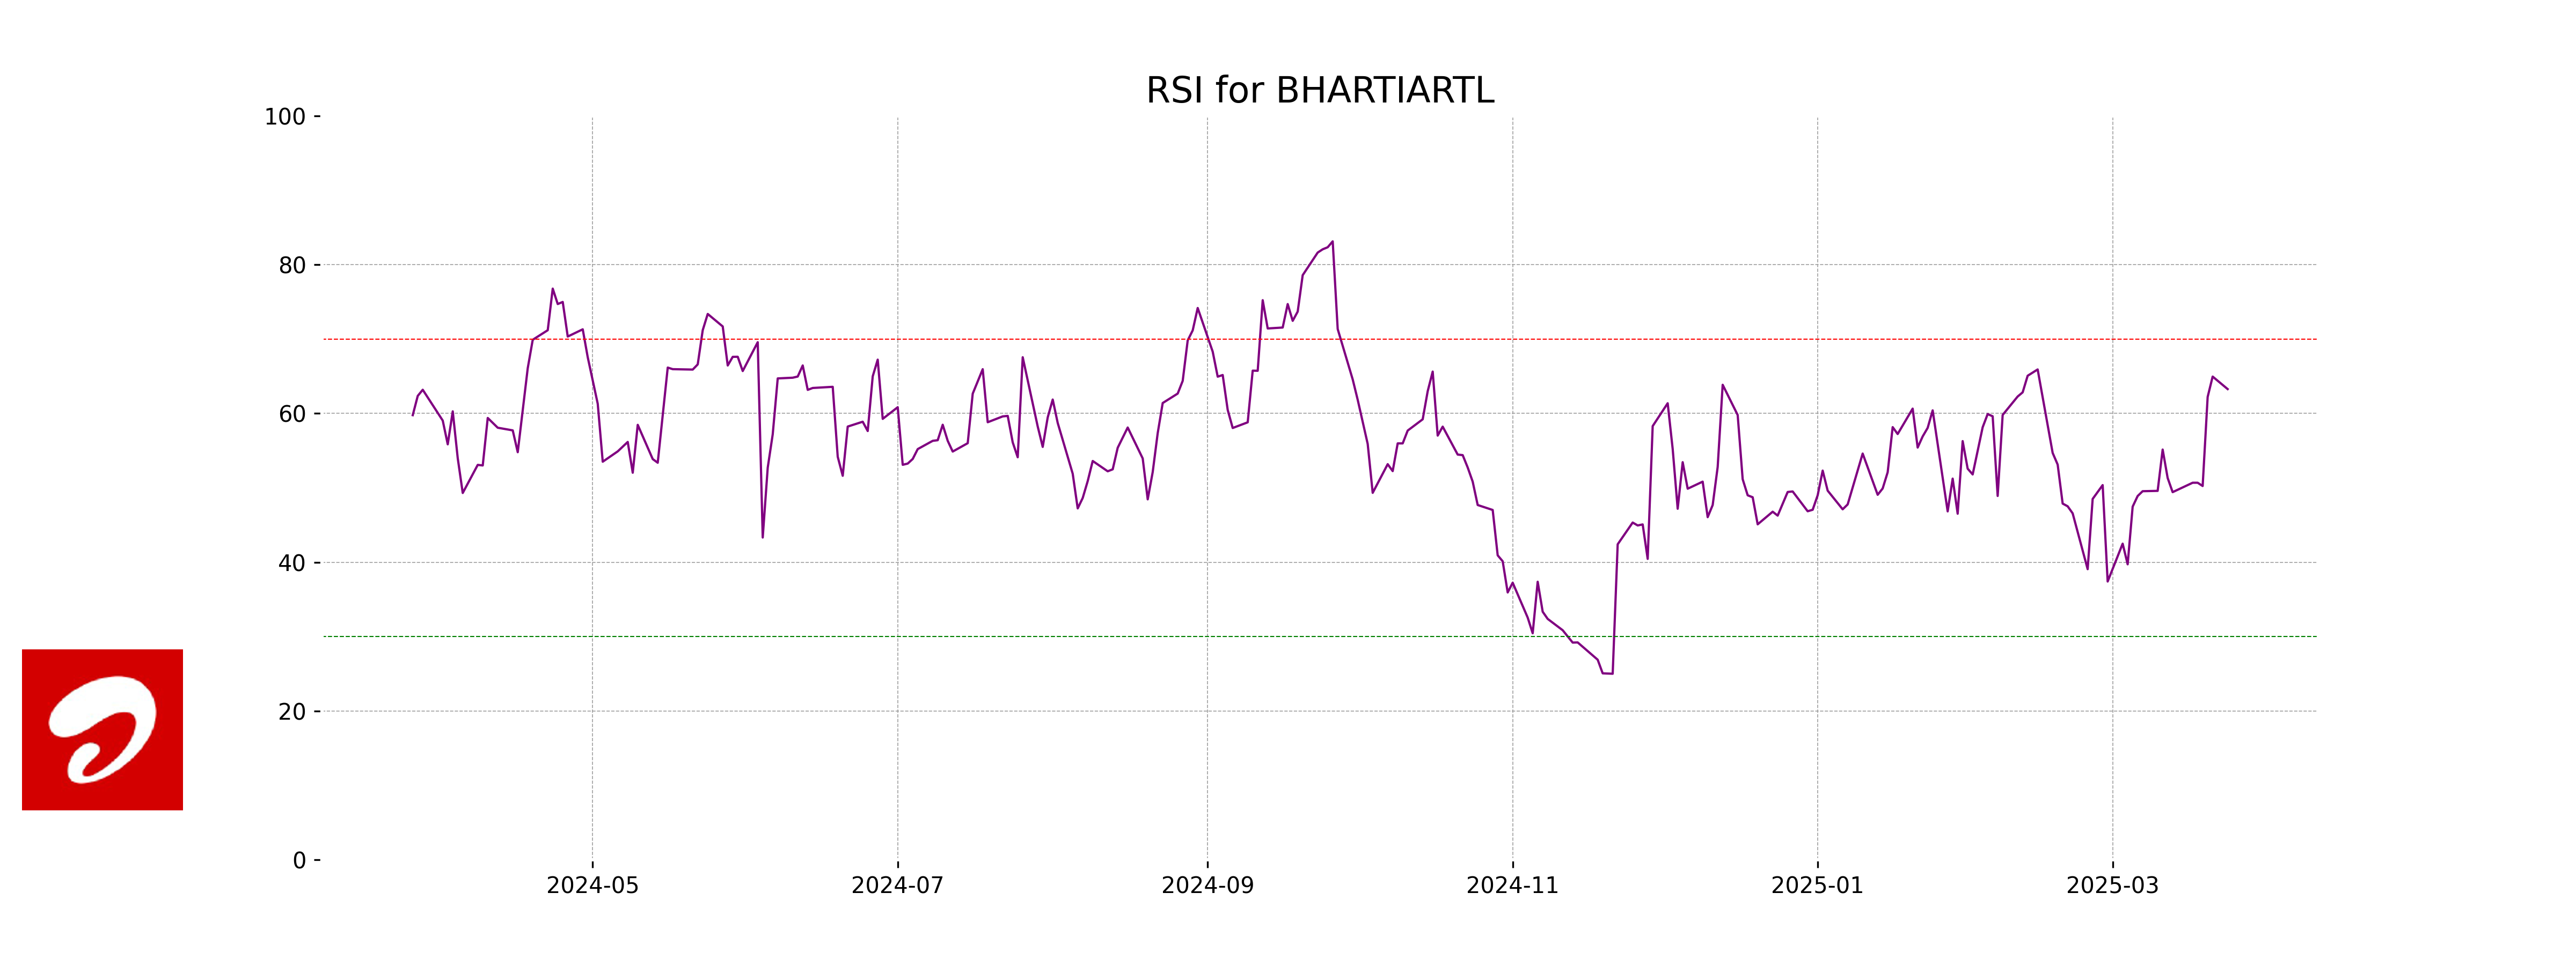
RSI Analysis
RSI Analysis for Bharti Airtel: With an RSI of 63.27, Bharti Airtel is in a moderately bullish zone. RSI values above 70 generally indicate overbought conditions, while values below 30 indicate oversold conditions, hence Bharti Airtel is nearing the upper bound but not yet in overbought territory.
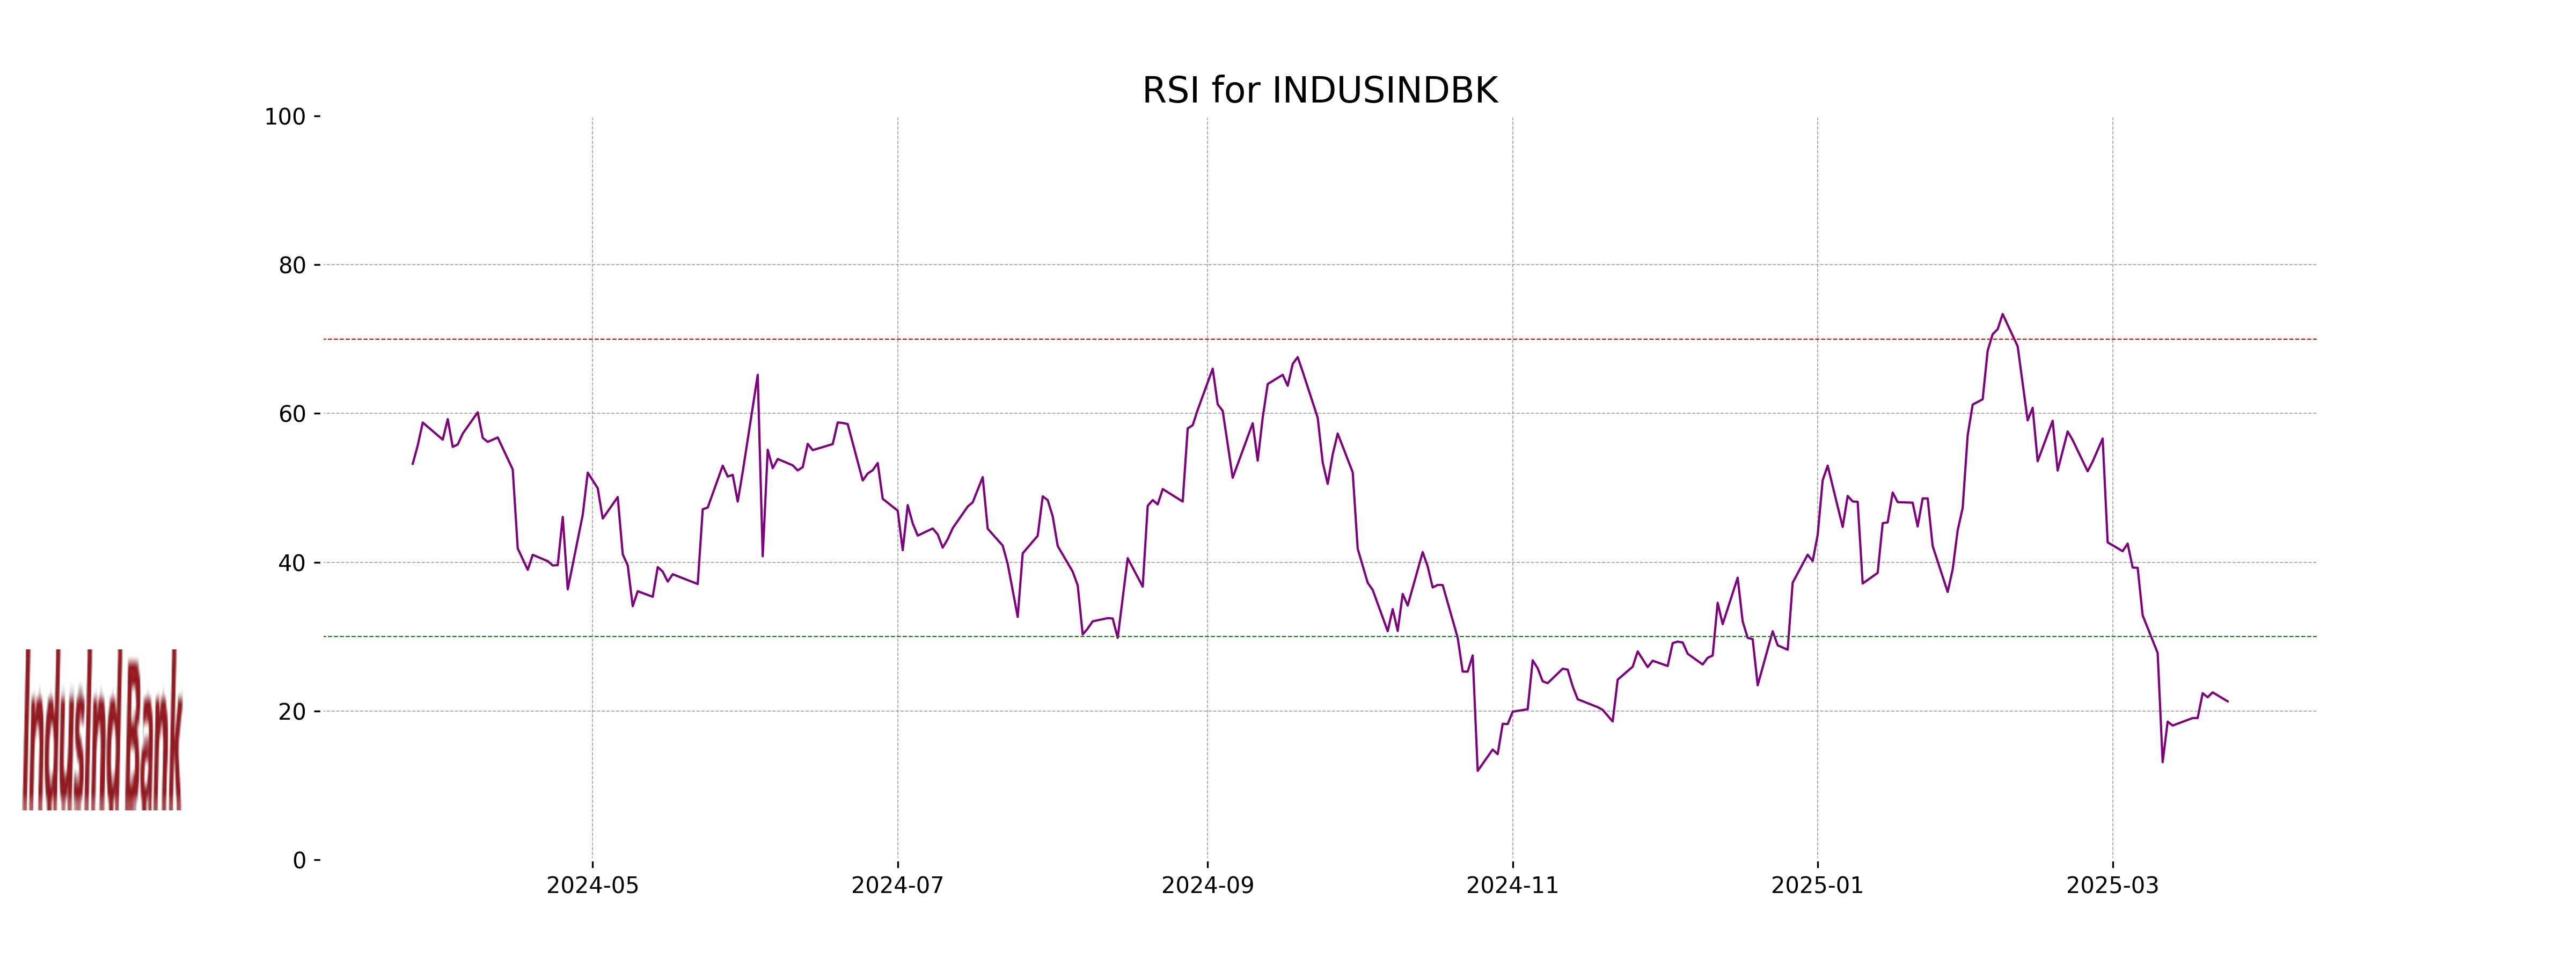
Analysis for IndusInd Bank - March 24, 2025
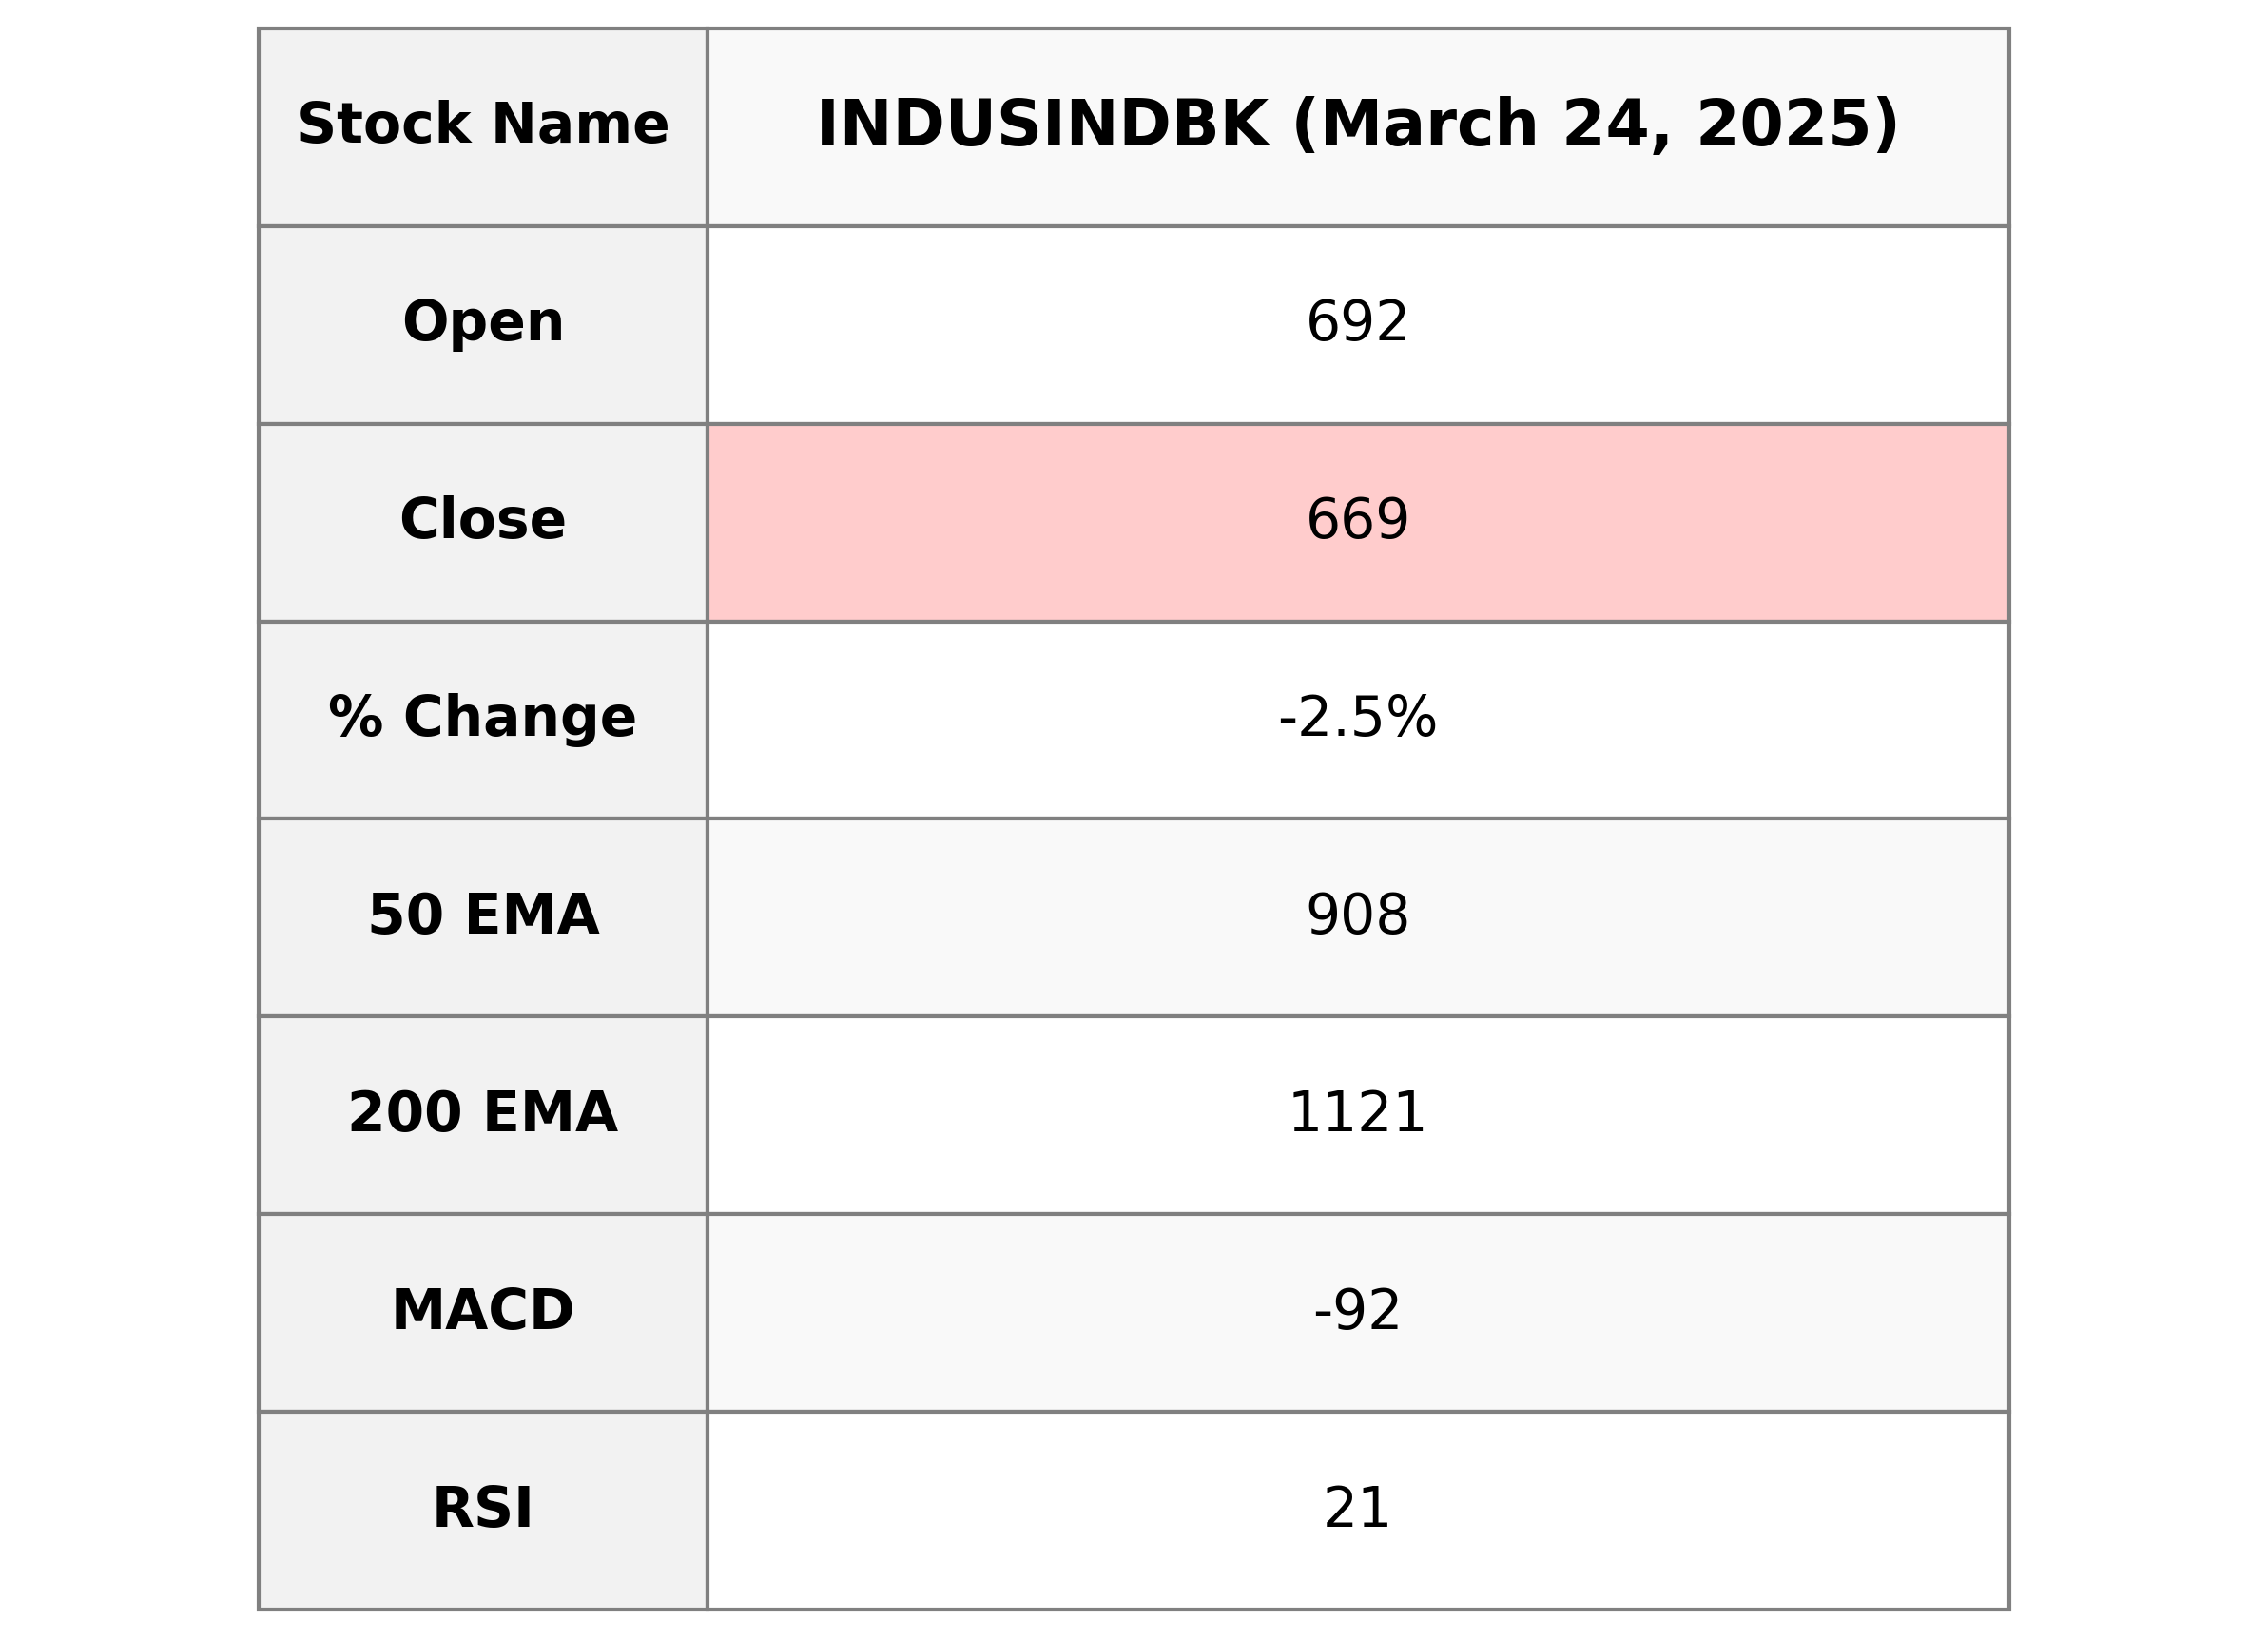
IndusInd Bank experienced a decline in stock performance with a closing price of 669.45, down by 2.54% from the previous close. The RSI indicates the stock is in an oversold condition at 21.29. The stock appears to be trading below its 50-day and 200-day EMAs, signaling a potential bearish trend.
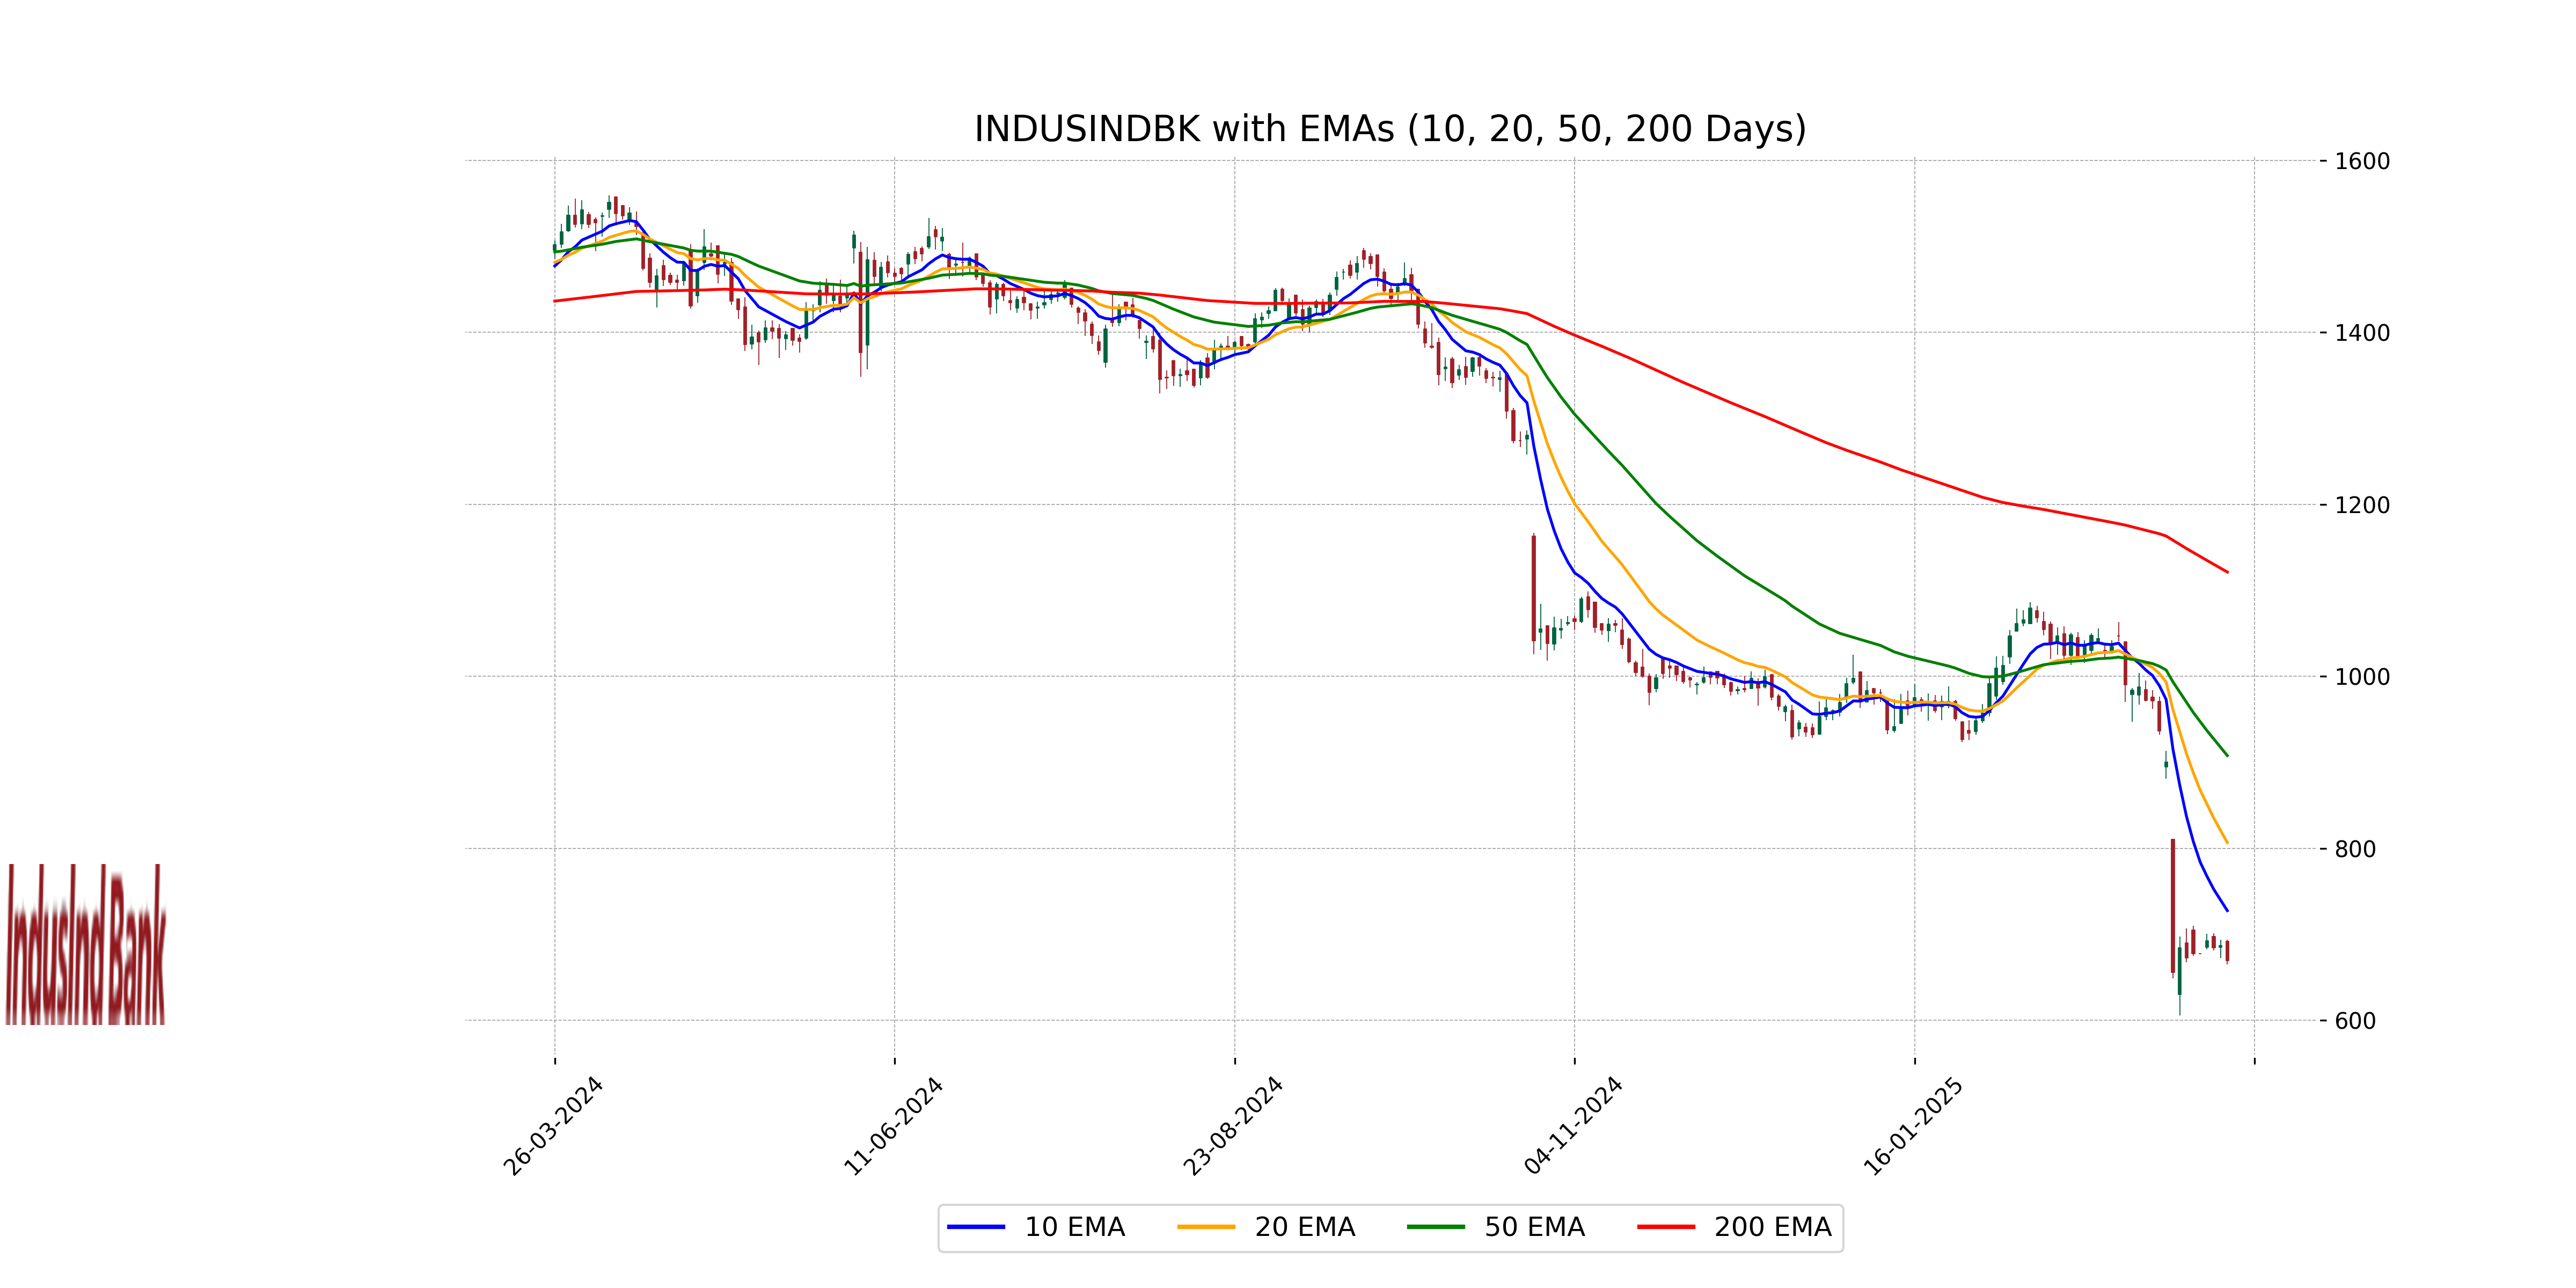
Relationship with Key Moving Averages
IndusInd Bank is currently trading below its key moving averages, specifically the 50 EMA (907.87), 200 EMA (1121.29), 10 EMA (727.56), and 20 EMA (806.64). This may indicate a bearish trend, as the stock's current price of 669.45 is significantly lower than these moving averages.
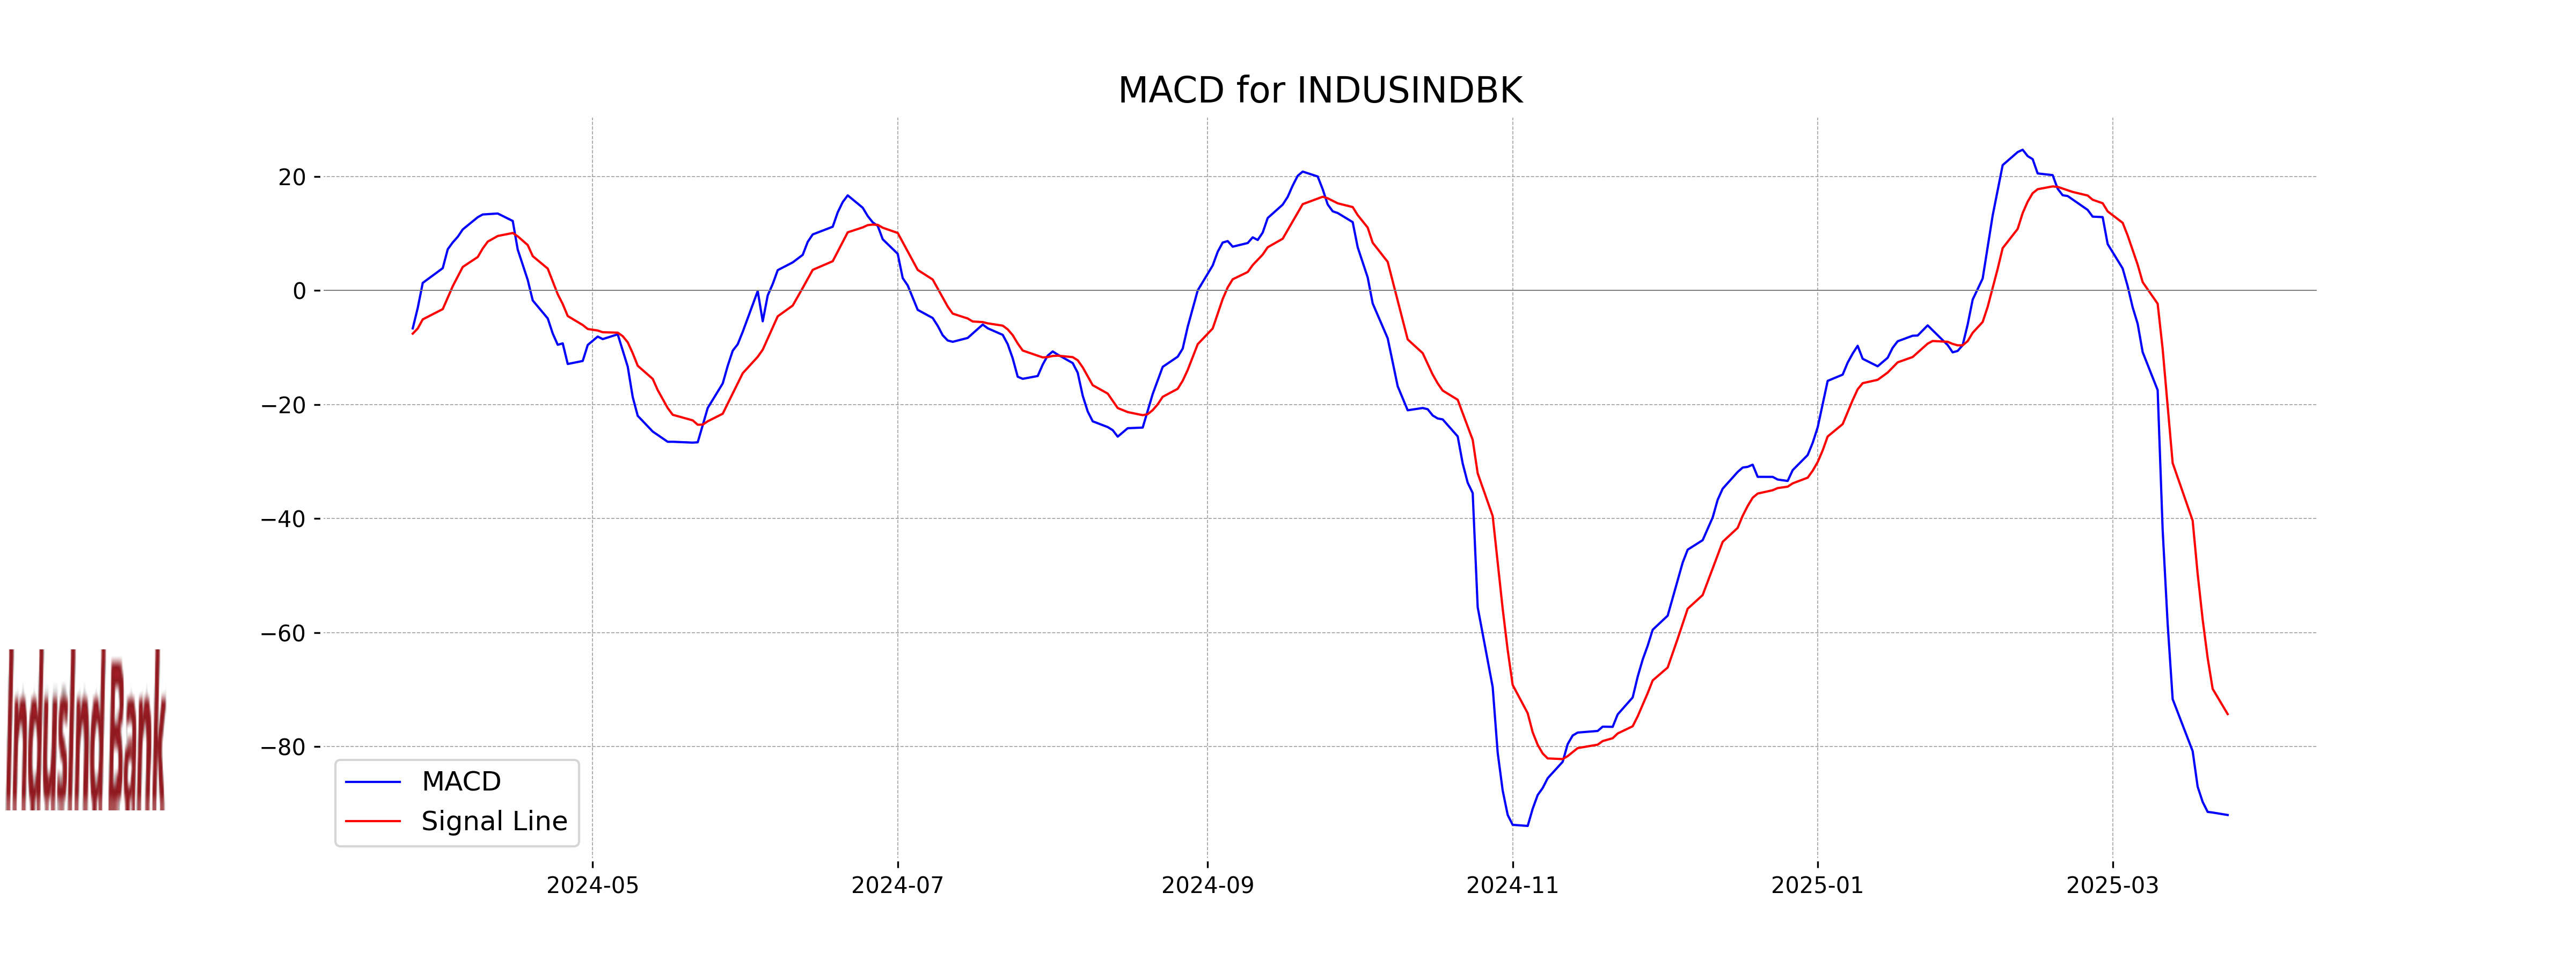
Moving Averages Trend (MACD)
The MACD for IndusInd Bank is -91.99 with a Signal Line at -74.29, indicating a bearish trend as the MACD is significantly below the Signal Line. This suggests a strong downward momentum in the stock price.
RSI Analysis
The RSI for IndusInd Bank is 21.29, which suggests that the stock is currently in the oversold territory. Generally, an RSI below 30 indicates that the stock may be undervalued or experiencing a downward momentum, potentially marking a buying opportunity for investors.
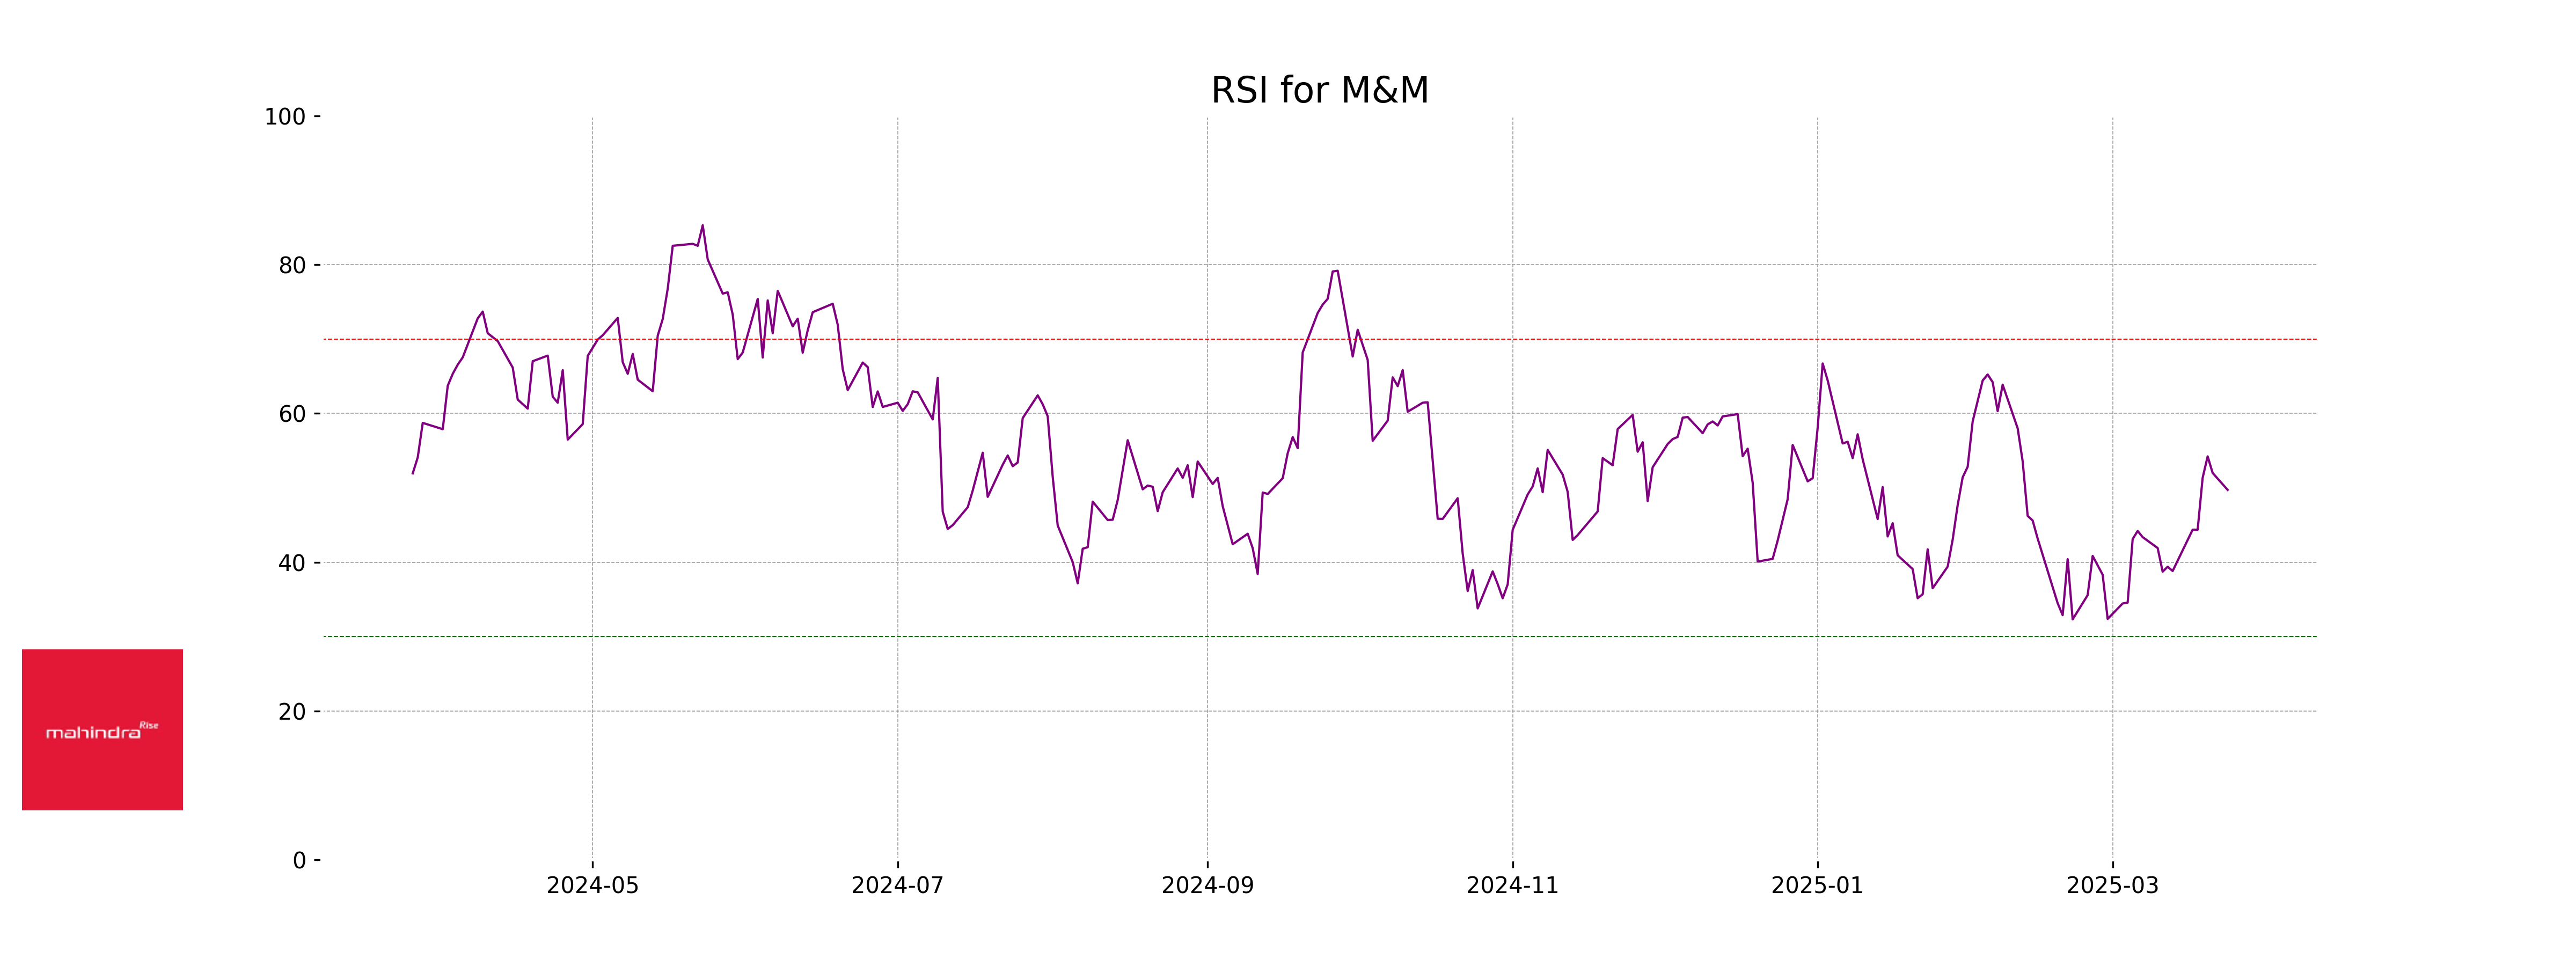
Analysis for Mahindra & Mahindra - March 24, 2025
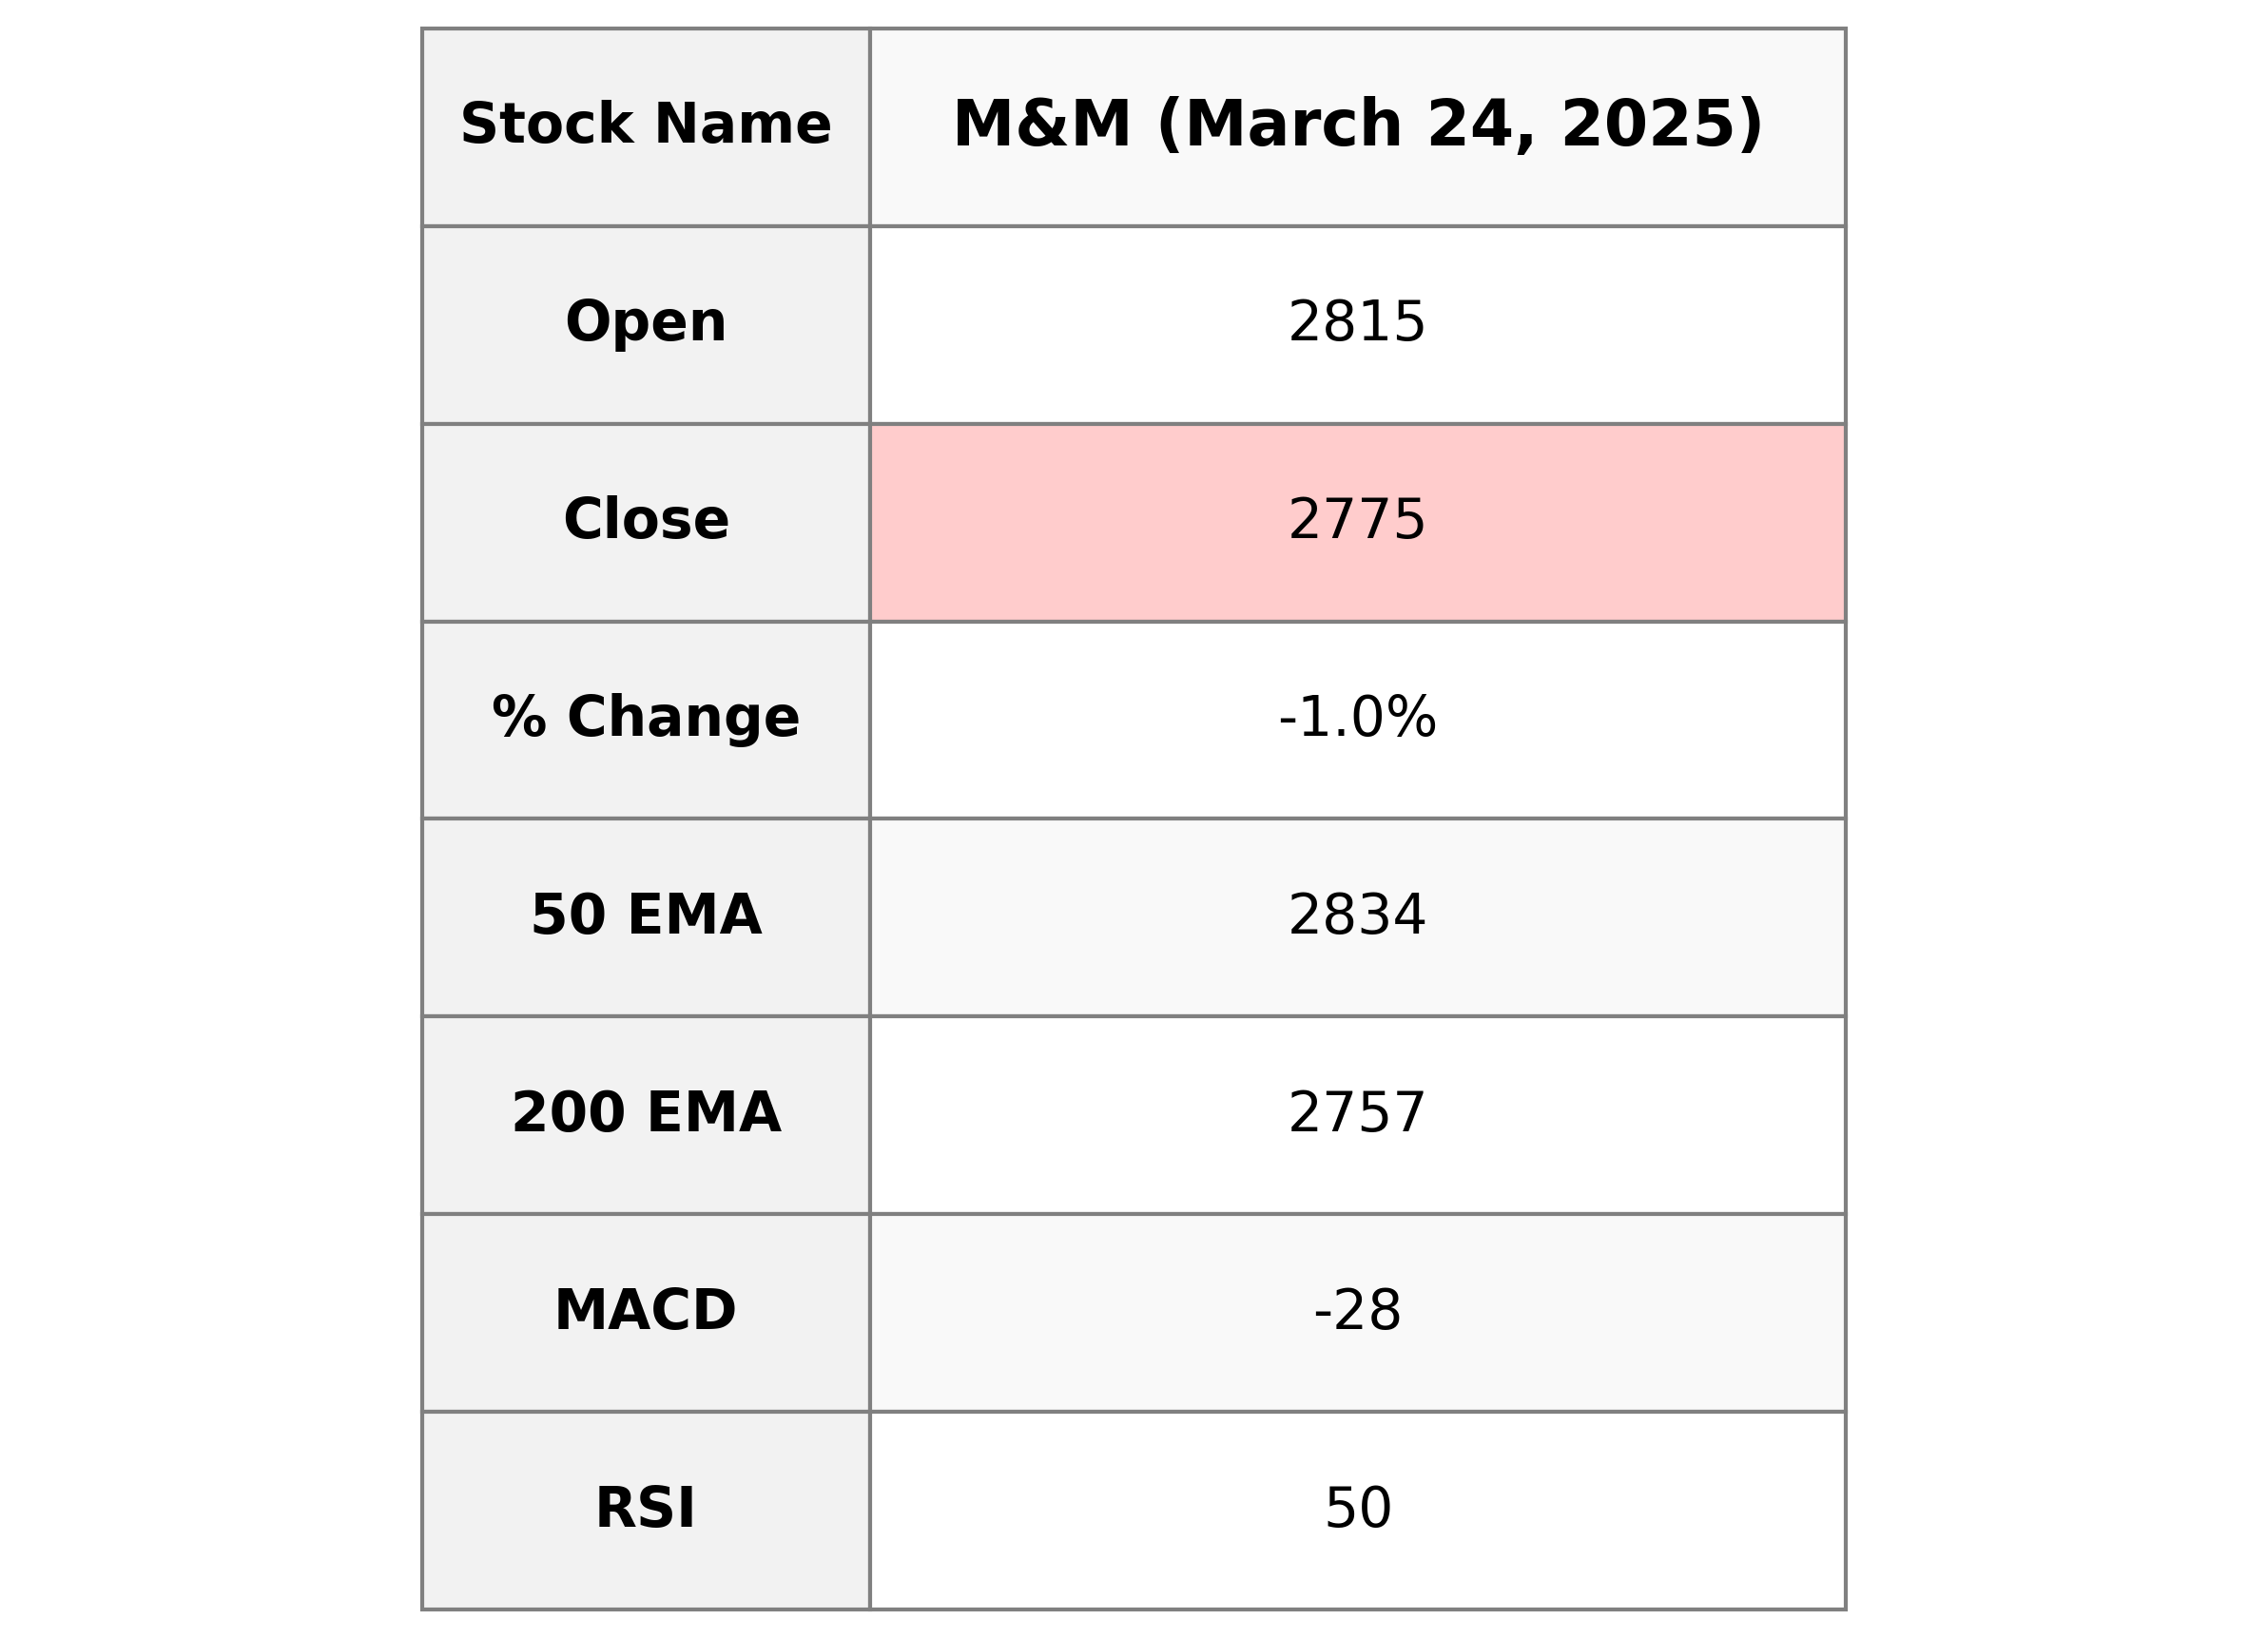
Mahindra & Mahindra's recent stock performance shows a marginal decline, with a closing price of 2774.70, down by approximately 0.97% from the previous close. The stock's 50-day EMA indicates a higher value than the 200-day EMA, suggesting a relatively stable long-term trend. Currently, the RSI at 49.73 points to a neutral market sentiment. The company's significant market cap of 3.33 trillion indicates strong market presence within the Auto Manufacturers sector in India.
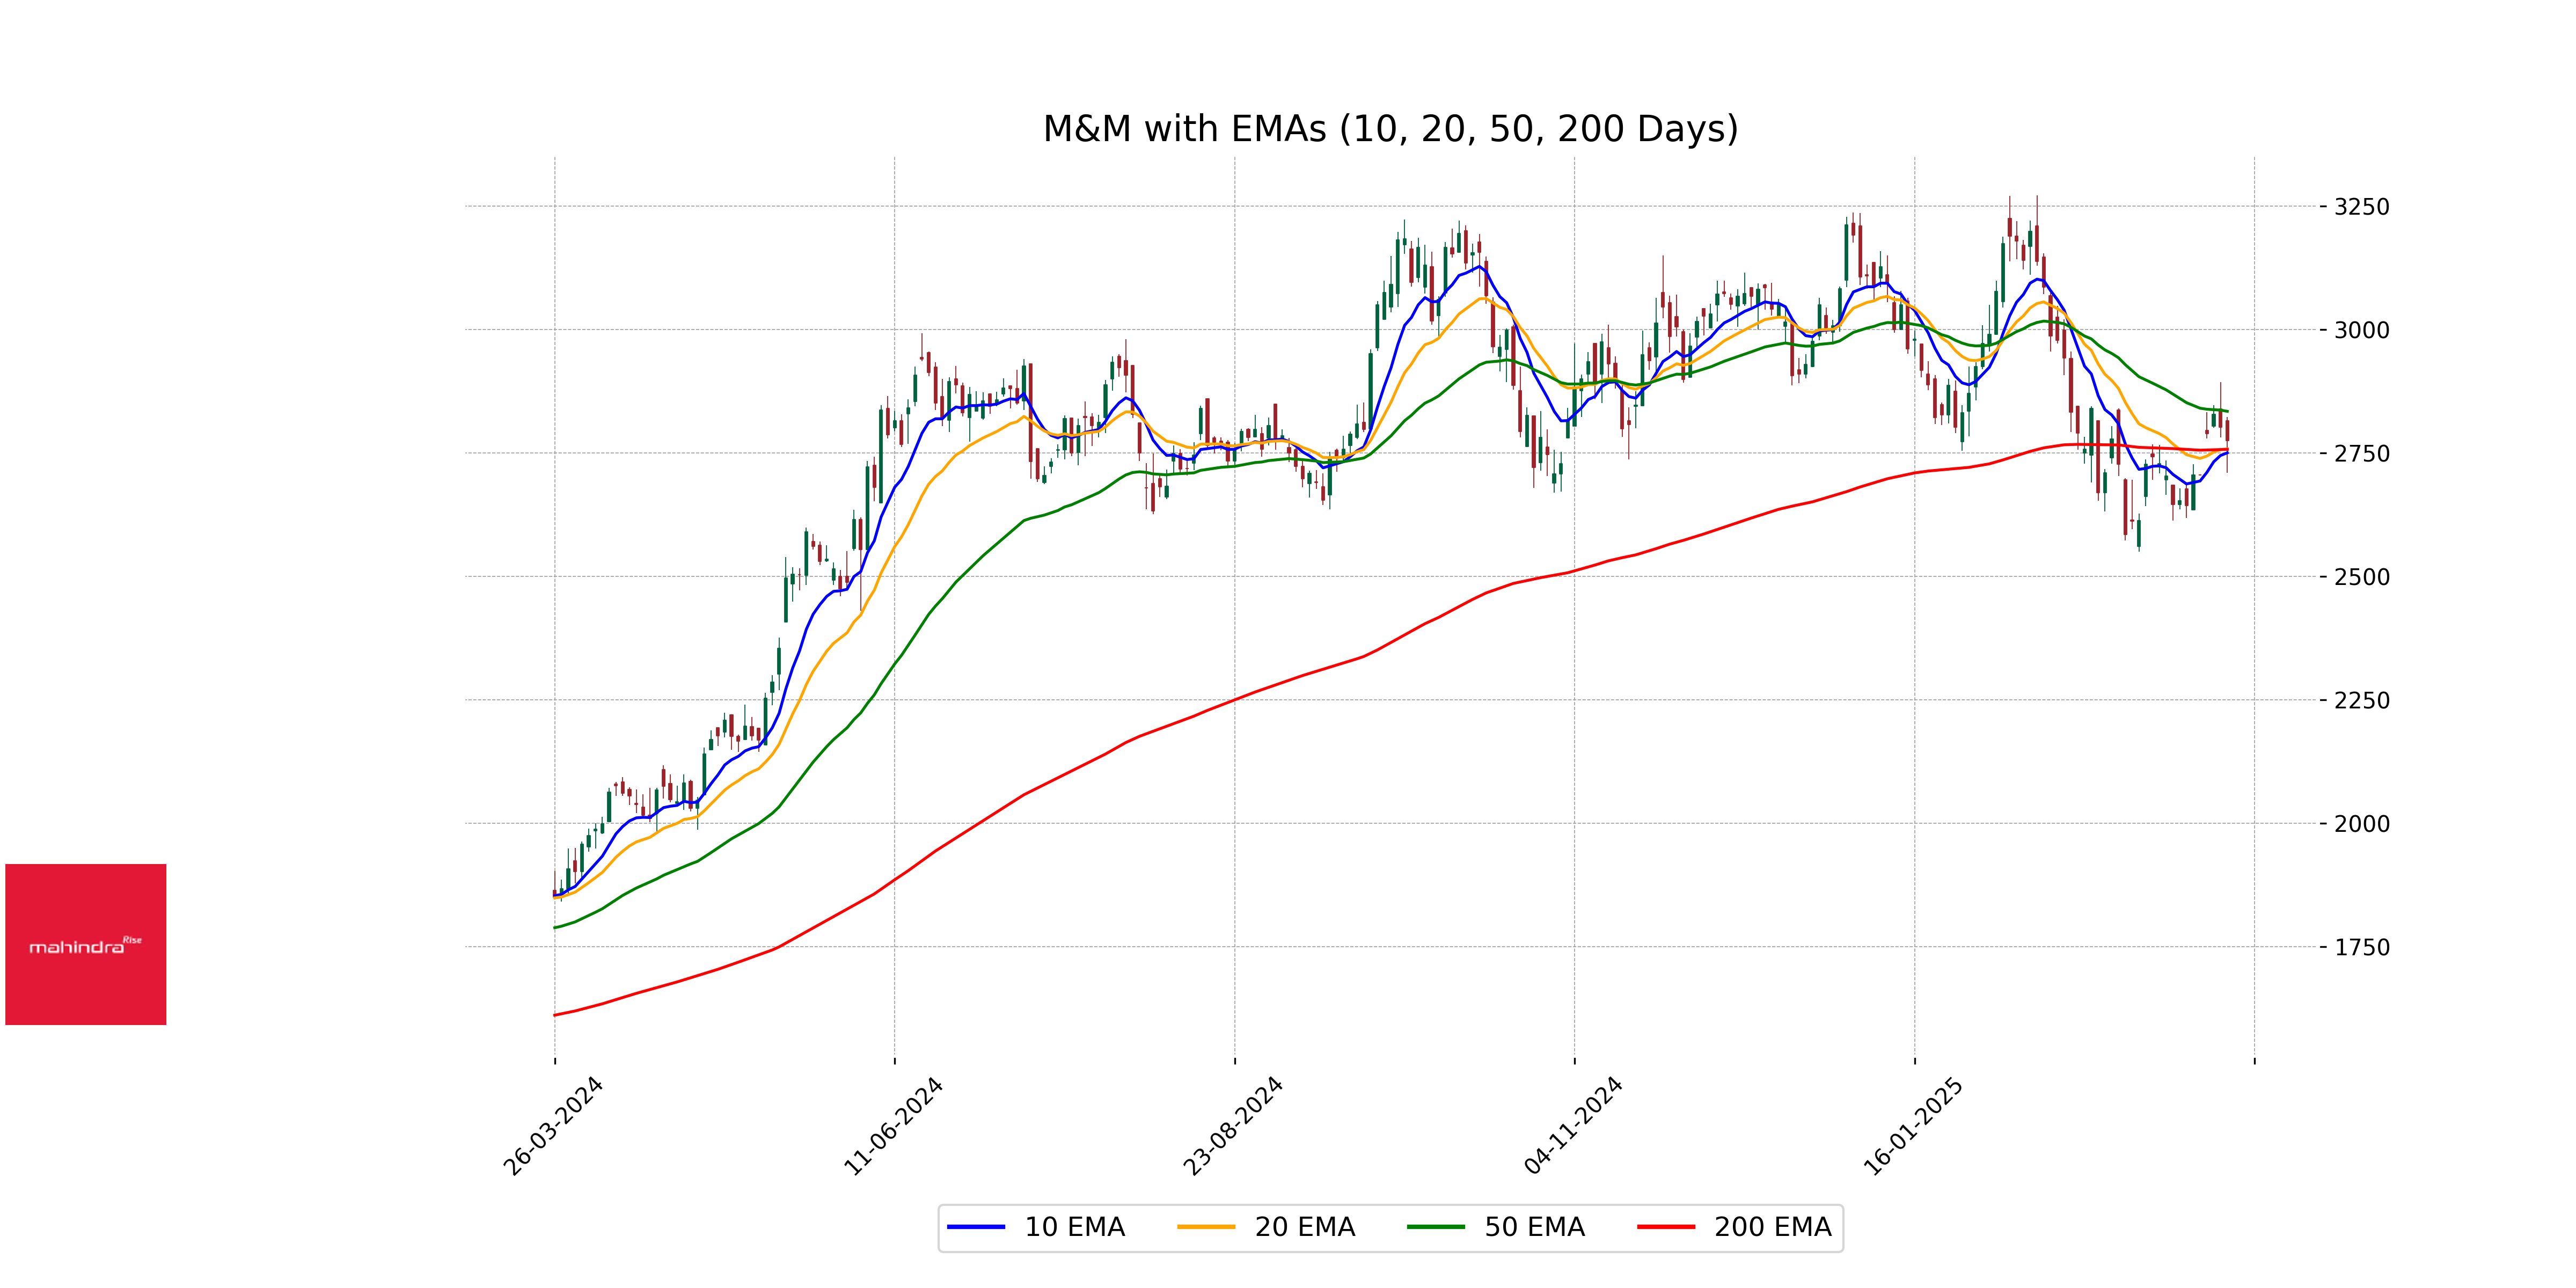
Relationship with Key Moving Averages
Mahindra & Mahindra's closing price of 2774.70 is below its 50-day EMA of 2834.06, indicating recent downward pressure relative to this moving average. However, it is slightly above the 200-day EMA of 2757.06, suggesting some longer-term support. The 10-day EMA (2750.07) and 20-day EMA (2758.10) show that the stock price is currently aligning closely with recent trends.
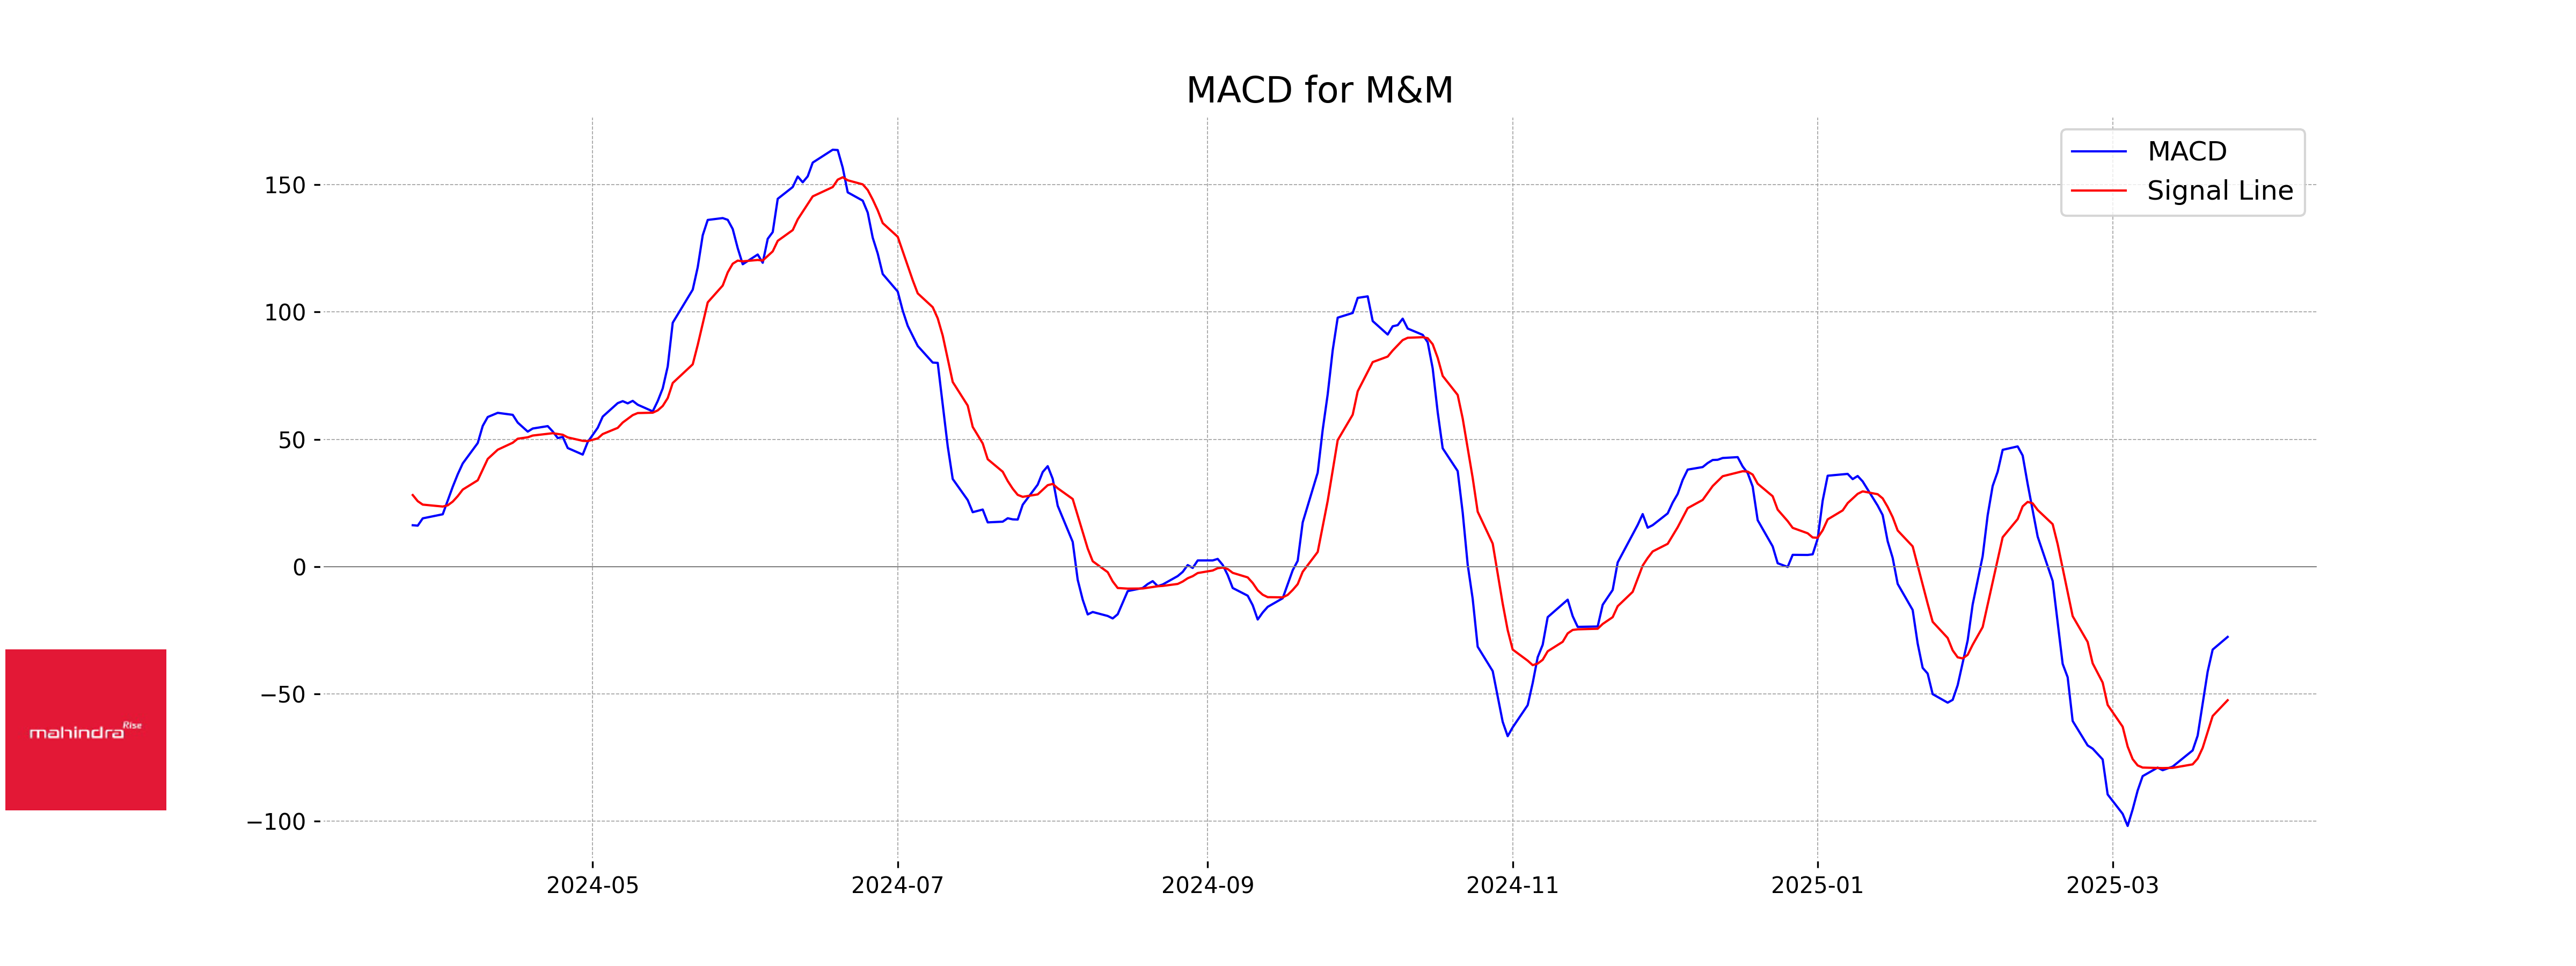
Moving Averages Trend (MACD)
Mahindra & Mahindra: The MACD for Mahindra & Mahindra is currently at -27.59, while the MACD signal line is at -52.46. This indicates that the MACD line is above the signal line, suggesting a potential bullish crossover which may imply improving price momentum.
RSI Analysis
Mahindra & Mahindra RSI Analysis: The Relative Strength Index (RSI) for Mahindra & Mahindra is 49.73, which indicates a neutral trend as it is close to the midpoint of 50. This suggests the stock is neither overbought nor oversold at the moment.
Analysis for Titan Company - March 24, 2025

Titan Company experienced a drop in stock price, with a close of 3079.10, reflecting a -2.64% change. The RSI of 43.91 suggests a stock that is moving towards being oversold. With a PE Ratio of 84.66, it indicates a high valuation, and the MACD indicates a bearish trend, while the volume of 1,480,063 shows active trading.
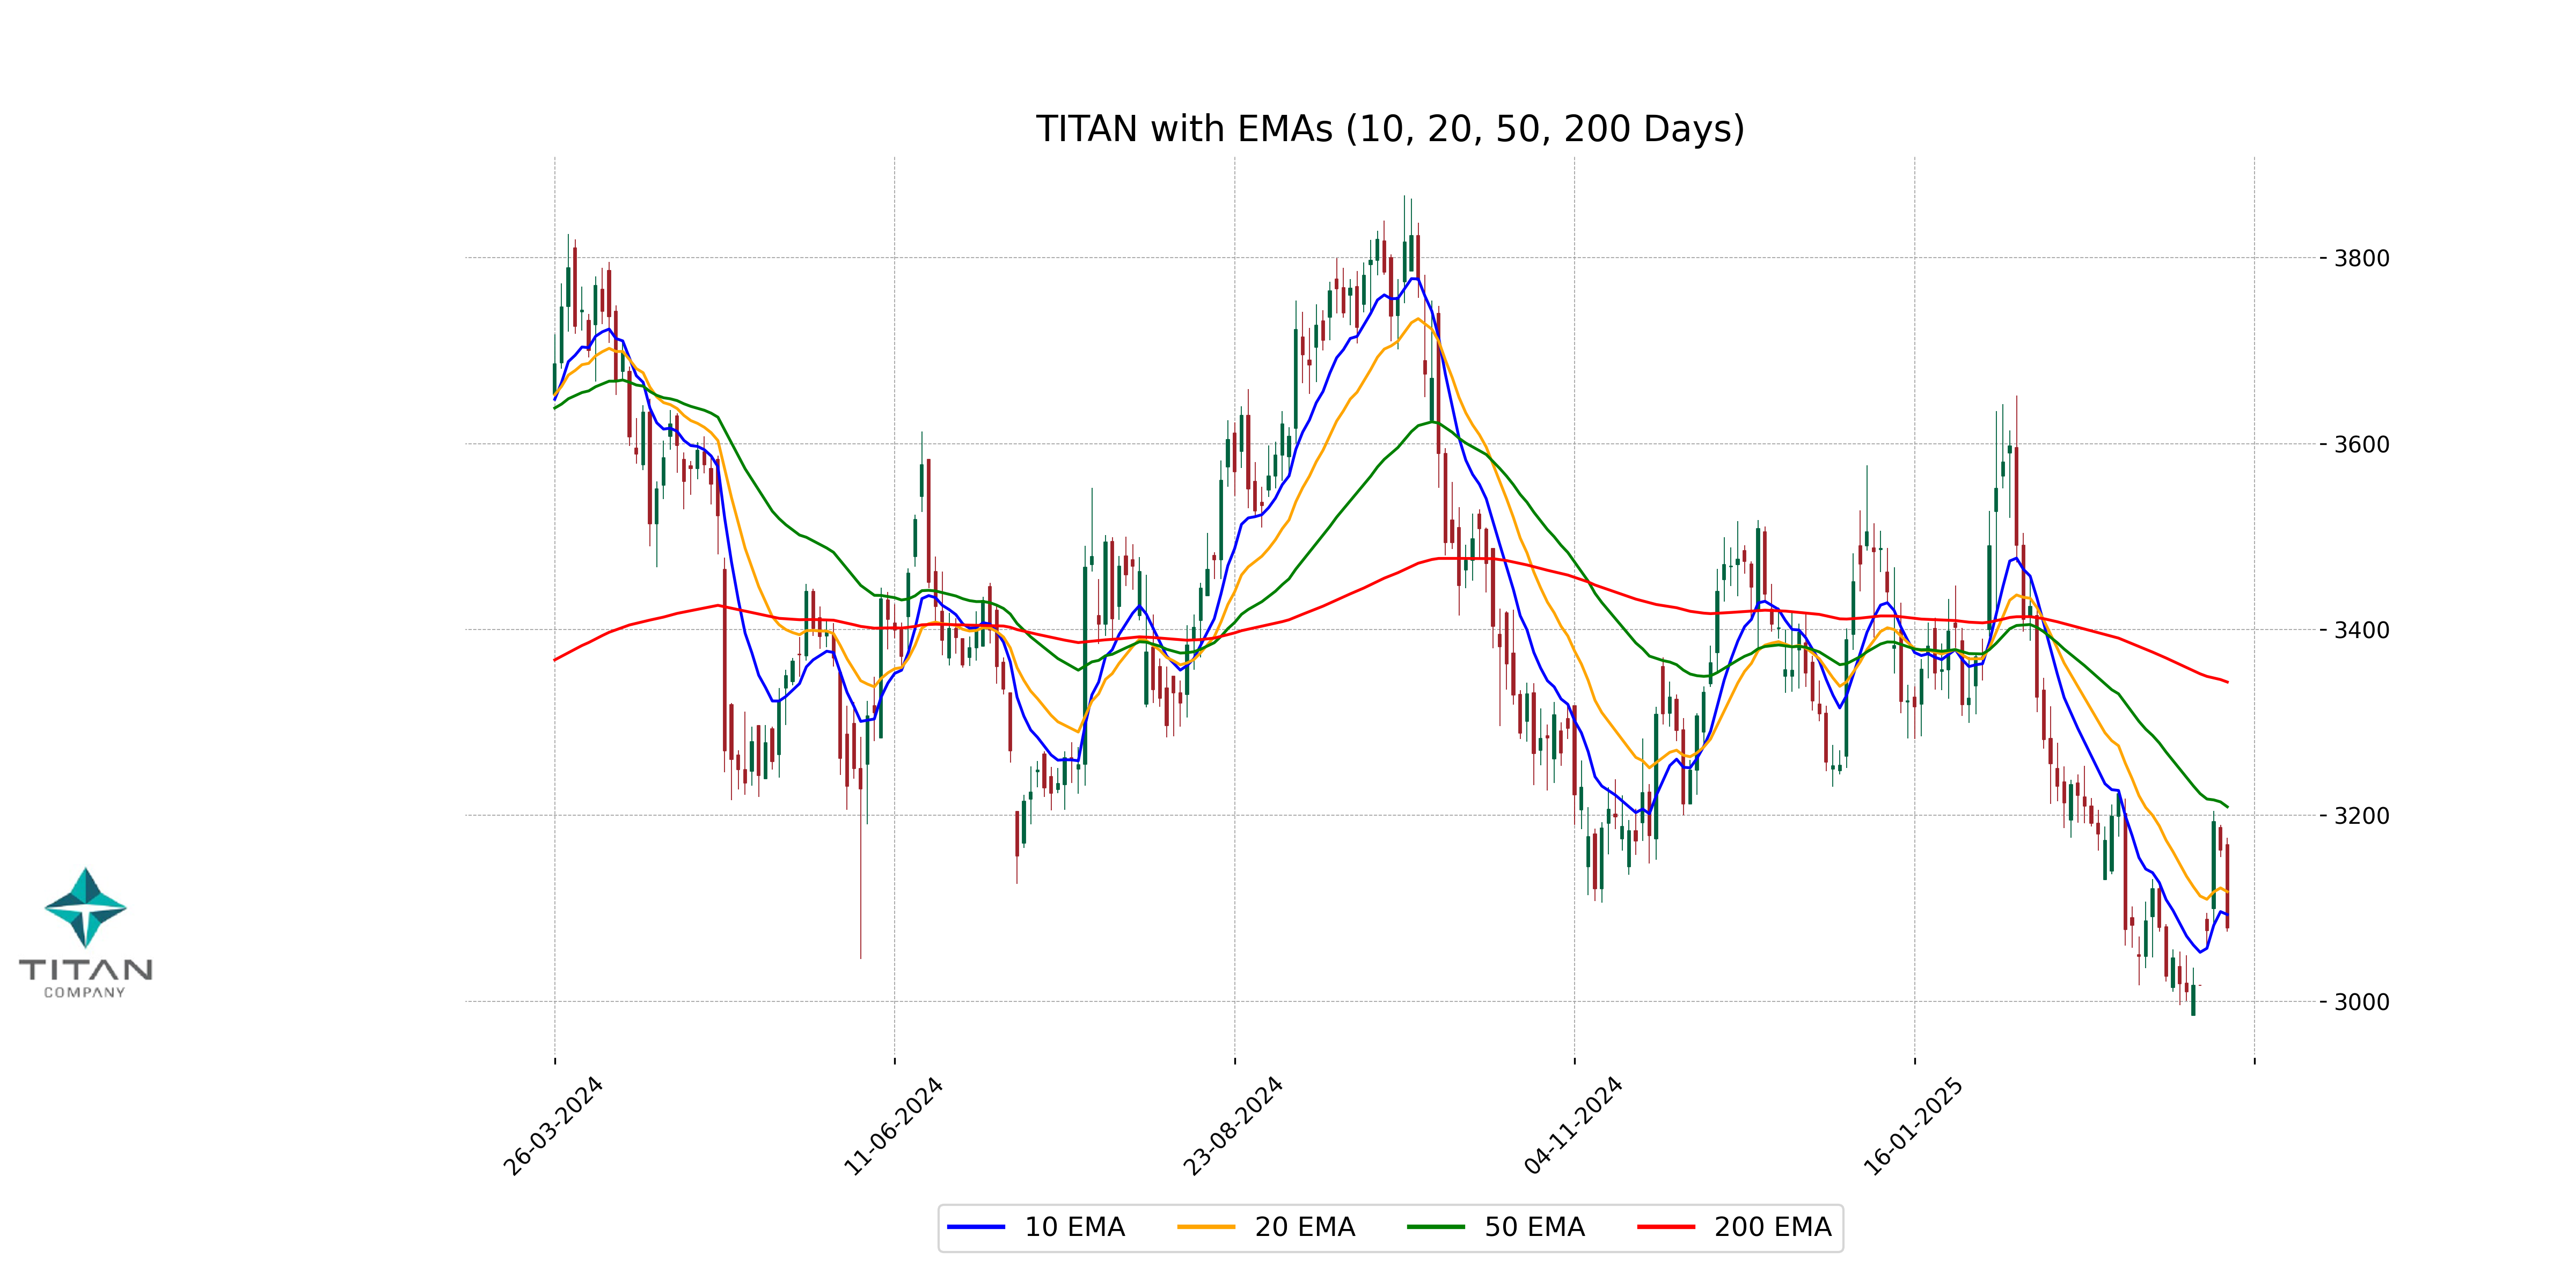
Relationship with Key Moving Averages
Titan Company is currently trading below its key moving averages, with the closing price of 3079.10 being lower than the 50 EMA at 3209.26 and the 200 EMA at 3343.53. This suggests a bearish trend as the stock is also below its 10 EMA and 20 EMA, indicating potential downward momentum in the short to medium term.
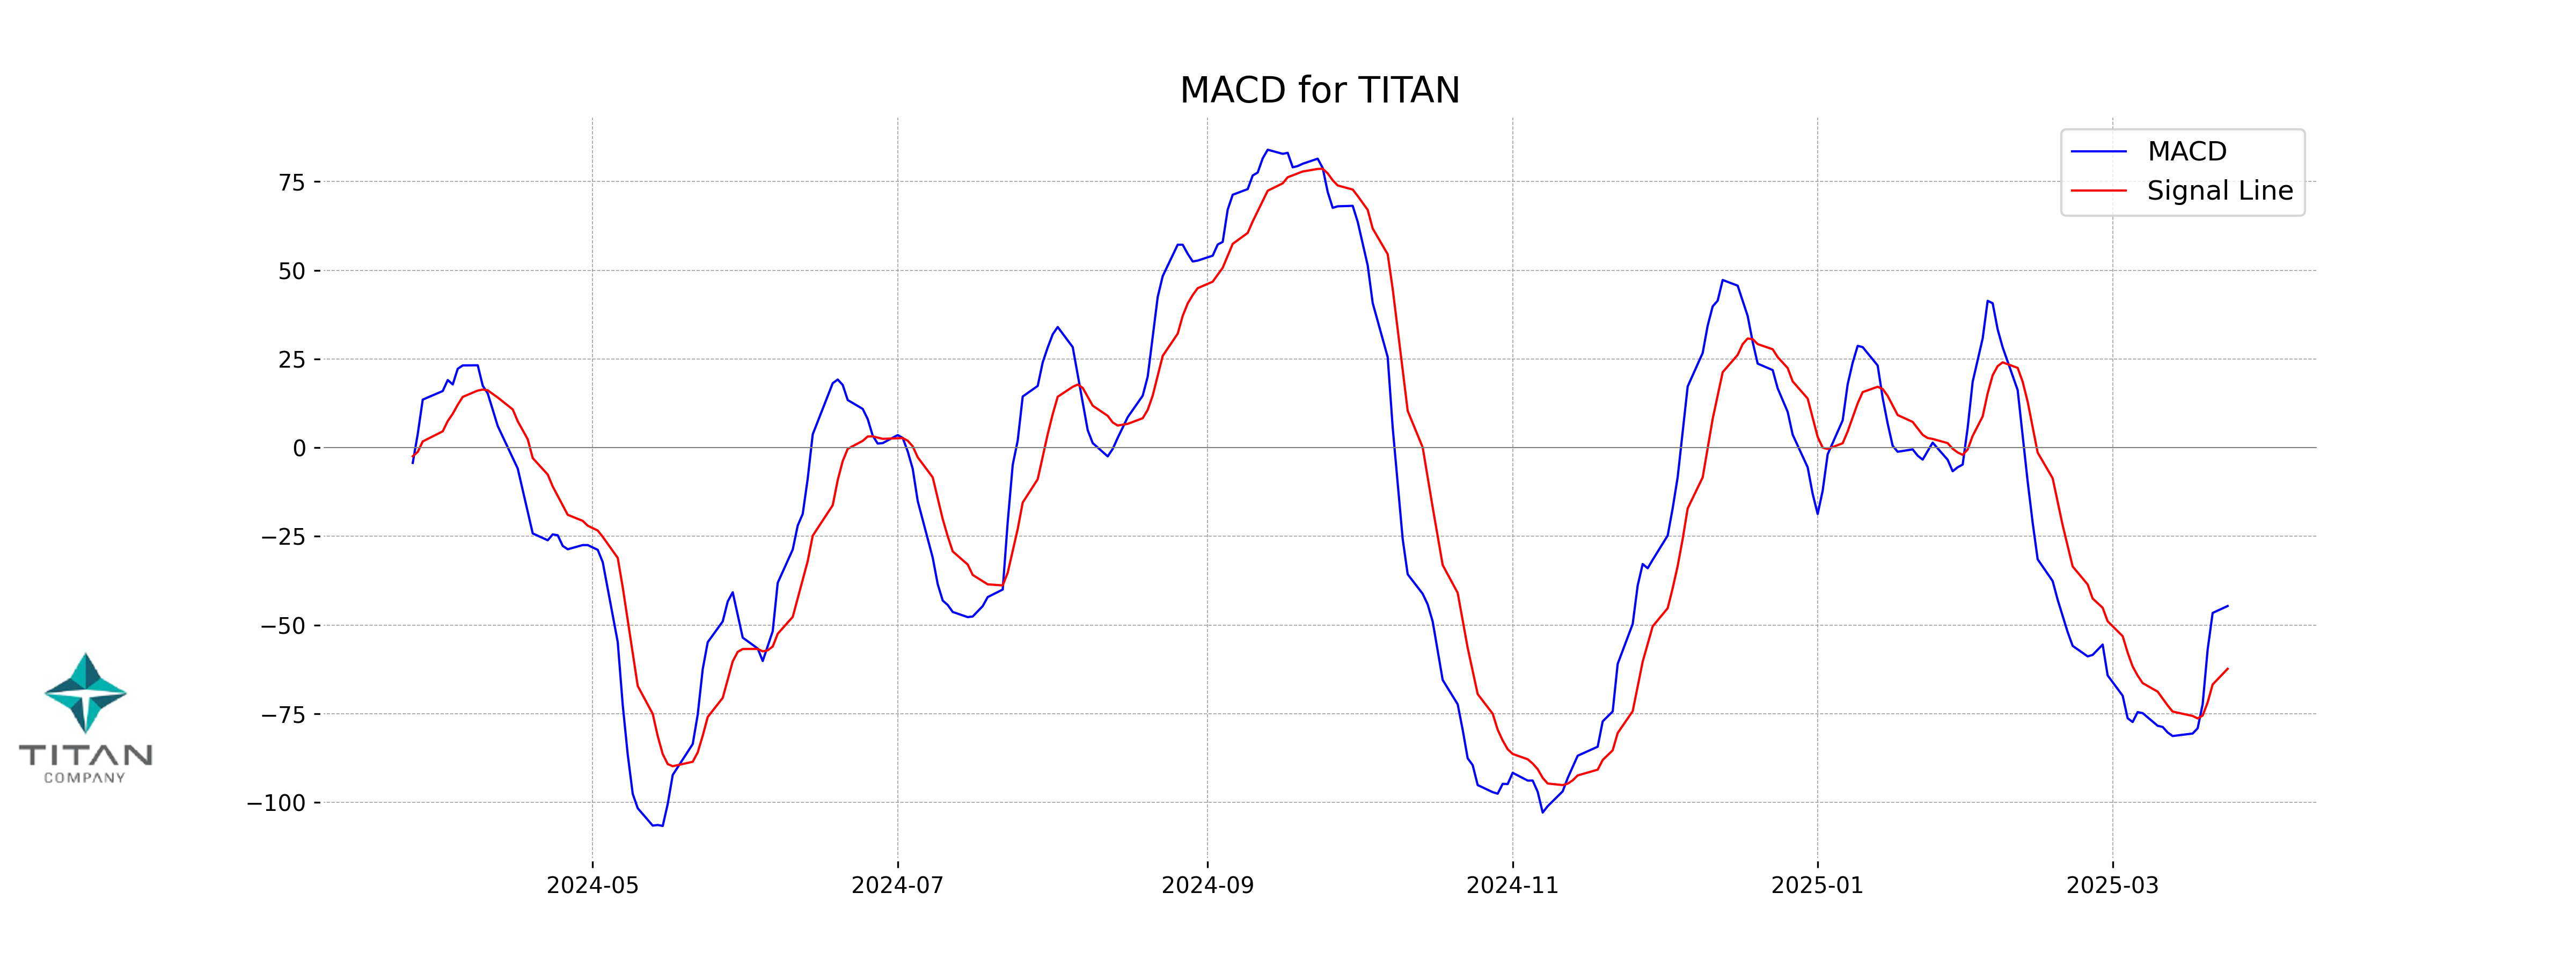
Moving Averages Trend (MACD)
MACD Analysis for Titan Company The MACD value of -44.66, compared to the MACD Signal of -62.36, suggests a potential bullish crossover in the near future. This indicates that the bearish trend may be weakening, as the MACD is moving closer to the signal line. Traders may look for confirmation of trend reversal with additional indicators.
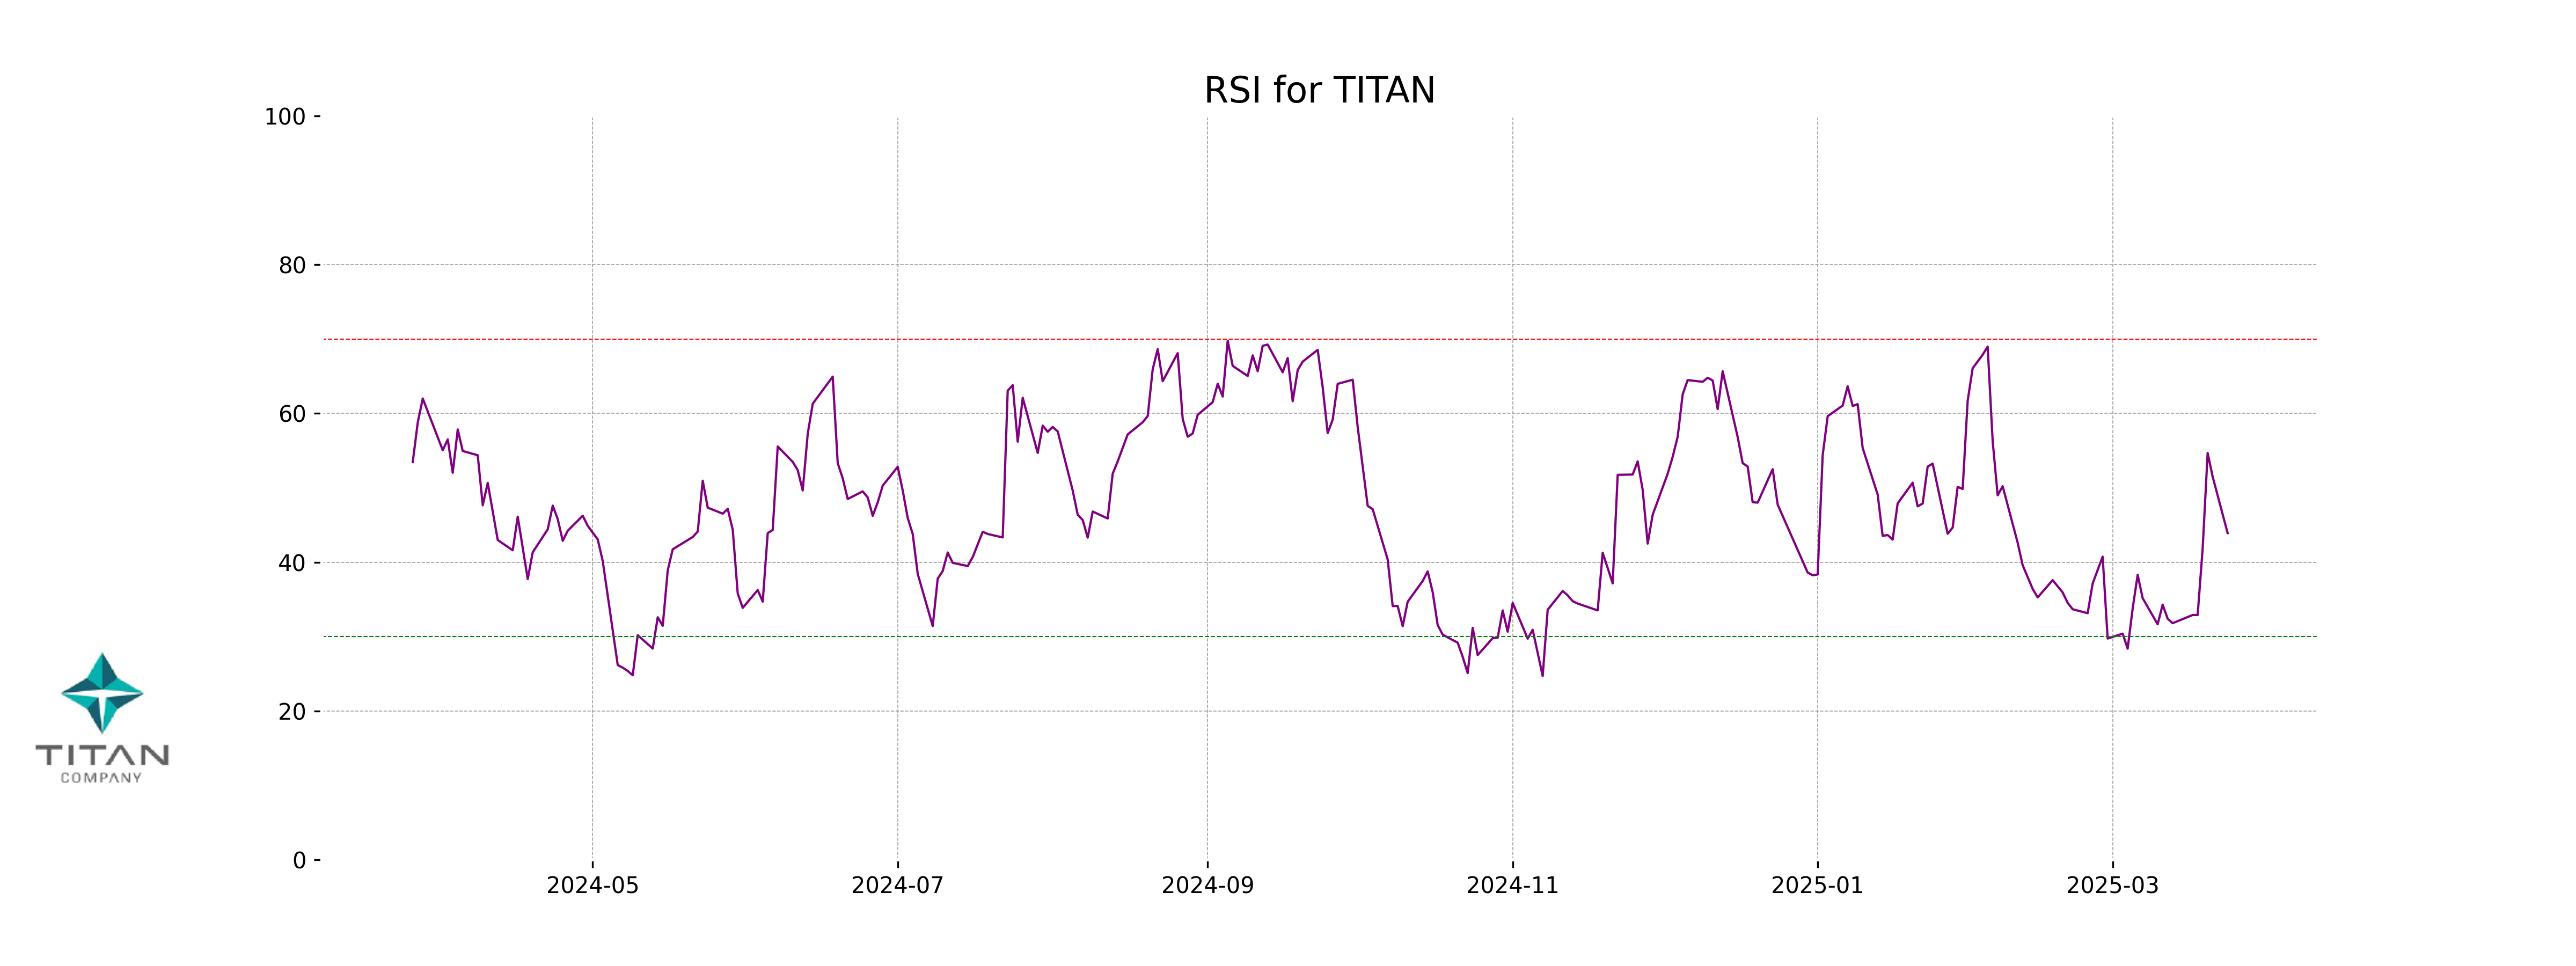
RSI Analysis
Based on the current RSI of 43.91, Titan Company is in the neutral zone, indicating that it is not significantly overbought or oversold. Generally, an RSI below 30 suggests oversold conditions, while above 70 indicates overbought conditions. Presently, the RSI suggests a balanced market sentiment.
Analysis for Trent - March 24, 2025
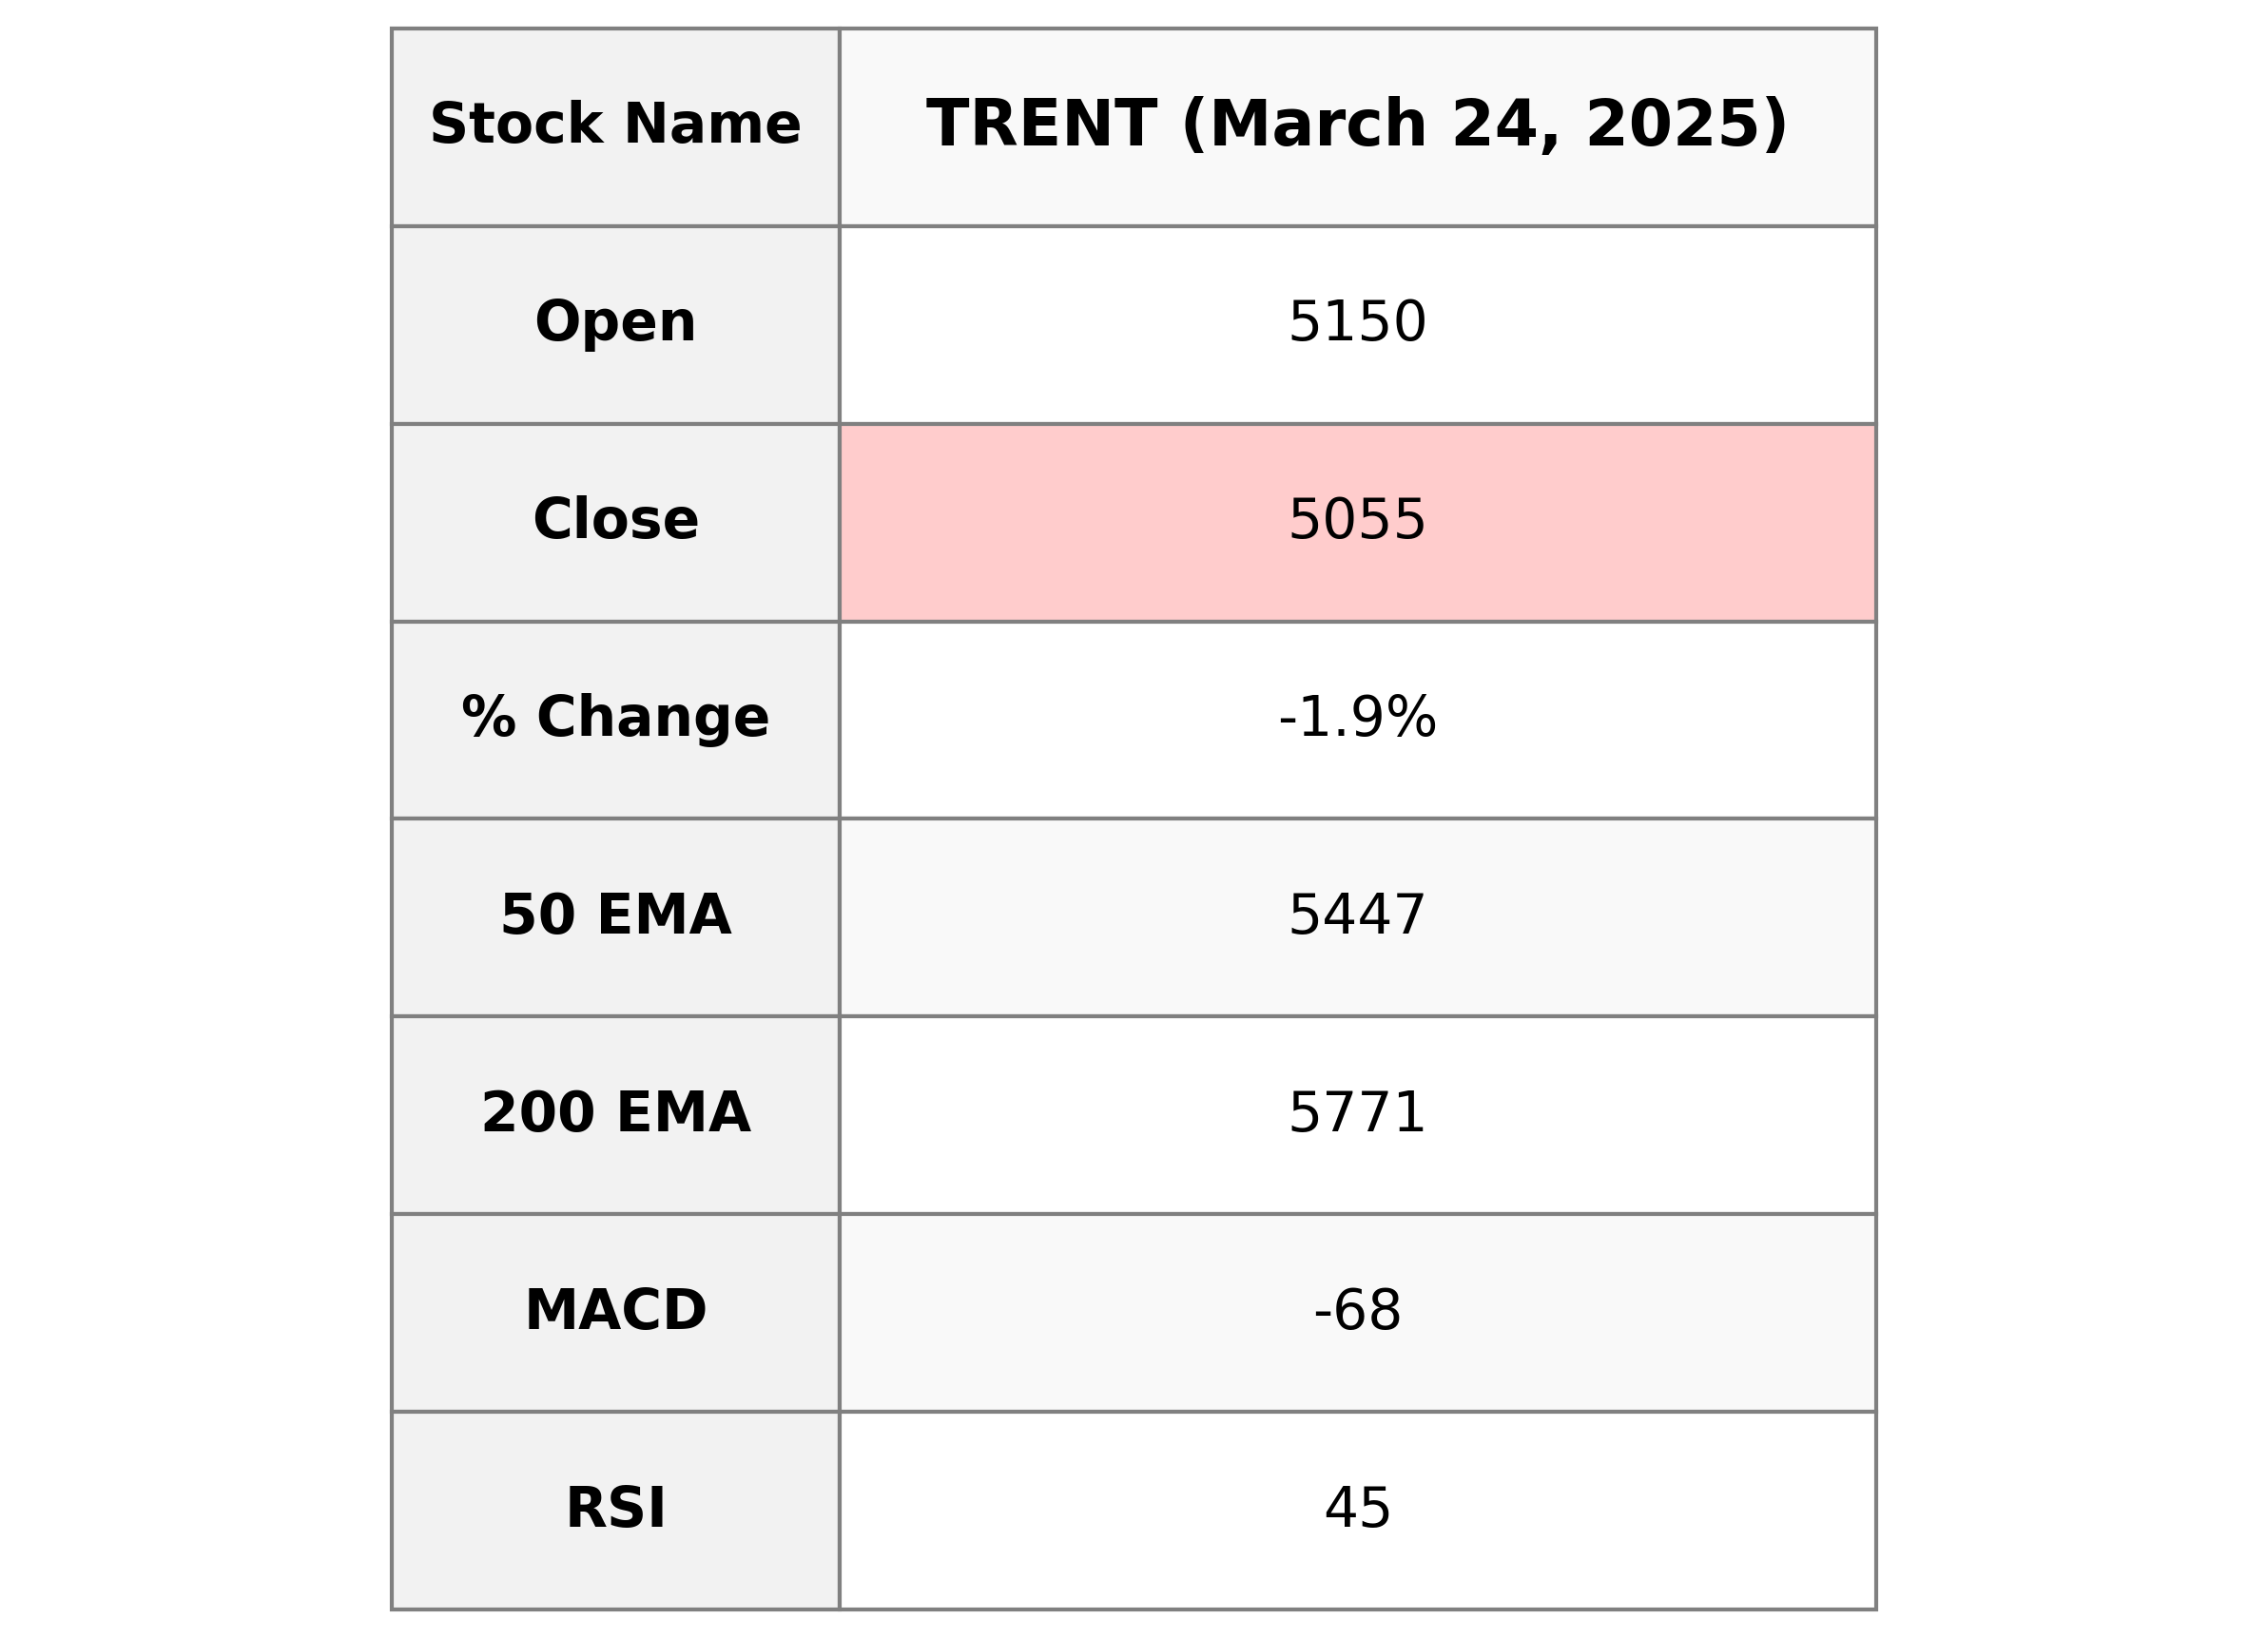
Trent experienced a decline, with the stock closing at ₹5054.70, down from the previous close of ₹5150.05, marking a percentage change of -1.85%. The volume traded was 907,839, and the Relative Strength Index (RSI) stands at 44.52, indicating potential weakness. The company is a leader in the consumer cyclical sector, specializing in apparel retail in India.
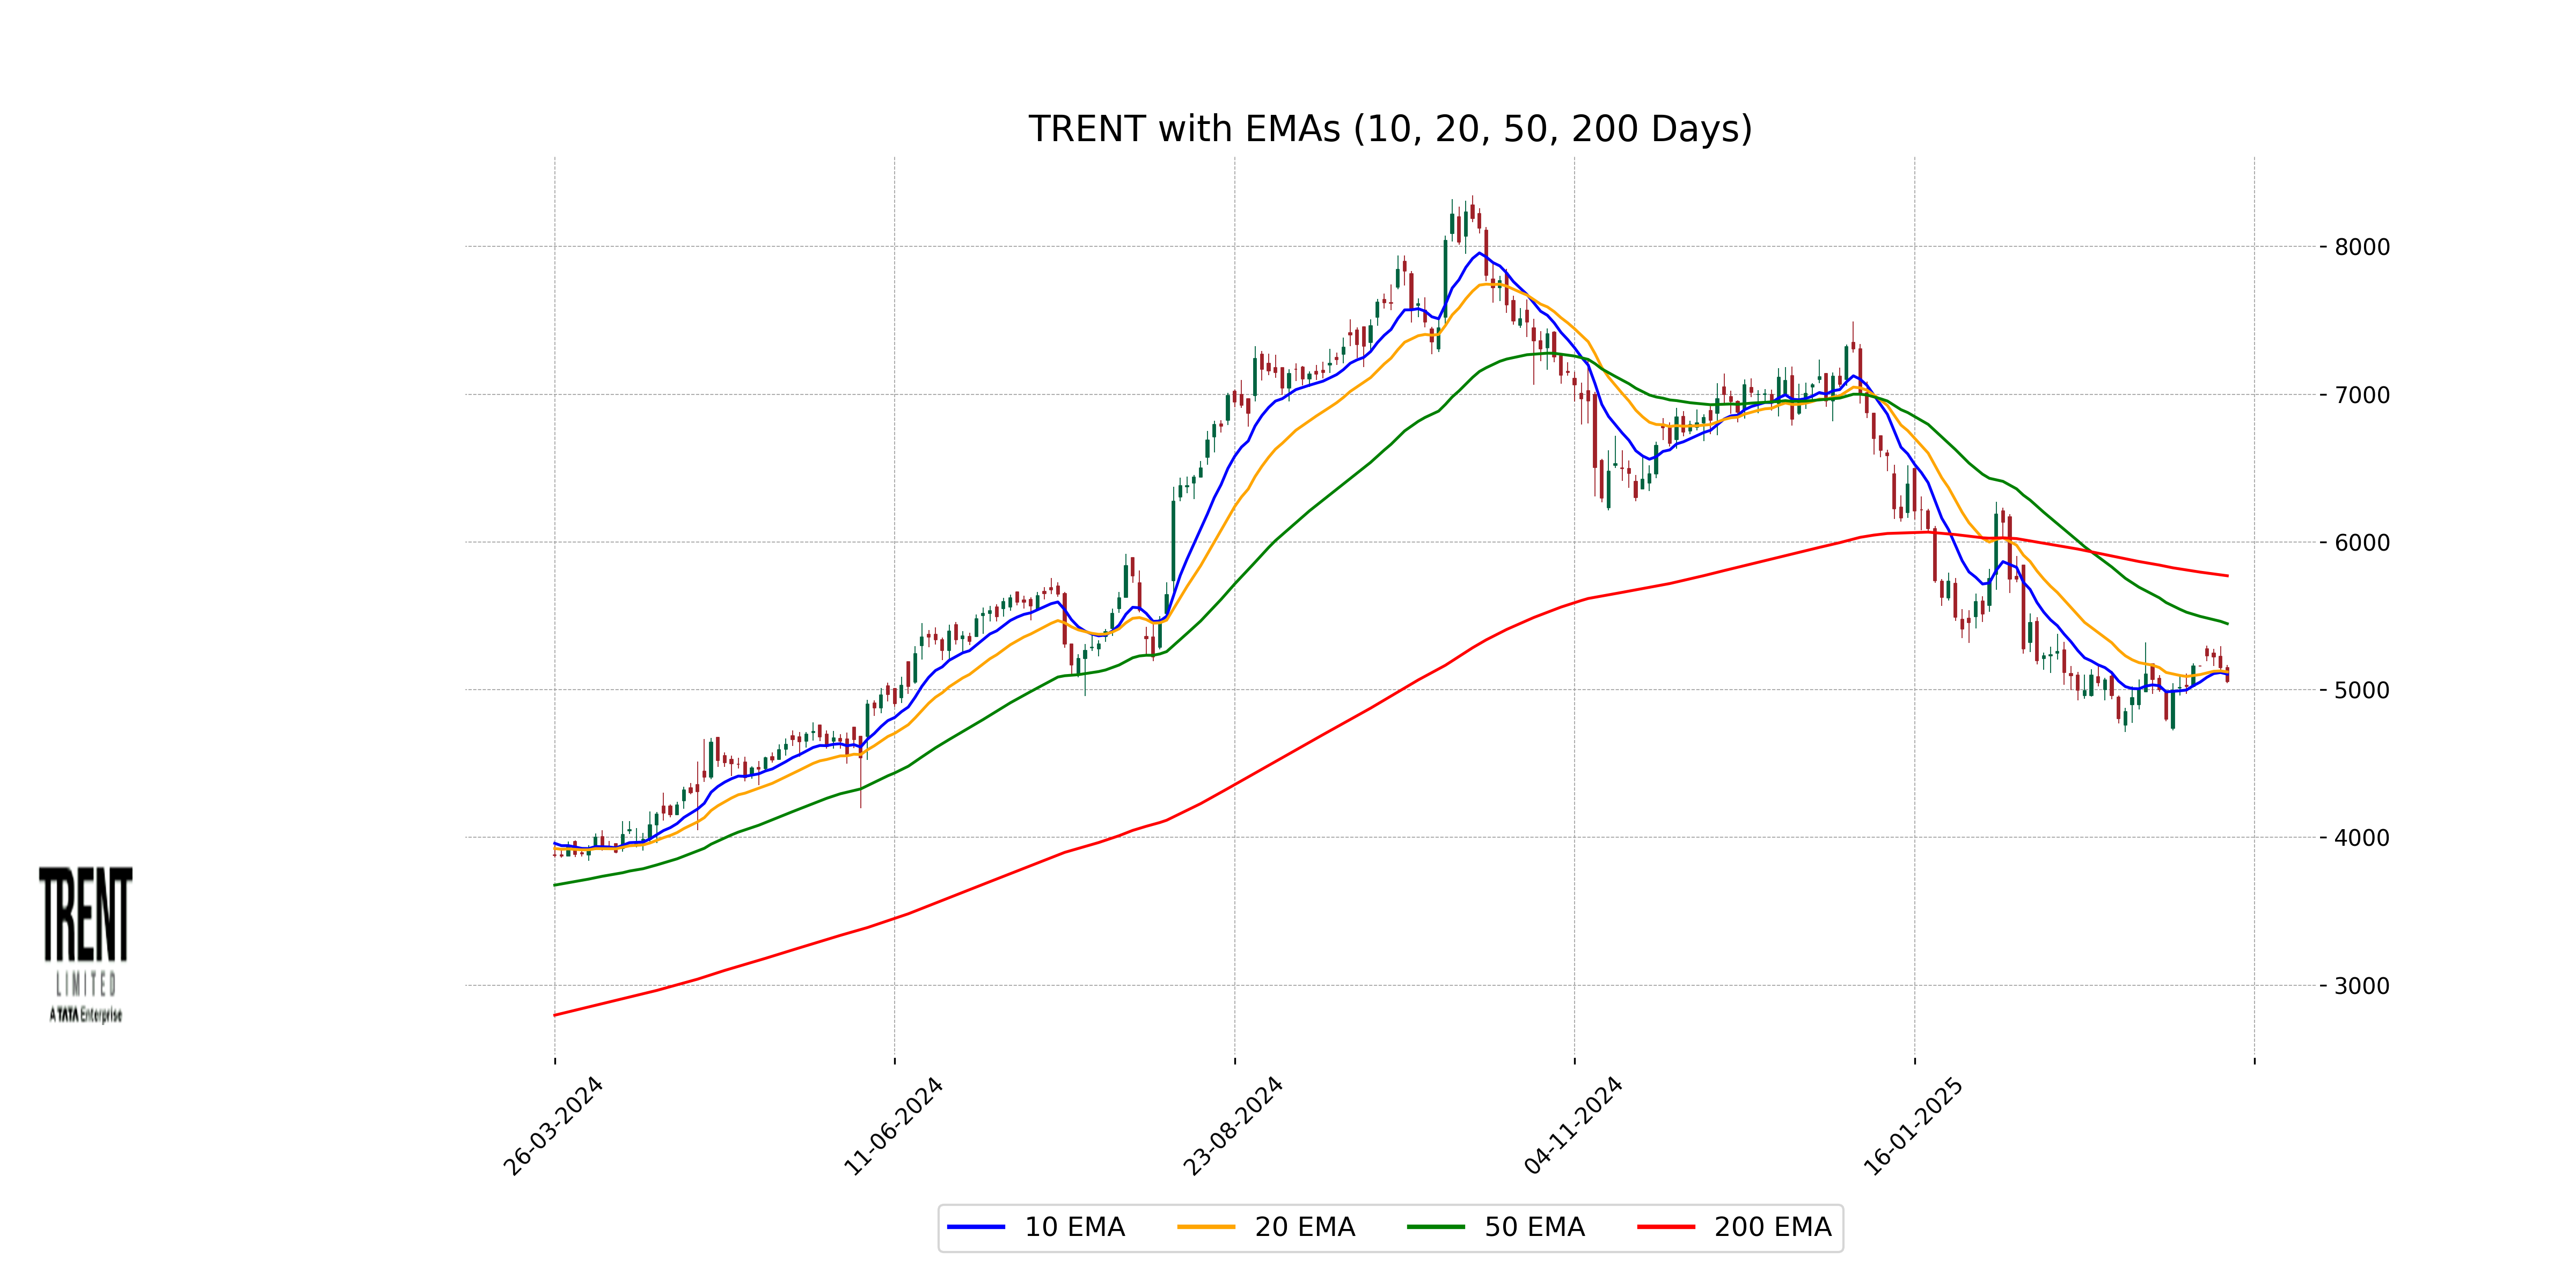
Relationship with Key Moving Averages
Trent's closing price of 5054.70 is below its 10-EMA of 5105.19, 20-EMA of 5120.16, 50-EMA of 5446.71, and 200-EMA of 5771.09, indicating a possible short-term downtrend. This suggests weakness as the price is trading below key moving averages.
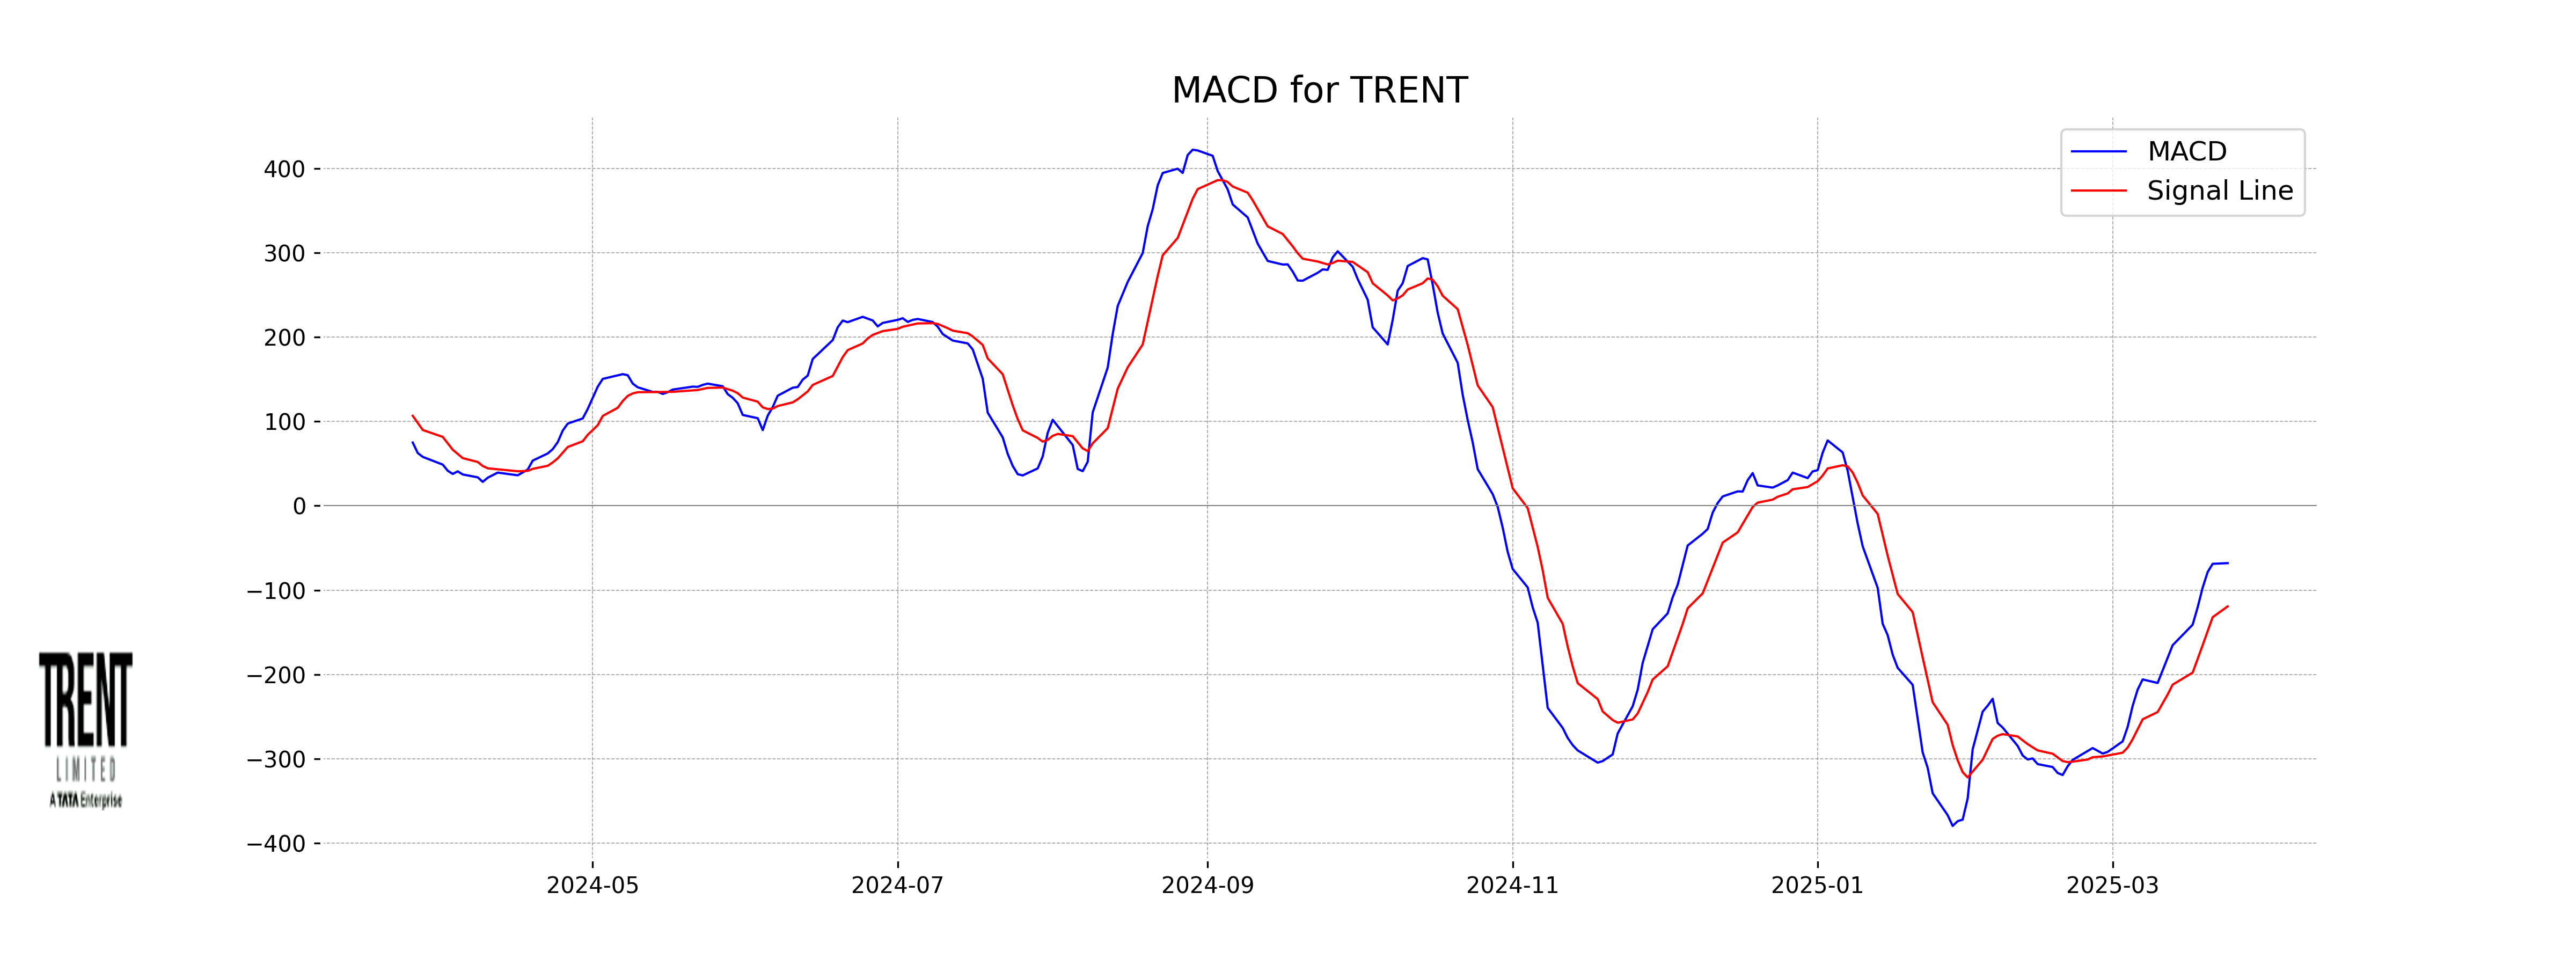
Moving Averages Trend (MACD)
Based on the data for Trent, the MACD is at -67.98, which is less than the MACD Signal of -119.27, indicating a potential bullish signal as the MACD line is moving towards the signal line. However, since both values are negative, it suggests the stock might still be in a bearish territory and investors should be cautious.
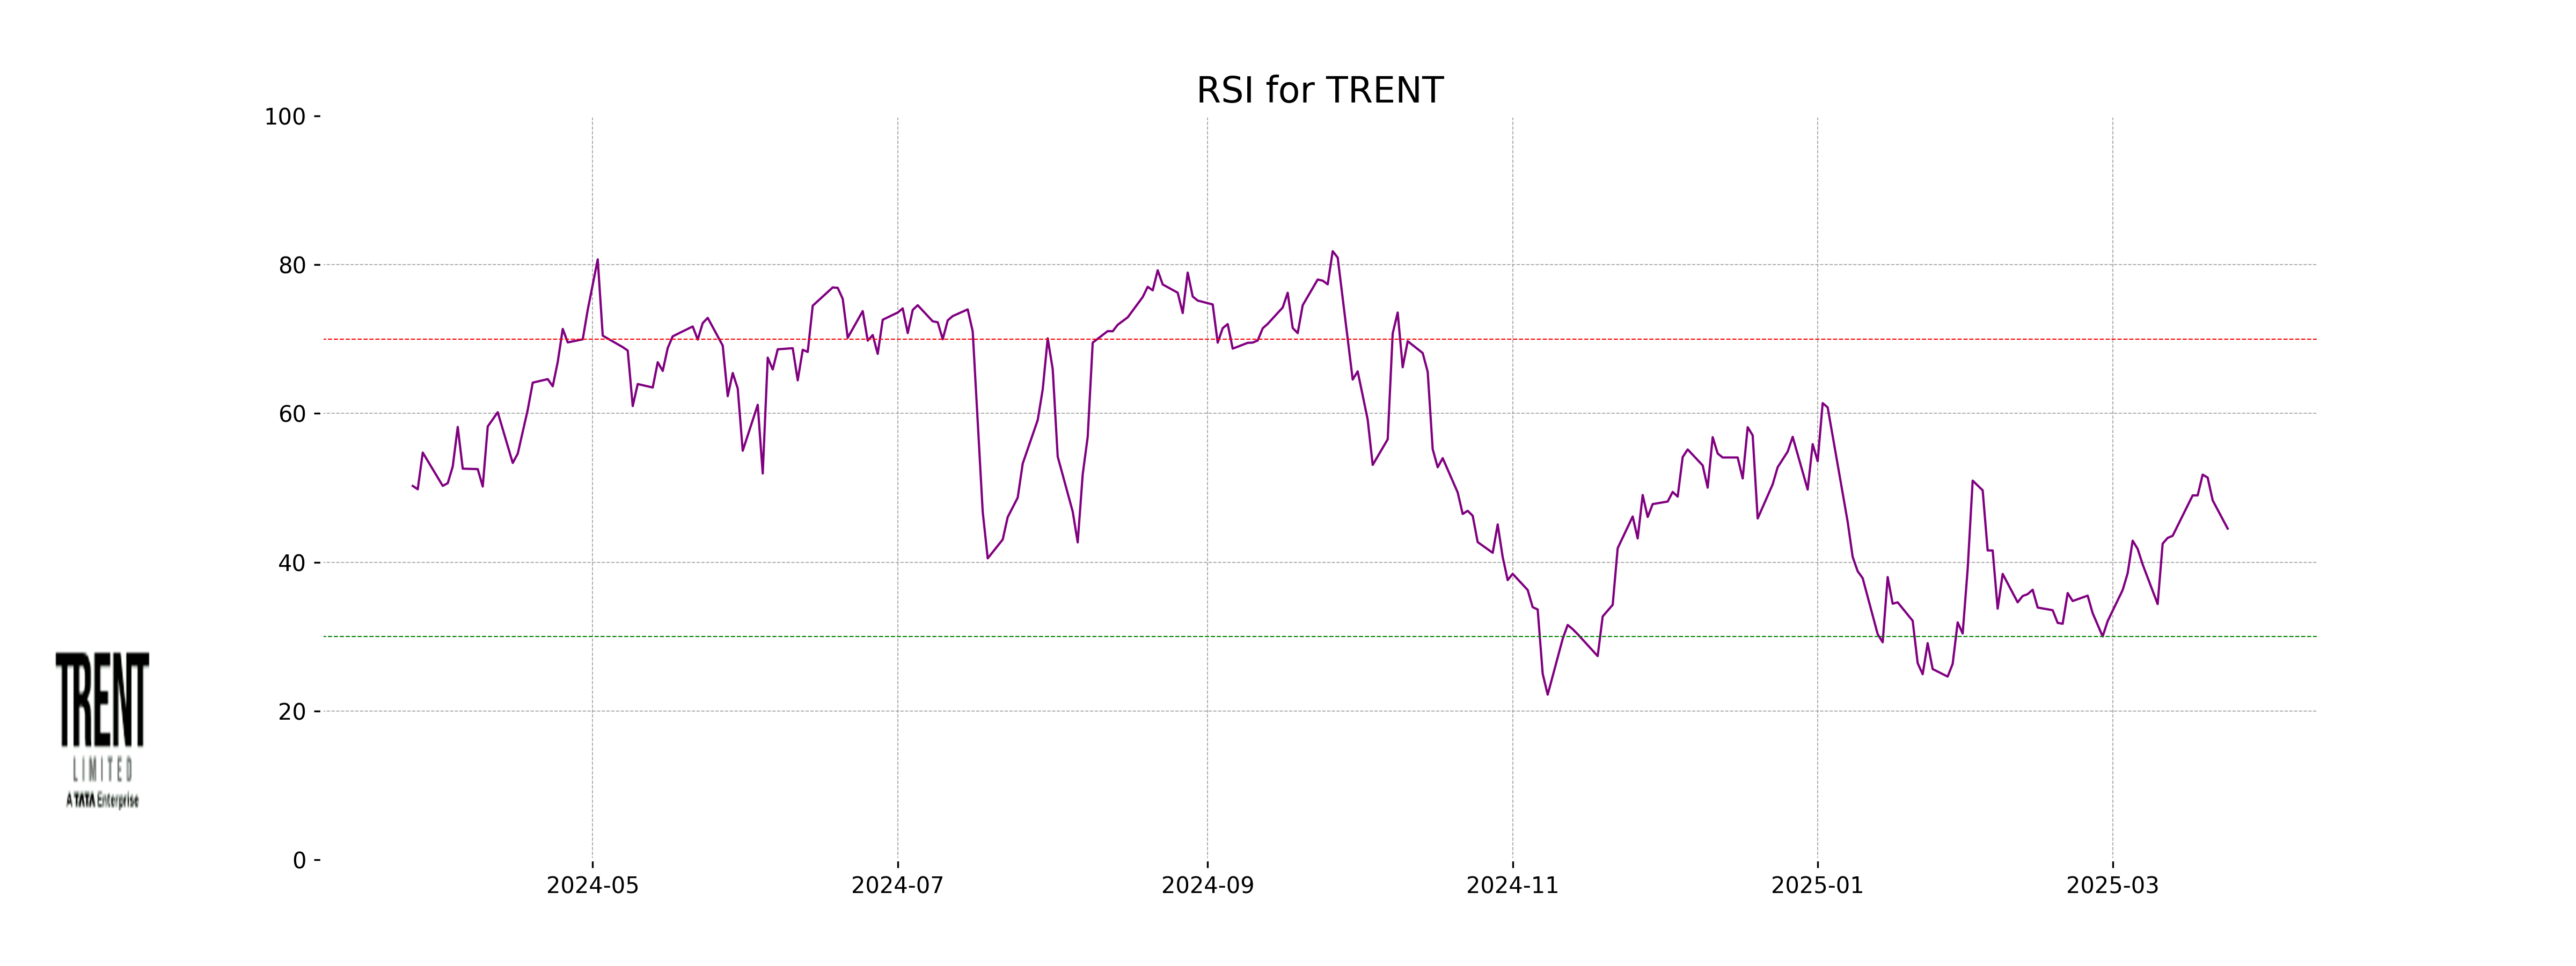
RSI Analysis
Trent's RSI is at 44.52, indicating that the stock is approaching the oversold territory, but it is not there yet. This suggests that the stock might be undervalued and could be due for a potential upside if buying pressure increases.
Up Next
NSE Nifty 50 Top losers: What are the 5 Biggest Stock losers Today March 24, 2025

India revamps tax regime in 2025, new I-T Act to take effect from April 1

New Zealand commits USD 20 bn investment in India under FTA in 15 yrs; on lines of EFTA pact

India, New Zealand conclude FTA talks; pact to offer duty-free access, USD 20 bn FDI

FTA with New Zealand to significantly deepen bilateral economic engagement: Govt

Rupee breaches 91-mark against US dollar for first time in intra-day trade

More videos

Microsoft commits USD 17.5 billion investment in India: CEO Satya Nadella

CBI books Anil Ambani's son, Reliance Home Finance Ltd. in Rs 228 crore bank fraud case

RBI raises FY26 GDP growth projection to 7.3 pc

RBI trims policy interest rate by 25bps to 5.25pc, loans to get cheaper

Rupee slumps to all-time low of 90.25 against US dollar in intra-day trade

Reliance completes merger of Star Television Productions with Jiostar

India to lead emerging market growth with 7pc GDP rise in 2025: Moody’s

Nifty hits record high after 14 months; Sensex nears all-time peak

Reliance stops Russian oil use at its only-for-export refinery to comply with EU sanctions

ED attaches fresh assets worth over Rs 1,400 cr in case against Anil Ambani's Reliance Group