


Highlights
- Hero MotoCorp shows bearish trend with low RSI
- Hindalco maintains bullish momentum above key averages
- IndusInd Bank oversold, indicating potential price reversal
Latest news

CEO among three held for gangrape of woman IT firm manager in Udaipur

PM Modi says government reforms to continue with greater vigour, focusing on ‘Ease of Living’

Reflation, possible earnings revival to push Indian equities higher through 2026: Report

Declassified US documents reveal US, Russia 'nervous' over Pakistan's nuclear proliferation

Delhi Environment Minister warns pollution could spike again amid western disturbances

China hits out at Pentagon report alleging bid to weaken US-India ties

Four VHP, Bajrang Dal members arrested for Christmas vandalism in Assam school

'Papa, I cannot bear pain': Indian-origin man dies after 8-hour wait at Canada hospital
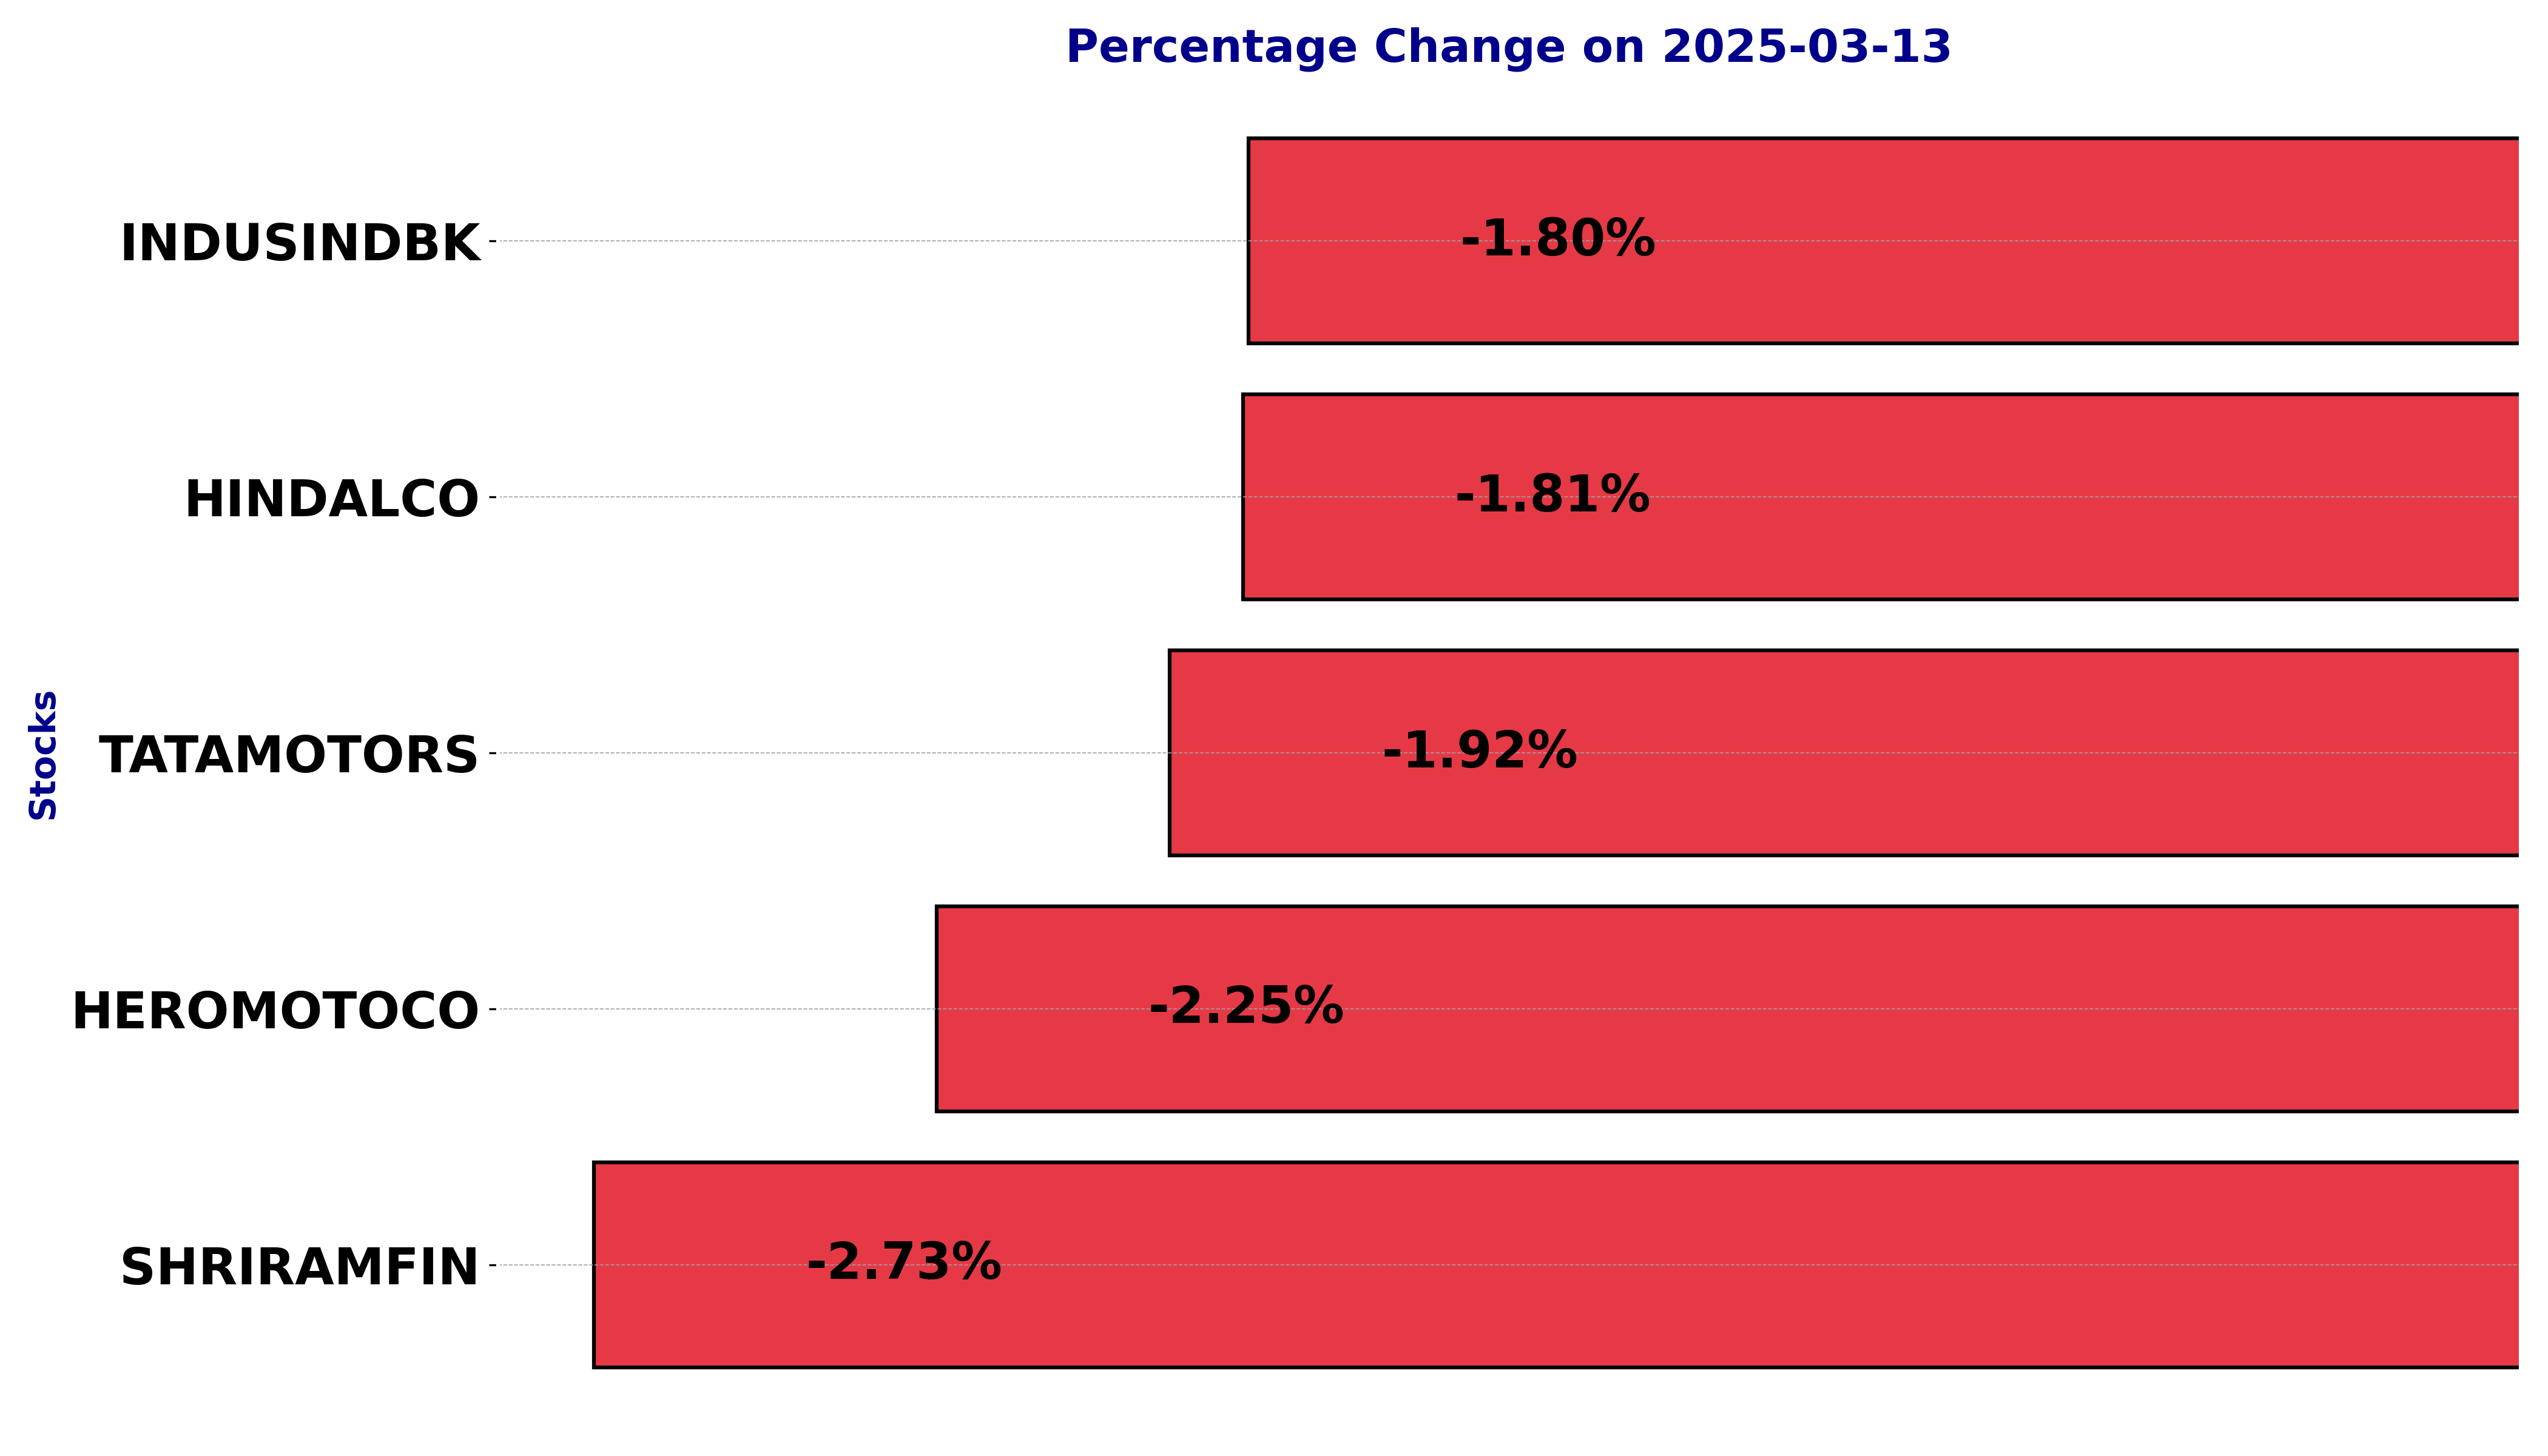
NSE Nifty 50: Top 5 stock losers of March 13, 2025


In this article, we will explore the technical indicators of some of the low-performing stocks on the Indian stock market, including HEROMOTOCO, HINDALCO, INDUSINDBK, SHRIRAMFIN, and TATAMOTORS.
By looking at these stocks through the lens of key technical factors, we aim to better understand their price movements, trends, and potential future performance.
Analysis for Hero MotoCorp - March 13, 2025

Hero MotoCorp Performance: Hero MotoCorp's stock opened at 3625.0 and closed at 3529.15, marking a decline of 2.25% from its previous close. The stock's performance shows volatility with a notable drop in its closing price, coupled with a low RSI of 33.26, signaling potential overselling. With a PE Ratio of 17.03 and a significant market cap, the company remains a key player in the Auto Manufacturers sector in India.

Relationship with Key Moving Averages
Hero MotoCorp's current stock price of 3529.15 is below its key moving averages, indicating a bearish trend. Specifically, it is trading beneath the 10 EMA of 3637.00, the 50 EMA of 3933.40, and the 200 EMA of 4402.23. This suggests potential downward pressure in the short to long term.
Moving Averages Trend (MACD)
Hero MotoCorp shows a MACD of -117.39, which is lower than the MACD Signal of -109.87. This indicates a short-term bearish momentum, suggesting a continuation of the downtrend unless there is a reversal signal.

RSI Analysis
RSI Analysis for Hero MotoCorp: The current RSI for Hero MotoCorp is 33.26, indicating that the stock is approaching oversold territory. This could suggest a potential buying opportunity if other market conditions are favorable, as RSI values below 30 typically signal that a stock may be undervalued.

Analysis for HINDALCO - March 13, 2025

HINDALCO has shown a slight decline in its latest performance with a 1.81% drop in its stock price, closing at 677.35. The company's RSI of 63.52 suggests it is nearing overbought territory, while the PE Ratio of 10.85 indicates a reasonably priced stock compared to earnings. Despite a decrease, the stock remains above its 50 EMA and 200 EMA, highlighting a positive long-term trend.

Relationship with Key Moving Averages
Hindalco's current closing price of 677.35 is above its 10 EMA of 671.53, indicating short-term bullish momentum. However, it is below the 50 EMA of 634.44 and closely parallels the 200 EMA of 633.75, suggesting potential for longer-term trend reversals or stability.
Moving Averages Trend (MACD)
The MACD for Hindalco is 21.41, which is above the MACD Signal line of 17.10, indicating a potential bullish momentum. This suggests that the stock might experience upward movement. However, it's crucial to consider other indicators and market conditions for a comprehensive analysis.

RSI Analysis
RSI Analysis for Hindalco: The Relative Strength Index (RSI) of Hindalco is 63.52, indicating a moderately strong momentum. An RSI value above 50 suggests that the stock might be trending upward, but as it is still below 70, it has not yet reached overbought levels.

Analysis for IndusInd Bank - March 13, 2025

IndusInd Bank has experienced a negative performance with a close of 672.35 INR, reflecting a -1.80% change from the previous close. It shows weaker momentum indicators, with an RSI of 18.04, suggesting it is oversold, and a bearish MACD at -71.66 below the signal line. The company's market cap is 523.8 billion INR, and it operates in the Financial Services sector, specifically among regional banks in India.

Relationship with Key Moving Averages
IndusInd Bank's current closing price at 672.35 is significantly below its key moving averages, with the 50 EMA at 969.35, the 10 EMA at 836.92, and the 20 EMA at 909.98. This indicates a bearish trend as the stock trades below these averages, suggesting downward momentum in its recent price behavior.
Moving Averages Trend (MACD)
The MACD analysis for IndusInd Bank indicates a negative outlook as the MACD value of -71.662 is below the MACD Signal of -30.248, suggesting a bearish momentum. Additionally, the RSI of 18.04 implies the stock is in oversold territory, which could lead to a potential trend reversal if buying interest increases.

RSI Analysis
The RSI (Relative Strength Index) for IndusInd Bank is at 18.04, indicating that the stock is in the oversold territory. Generally, an RSI below 30 suggests that the stock is potentially undervalued and may be due for a corrective upward move.

Analysis for Shriram Finance - March 13, 2025

Shriram Finance experienced a slight decline, with its closing price of 619.55 representing a -2.73% change from the previous close of 636.95. Despite this drop, the company's market position remains strong, with a market cap of 1.16 trillion INR. It operates within the Financial Services sector in India, specifically in Credit Services, with a solid EPS of 41.27 and a PE Ratio of 15.01.

Relationship with Key Moving Averages
Shriram Finance is currently trading below its previous close but is above both its 50 EMA and 200 EMA, indicating a potential uptrend compared to its long-term average. However, it remains slightly below its 10 EMA, suggesting recent weakness relative to its shorter-term performance.
Moving Averages Trend (MACD)
The MACD line for Shriram Finance is currently at 20.44, which is above the MACD Signal line at 18.64. This positive divergence suggests bullish momentum, indicating potential further upward movement in price.

RSI Analysis
The RSI (Relative Strength Index) for Shriram Finance is at 58.17, which suggests that the stock is in a neutral zone—neither overbought nor oversold. This indicates a balanced momentum in its current price movement, and traders might look for further signals to predict a future trend.

Analysis for Tata Motors - March 13, 2025

Tata Motors Performance Summary: Tata Motors experienced a decline in its stock price, closing at 655.5, a change of -1.92% from the previous close. The stock's performance is below its key moving averages, signaling weaker momentum. The RSI of 44.39 suggests neutral market sentiment. The company has a strong market cap and a PE ratio of 7.57, indicating potentially reasonable valuation for further consideration.

Relationship with Key Moving Averages
Tata Motors is currently trading below its 50-day EMA of 698.67 and 200-day EMA of 809.03, indicating a potential bearish trend. However, the stock is above its 10-day EMA of 651.86, suggesting short-term strength.
Moving Averages Trend (MACD)
Tata Motors' MACD value of -15.73, which is above its MACD Signal of -20.21, suggests a potential upward momentum. This indicates that the stock may be attempting to reverse its recent downtrend, although further confirmation from other indicators and price action would be beneficial for a clearer trend outlook.

RSI Analysis
Tata Motors' RSI stands at 44.39, indicating a neutral market sentiment as it's between the typical oversold (below 30) and overbought (above 70) levels. This suggests that the stock is neither in an overbought nor oversold condition, possibly reflecting a period of consolidation.

Up Next
NSE Nifty 50: Top 5 stock losers of March 13, 2025

New Zealand commits USD 20 bn investment in India under FTA in 15 yrs; on lines of EFTA pact

India, New Zealand conclude FTA talks; pact to offer duty-free access, USD 20 bn FDI

FTA with New Zealand to significantly deepen bilateral economic engagement: Govt

Rupee breaches 91-mark against US dollar for first time in intra-day trade

Microsoft commits USD 17.5 billion investment in India: CEO Satya Nadella

More videos

CBI books Anil Ambani's son, Reliance Home Finance Ltd. in Rs 228 crore bank fraud case

RBI raises FY26 GDP growth projection to 7.3 pc

RBI trims policy interest rate by 25bps to 5.25pc, loans to get cheaper

Rupee slumps to all-time low of 90.25 against US dollar in intra-day trade

Reliance completes merger of Star Television Productions with Jiostar

India to lead emerging market growth with 7pc GDP rise in 2025: Moody’s

Nifty hits record high after 14 months; Sensex nears all-time peak

Reliance stops Russian oil use at its only-for-export refinery to comply with EU sanctions

ED attaches fresh assets worth over Rs 1,400 cr in case against Anil Ambani's Reliance Group

India signs one-year deal to import 2.2 million tonnes of LPG from US