


Highlights
- HCL Tech shows bearish trend with low RSI
- IndusInd Bank remains weak, trading below EMAs
- Infosys nears oversold levels, signaling potential rebound
Latest news

Navi Mumbai International Airport starts commercial flight operations

Gujarat AAP MLA Chaitar Vasava refutes Rs 75 lakh extortion claims by BJP MP

AAP MLA Gopal Italia alleges bullying, extortion at Visavadar groundnut centre

AAP MLA Chaitar Vasava dismisses conversion claims in Gujarat's Dediapada tribal region

Delhi Police deploys 20,000 personnel for Christmas and New Year security

Flash floods occur across southern California as powerful Christmas storm hits

Vajpayee's work, leadership will continue to be a guiding light for nation's development: PM Modi

India expresses concern over demolition of Hindu deity's statue in Thailand-Cambodia conflict
NSE Nifty 50: Top 5 stock losers of March 07, 2025


In this article, we will explore the technical indicators of some of the low-performing stocks on the Indian stock market, including HCLTECH, INDUSINDBK, INFY, NTPC, and SHRIRAMFIN.
By looking at these stocks through the lens of key technical factors, we aim to better understand their price movements, trends, and potential future performance.

Analysis for HCL Technologies - March 07, 2025

HCL Technologies Performance Description: HCL Technologies experienced a decline in its stock price, closing at 1557.95, down by 1.73% from the previous close. The stock's technical indicators show a bearish trend, with the RSI at a low 30.72, indicating it may be oversold. Despite the current downturn, HCL Technologies is a major player in the technology sector with a substantial market cap and a PE ratio of 24.75.

Relationship with Key Moving Averages
For HCL Technologies, the current closing price of 1557.95 is below its 10 EMA of 1599.53, 20 EMA of 1642.17, 50 EMA of 1718.84, and 200 EMA of 1691.82, indicating a downward trend relative to these key moving averages.
Moving Averages Trend (MACD)
HCL Technologies is exhibiting bearish momentum as indicated by its MACD value of -53.71, which is below the MACD Signal of -46.76. This suggests a decrease in upward momentum and potential further declines if the trend continues.

RSI Analysis
HCL Technologies has an RSI value of 30.73, which suggests that the stock is currently in the oversold territory. This may indicate a potential buying opportunity if the stock is considered fundamentally strong, but it also reflects prevailing bearish sentiment.

Analysis for IndusInd Bank - March 07, 2025

IndusInd Bank has closed at 936.75, indicating a decrease of -3.60% in comparison to the previous close of 971.70. The bank shows relative weakness with an RSI of 32.86, suggesting it's in oversold territory. The MACD indicator is negative, indicating a bearish trend, while the stock is trading below its key EMAs.

Relationship with Key Moving Averages
IndusInd Bank's closing price of 936.75 is below its 10-day EMA of 989.25, 50-day EMA of 1011.72, and 200-day EMA of 1165.79. This indicates a bearish trend for the stock as it is trading below key moving averages.
Moving Averages Trend (MACD)
The MACD for IndusInd Bank is currently negative at -10.80, while the MACD Signal is 1.47, indicating a bearish trend. The MACD line being below the signal line suggests potential downward momentum in the stock's price.

RSI Analysis
IndusInd Bank's RSI (Relative Strength Index) stands at 32.86, indicating that the stock is in the oversold territory. This suggests that there might be a potential for a price reversal or bounce, as RSI values below 30 typically indicate an oversold condition. It’s important to combine this with other indicators before making trade decisions.

Analysis for Infosys - March 07, 2025

Infosys Performance Description: Infosys, operating in the Technology sector, specifically in Information Technology Services in India, closed at 1686.0, showing a drop of 1.74% from the previous close. The company's RSI value of 31.5 indicates it might be nearing oversold conditions, and its MACD suggests bearish momentum. Its market cap stands at approximately 6.98 trillion INR, with a PE ratio of 24.44.

Relationship with Key Moving Averages
Infosys's current close price of 1686.0 is below its 10 EMA of 1732.13, 50 EMA of 1827.56, and 200 EMA of 1787.90, indicating a bearish trend relative to these key moving averages. This positioning suggests potential downward pressure or a bearish market sentiment for the stock within its industry context.
Moving Averages Trend (MACD)
MACD Analysis for Infosys: The MACD is currently at -47.95 and the MACD Signal at -38.05, indicating a bearish trend as the MACD line is below the signal line. This suggests downward momentum in Infosys' stock price.

RSI Analysis
RSI Analysis for Infosys The Relative Strength Index (RSI) for Infosys is 31.50, which suggests that the stock is approaching oversold conditions. Typically, an RSI below 30 is considered oversold, indicating potential buying interest if other indicators support it.

Analysis for NTPC - March 07, 2025
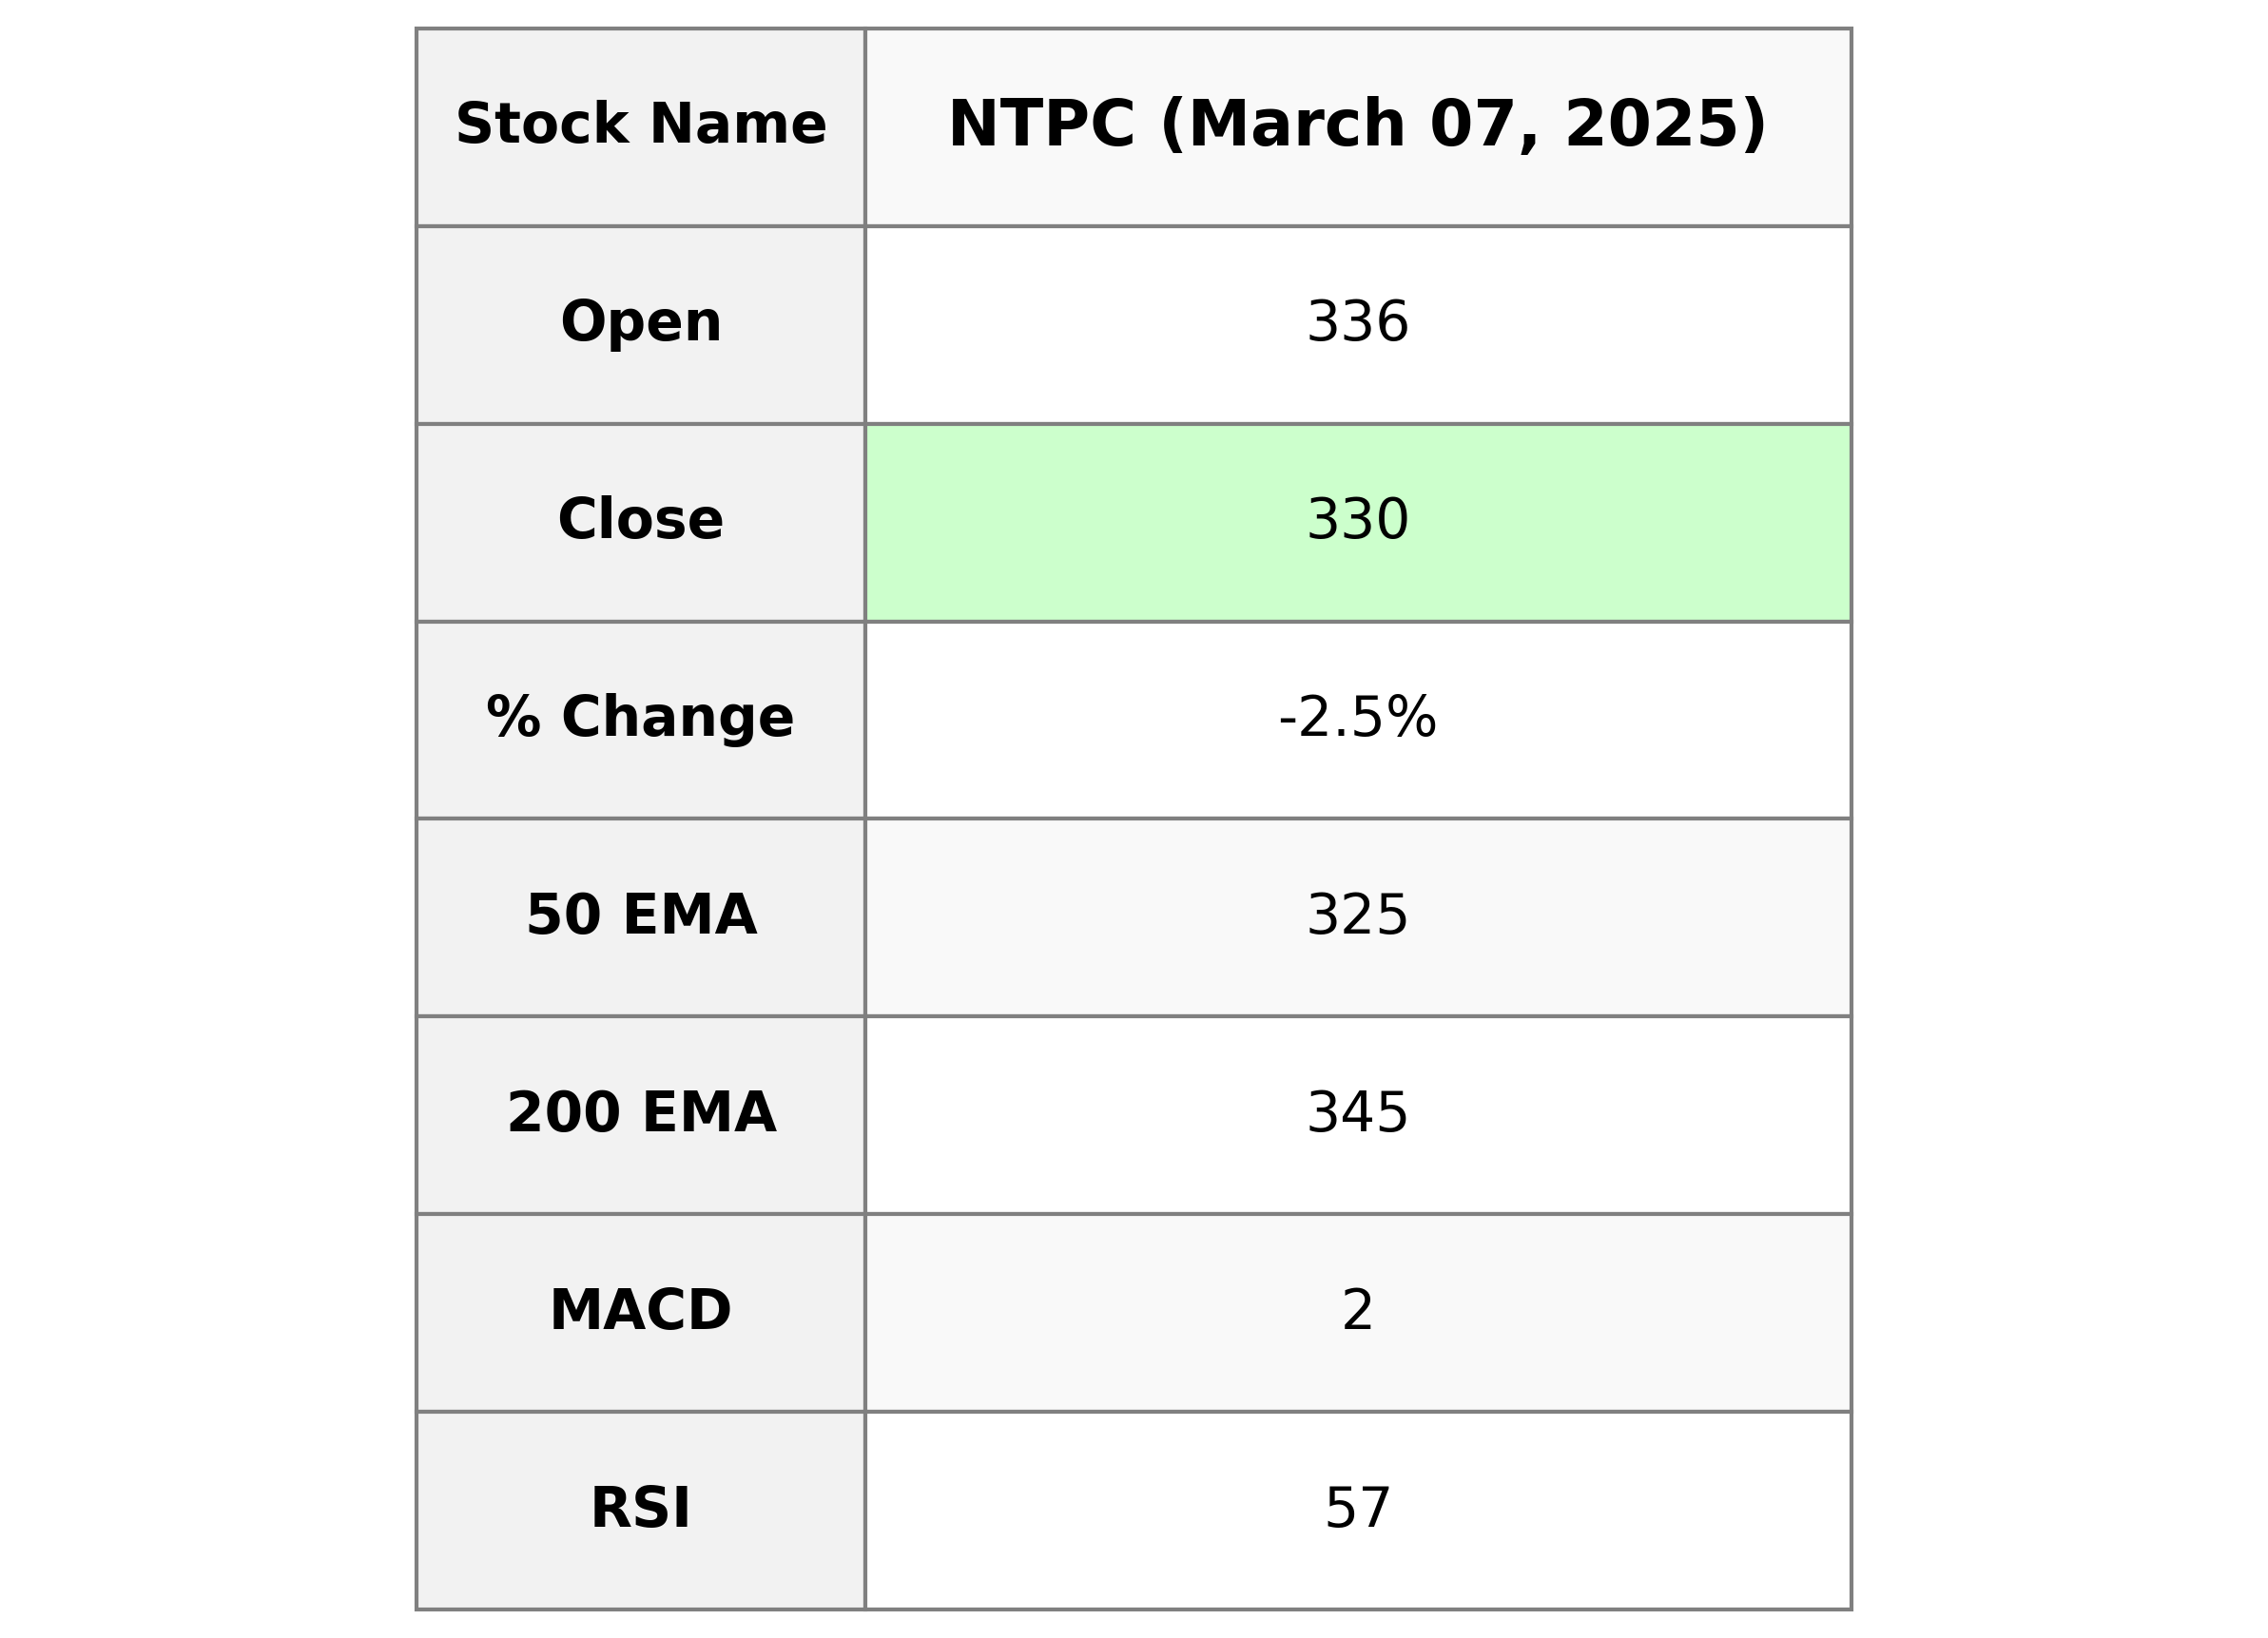
NTPC Performance: NTPC's recent trading session closed at 329.55, marking a decline of 2.47% from its previous close of 337.90. Despite this, its RSI is moderately high at 57.27, implying momentum. The stock's PE Ratio is 15.36, indicating its valuation against earnings, and the overall market cap is substantial at approximately 3.20 trillion INR, reflecting its significant presence in the Utilities sector.

Relationship with Key Moving Averages
The closing price of NTPC is 329.55, which is above its 50-day EMA of 324.77, indicating some recent bullish action. However, it is below the 200-day EMA of 344.82, signifying a longer-term bearish trend. Additionally, the stock's price is above both the 10-day EMA of 322.42 and the 20-day EMA of 319.49, suggesting recent positive momentum.
Moving Averages Trend (MACD)
For NTPC, the MACD value of 2.05 suggests bullish momentum as it is above the MACD Signal of -0.48, indicating a potential for upward price movement. However, the RSI of 57.27 is near the neutral zone, suggesting a moderate strength in the stock's current trend.

RSI Analysis
The Relative Strength Index (RSI) for NTPC is 57.27, indicating a neutral position. Typically, an RSI below 30 suggests an asset might be undervalued, whereas an RSI above 70 suggests it might be overvalued. NTPC's RSI value suggests that the stock is neither oversold nor overbought at this point.

Analysis for Shriram Finance - March 07, 2025

Shriram Finance Performance Summary: Shriram Finance experienced a decrease in its stock price, closing at 630.85, down 2.10% from the previous close of 644.35. The stock's trading volume was 5,828,557 with a significant MACD value indicating a bullish trend. Despite the decrease, key moving averages such as the 50 EMA and 200 EMA suggest a strong upward trend. With a market cap of approximately 1.19 trillion INR and a PE ratio of 15.27, Shriram Finance operates in the Financial Services sector, specifically within Credit Services in India.

Relationship with Key Moving Averages
Relationship with Key Moving Averages for Shriram Finance: The closing price of Shriram Finance is above the 50 EMA (578.83) and the 200 EMA (559.85), indicating a potential upward trend. However, it is trading below the 10 EMA (614.28) and 20 EMA (594.18), suggesting a recent short-term weakening of momentum.
Moving Averages Trend (MACD)
The MACD analysis for Shriram Finance indicates a bullish trend, as the MACD value of 21.77 is above the MACD Signal value of 14.74. This suggests positive momentum in the stock price, even though the recent close shows a decline.

RSI Analysis
RSI, or Relative Strength Index, for Shriram Finance is at 66.09, which is considered to be in the moderately overbought range. A reading above 70 generally indicates that the stock might be overbought, suggesting potential for a price pullback, while a reading below 30 indicates it might be oversold, suggesting potential for a price increase. With the RSI near 70, investors may monitor for possible trend reversals or corrections.

Up Next
NSE Nifty 50: Top 5 stock losers of March 07, 2025

New Zealand commits USD 20 bn investment in India under FTA in 15 yrs; on lines of EFTA pact

India, New Zealand conclude FTA talks; pact to offer duty-free access, USD 20 bn FDI

FTA with New Zealand to significantly deepen bilateral economic engagement: Govt

Rupee breaches 91-mark against US dollar for first time in intra-day trade

Microsoft commits USD 17.5 billion investment in India: CEO Satya Nadella

More videos

CBI books Anil Ambani's son, Reliance Home Finance Ltd. in Rs 228 crore bank fraud case

RBI raises FY26 GDP growth projection to 7.3 pc

RBI trims policy interest rate by 25bps to 5.25pc, loans to get cheaper

Rupee slumps to all-time low of 90.25 against US dollar in intra-day trade

Reliance completes merger of Star Television Productions with Jiostar

India to lead emerging market growth with 7pc GDP rise in 2025: Moody’s

Nifty hits record high after 14 months; Sensex nears all-time peak

Reliance stops Russian oil use at its only-for-export refinery to comply with EU sanctions

ED attaches fresh assets worth over Rs 1,400 cr in case against Anil Ambani's Reliance Group

India signs one-year deal to import 2.2 million tonnes of LPG from US