


Highlights
- Bajaj Auto trades below key moving averages
- Bajaj Finserv shows mixed momentum in trends
- HCL Tech and Hero MotoCorp are oversold
Latest news

Australia all out for 152 as England take charge of 4th Ashes Test

Delhi air quality slips to ‘very poor’ with AQI at 310

Railway Ministry notifies fare hike; new ticket prices come into effect today

Indian student shot dead near University of Toronto campus

Another Hindu man lynched in Bangladesh over alleged extortion, government denies communal angle

US launches Christmas Day strikes on IS targets in Nigeria

Nitin Gadkari reveals how he met Hamas chief Ismail Haniyeh hours before assassination in Tehran

BNP acting chairman Tarique Rahman returns to Dhaka after 17 years in exile
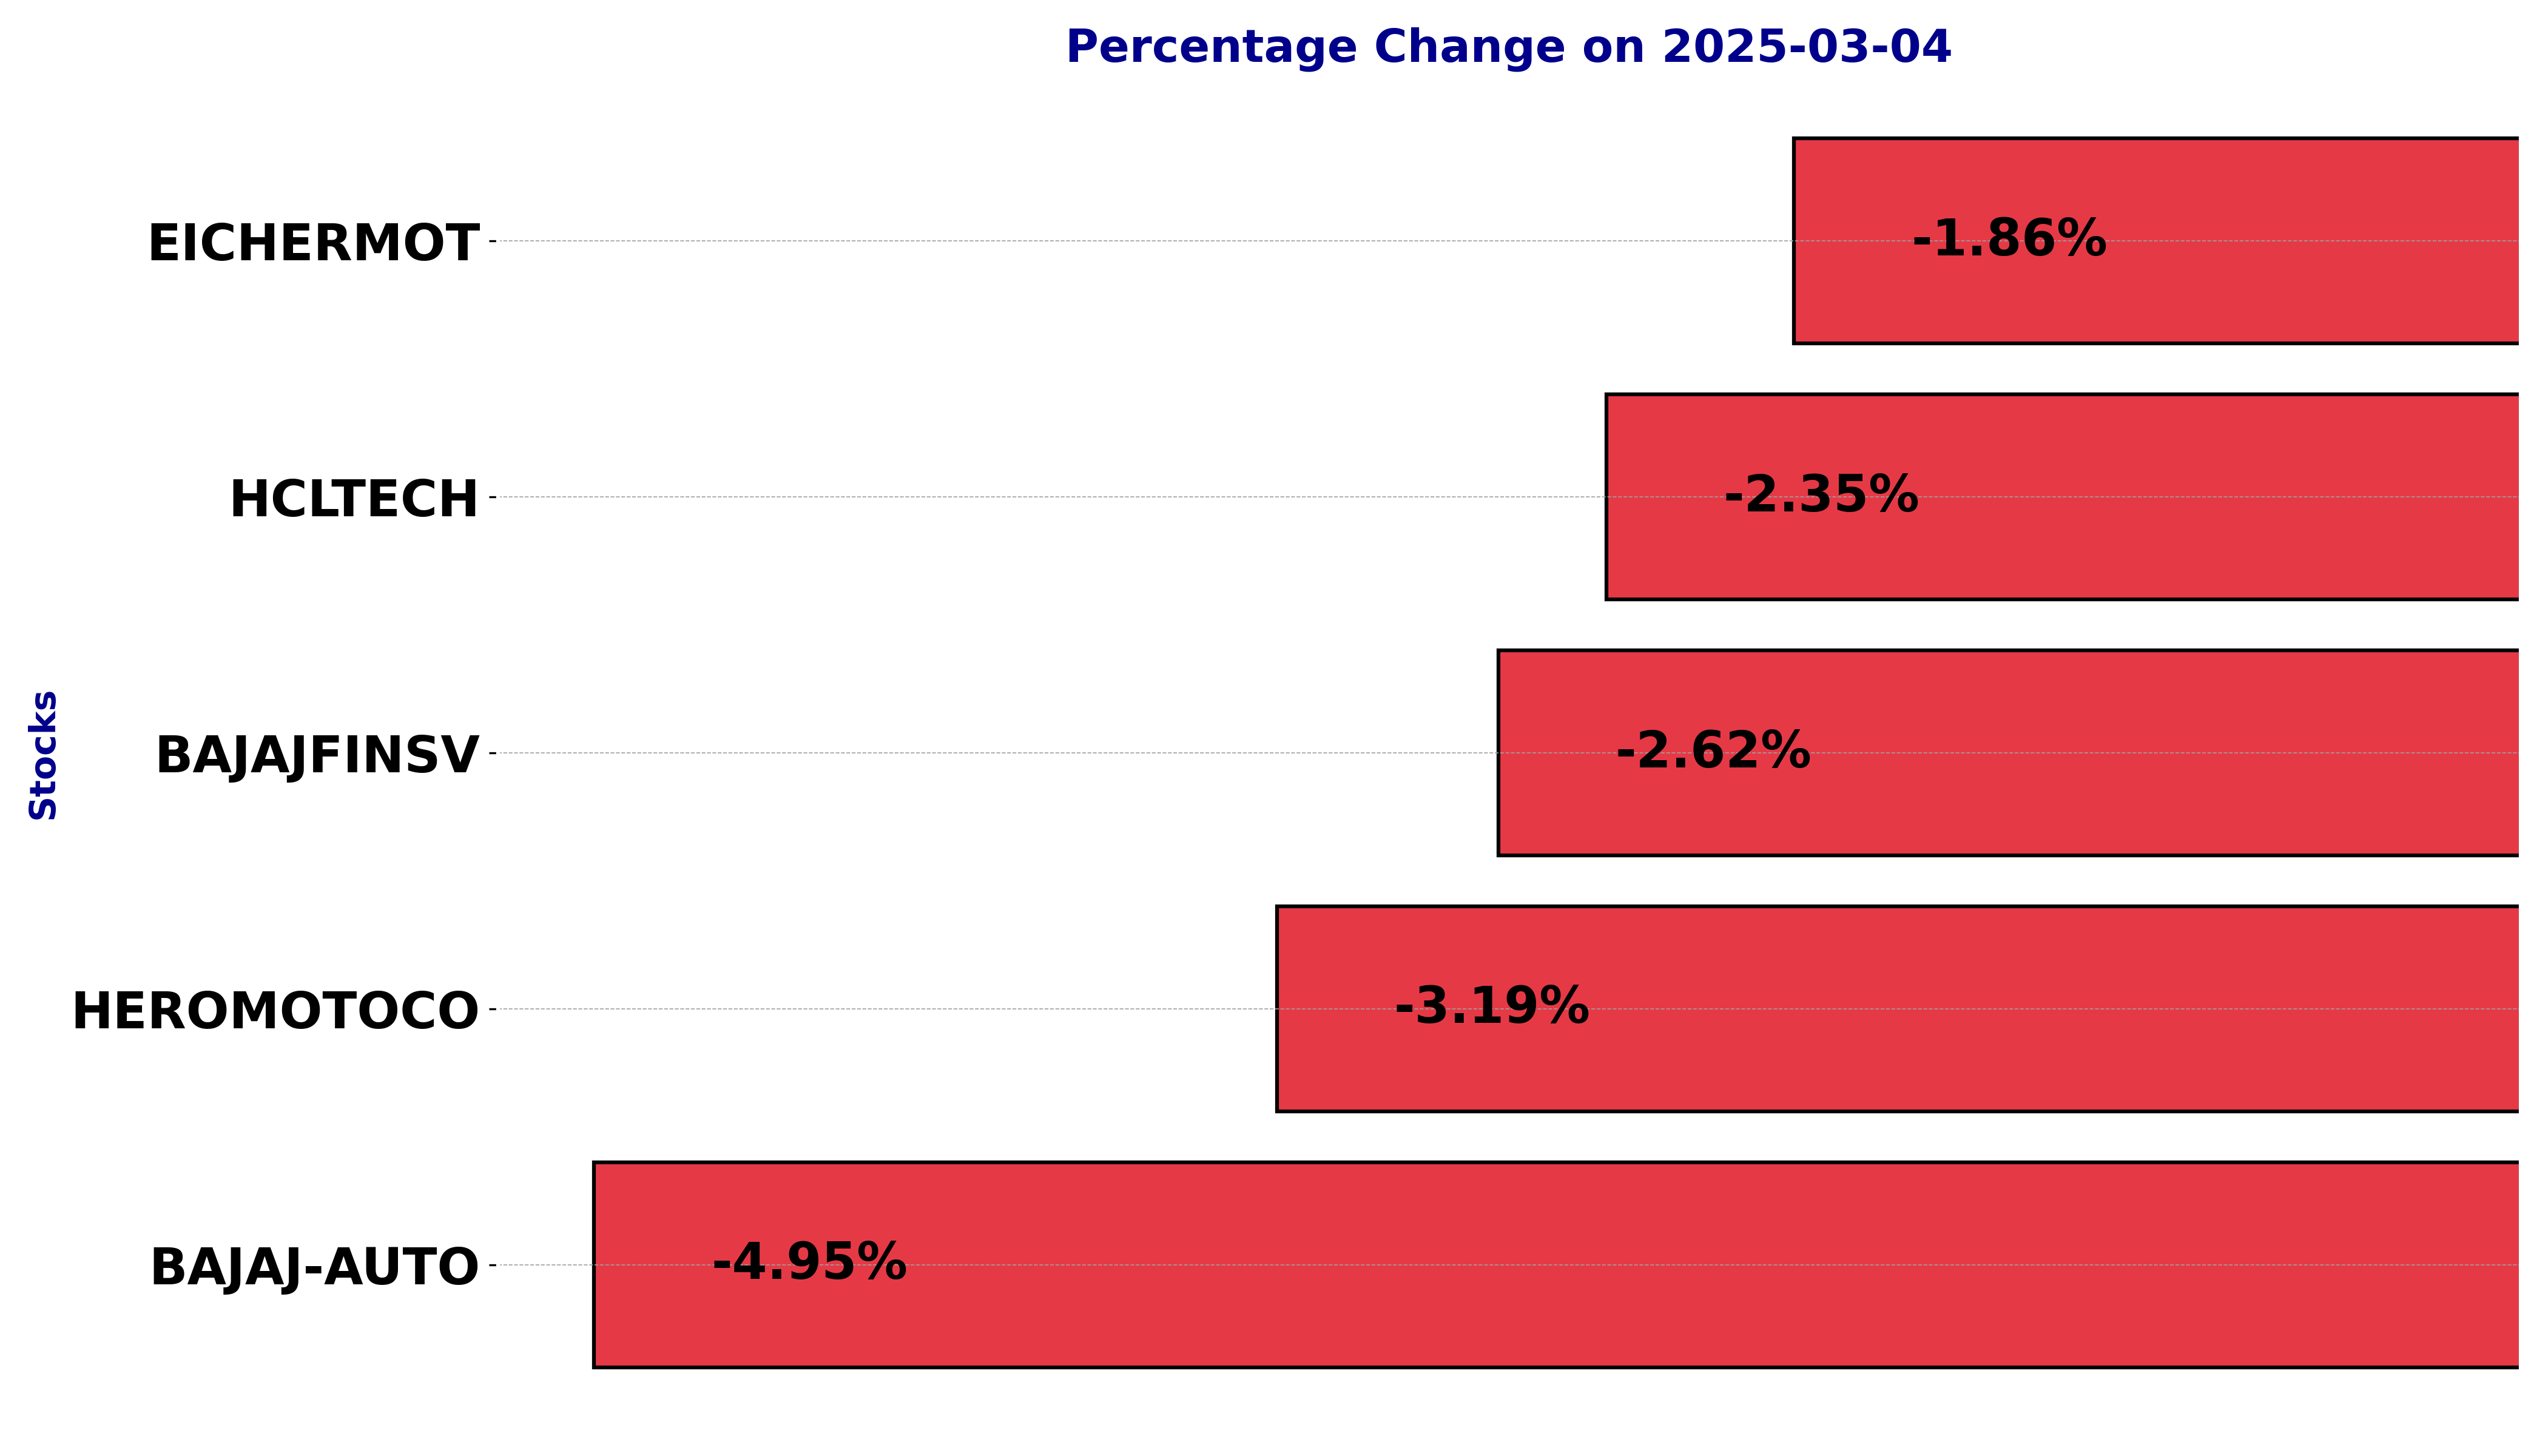
NSE Nifty 50: Top 5 stock losers of March 04, 2025


In this article, we will explore the technical indicators of some of the low-performing stocks on the Indian stock market, including BAJAJ-AUTO, BAJAJFINSV, EICHERMOT, HCLTECH, and HEROMOTOCO.
By looking at these stocks through the lens of key technical factors, we aim to better understand their price movements, trends, and potential future performance.
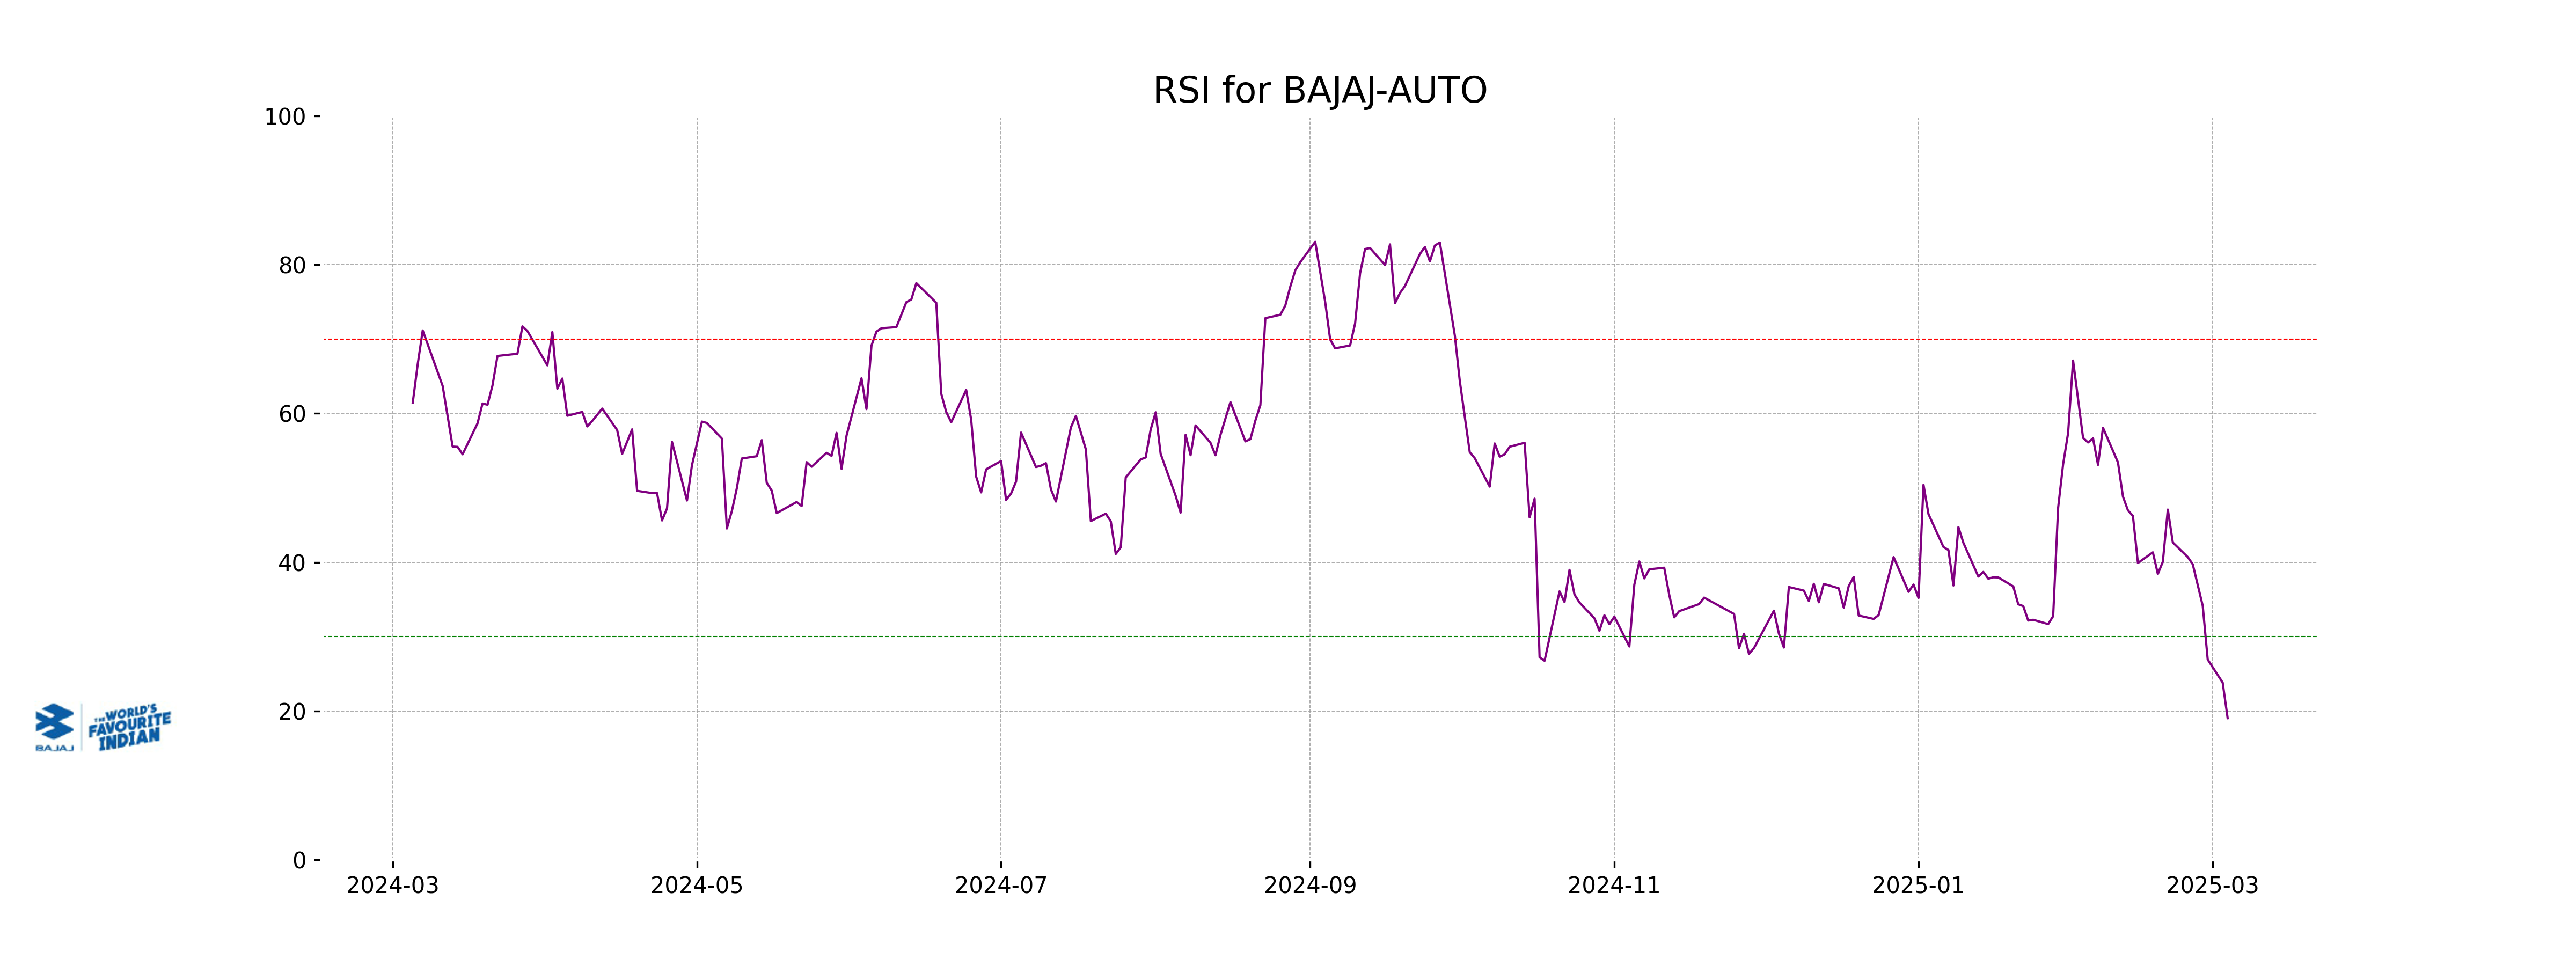
Analysis for Bajaj Auto - March 04, 2025
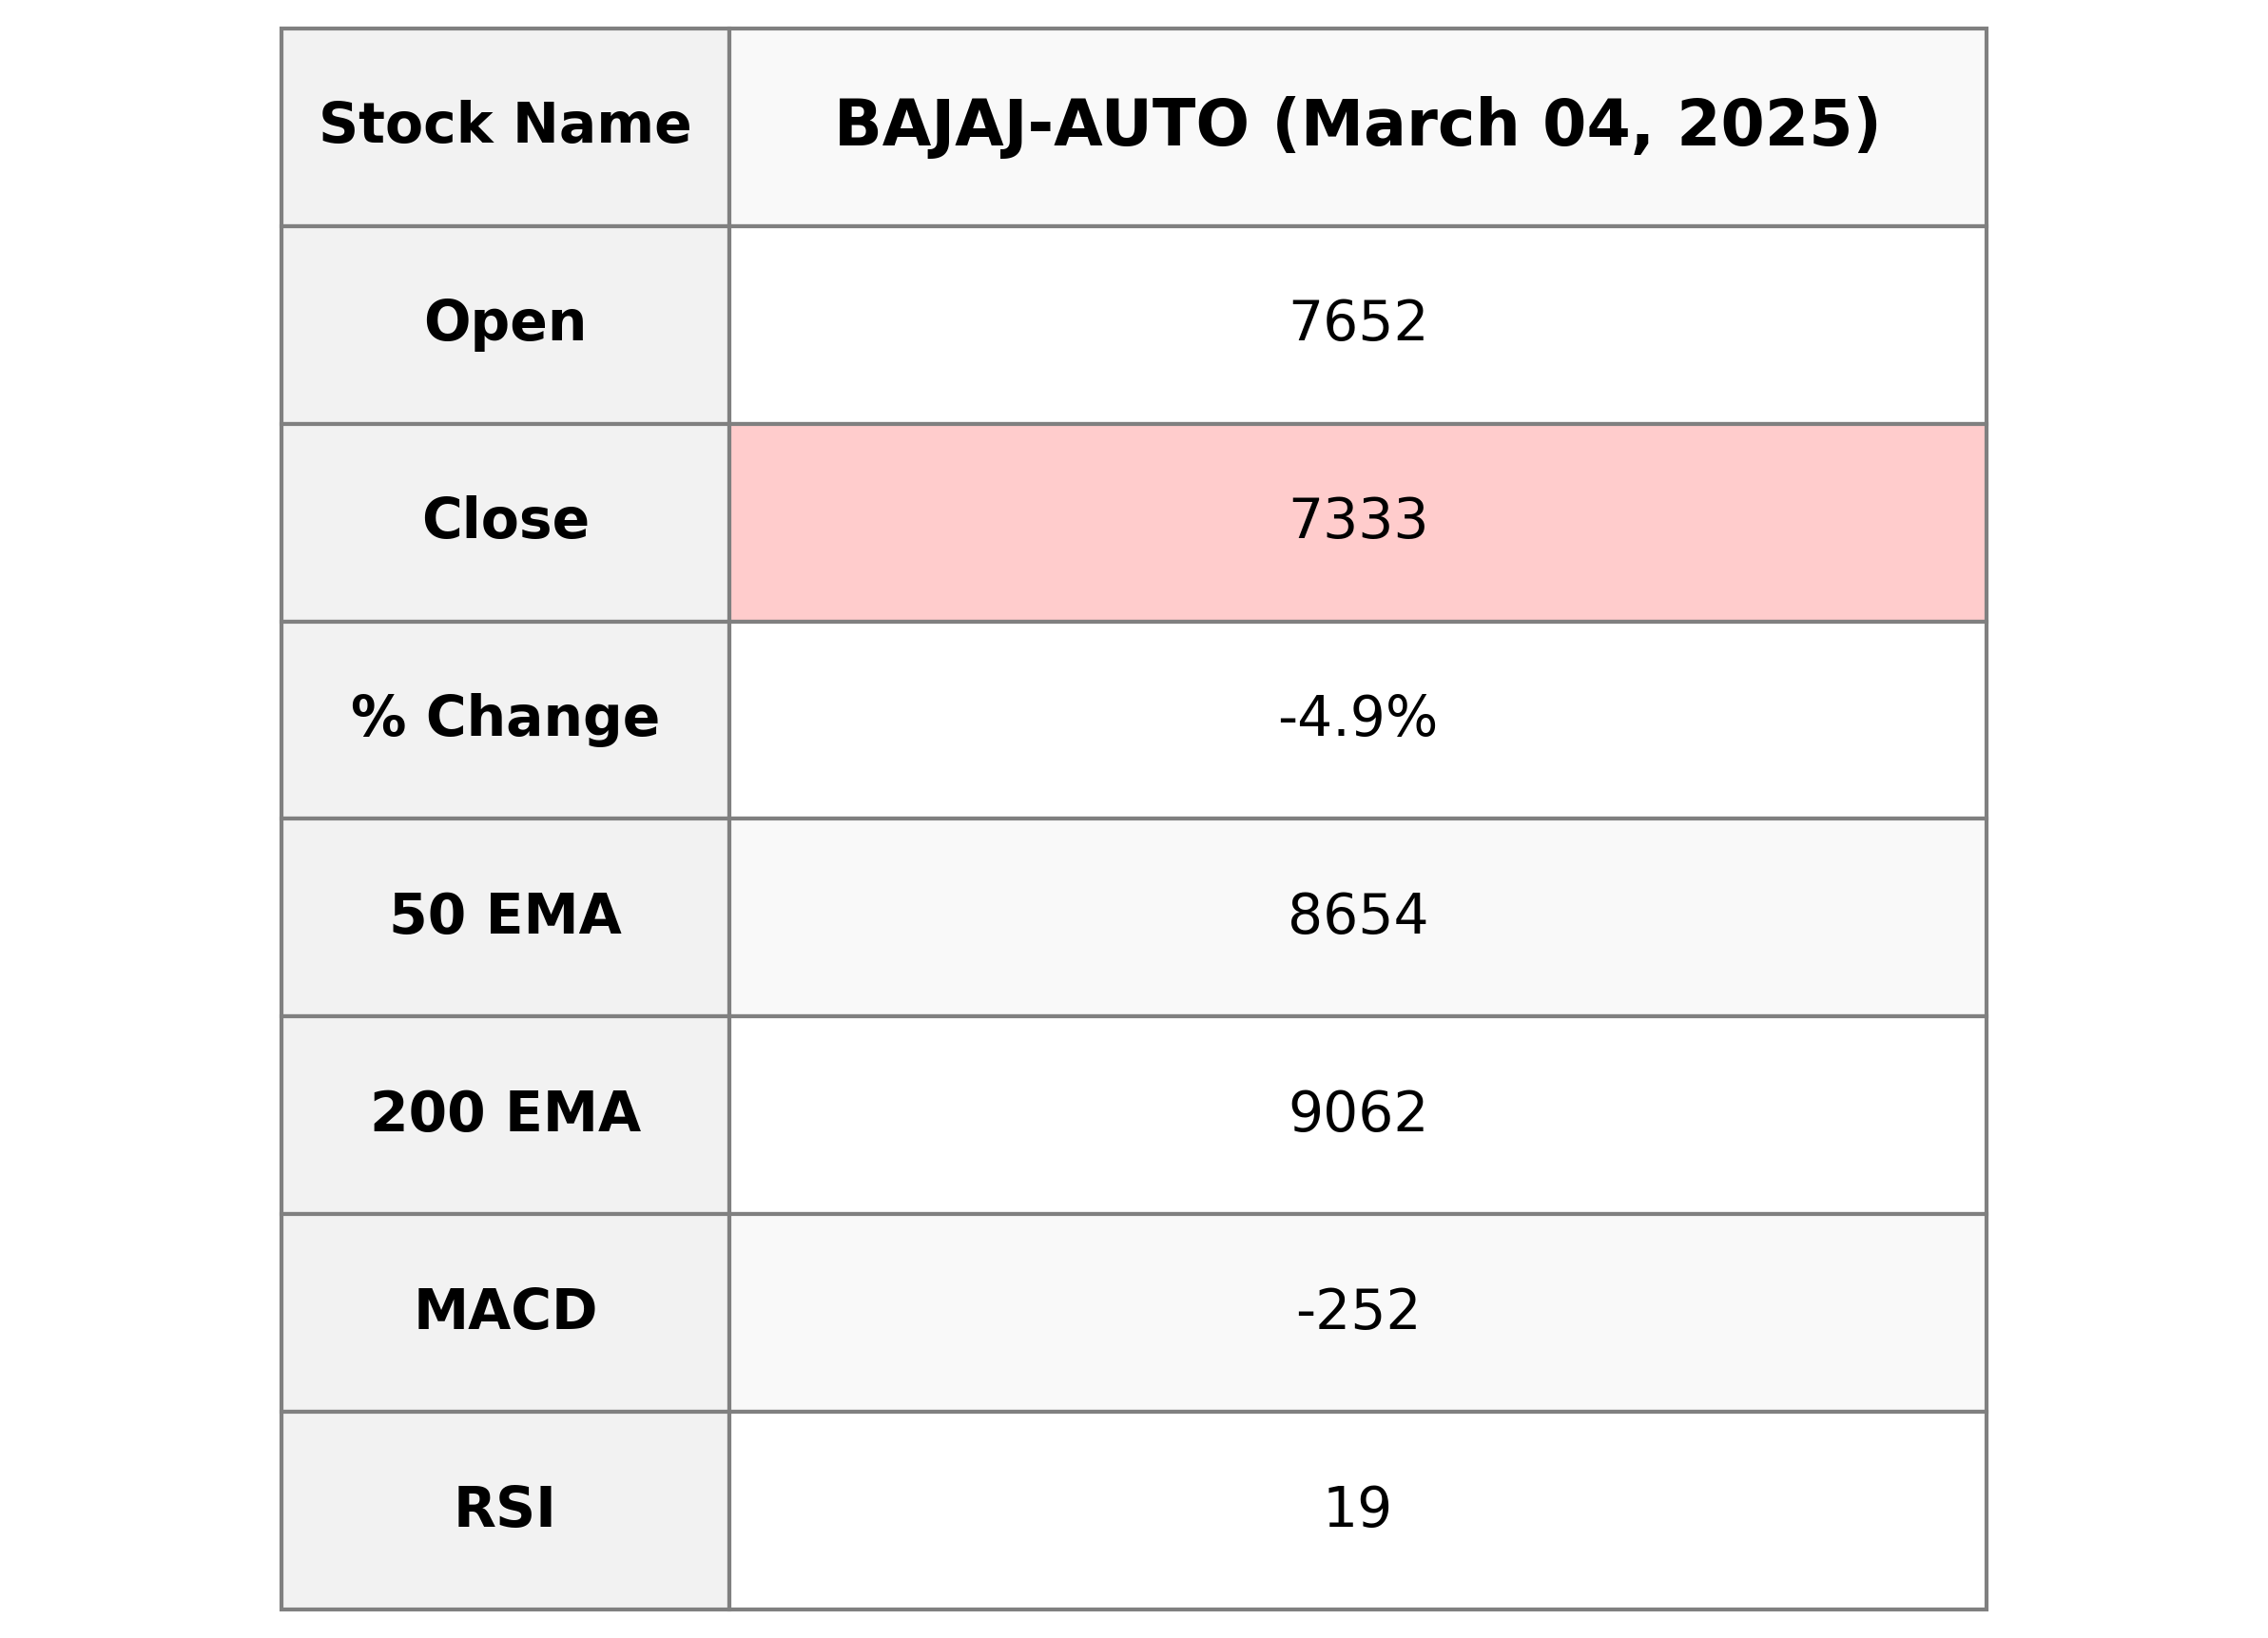
Bajaj Auto Performance: Bajaj Auto has experienced a recent decline with a closing price of 7333.30, a drop of 4.95% in one day, reflected by a points change of -381.5. The stock is currently underperforming compared to its 50 and 200-day EMA, and the RSI indicates it's in an oversold condition. The company operates in the consumer cyclical sector, specifically in the auto manufacturers industry within India.
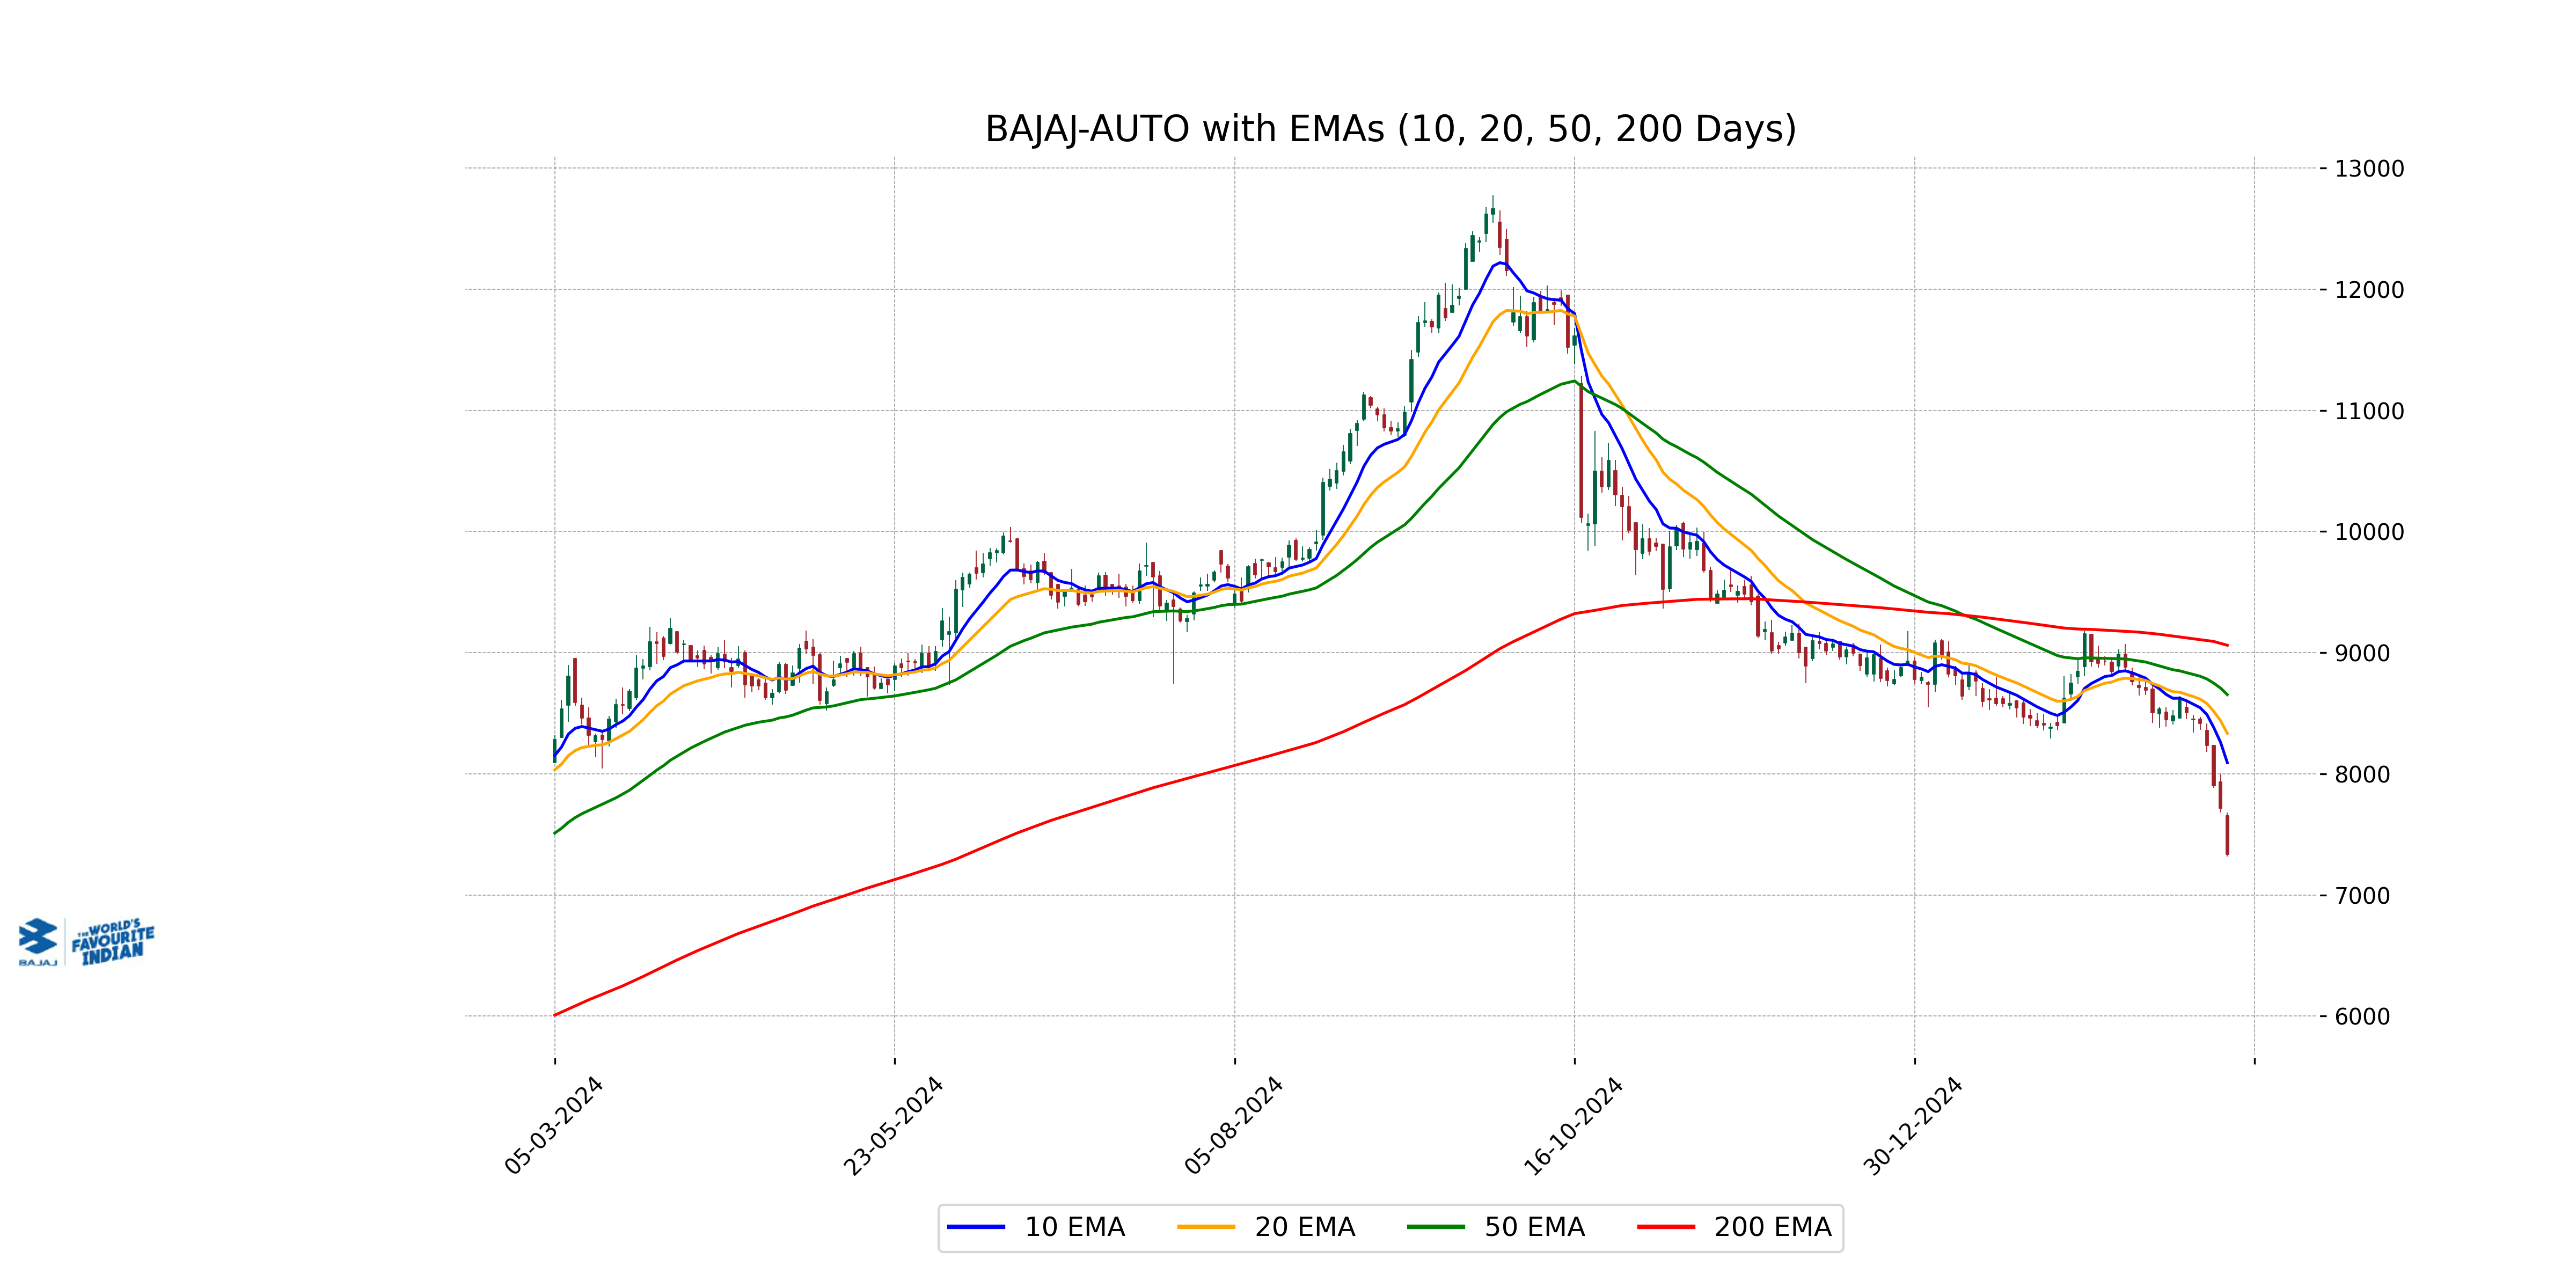
Relationship with Key Moving Averages
For Bajaj Auto, the current close price of 7333.30 is below key moving averages, with the 50-day EMA at 8654.07, the 200-day EMA at 9061.51, and the 20-day EMA at 8334.06, indicating a bearish trend. Additionally, the 10-day EMA stands at 8092.45, further emphasizing that the stock is trading below short-term averages.
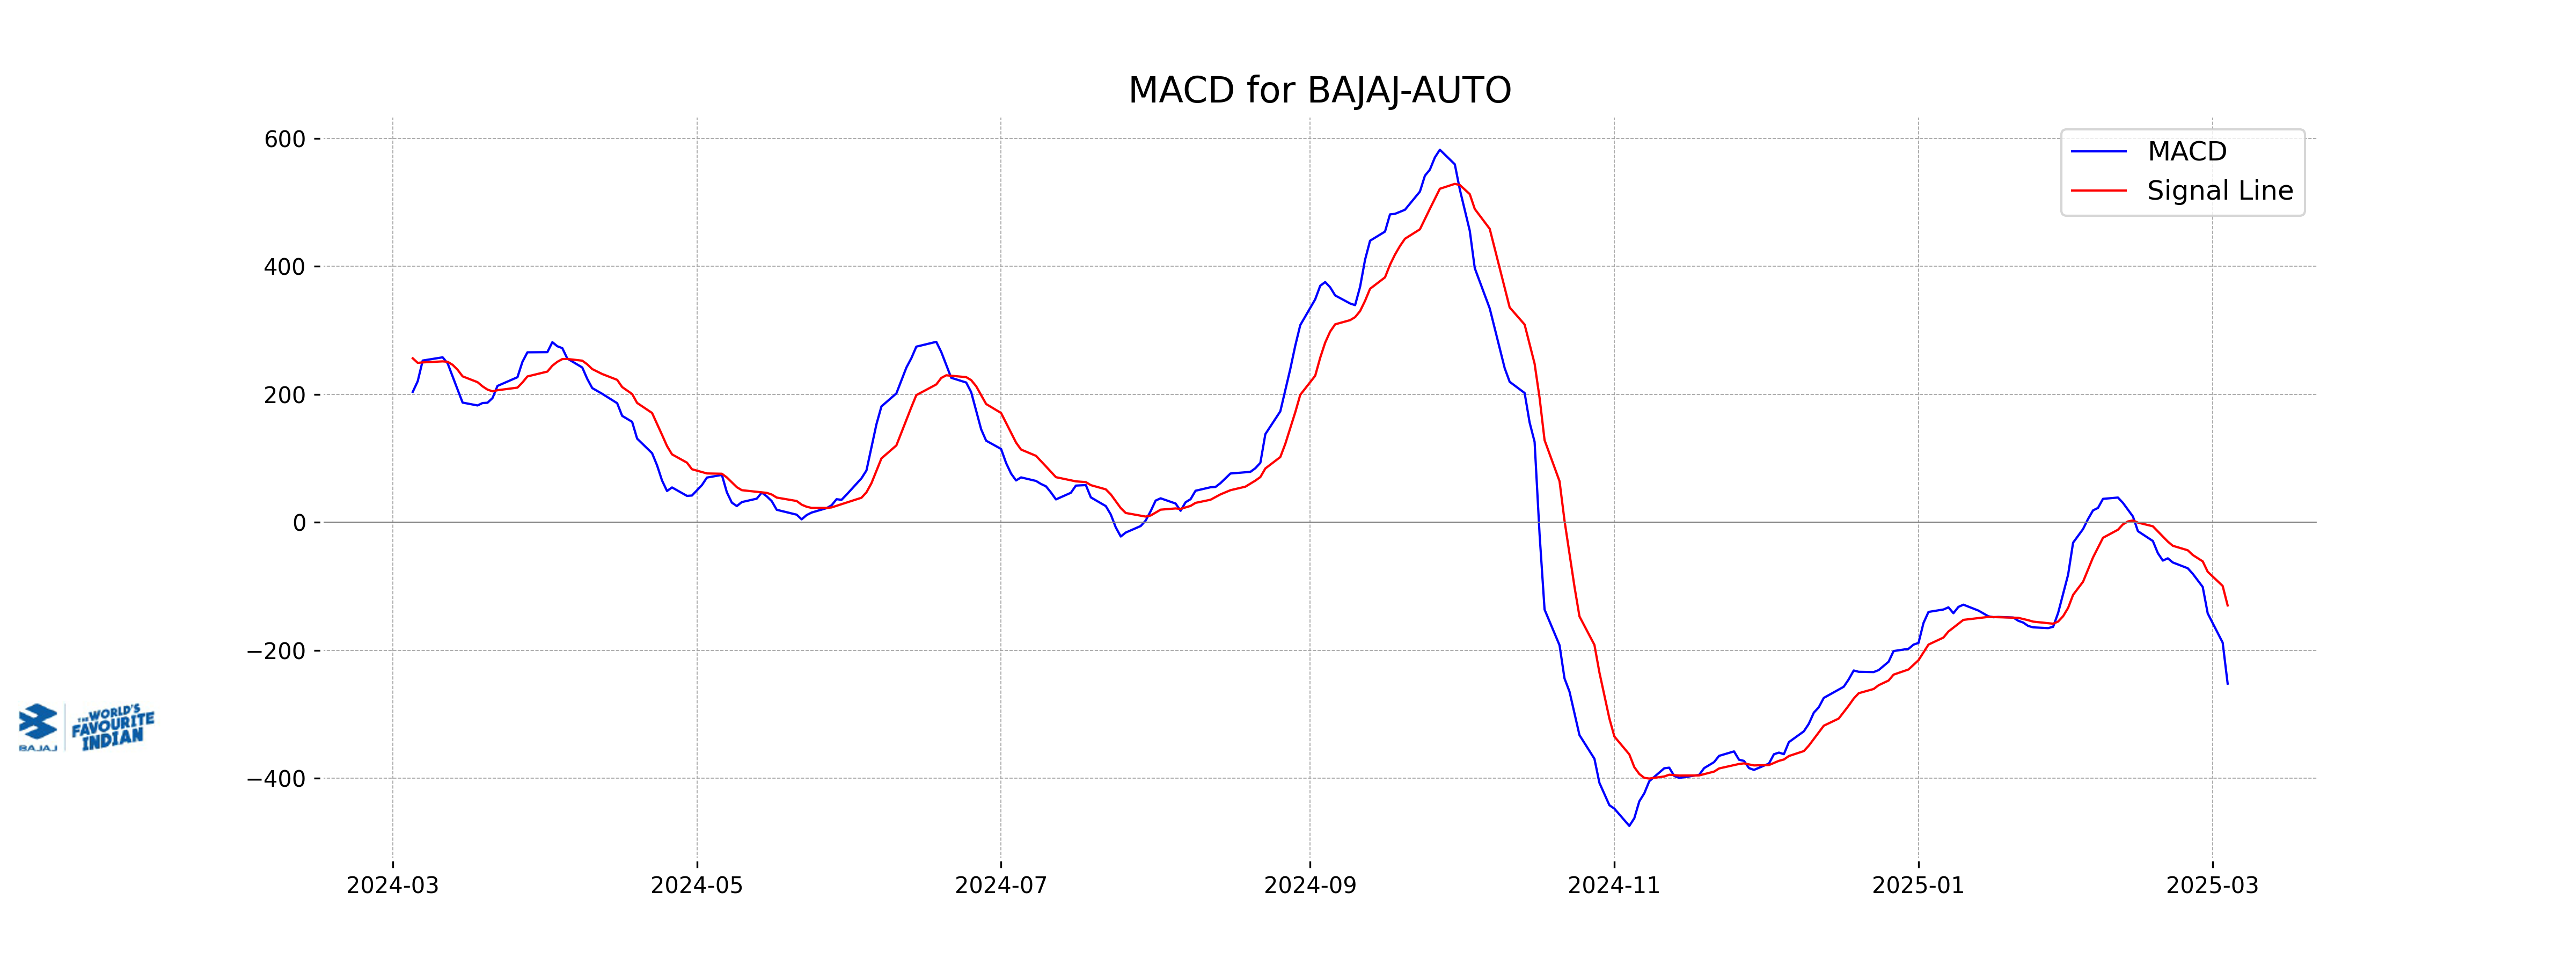
Moving Averages Trend (MACD)
MACD Analysis for Bajaj Auto: The MACD value for Bajaj Auto is currently at -252.25, which is below its signal line of -130.07, indicating a bearish trend. The negative gap between the MACD and its signal suggests potential downward momentum in the short-term price movement.
RSI Analysis
RSI Analysis for Bajaj Auto: The Relative Strength Index (RSI) for Bajaj Auto is currently at 19.03, indicating an oversold condition as it is below 30. This suggests that the stock may be undervalued in the short term, and a potential reversal or upward movement might be anticipated.
Analysis for Bajaj Finserv - March 04, 2025
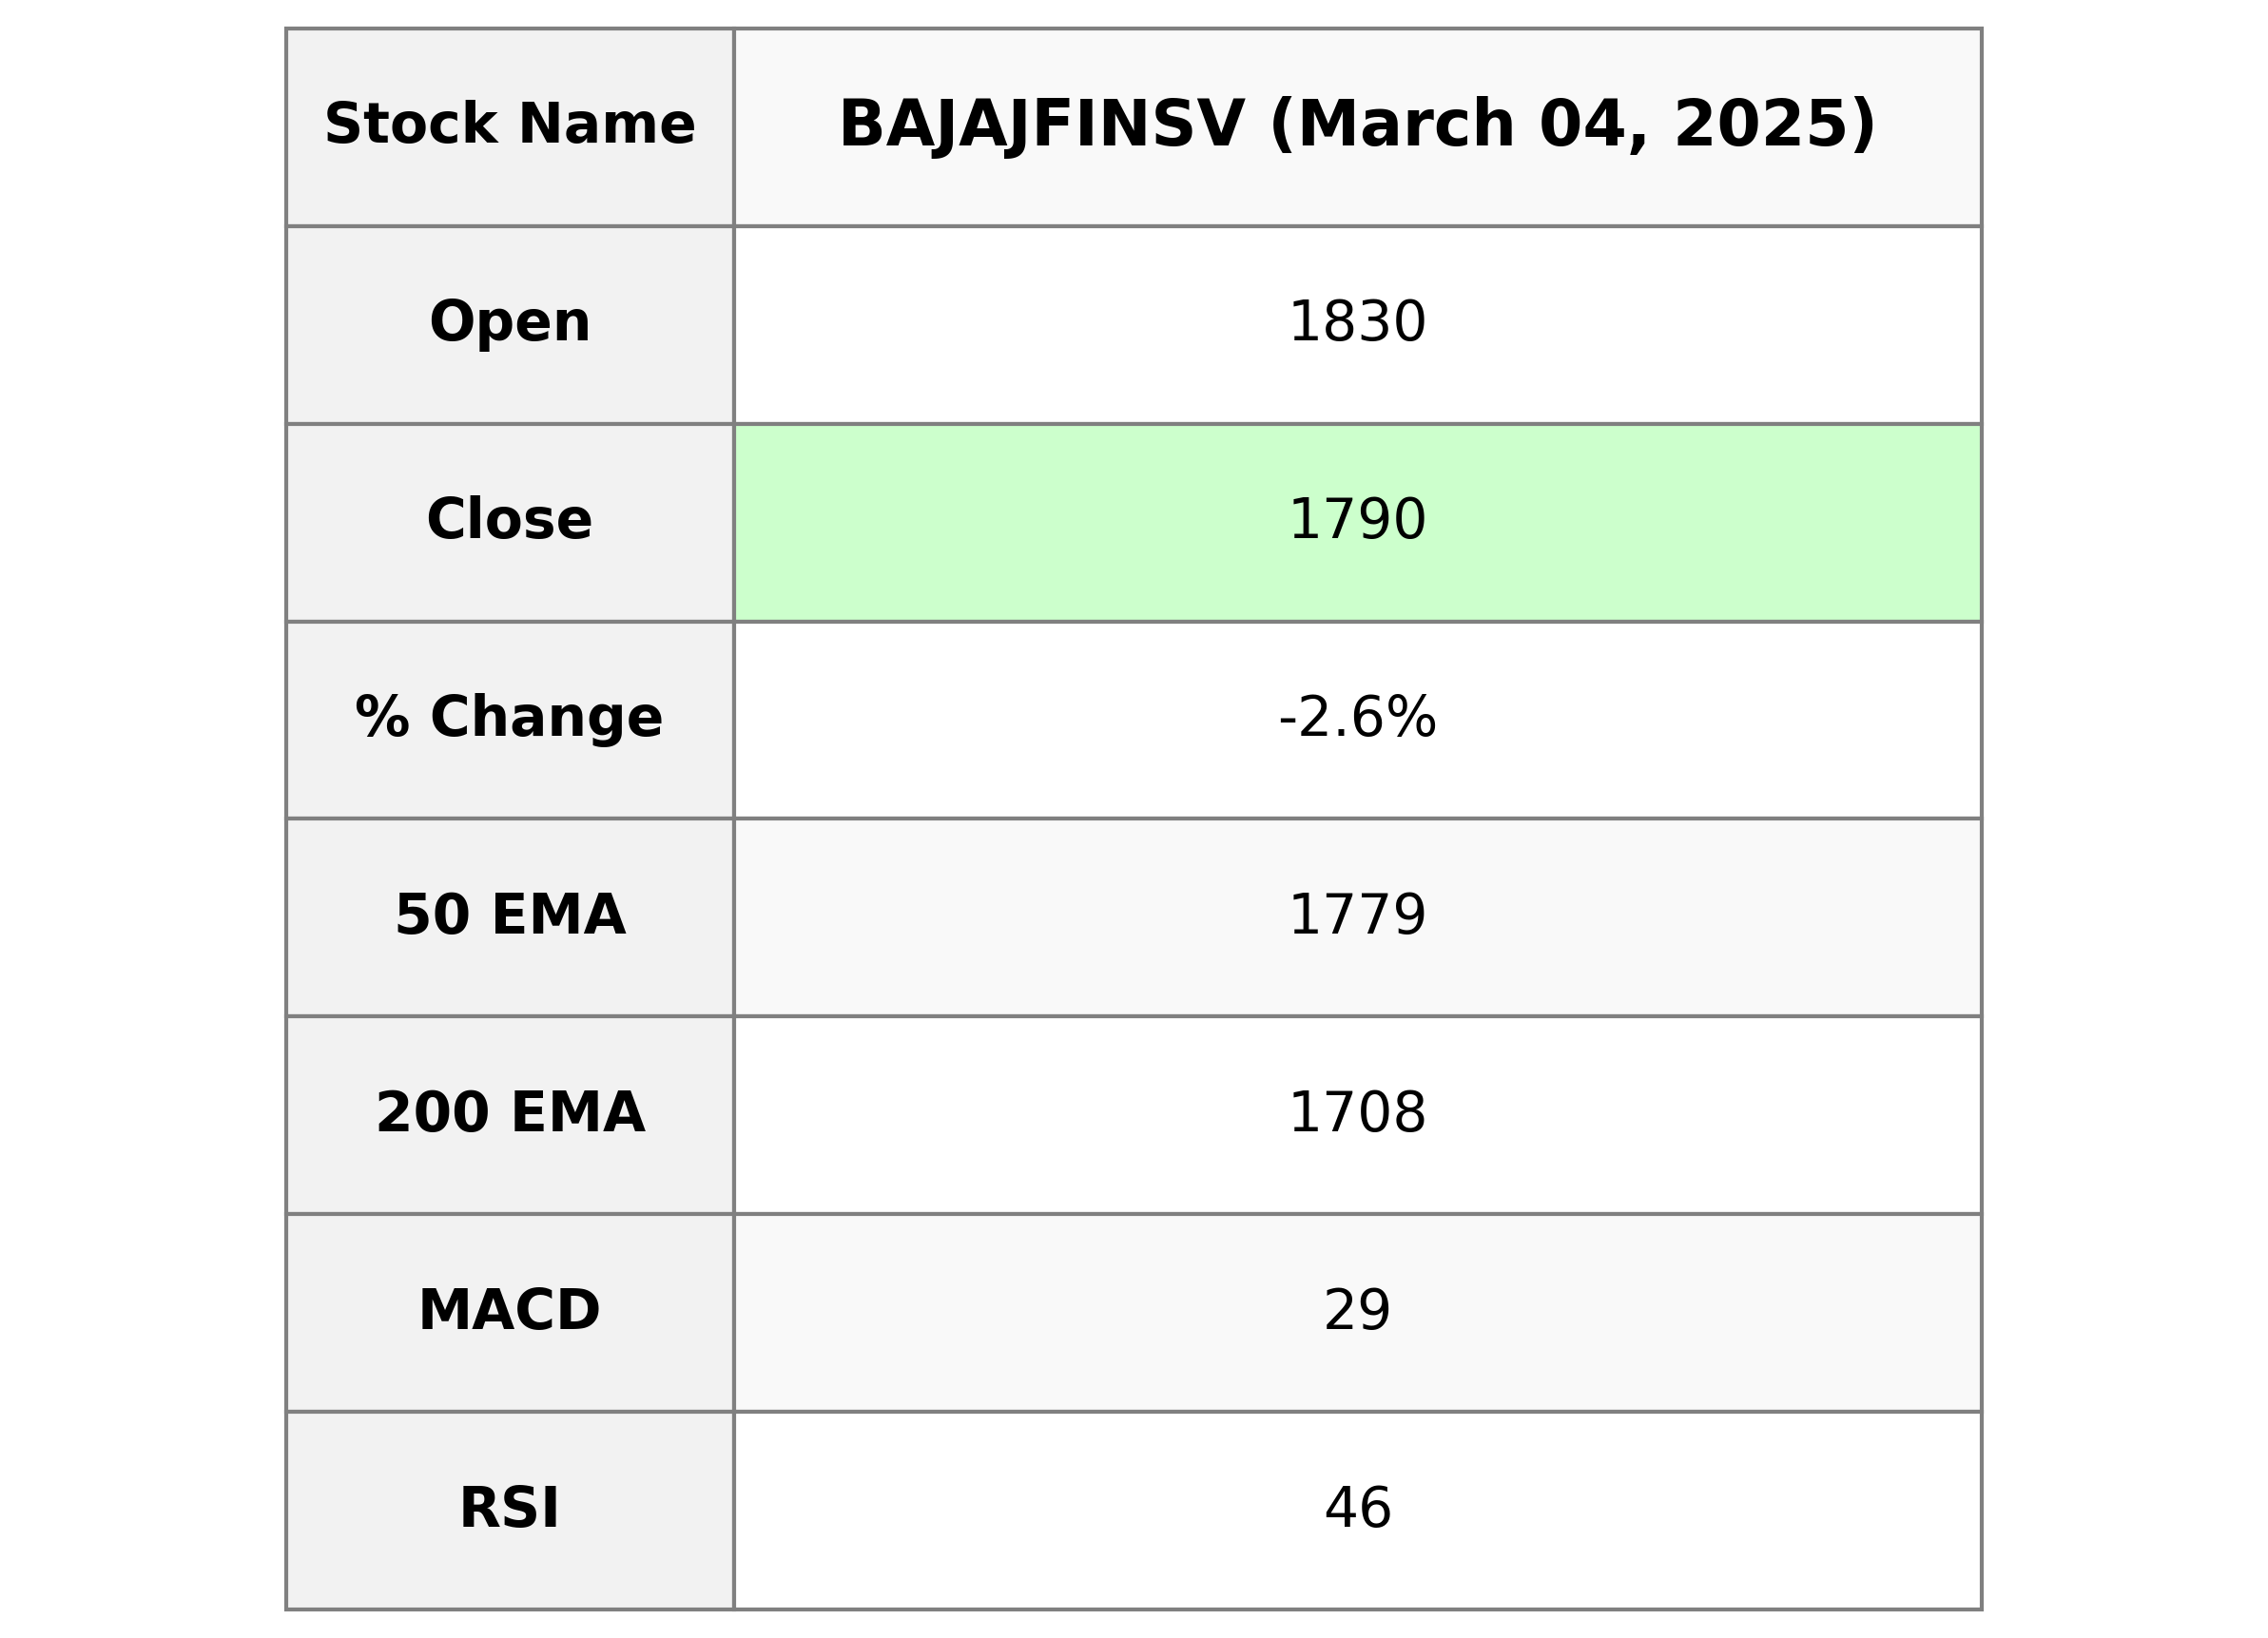
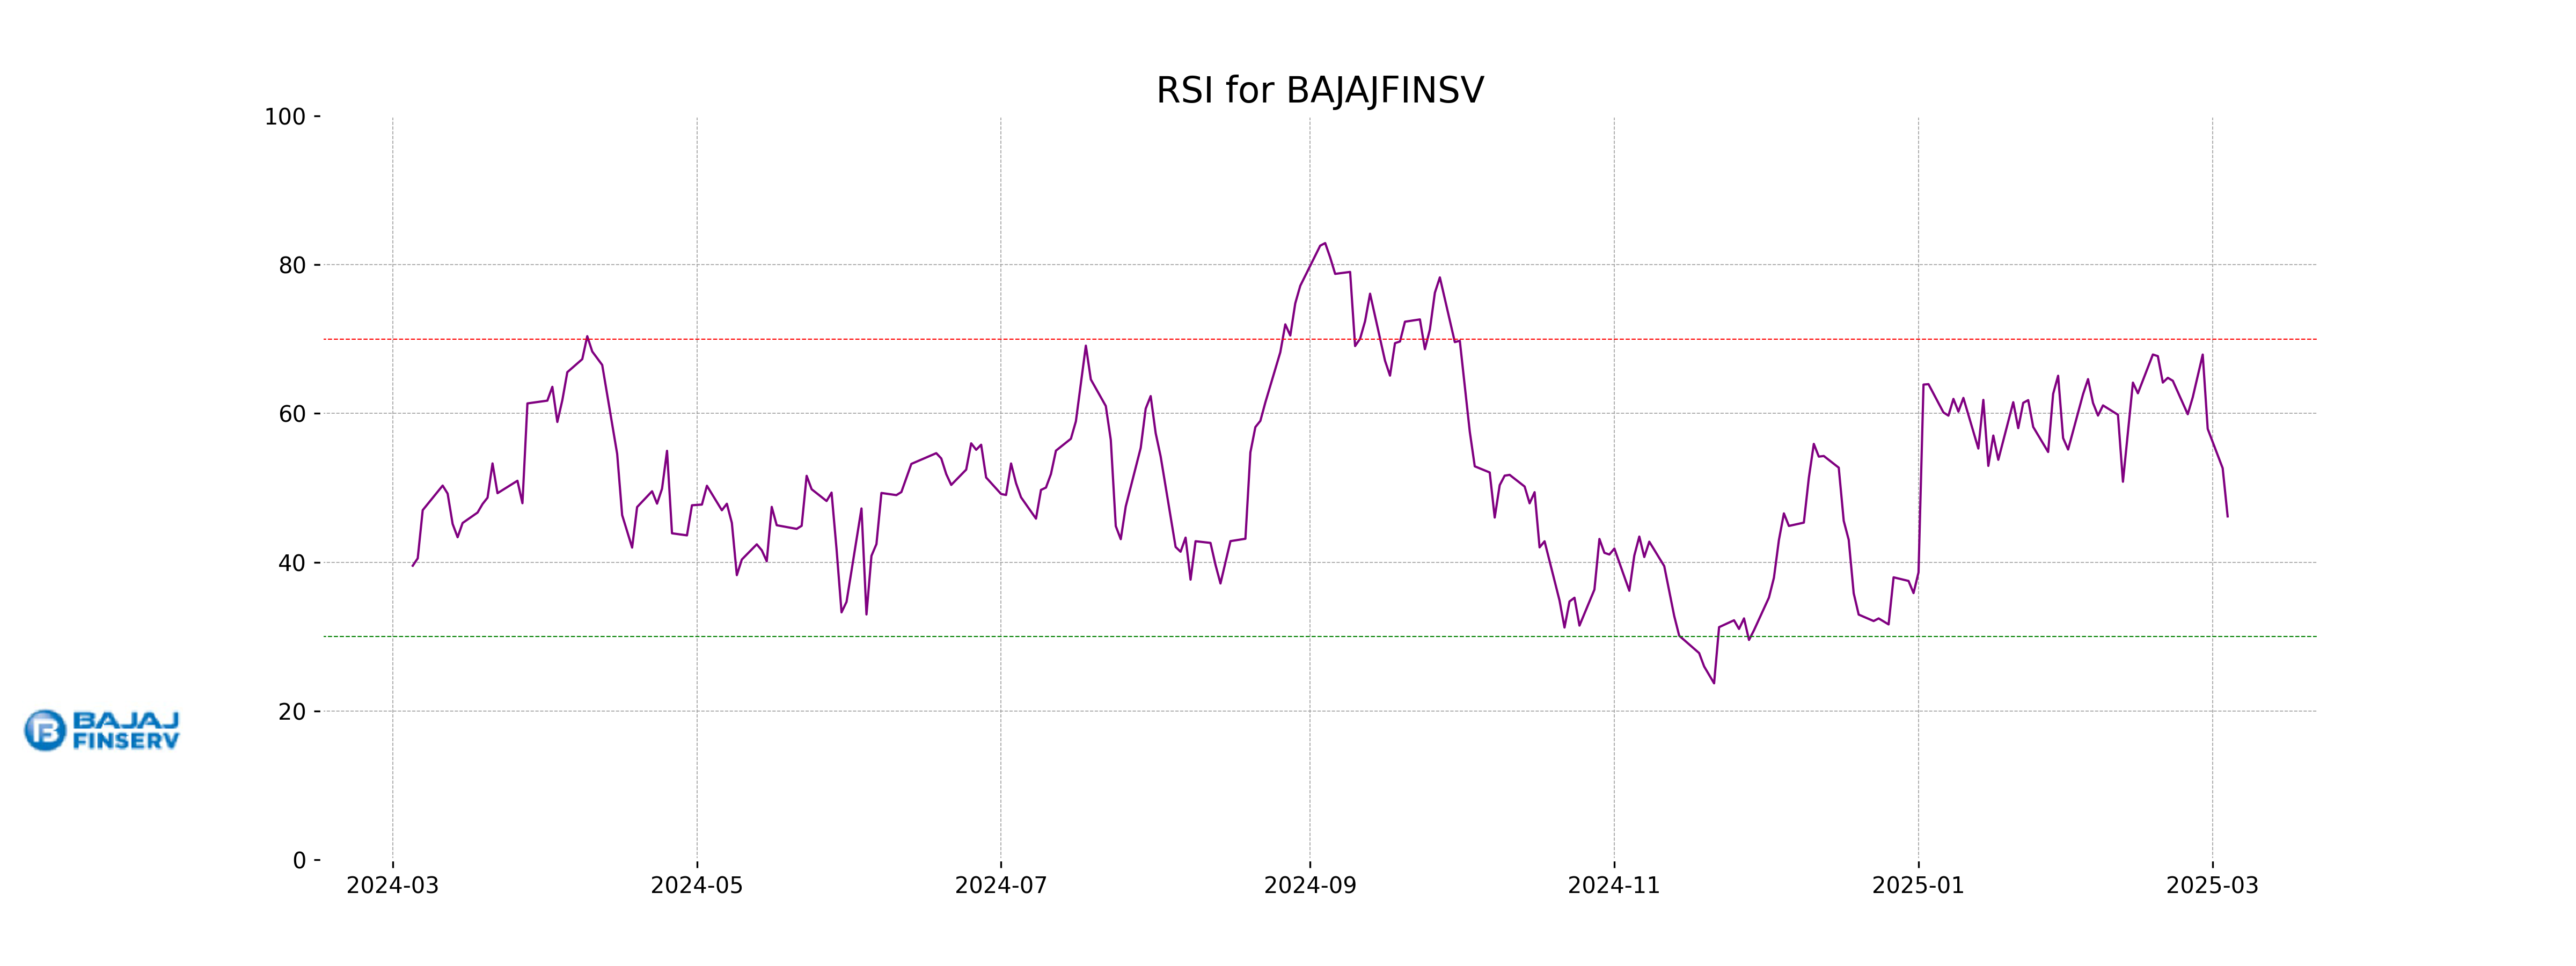
Bajaj Finserv experienced a decline with a closing price of 1790.30, falling by -2.62% from its previous close of 1838.55. The stock's movement is below its short-term exponential moving averages but above the 50-day and 200-day EMAs, suggesting mixed momentum. With a market cap of ₹2.91 trillion, the financial services firm holds a PE ratio of 33.67 and EPS of 53.17.
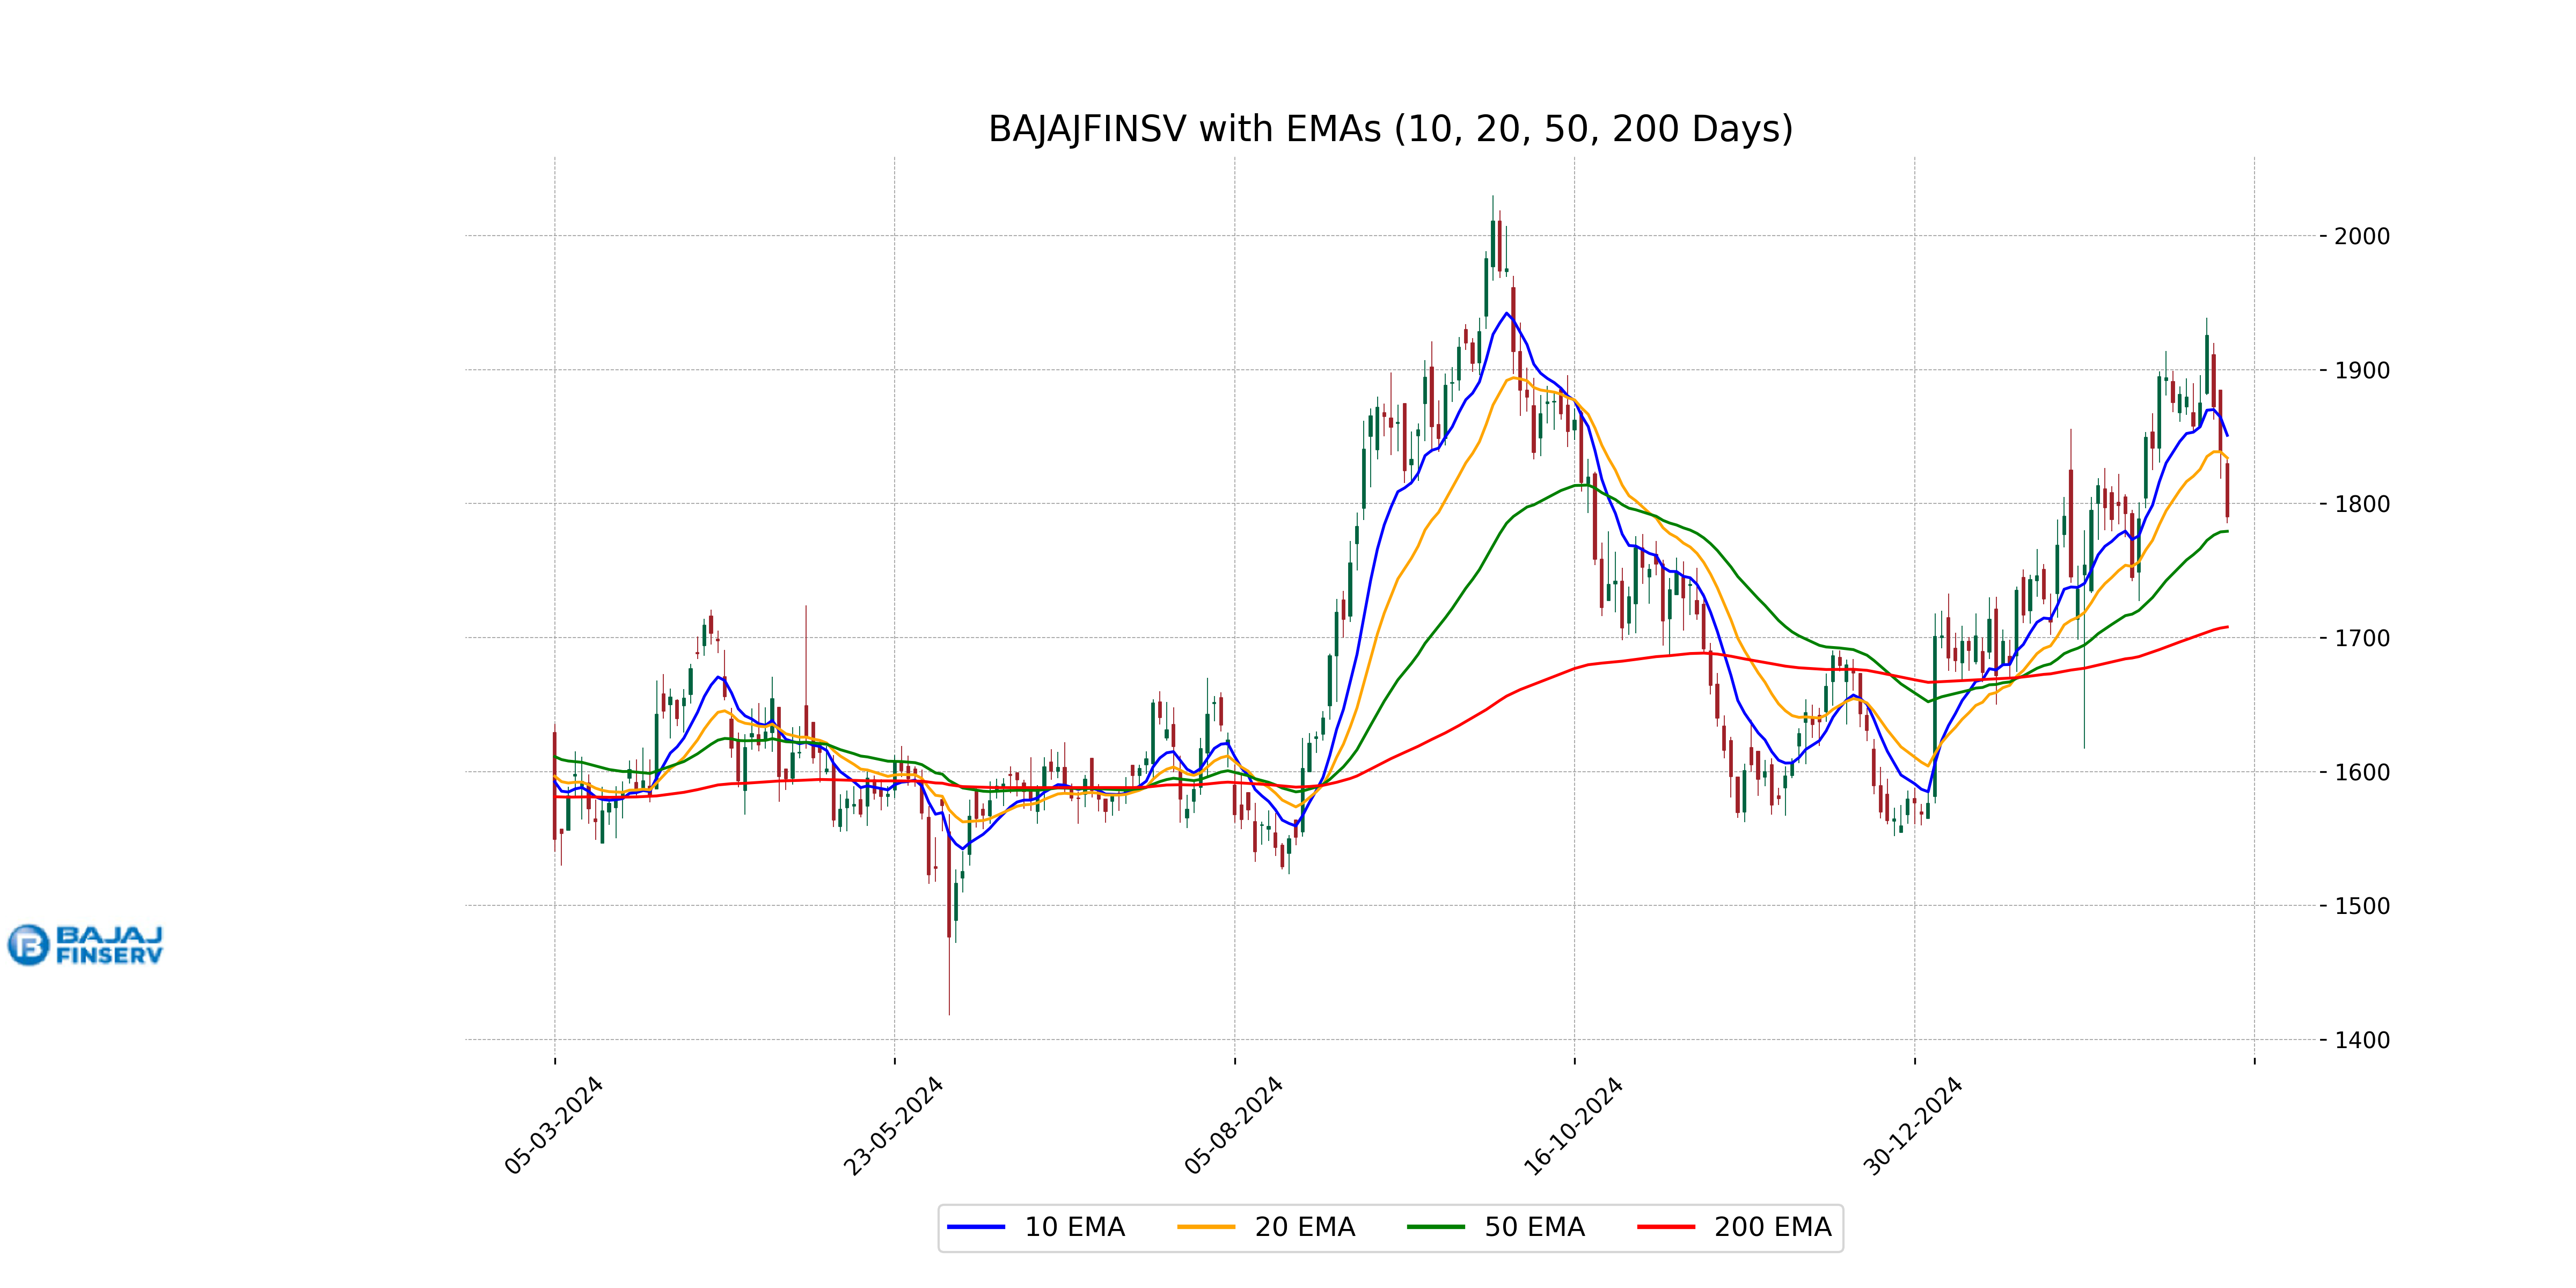
Relationship with Key Moving Averages
Bajaj Finserv's current close of 1790.3 is above its 50-day EMA of 1779.31 but below its 10-day EMA of 1850.93 and 20-day EMA of 1834.05, indicating recent bearish momentum. The stock is still above its long-term 200-day EMA of 1707.91, suggesting overall strength in the longer term despite short-term weakness.
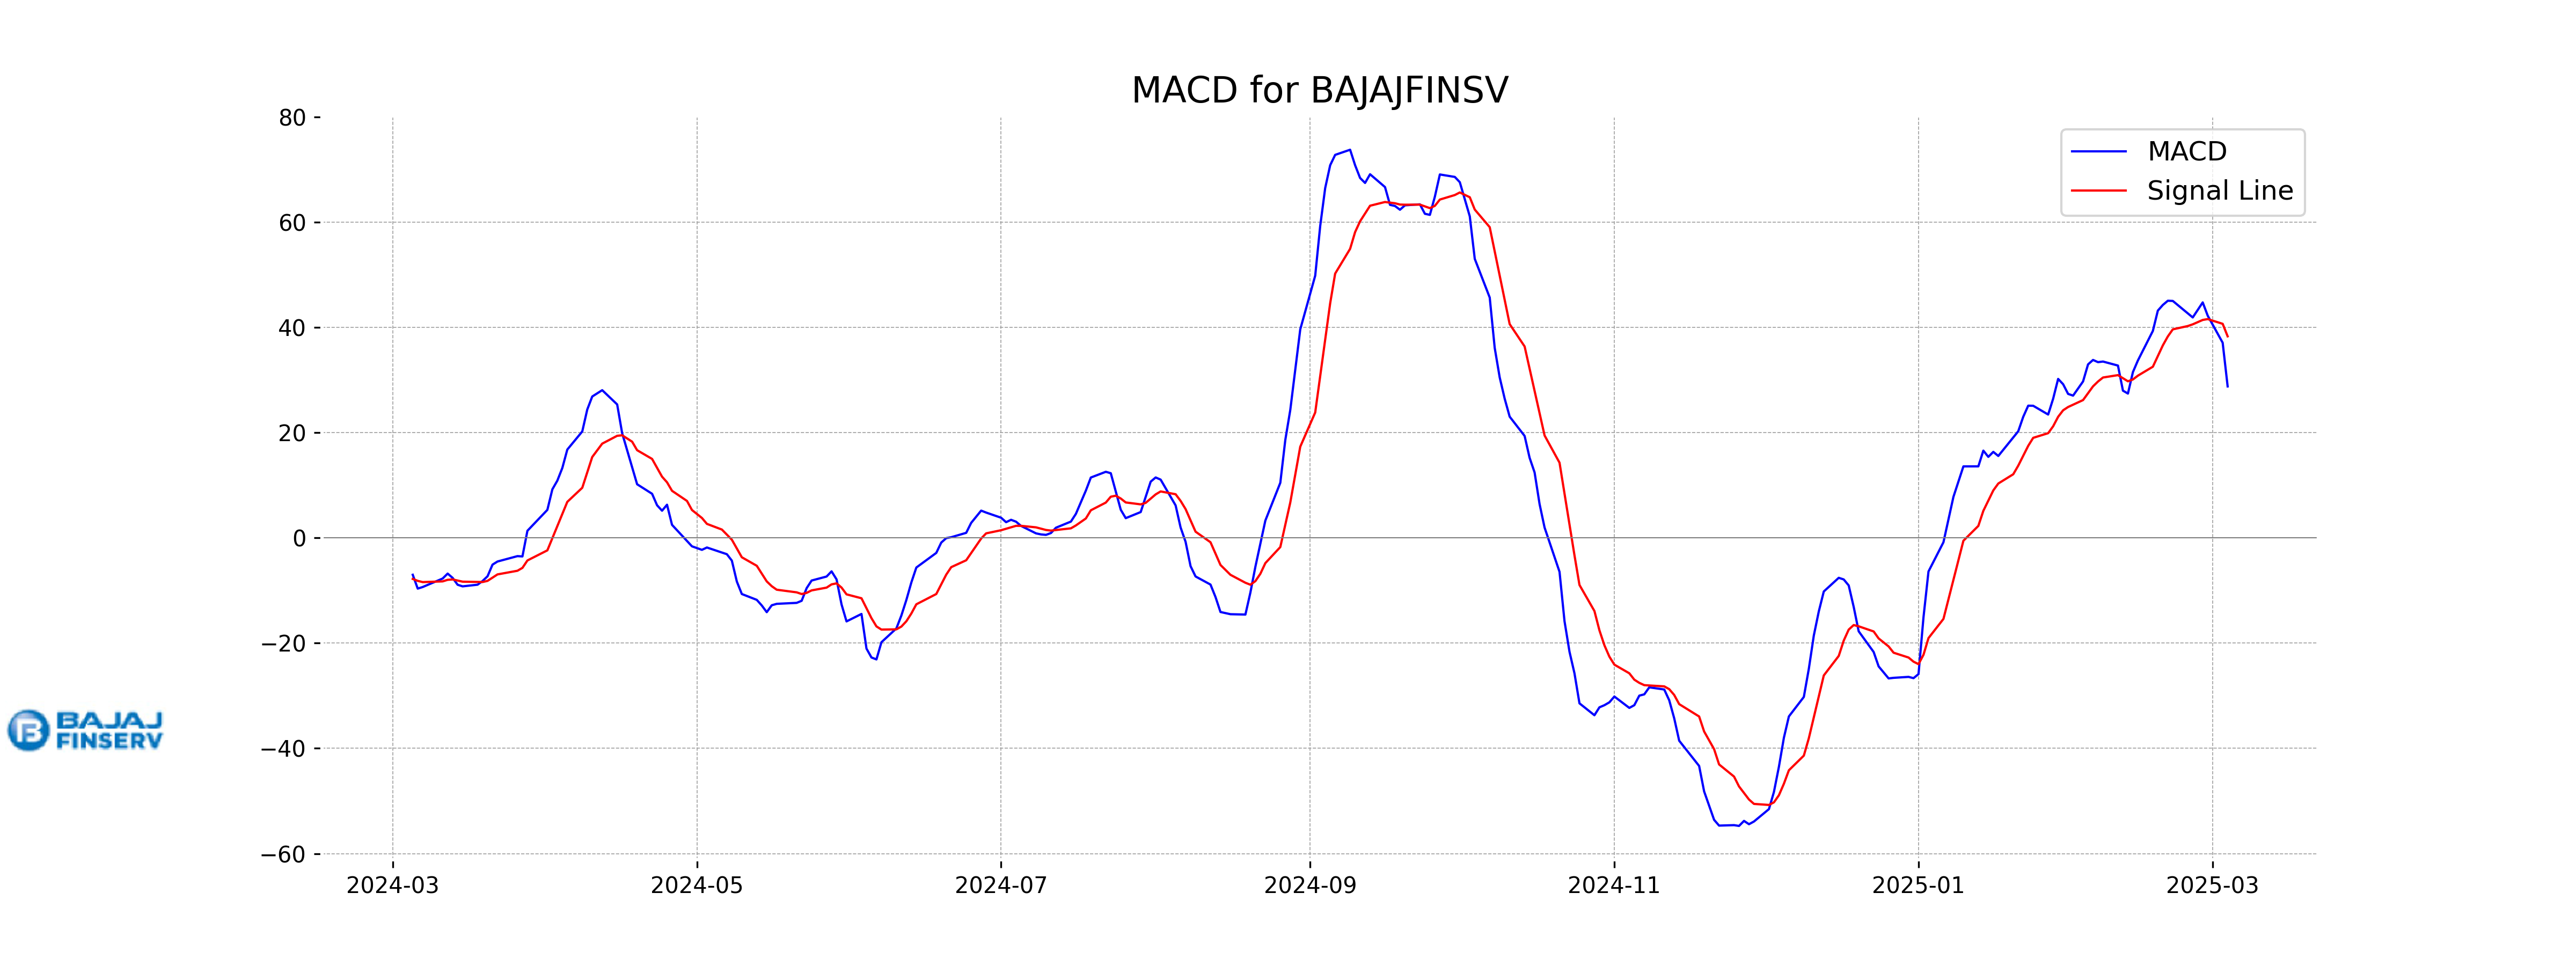
Moving Averages Trend (MACD)
Bajaj Finserv's MACD line is currently at 28.77, which is below its MACD Signal line at 38.29. This indicates a bearish signal, suggesting potential downward momentum in the short term. The RSI of 46.16 also suggests that the stock is neither overbought nor oversold.
RSI Analysis
RSI Analysis for Bajaj Finserv: The Relative Strength Index (RSI) for Bajaj Finserv is 46.16, which indicates that the stock is in the neutral zone and neither overbought nor oversold. Typically, an RSI below 30 suggests oversold conditions, while above 70 suggests overbought conditions. Hence, Bajaj Finserv's RSI suggests a balance in buying and selling pressures.
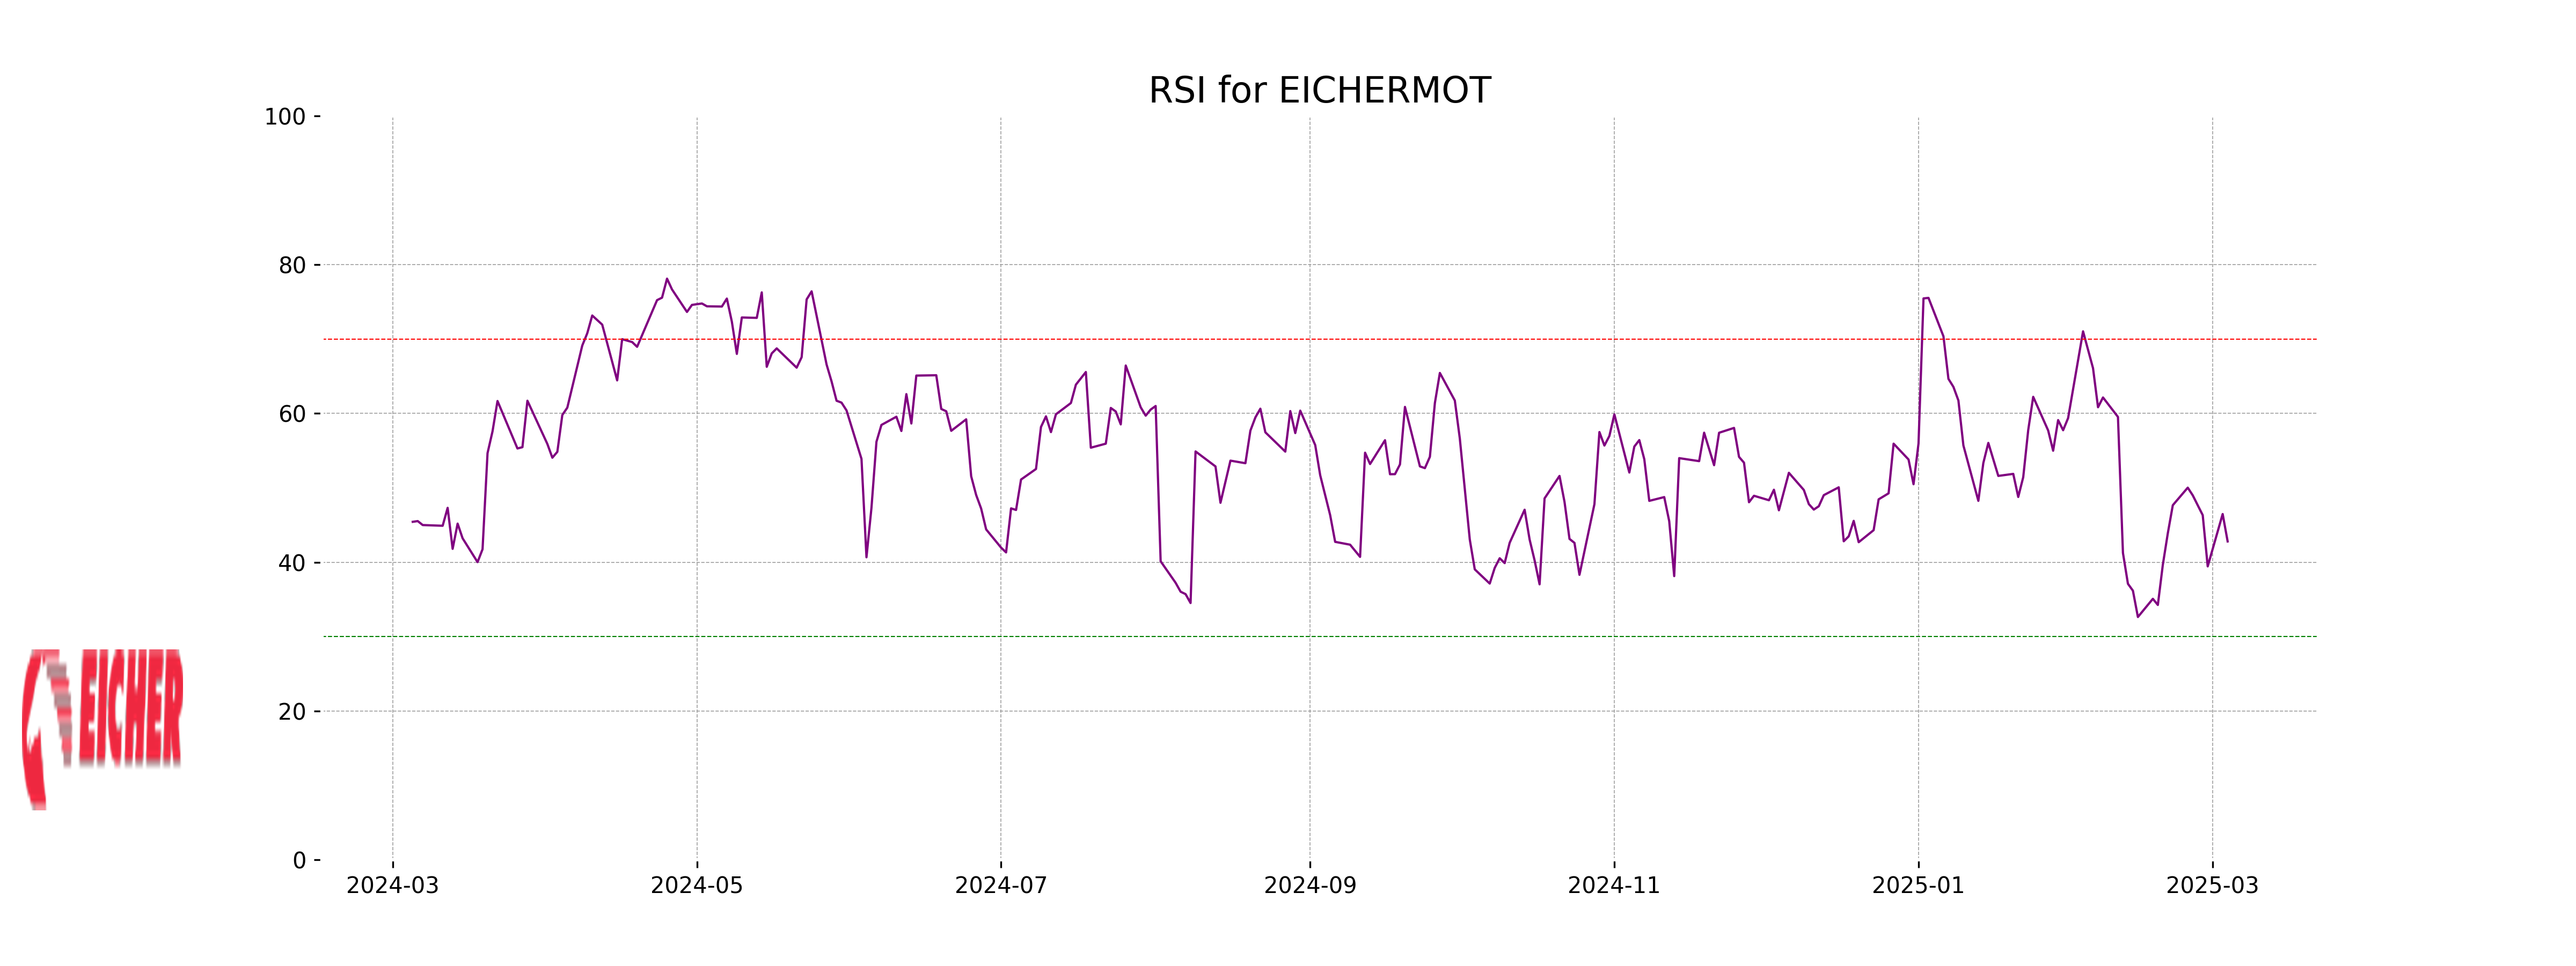
Analysis for Eicher Motors - March 04, 2025
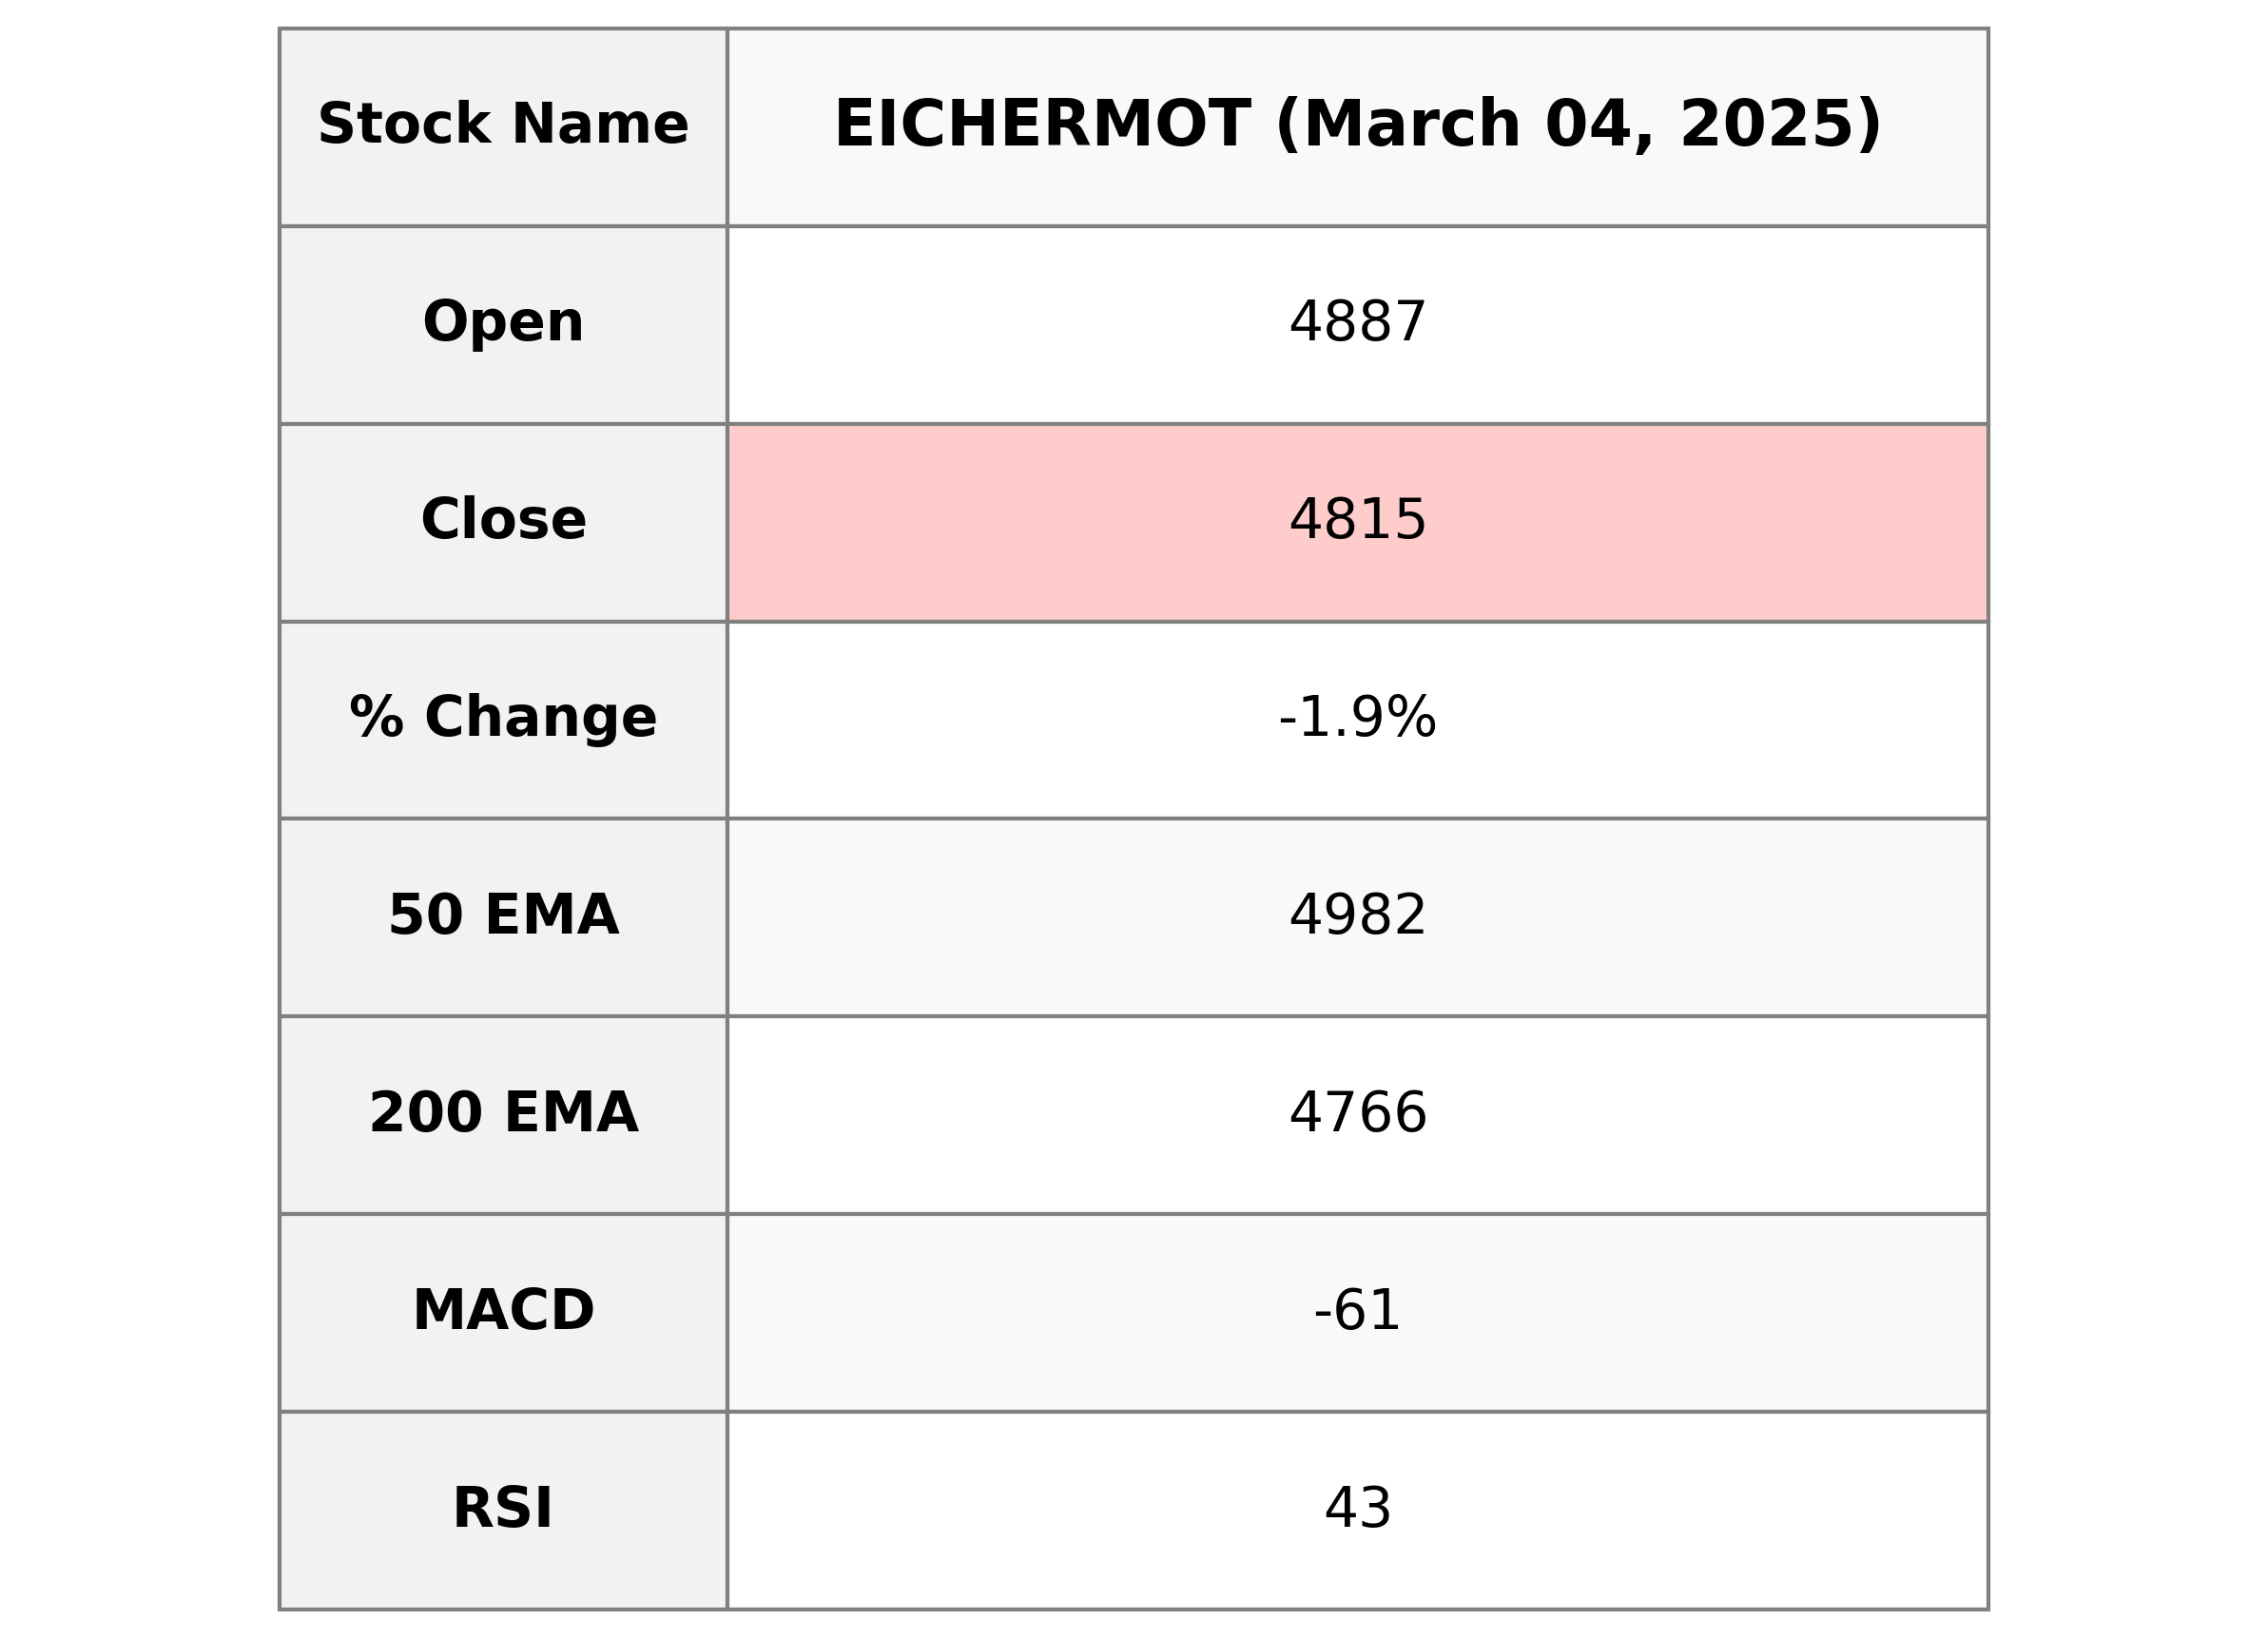
Eicher Motors Performance Summary: Eicher Motors witnessed a decrease in its stock price, closing at 4815.10 compared to the previous close of 4906.60, marking a percentage change of -1.8%. The company operates in the Consumer Cyclical sector, specifically within the Auto Manufacturers industry in India, and currently has a market cap of 1,320,059,797,504 INR. With a PE ratio of 28.95 and EPS of 166.33, the stock shows an RSI of 42.79, indicating potential undervaluation, while its MACD of -61.43 reflects downward momentum in stock price movement.
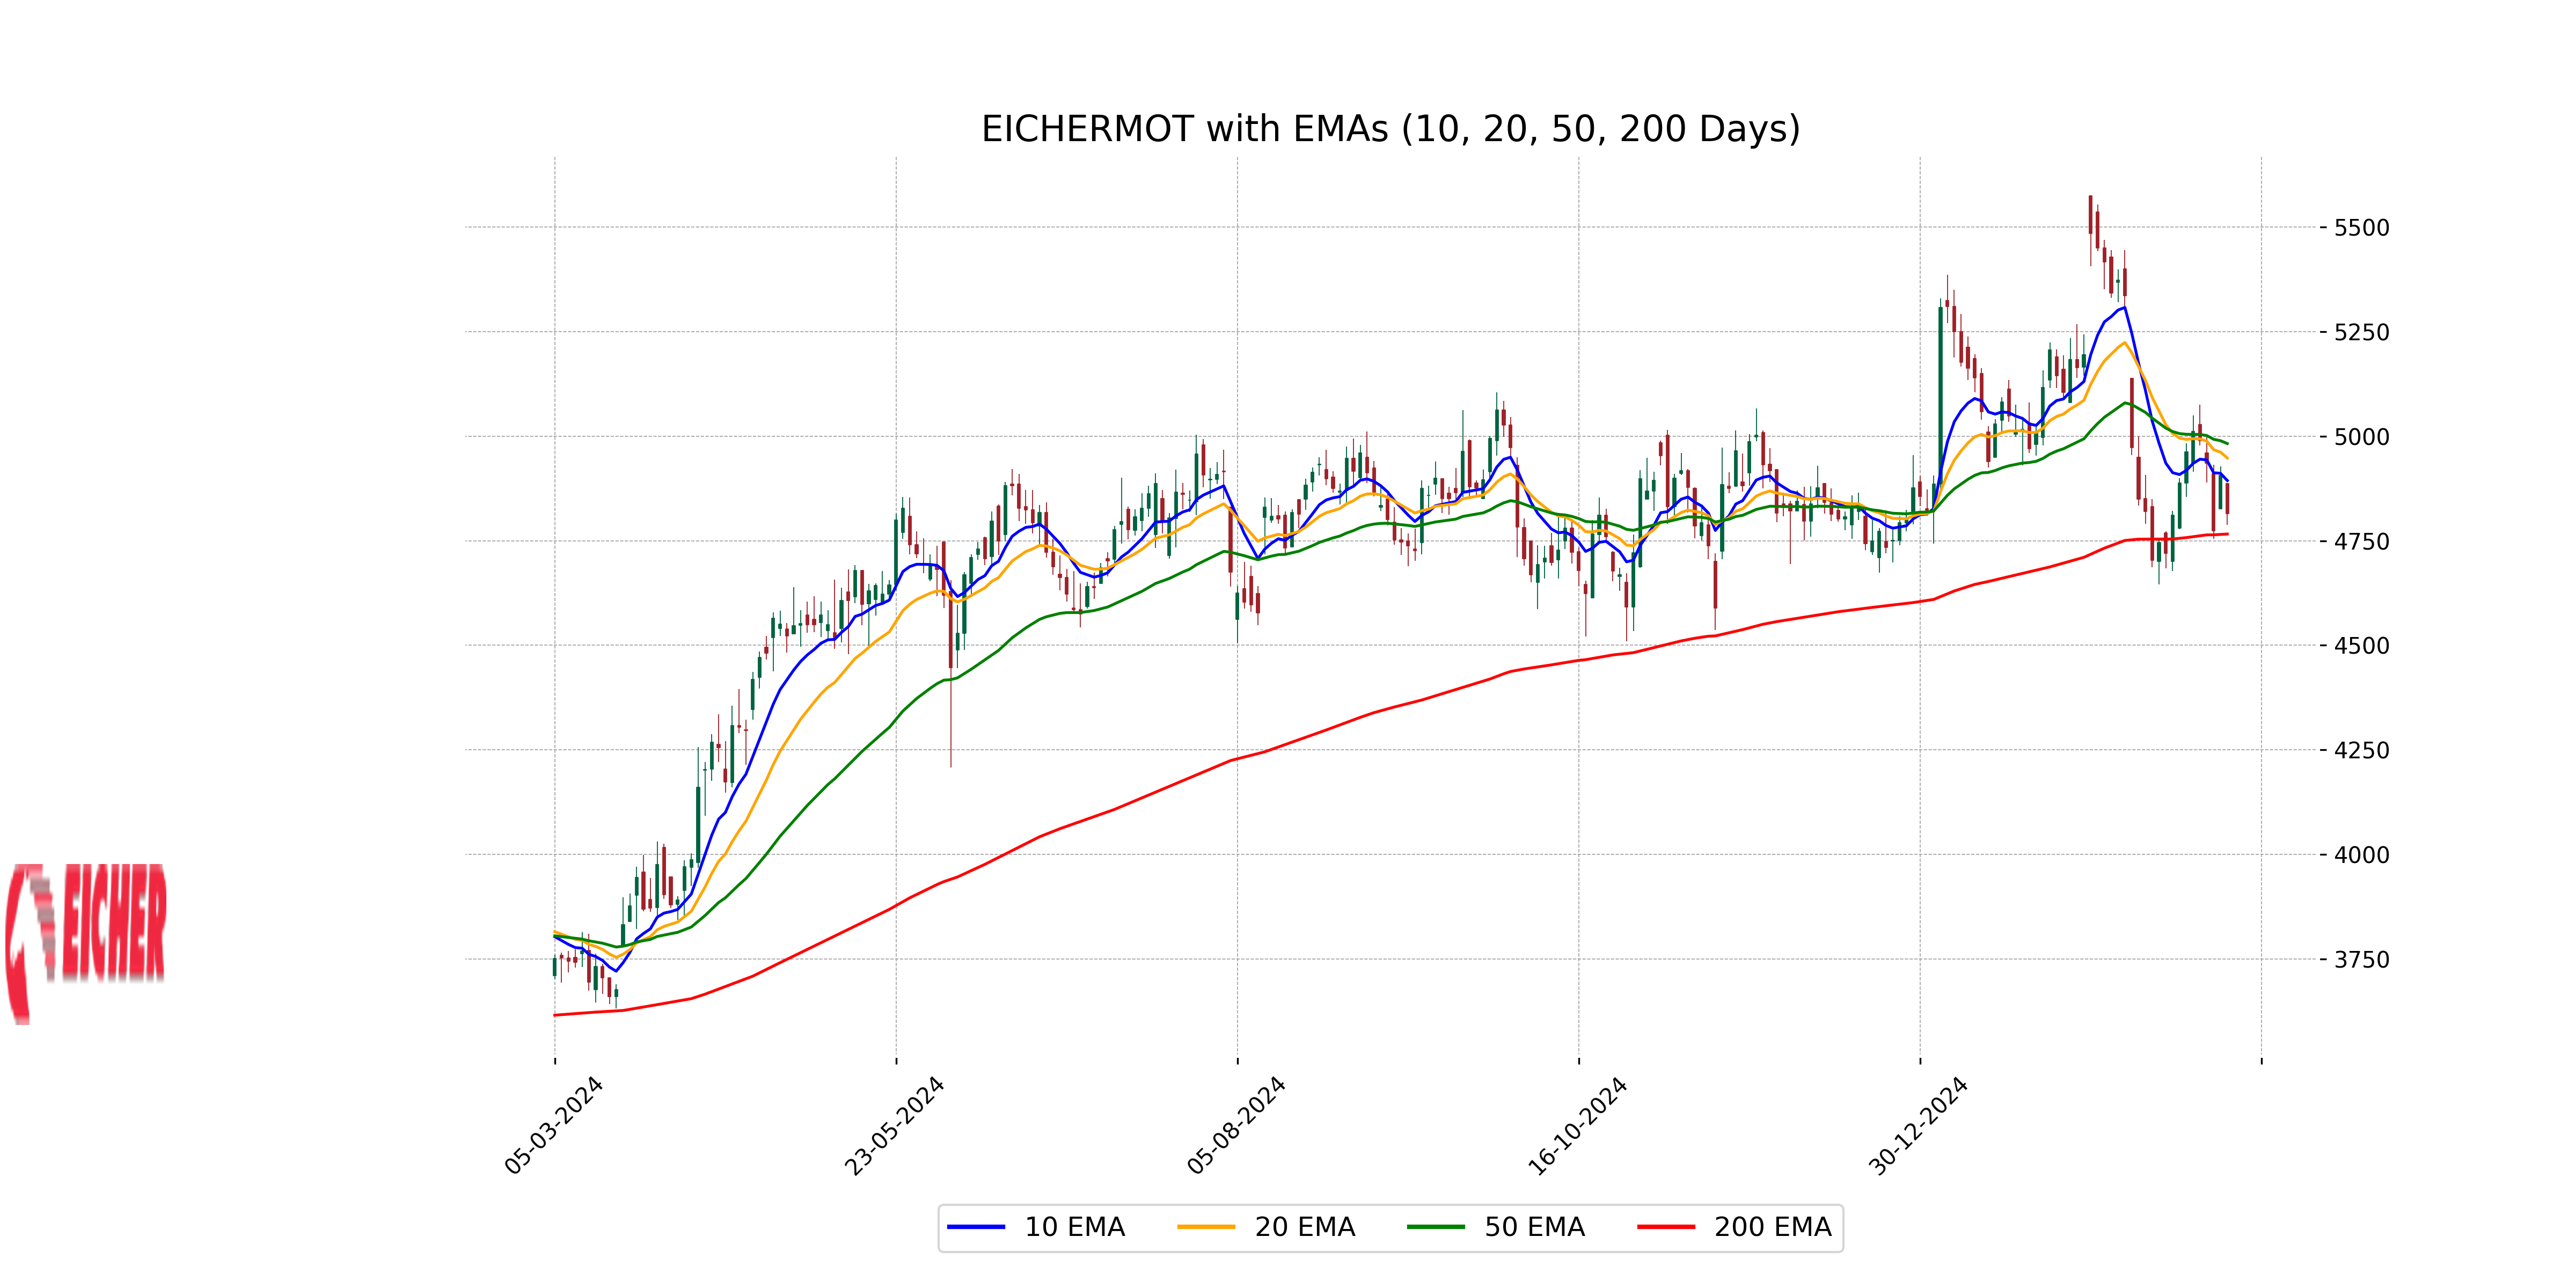
Relationship with Key Moving Averages
For Eicher Motors, the close price of 4815.10 is below the 50-day EMA of 4982.34 and the 10-day EMA of 4893.83, indicating short-term bearish momentum. However, it remains above the 200-day EMA of 4765.96, which suggests a potential support level in the longer-term trend.
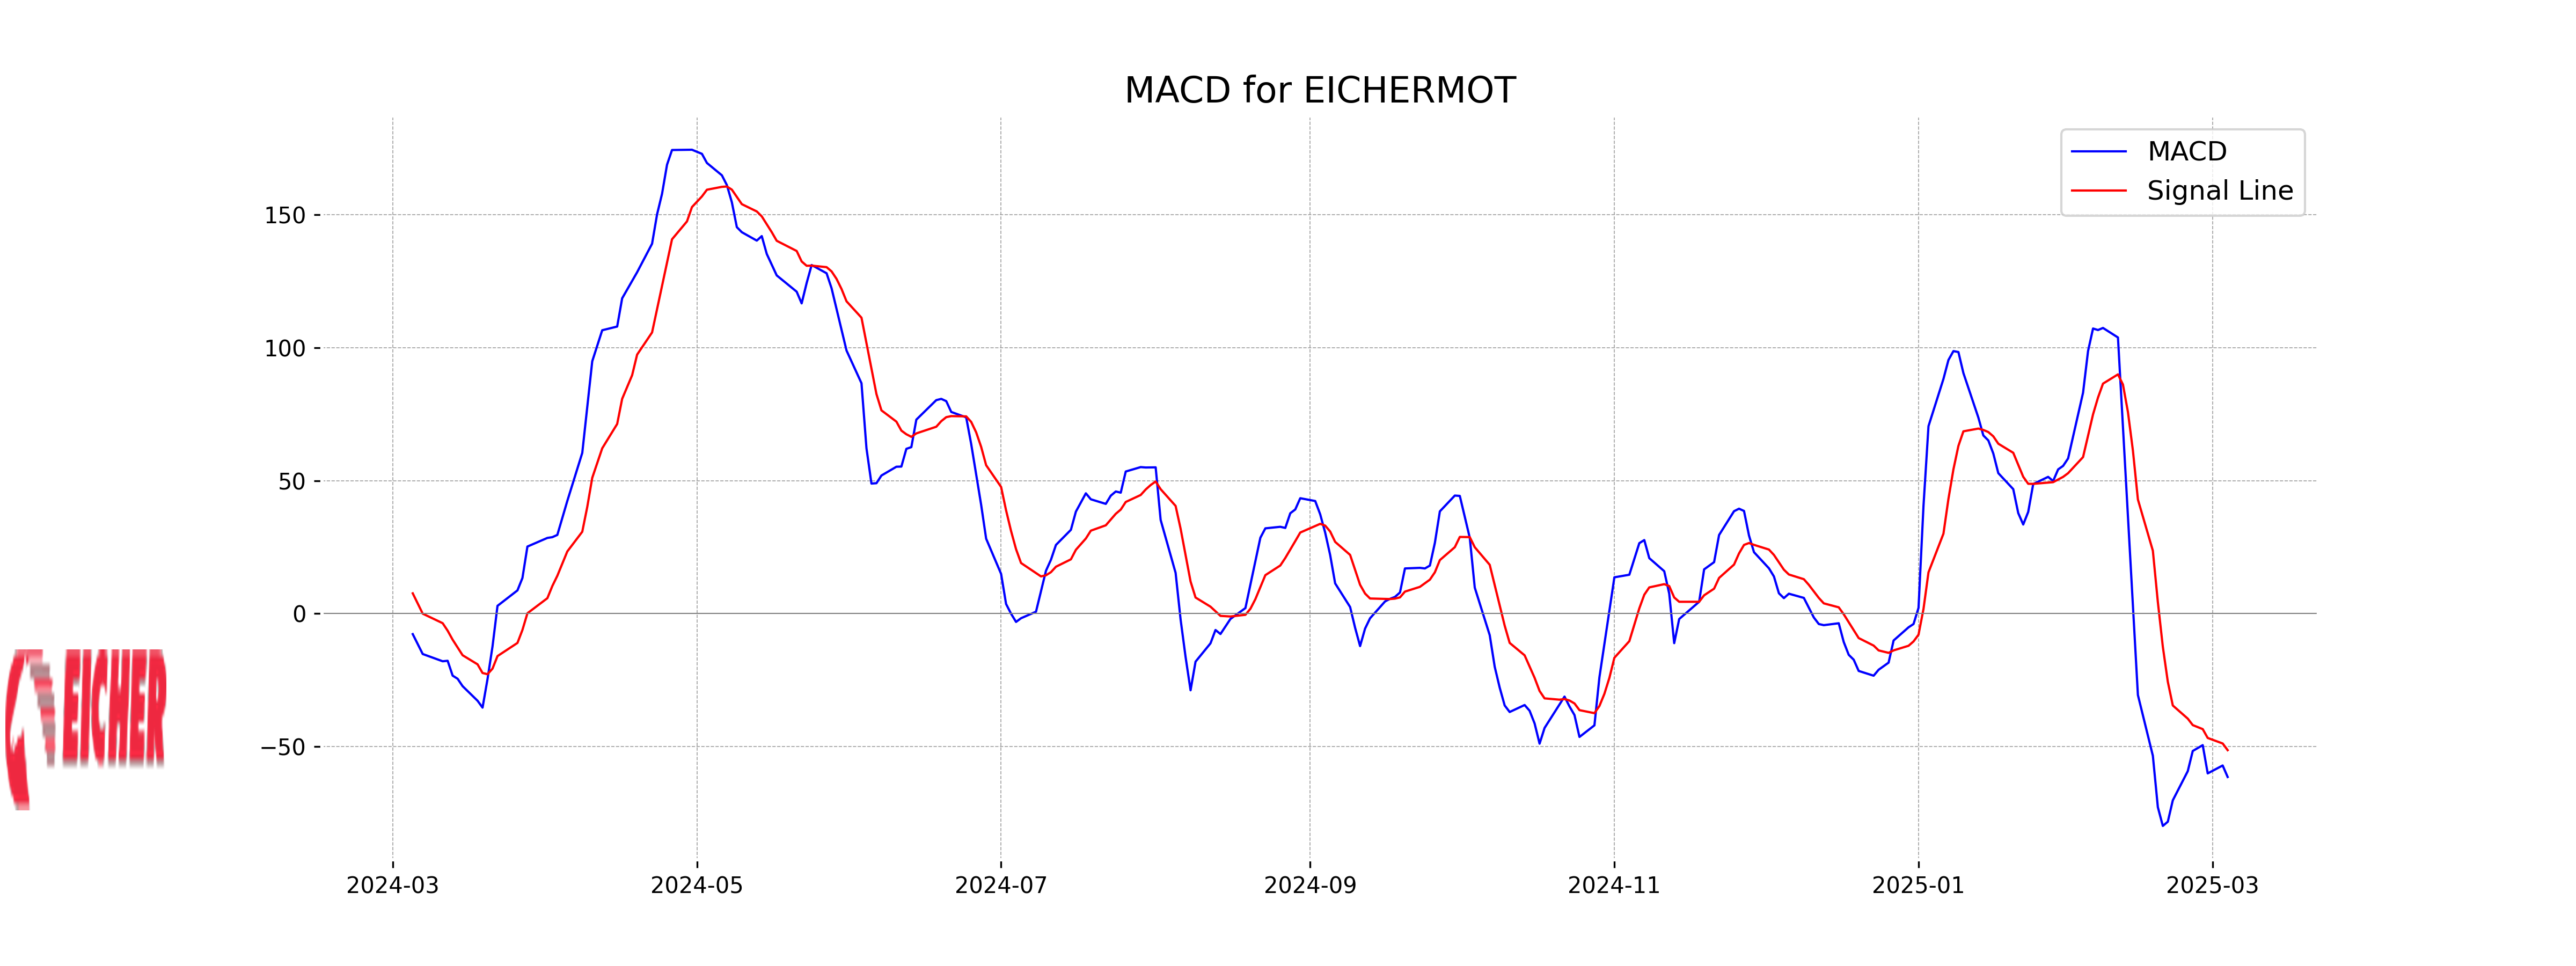
Moving Averages Trend (MACD)
Eicher Motors exhibits a bearish trend as suggested by the MACD analysis. The MACD value of -61.43 is below the signal line of -51.34, indicating potential continued downward momentum. The negative MACD crossover suggests selling pressure in the short term.
RSI Analysis
Eicher Motors' Relative Strength Index (RSI) is currently at 42.79, indicating that the stock is neither overbought nor oversold. This mid-range RSI suggests a balanced market sentiment, with no strong momentum in a particular direction. Traders may consider this as a signal of potential consolidation.
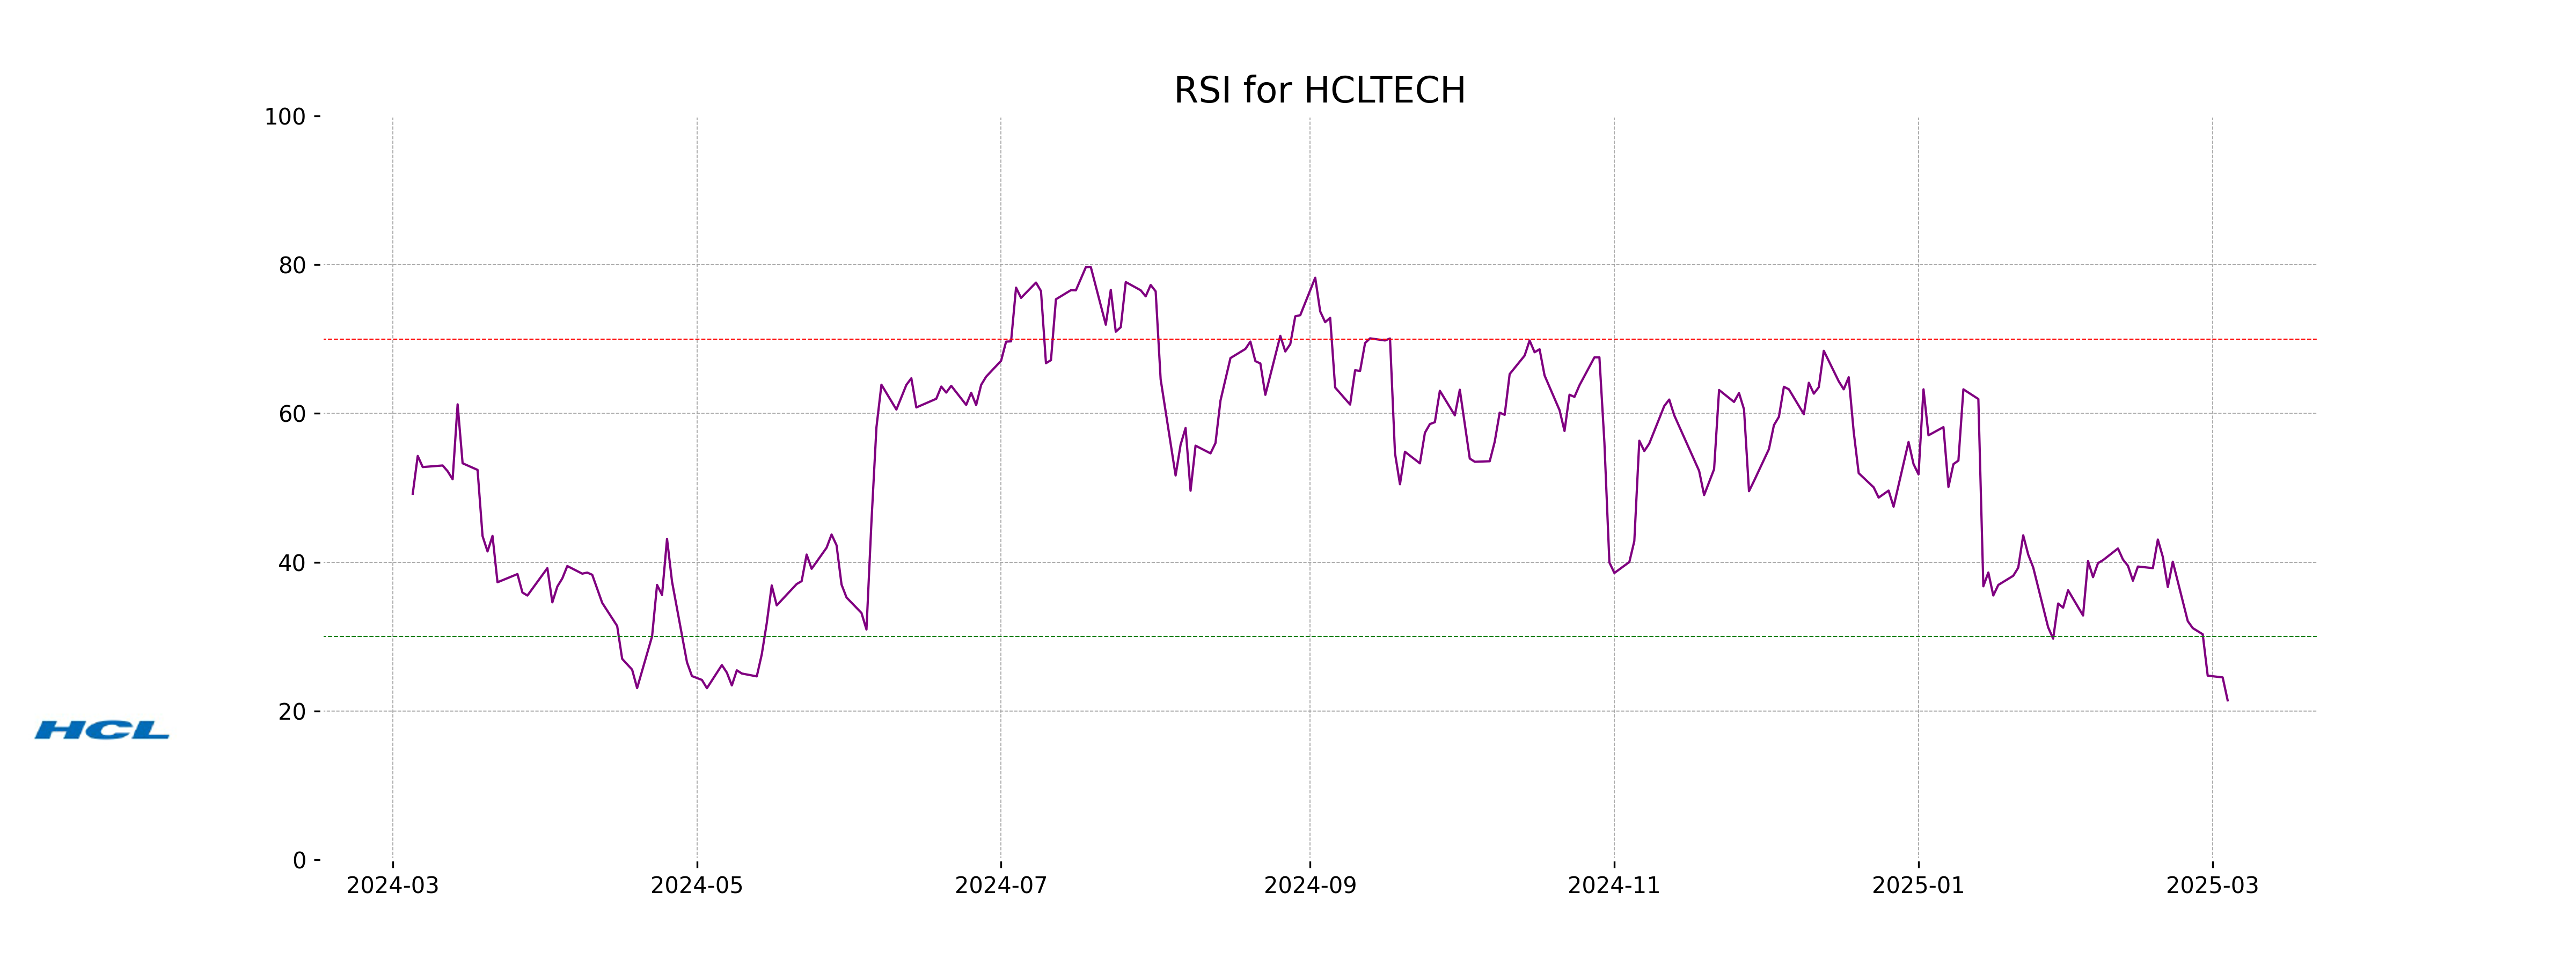
Analysis for HCL Technologies - March 04, 2025
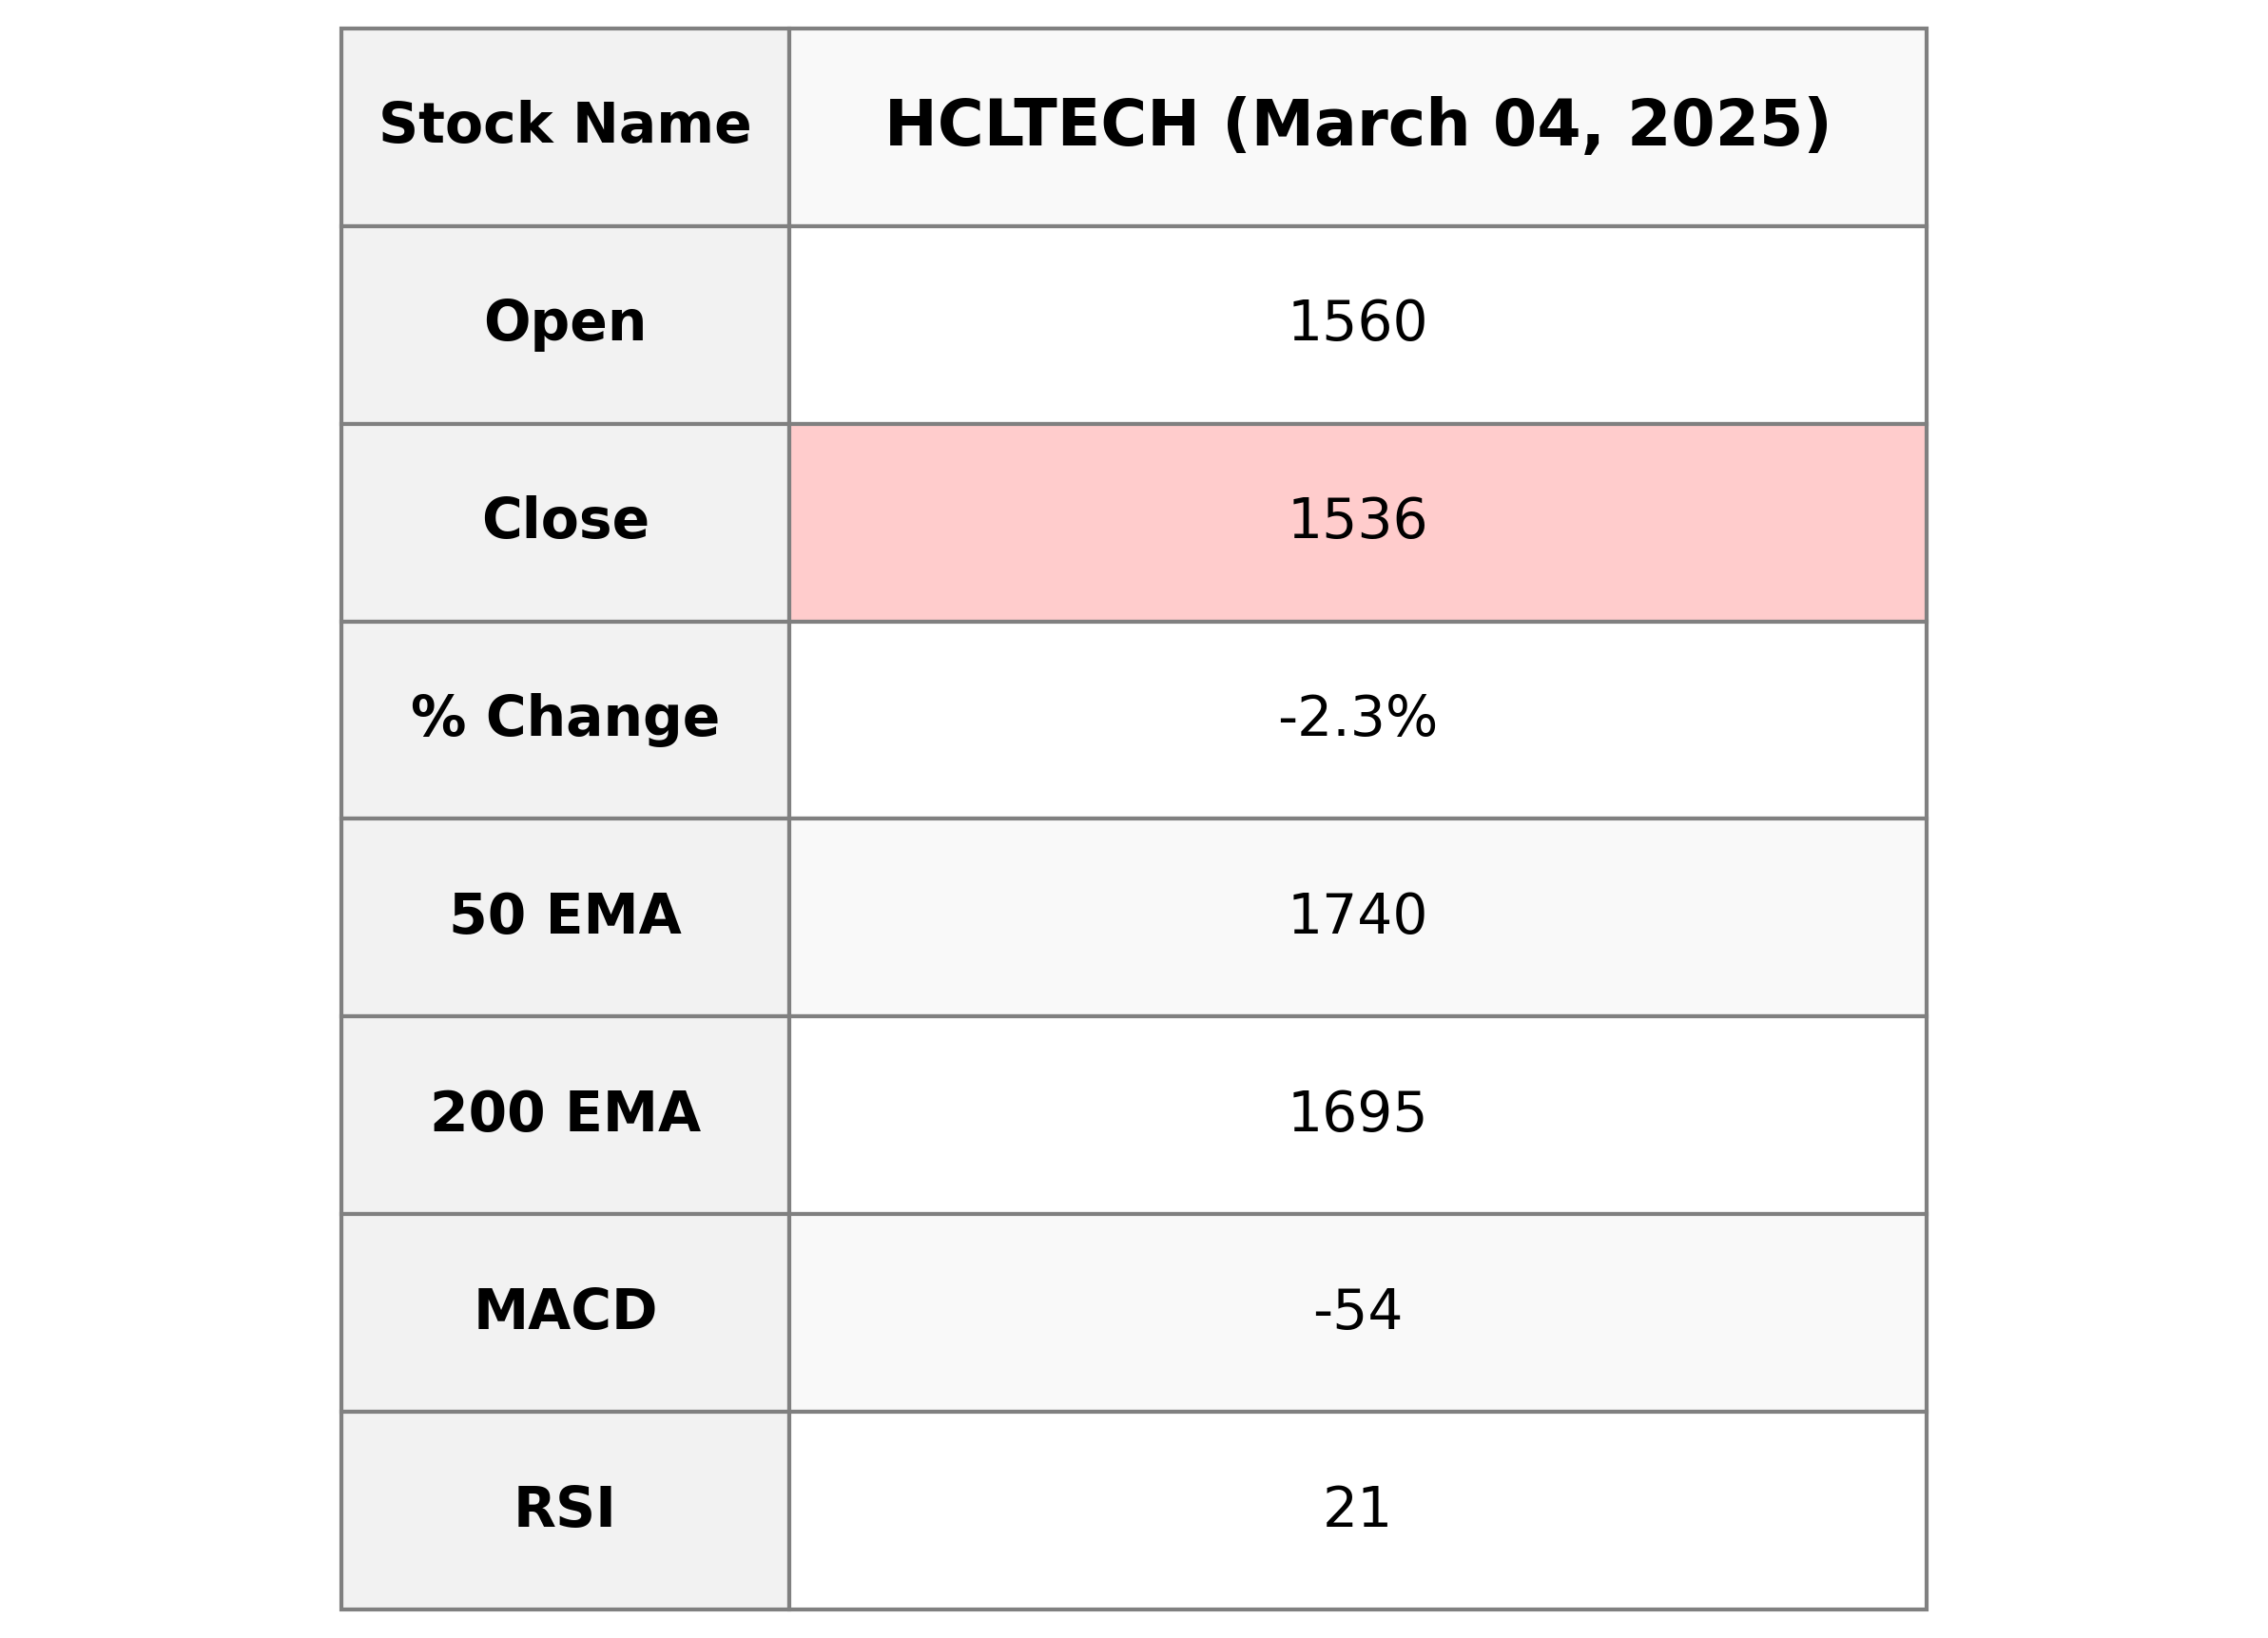
HCL Technologies experienced a notable decrease, closing at 1535.5, down by 2.35% from its previous close. Despite a strong market cap of 4.17 trillion INR, the company's RSI indicates it may be oversold. With a PE ratio of 24.44 and EPS of 62.84, it signifies a stable valuation within the Technology sector amidst current volatility.
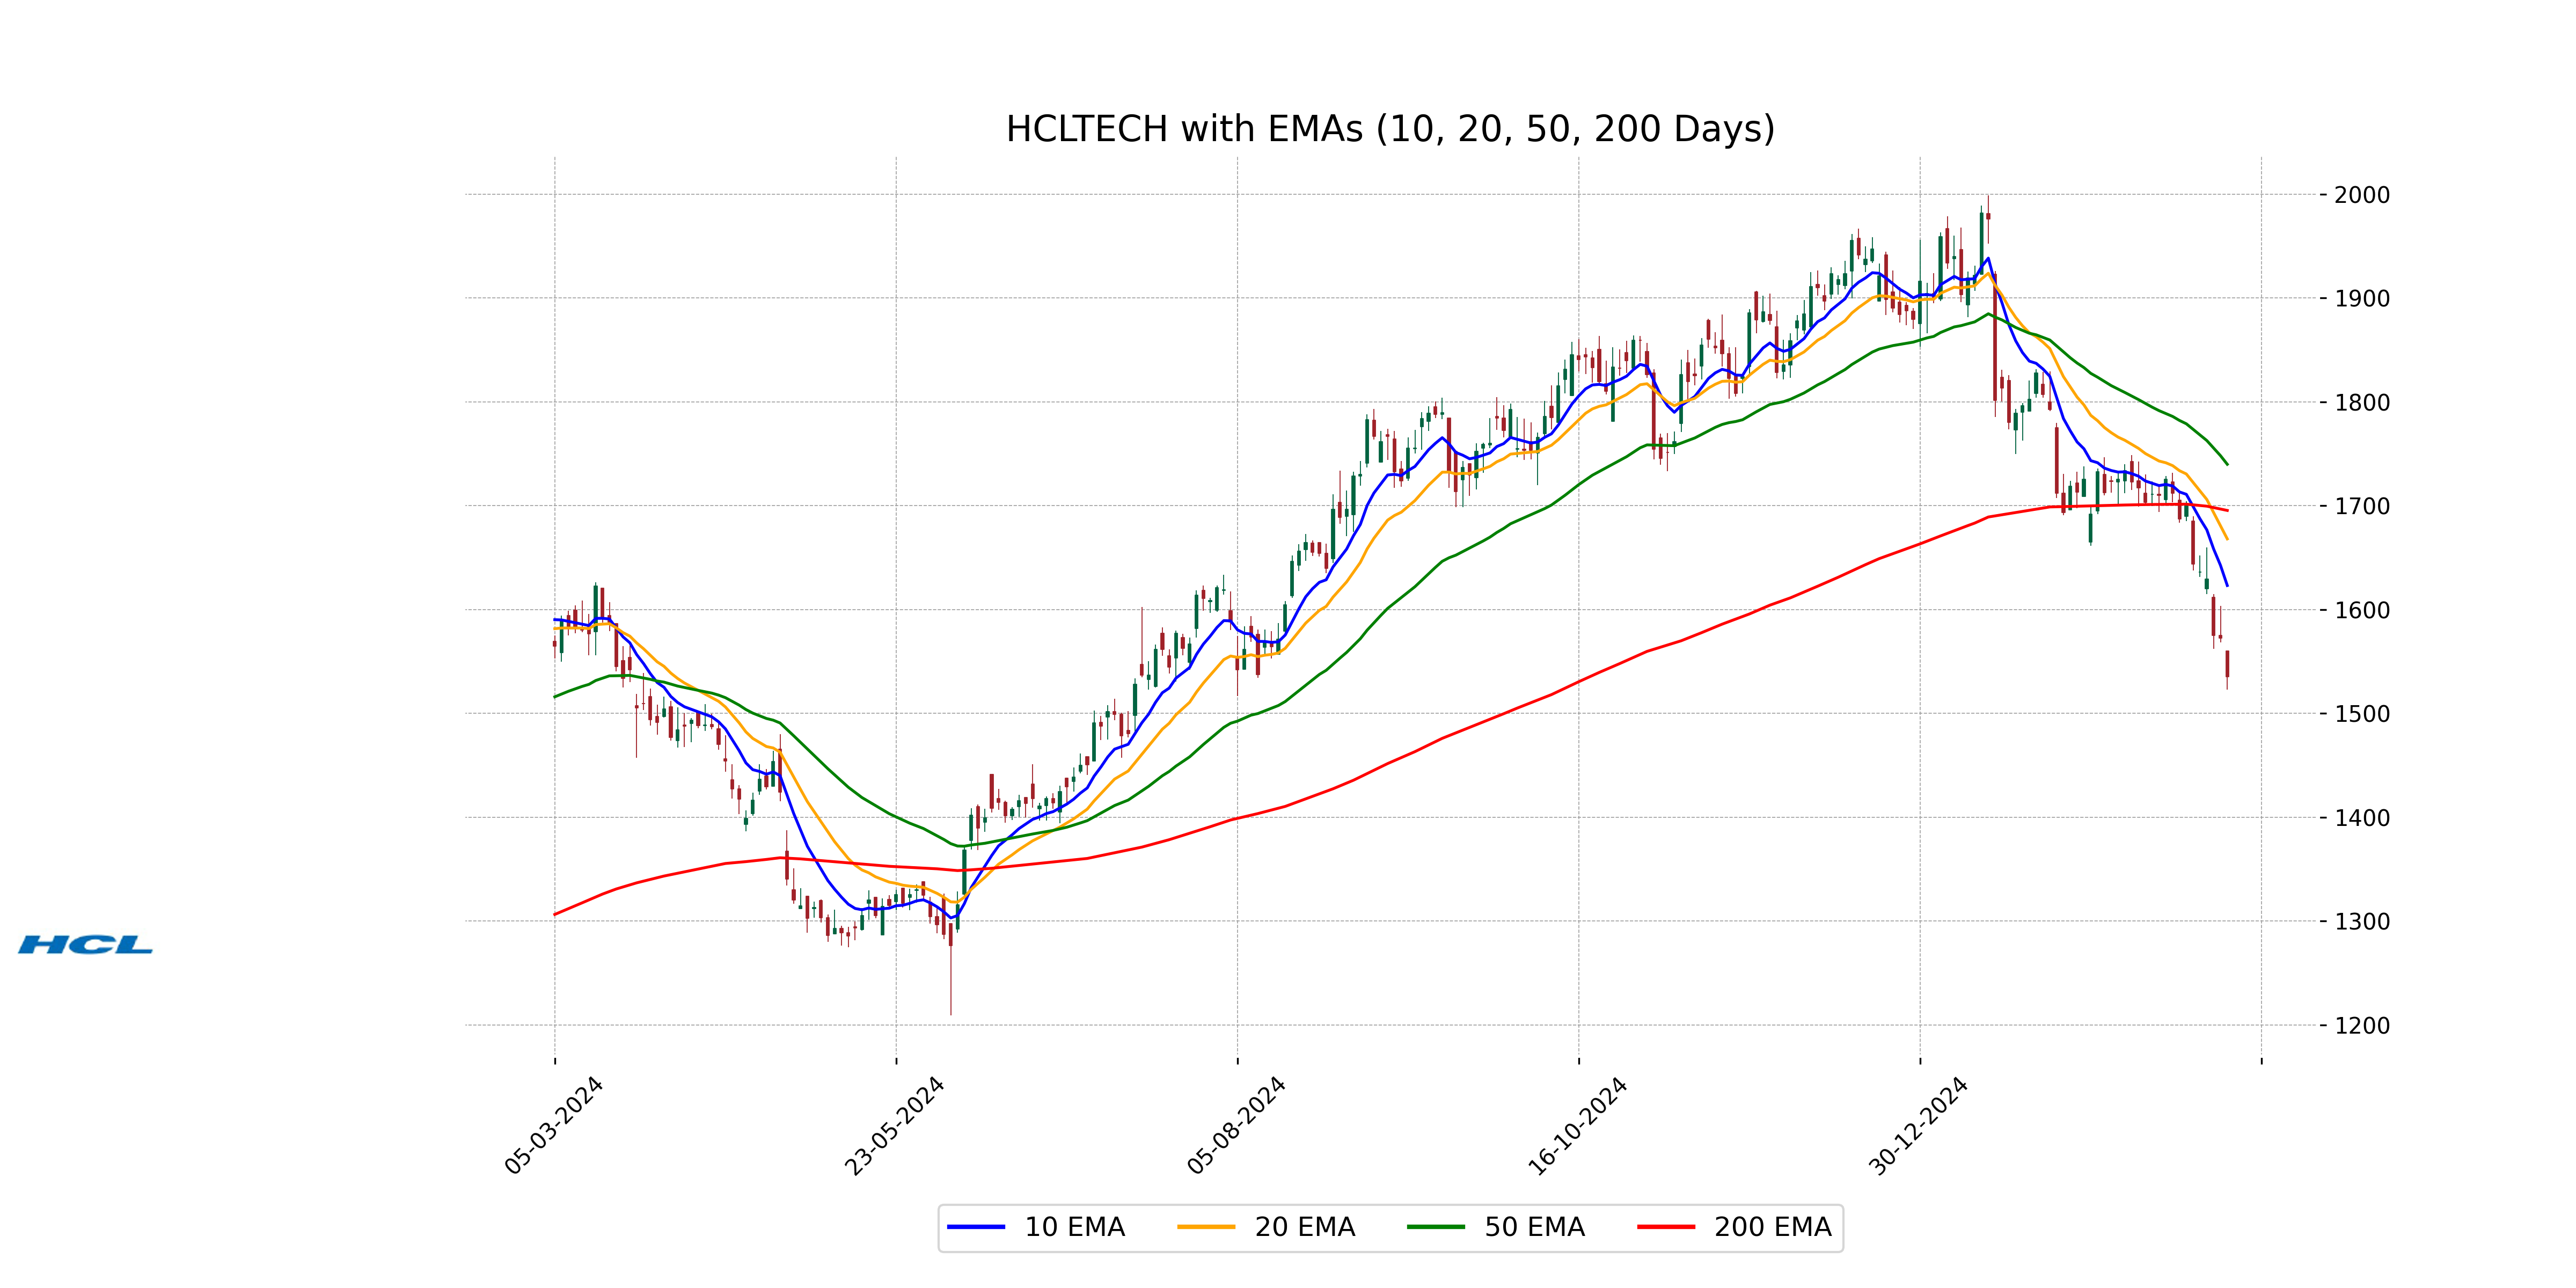
Relationship with Key Moving Averages
Relationship with Key Moving Averages for HCL Technologies: The stock price of HCL Technologies is currently trading below its 10-day EMA, 20-day EMA, 50-day EMA, and 200-day EMA, indicating a bearish momentum in the short to long term. The price being significantly lower than these key averages suggests a downward trend.
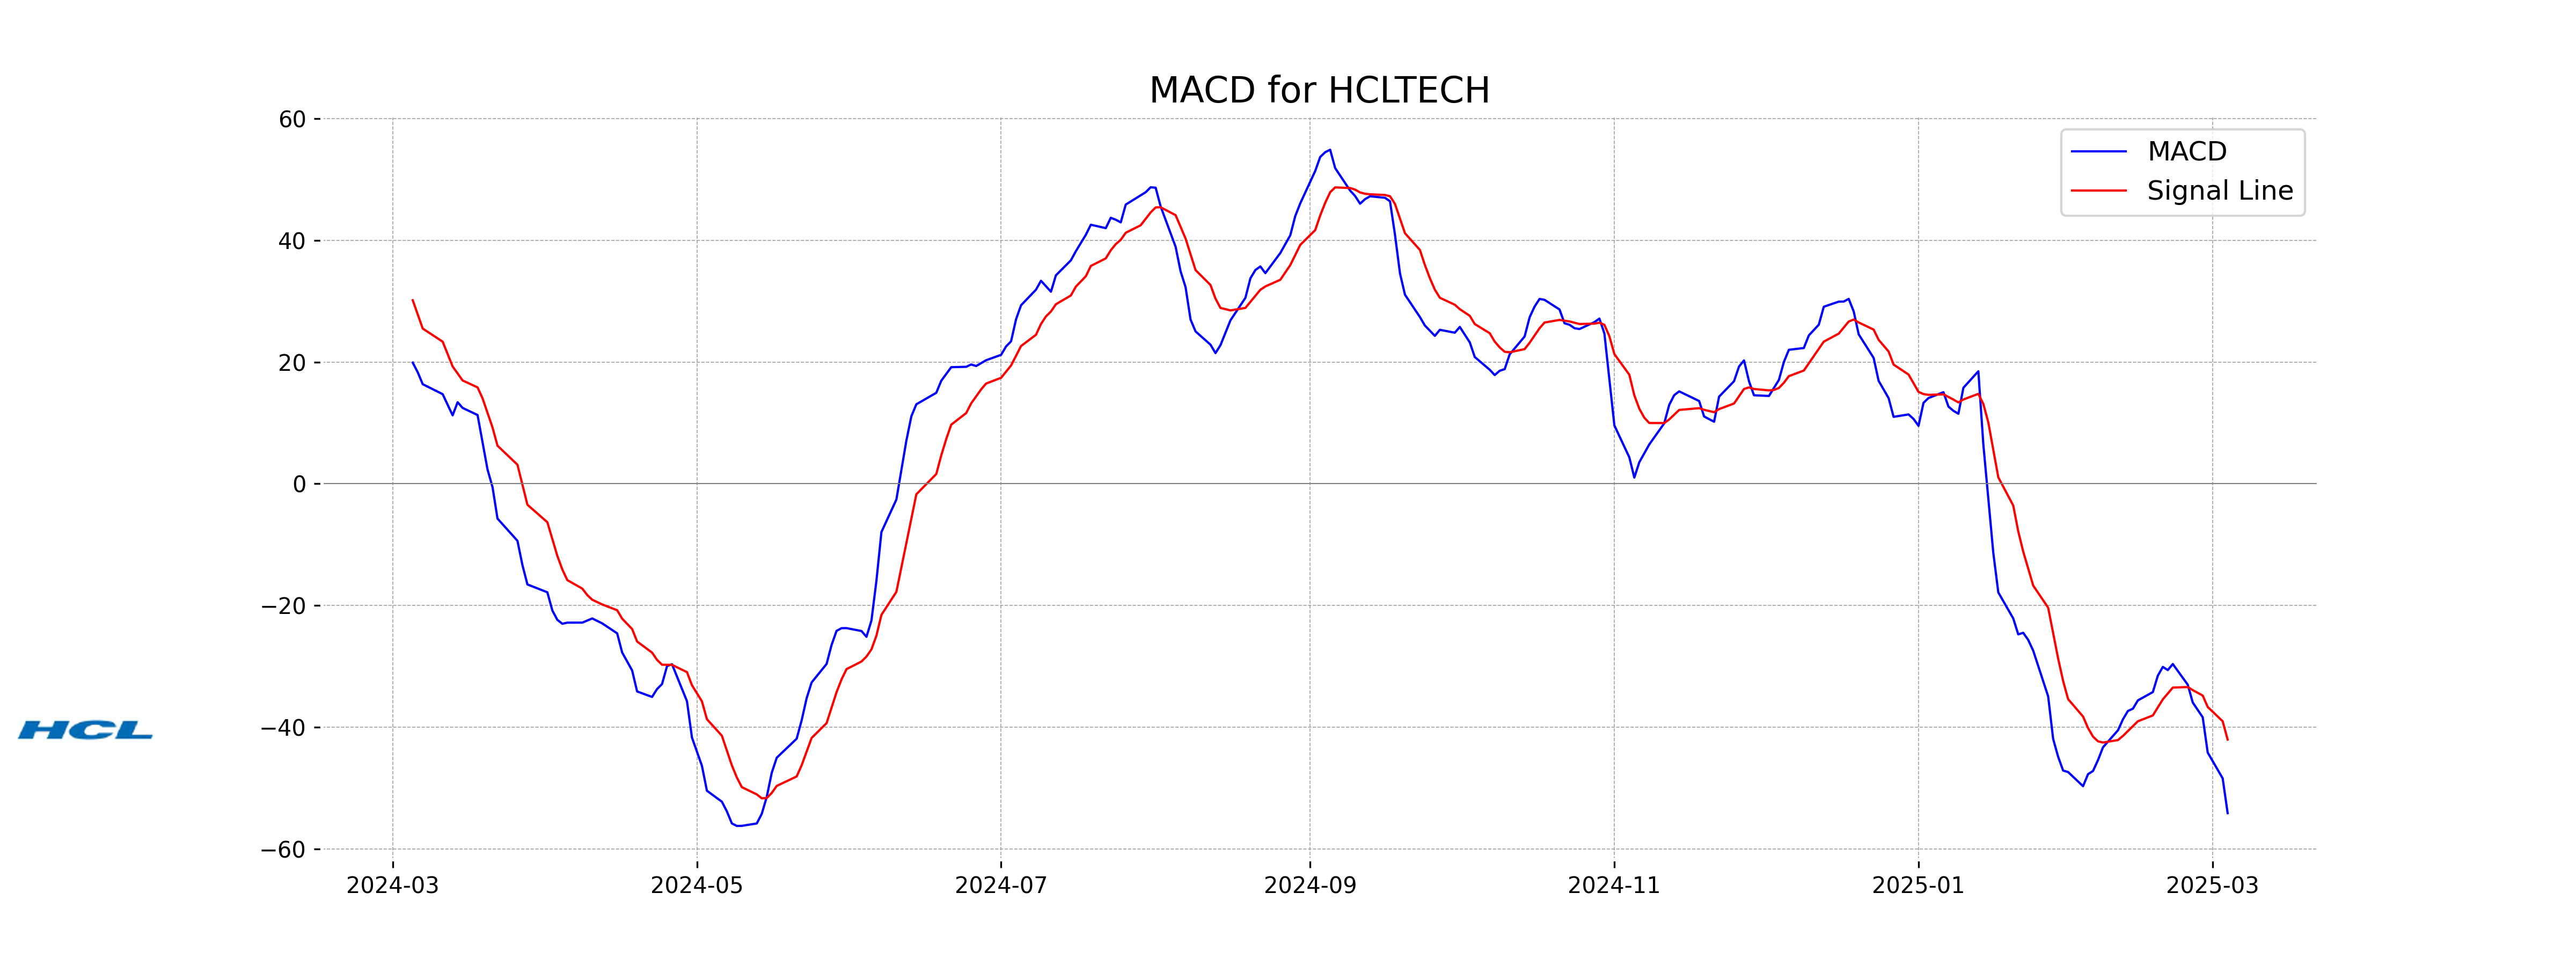
Moving Averages Trend (MACD)
MACD Analysis for HCL Technologies: The MACD value of -54.11, which is below the MACD Signal value of -42.03, indicates a bearish trend for HCL Technologies. The negative divergence suggests a potential continuation of the downward momentum.
RSI Analysis
RSI Analysis for HCL Technologies: The current RSI for HCL Technologies is 21.43, which indicates that the stock is in the oversold territory. This suggests a potential buying opportunity as the stock may be undervalued at the moment.
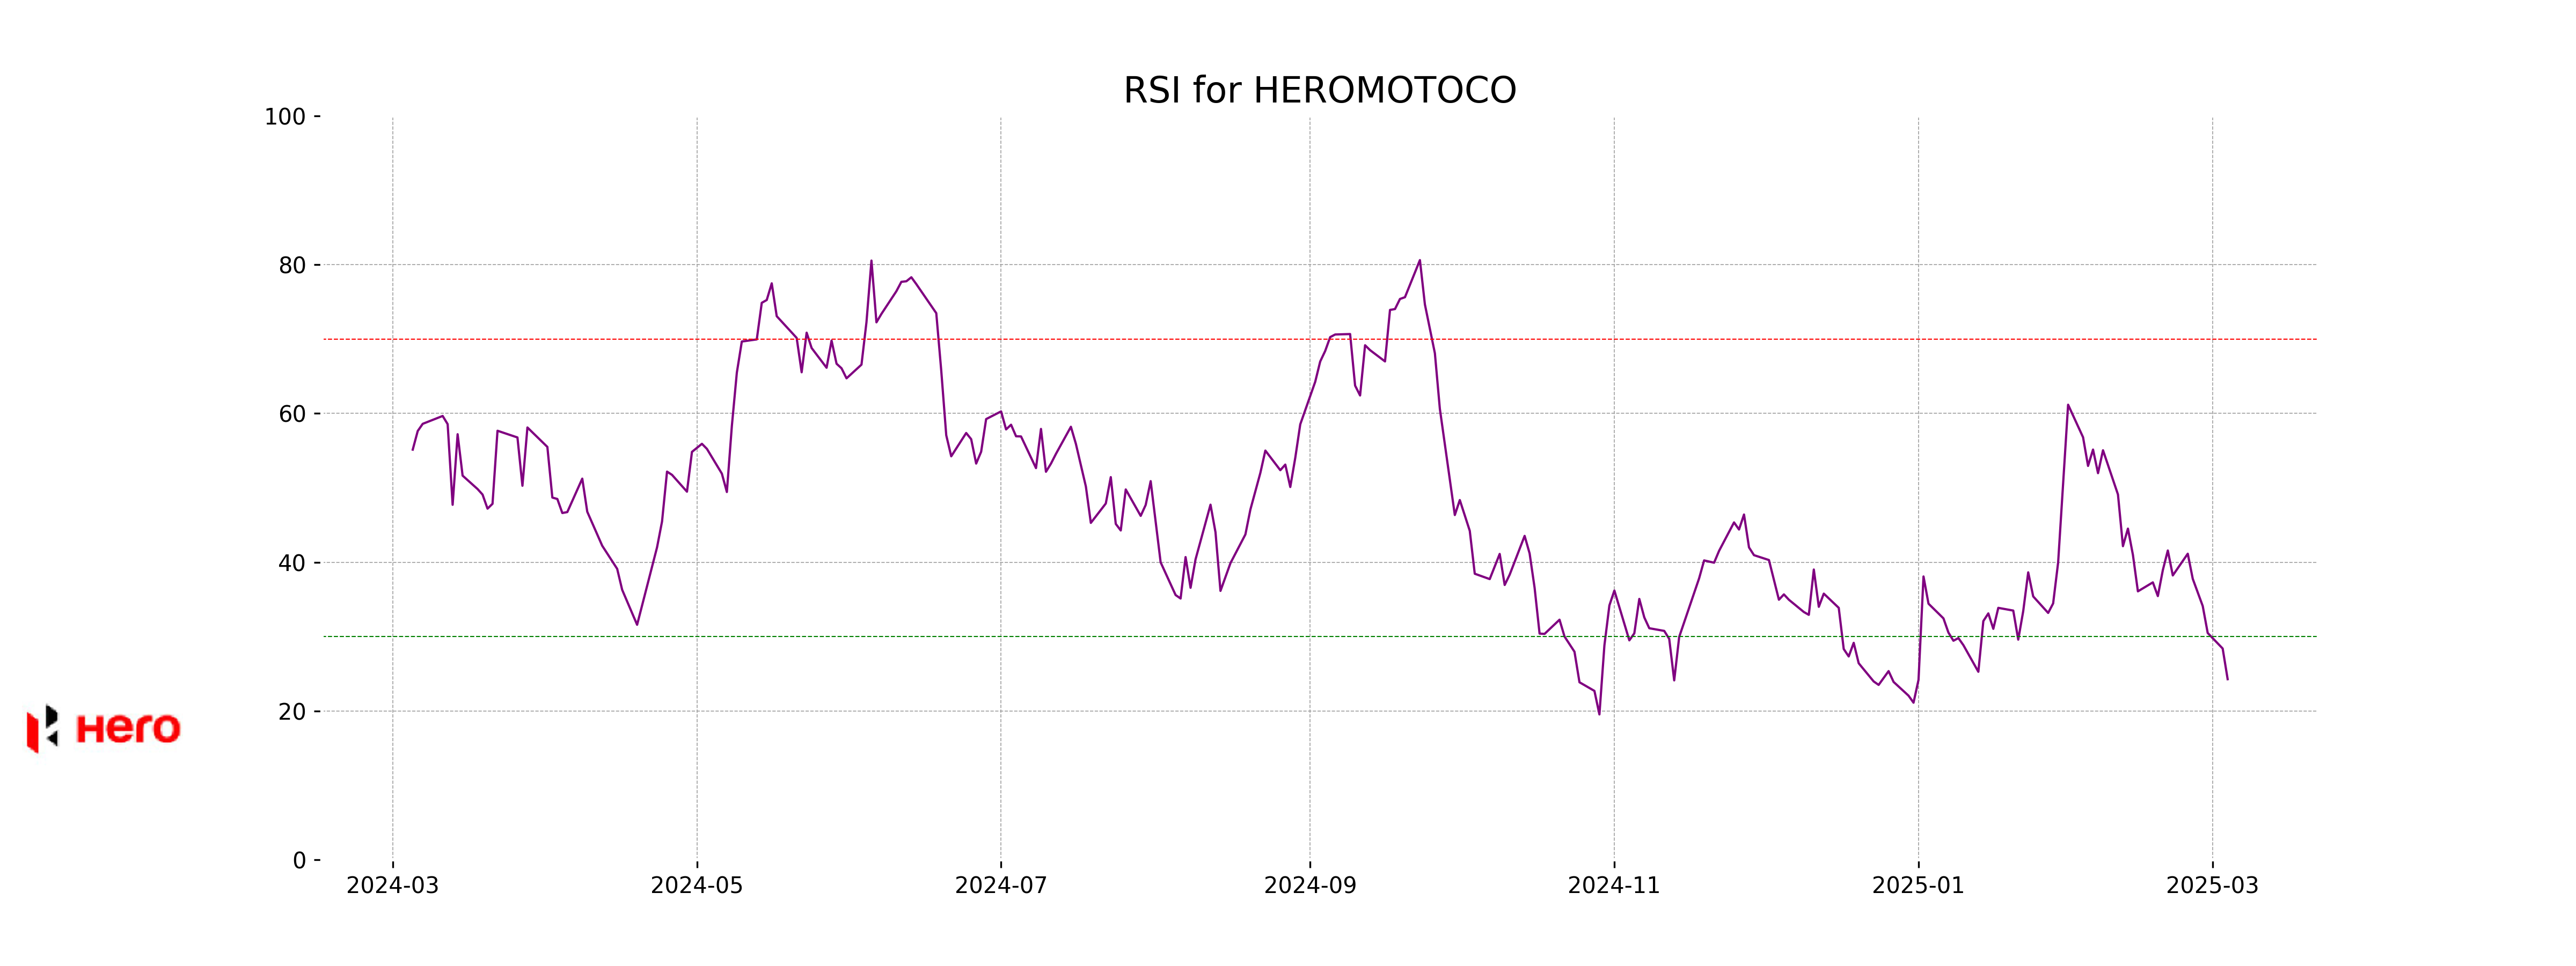
Analysis for Hero MotoCorp - March 04, 2025
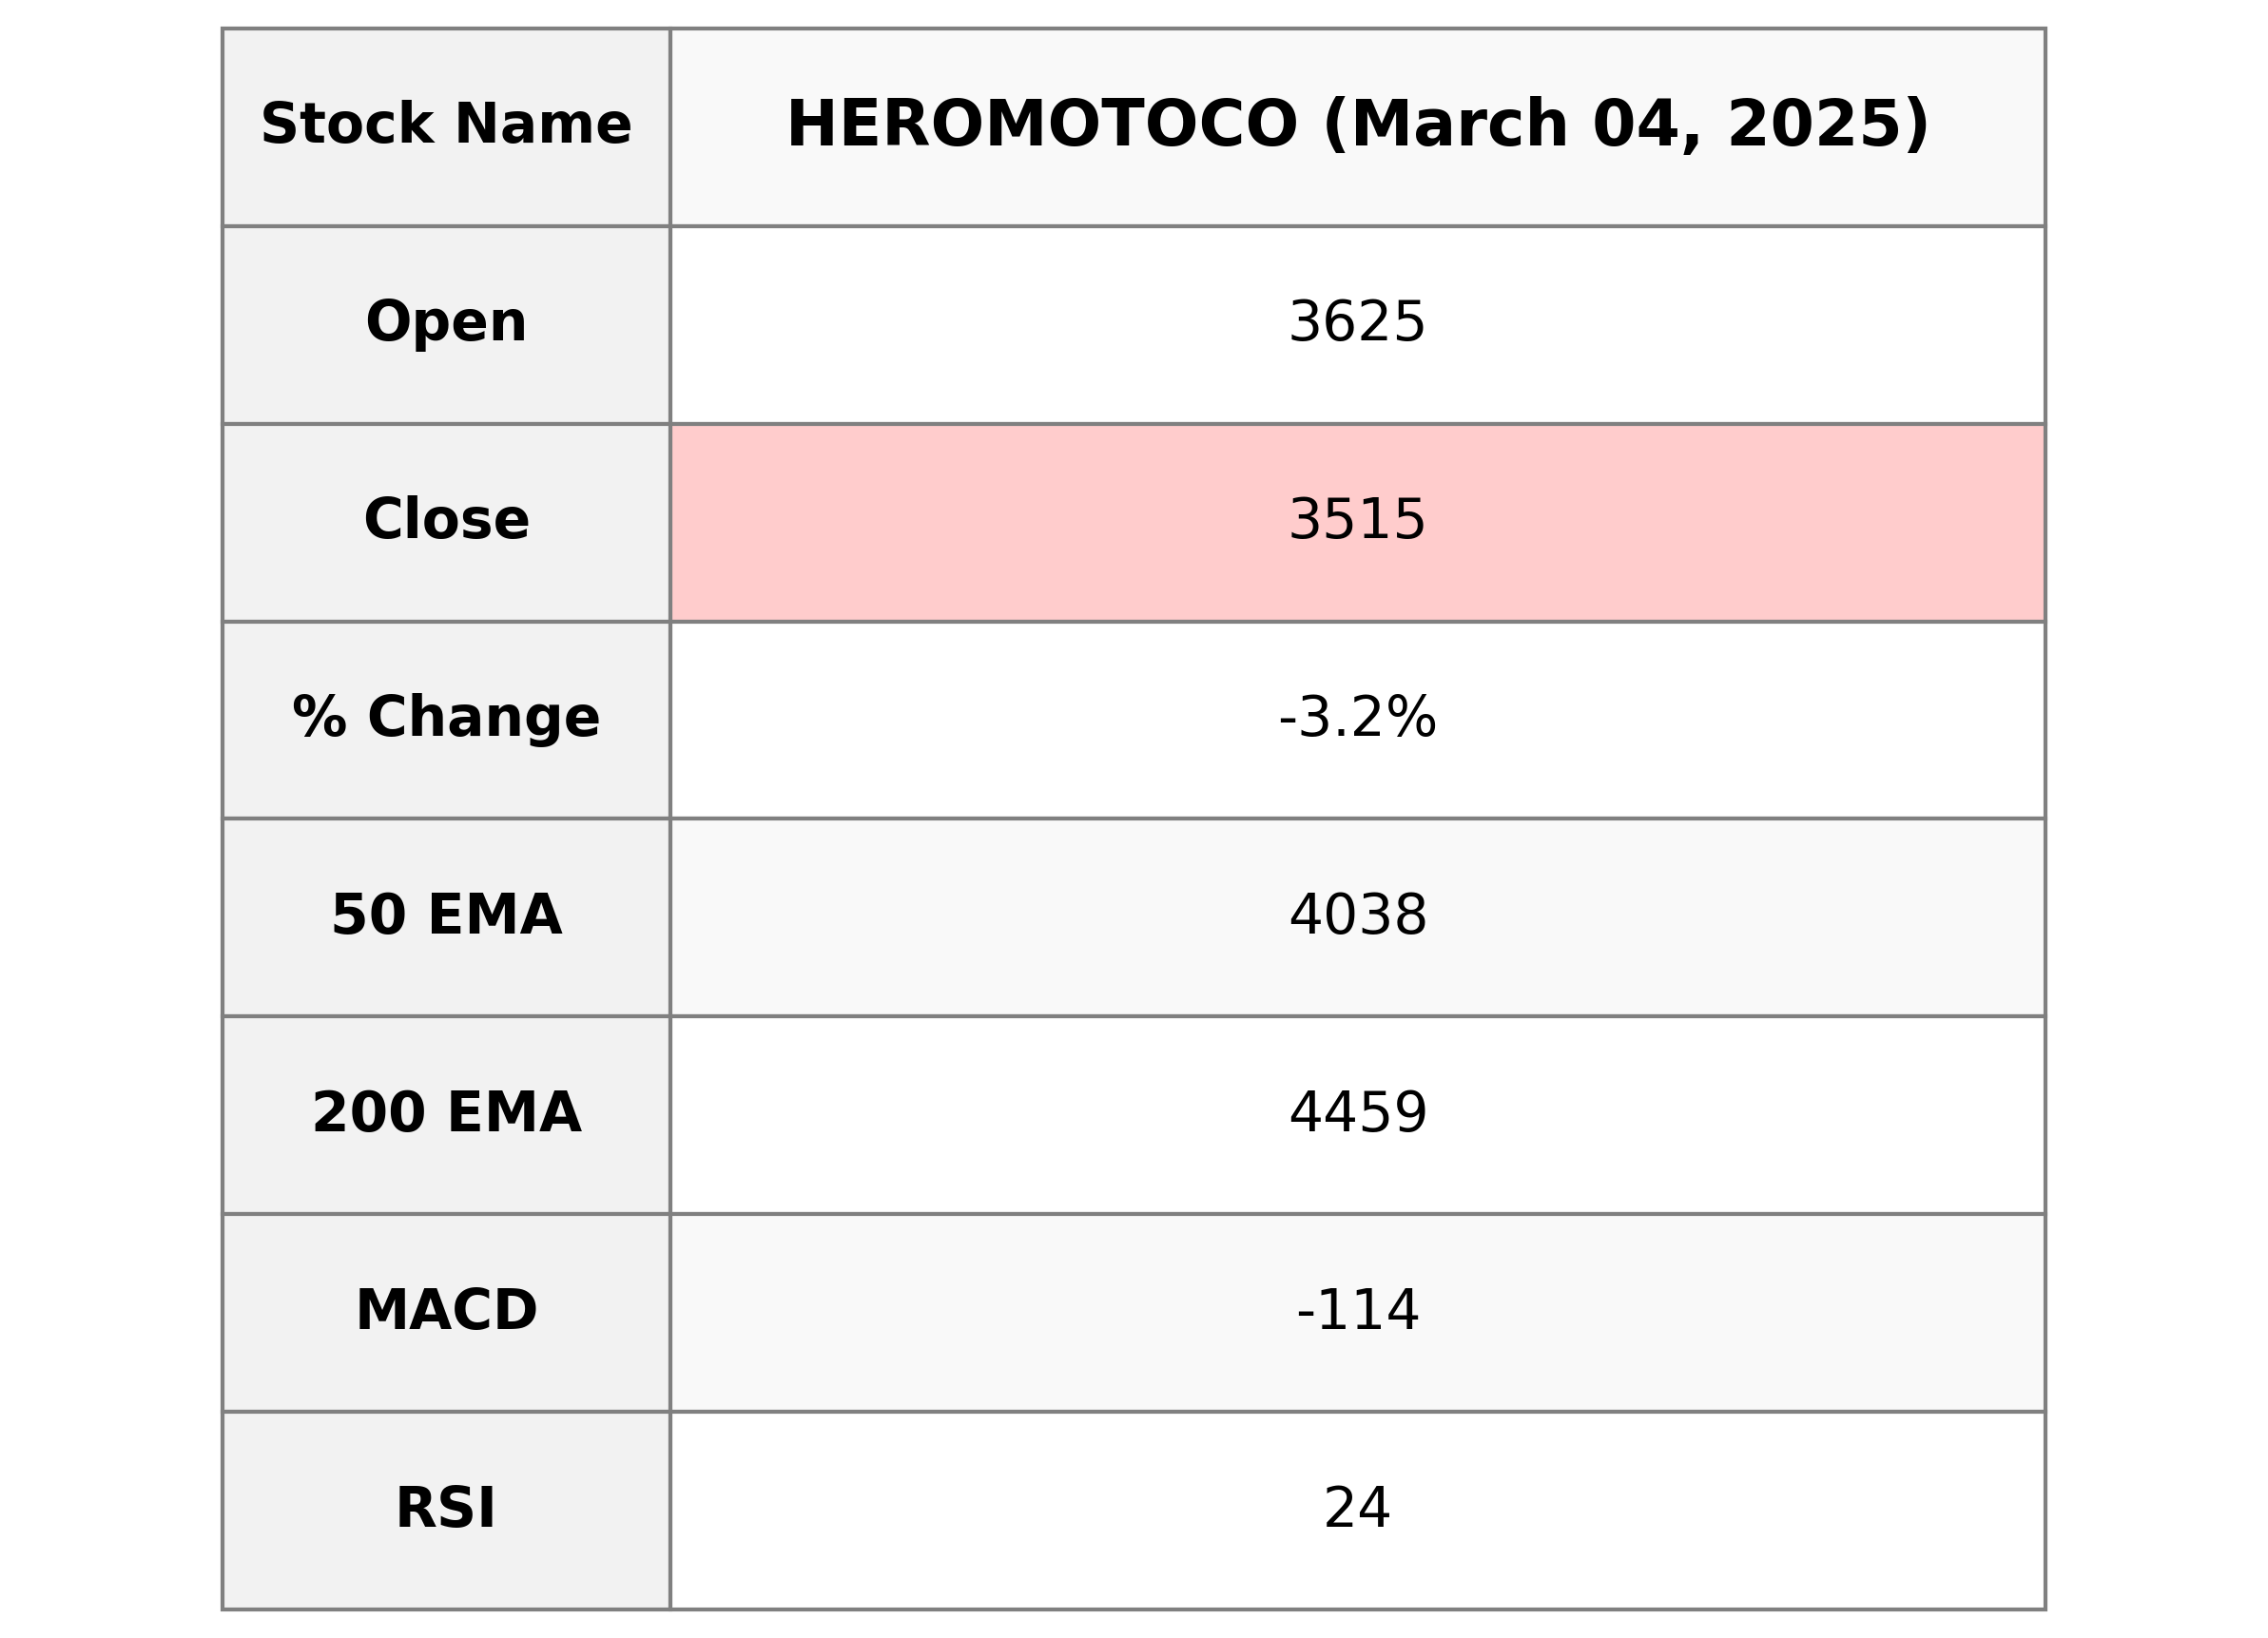
## Hero MotoCorp Performance: Hero MotoCorp's recent stock performance indicates a decline, with the stock closing at 3514.85 INR, down by 3.19% from the previous close of 3630.75 INR. The RSI value of 24.27 suggests the stock is currently oversold, while the MACD indicates a bearish trend. Despite these challenges, the company maintains a healthy market cap of approximately 712.76 billion INR, a PE ratio of 17.20, and an EPS of 204.41, operating within the Consumer Cyclical sector in India.
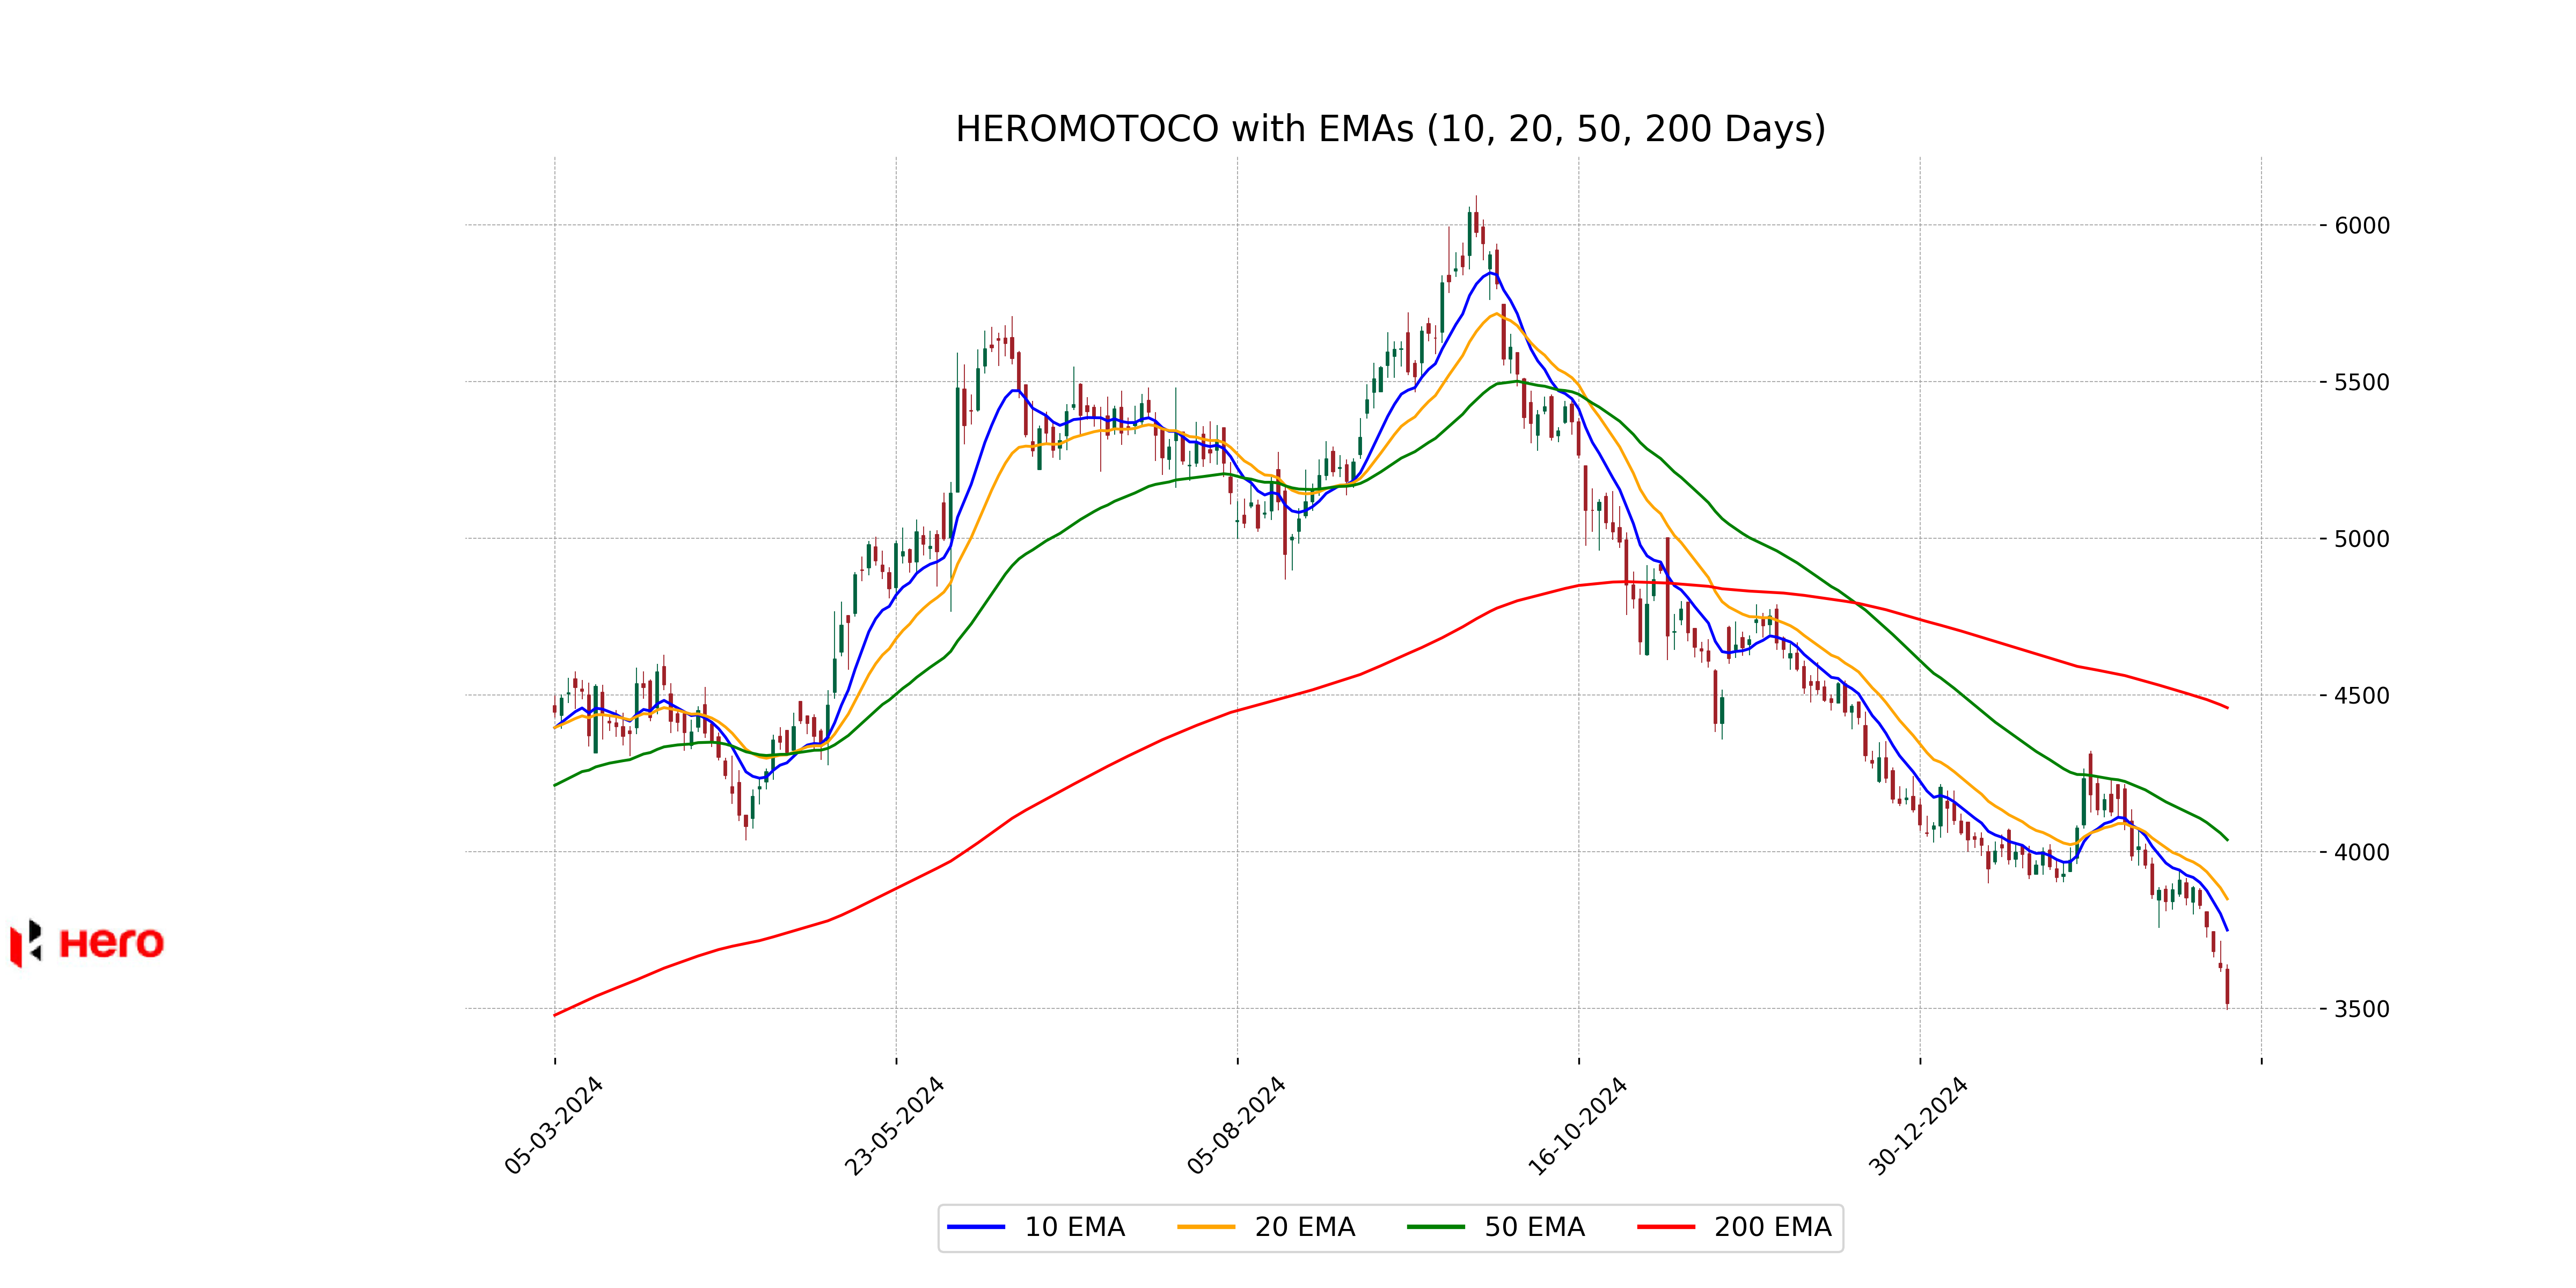
Relationship with Key Moving Averages
Hero MotoCorp is currently trading below its 10-day EMA (3749.99), 50-day EMA (4037.91), and 200-day EMA (4459.23), indicating a bearish trend in the short, medium, and long term. The stock's position below these key moving averages suggests potential downward momentum.
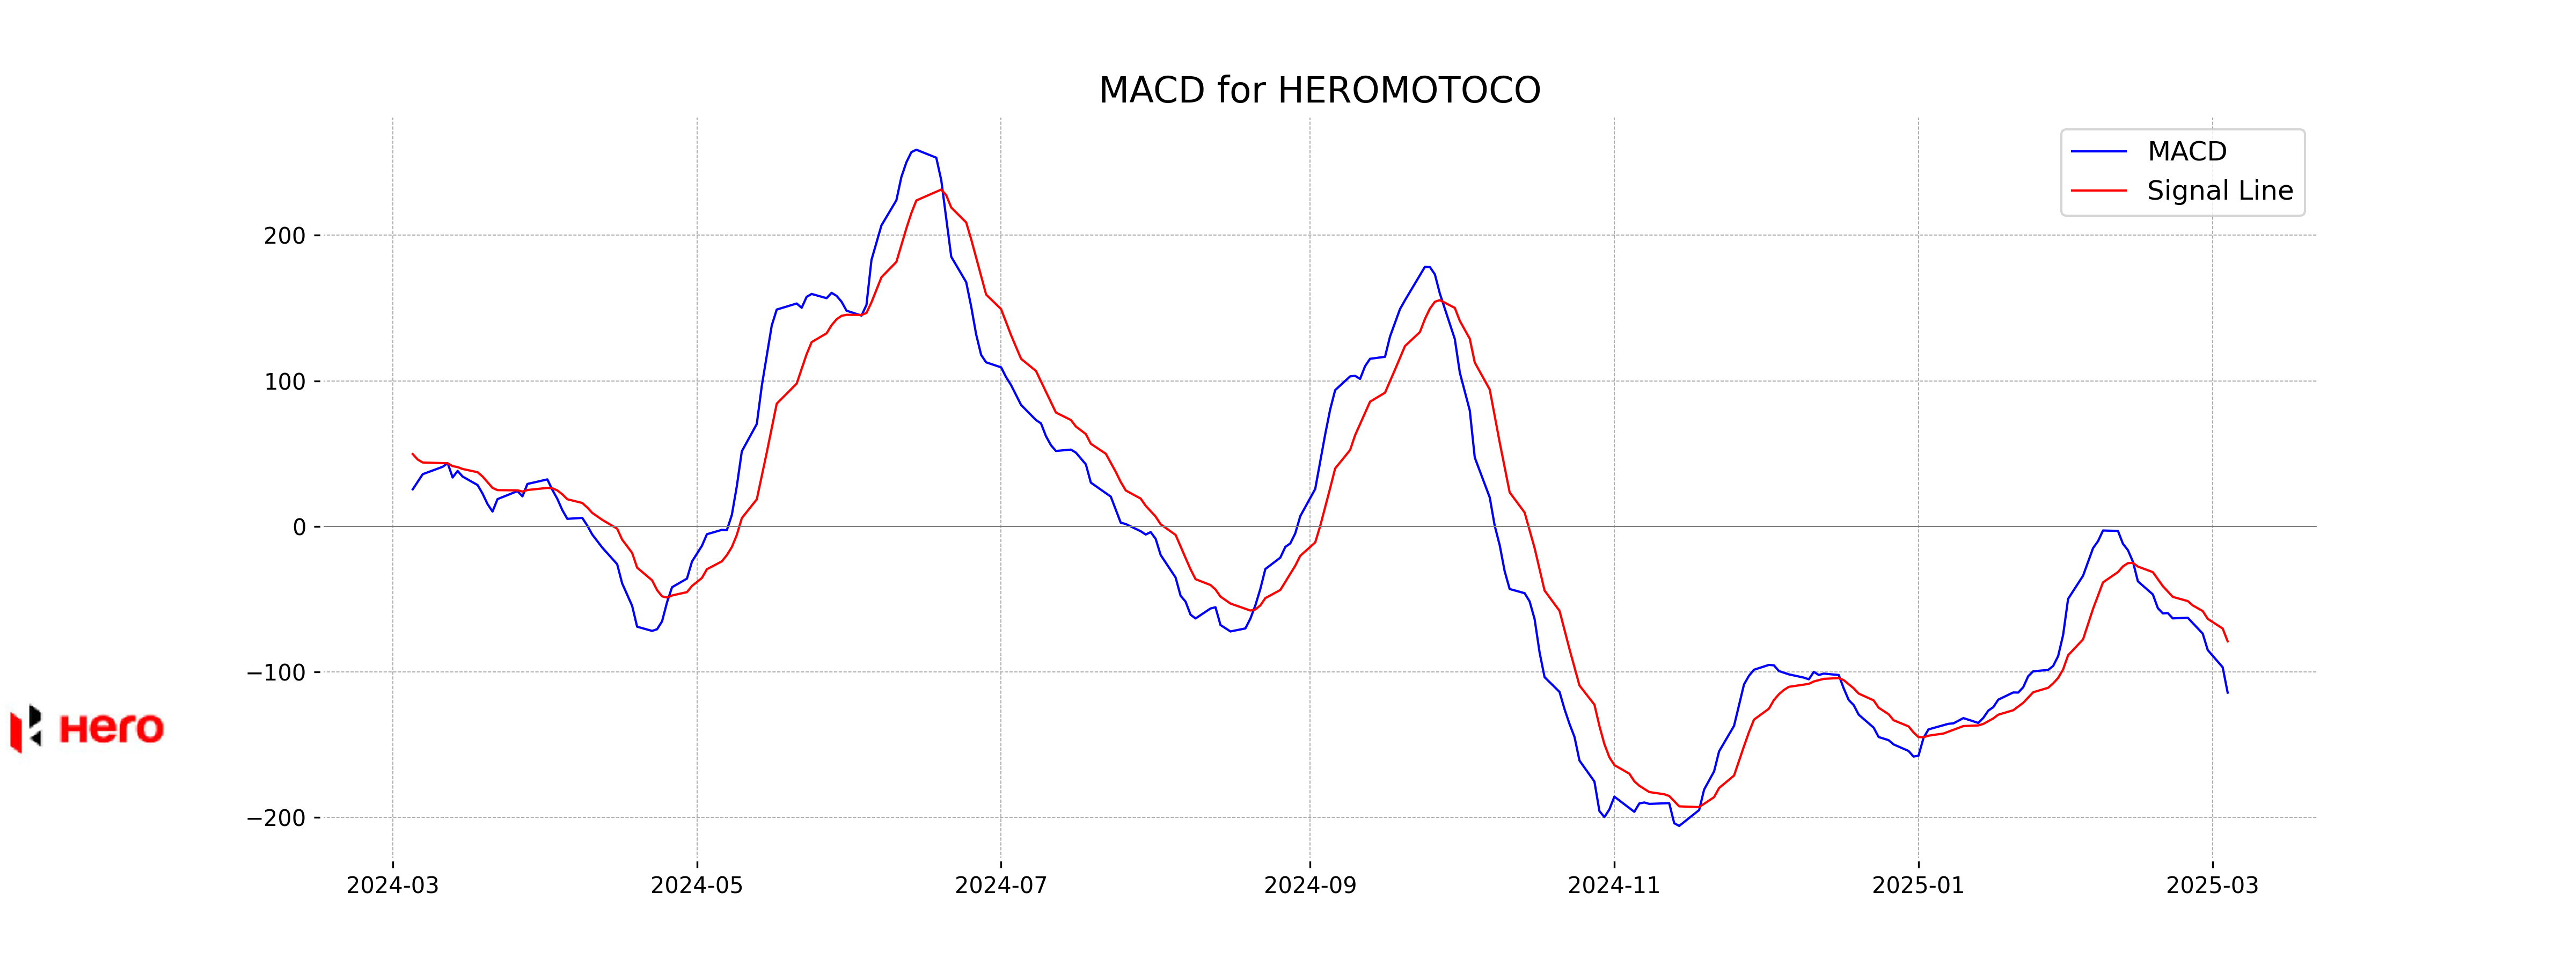
Moving Averages Trend (MACD)
Hero MotoCorp has a MACD value of -114.22, with the MACD Signal at -78.99, indicating a bearish trend as the MACD line is below the signal line. Additionally, the RSI is at 24.27, suggesting that the stock is currently in the oversold territory.
RSI Analysis
Hero MotoCorp's RSI is 24.27, which indicates that the stock is in the oversold territory. This suggests that the stock may experience a potential price reversal or a bounce back if buyers step in. However, it is important to corroborate RSI analysis with other technical indicators before making any investment decisions.
Up Next
NSE Nifty 50: Top 5 stock losers of March 04, 2025

New Zealand commits USD 20 bn investment in India under FTA in 15 yrs; on lines of EFTA pact

India, New Zealand conclude FTA talks; pact to offer duty-free access, USD 20 bn FDI

FTA with New Zealand to significantly deepen bilateral economic engagement: Govt

Rupee breaches 91-mark against US dollar for first time in intra-day trade

Microsoft commits USD 17.5 billion investment in India: CEO Satya Nadella

More videos

CBI books Anil Ambani's son, Reliance Home Finance Ltd. in Rs 228 crore bank fraud case

RBI raises FY26 GDP growth projection to 7.3 pc

RBI trims policy interest rate by 25bps to 5.25pc, loans to get cheaper

Rupee slumps to all-time low of 90.25 against US dollar in intra-day trade

Reliance completes merger of Star Television Productions with Jiostar

India to lead emerging market growth with 7pc GDP rise in 2025: Moody’s

Nifty hits record high after 14 months; Sensex nears all-time peak

Reliance stops Russian oil use at its only-for-export refinery to comply with EU sanctions

ED attaches fresh assets worth over Rs 1,400 cr in case against Anil Ambani's Reliance Group

India signs one-year deal to import 2.2 million tonnes of LPG from US