


 Launches RISM, a Globally Aligned STEM and Management University Focused on AI, Aerospace and Future-Ready Skills")


Explore June 24, 2025 technical insights for underperforming Indian stocks like IndusInd Bank, NTPC, ONGC, Power Grid, and Trent based on EMA, RSI, and MACD.
Highlights
- IndusInd Bank trades below 200 EMA level
- NTPC, ONGC, Power Grid show bearish trend
- Trent holds bullish MACD despite price dip
Latest news
The Future of AI Citations and Search Visibility - Insights from BrandStory, a Leading SEO Agency in Bangalore
Gokula Education Foundation (Medical) Launches RISM, a Globally Aligned STEM and Management University Focused on AI, Aerospace and Future-Ready Skills
SMU law undergraduates defend Sports Law Arbitration Moot championship title in Lausanne
Visa Launches 'Agentic Ready' Program in Asia Pacific with Over 50 Partners - Advancing Agentic Commerce
"Daydreaming about one of the most unforgettable experiences...": Rihanna revisits Mumbai diaries after Fenty Beauty launch event in India
Dalal Street tumbles as crude tops USD 120; Nifty slips 278 pts, Sensex down 914 pts in opening
Energy key to India's national resilience: Sagar Adani
Sajid Nadiadwala banner enters Gujarati cinema with 'Dhabkaaro', film to release on May 1
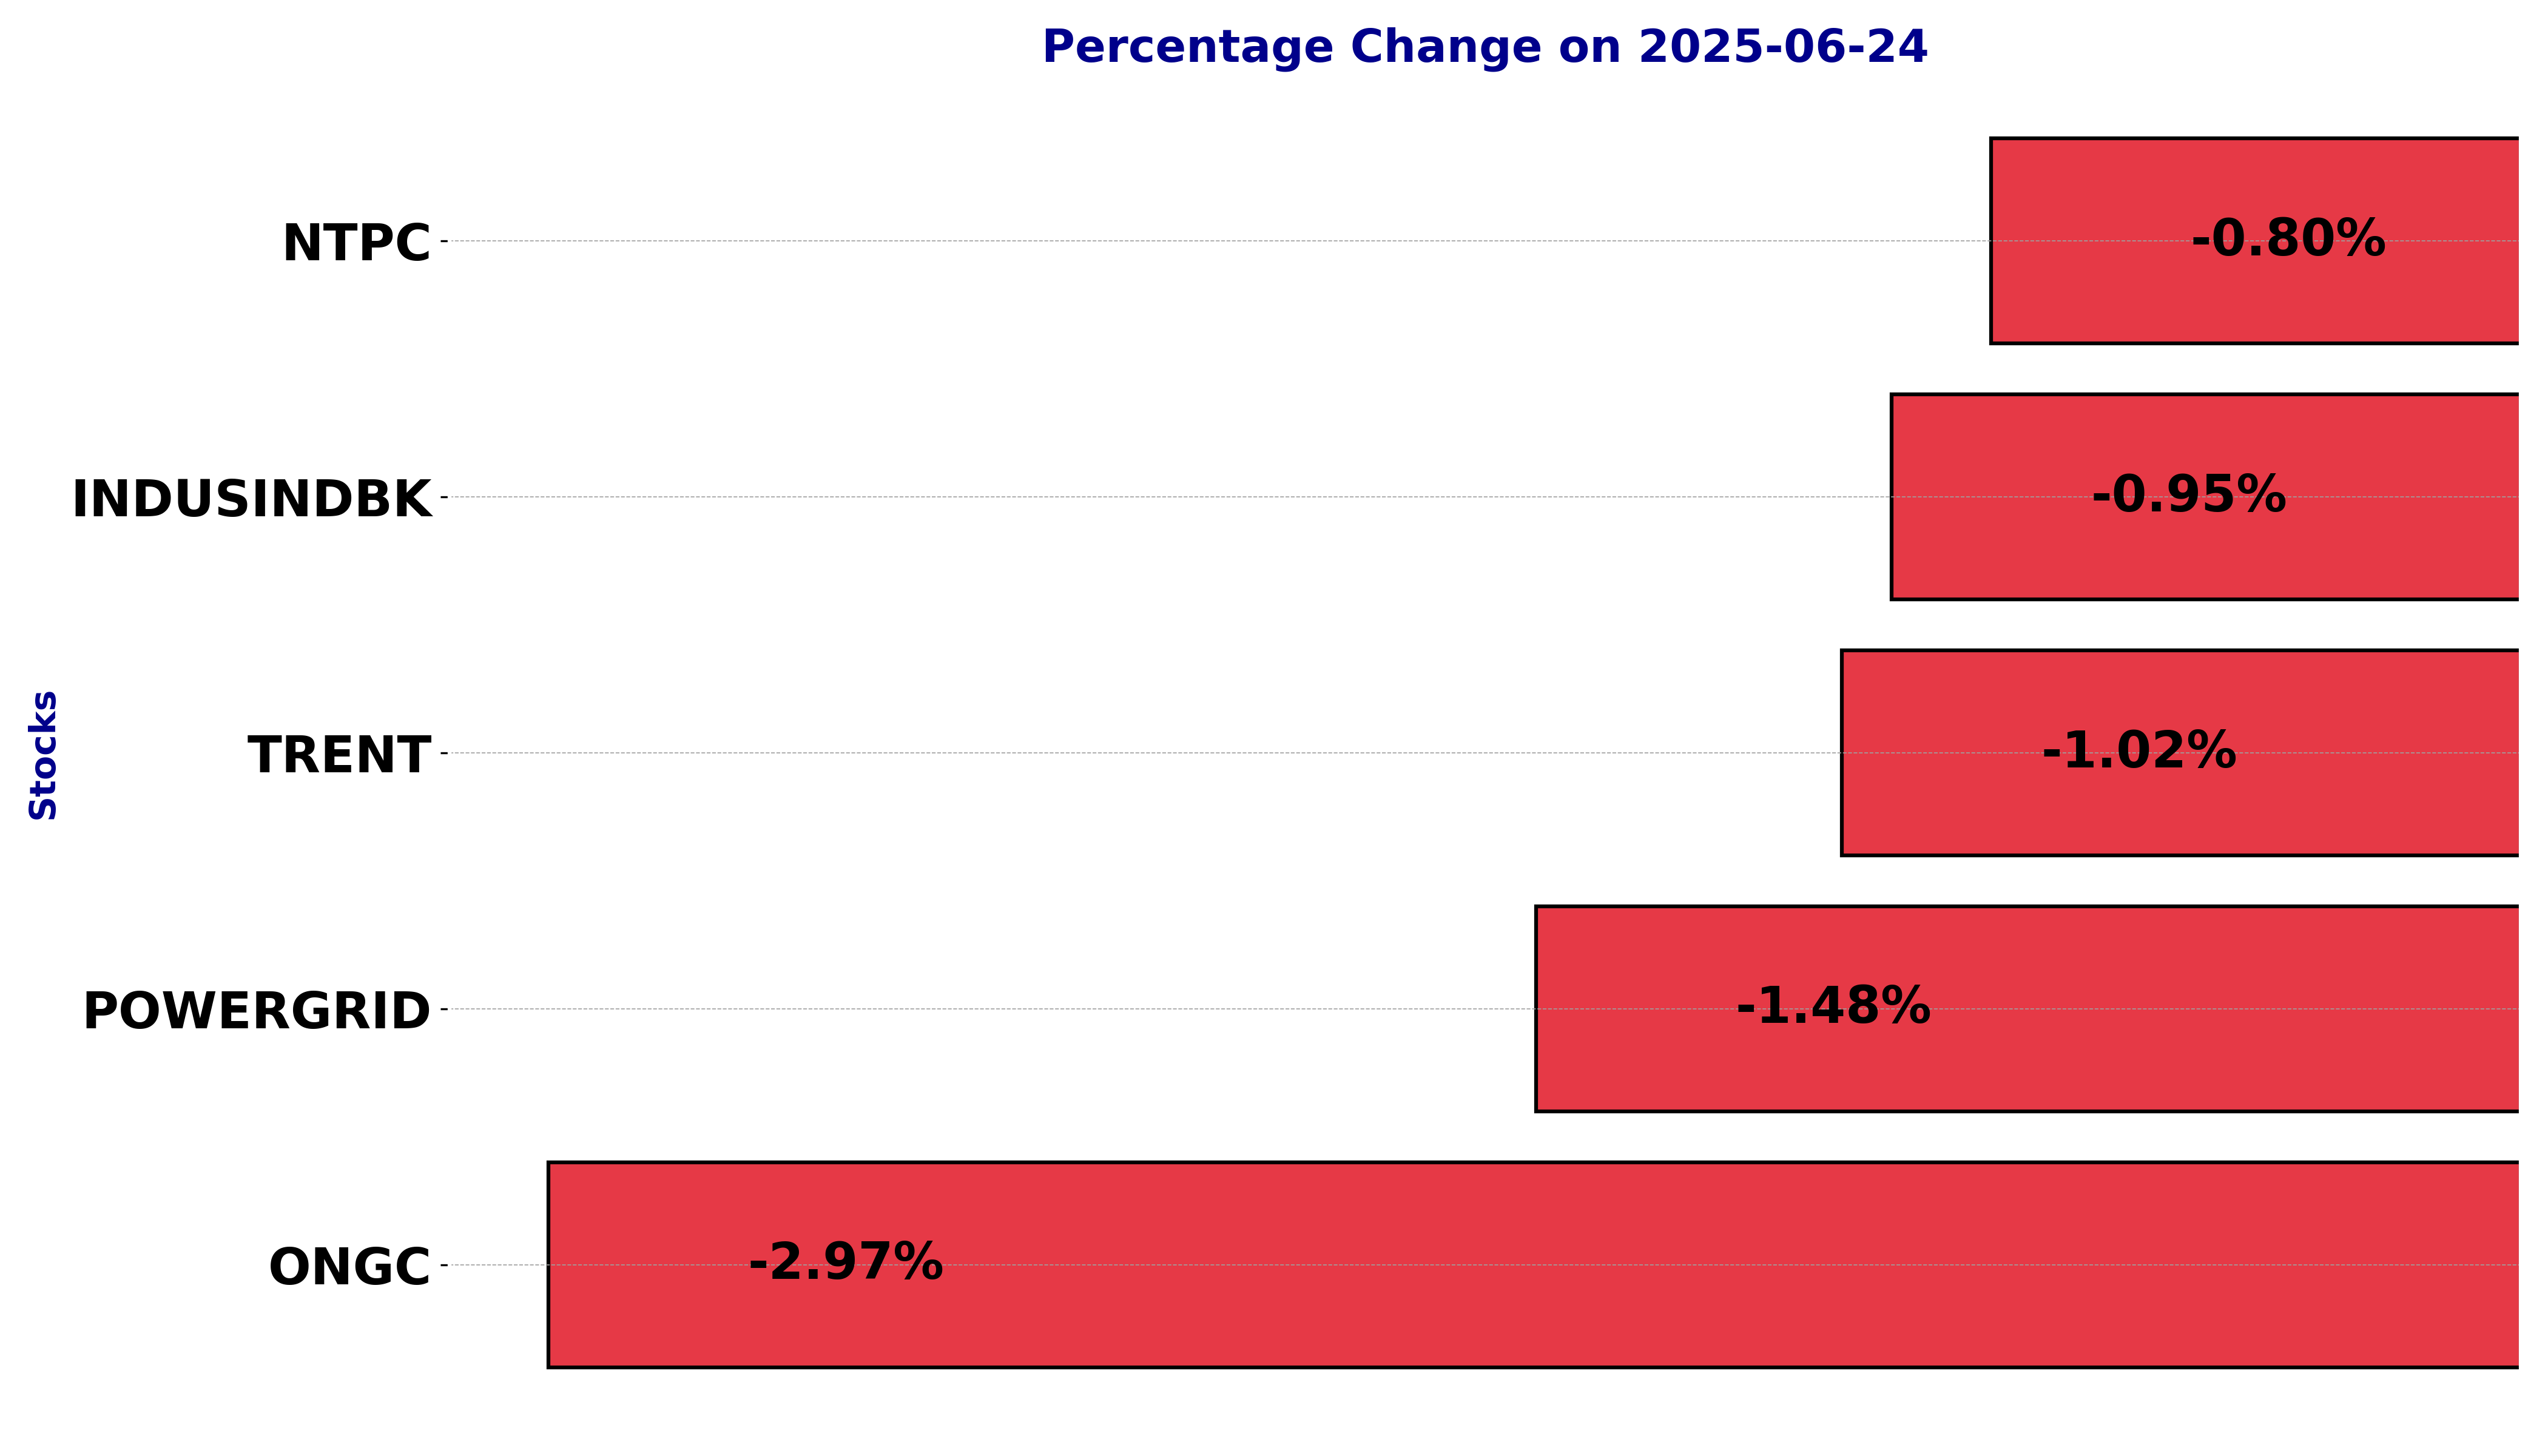
NSE Nifty 50: Top 5 stock losers of June 24, 2025


In this article, we will explore the technical indicators of some of the low-performing stocks on the Indian stock market, including INDUSINDBK, NTPC, ONGC, POWERGRID, and TRENT.
By looking at these stocks through the lens of key technical factors, we aim to better understand their price movements, trends, and potential future performance.
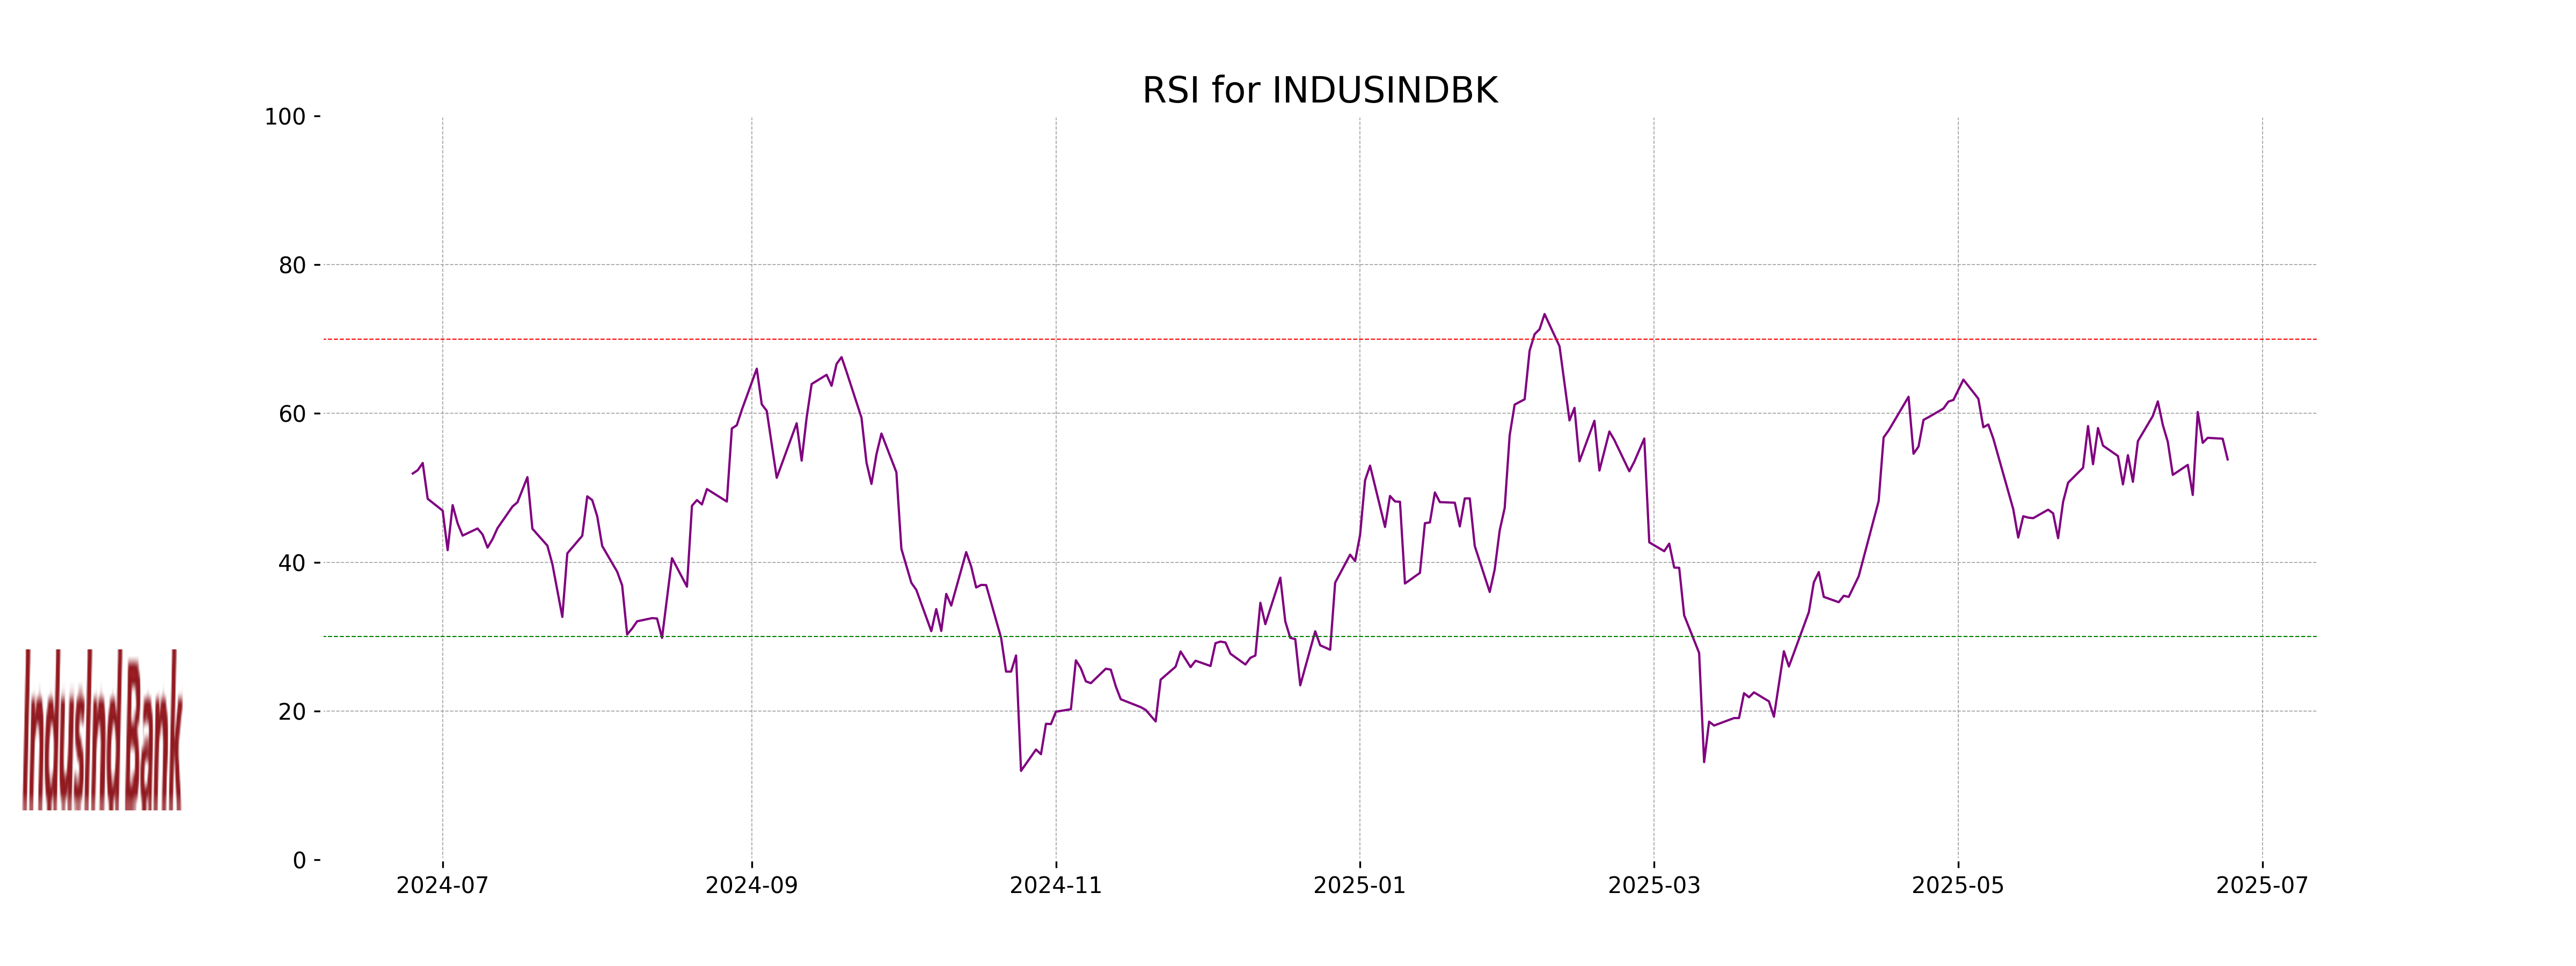
Analysis for IndusInd Bank - June 24, 2025
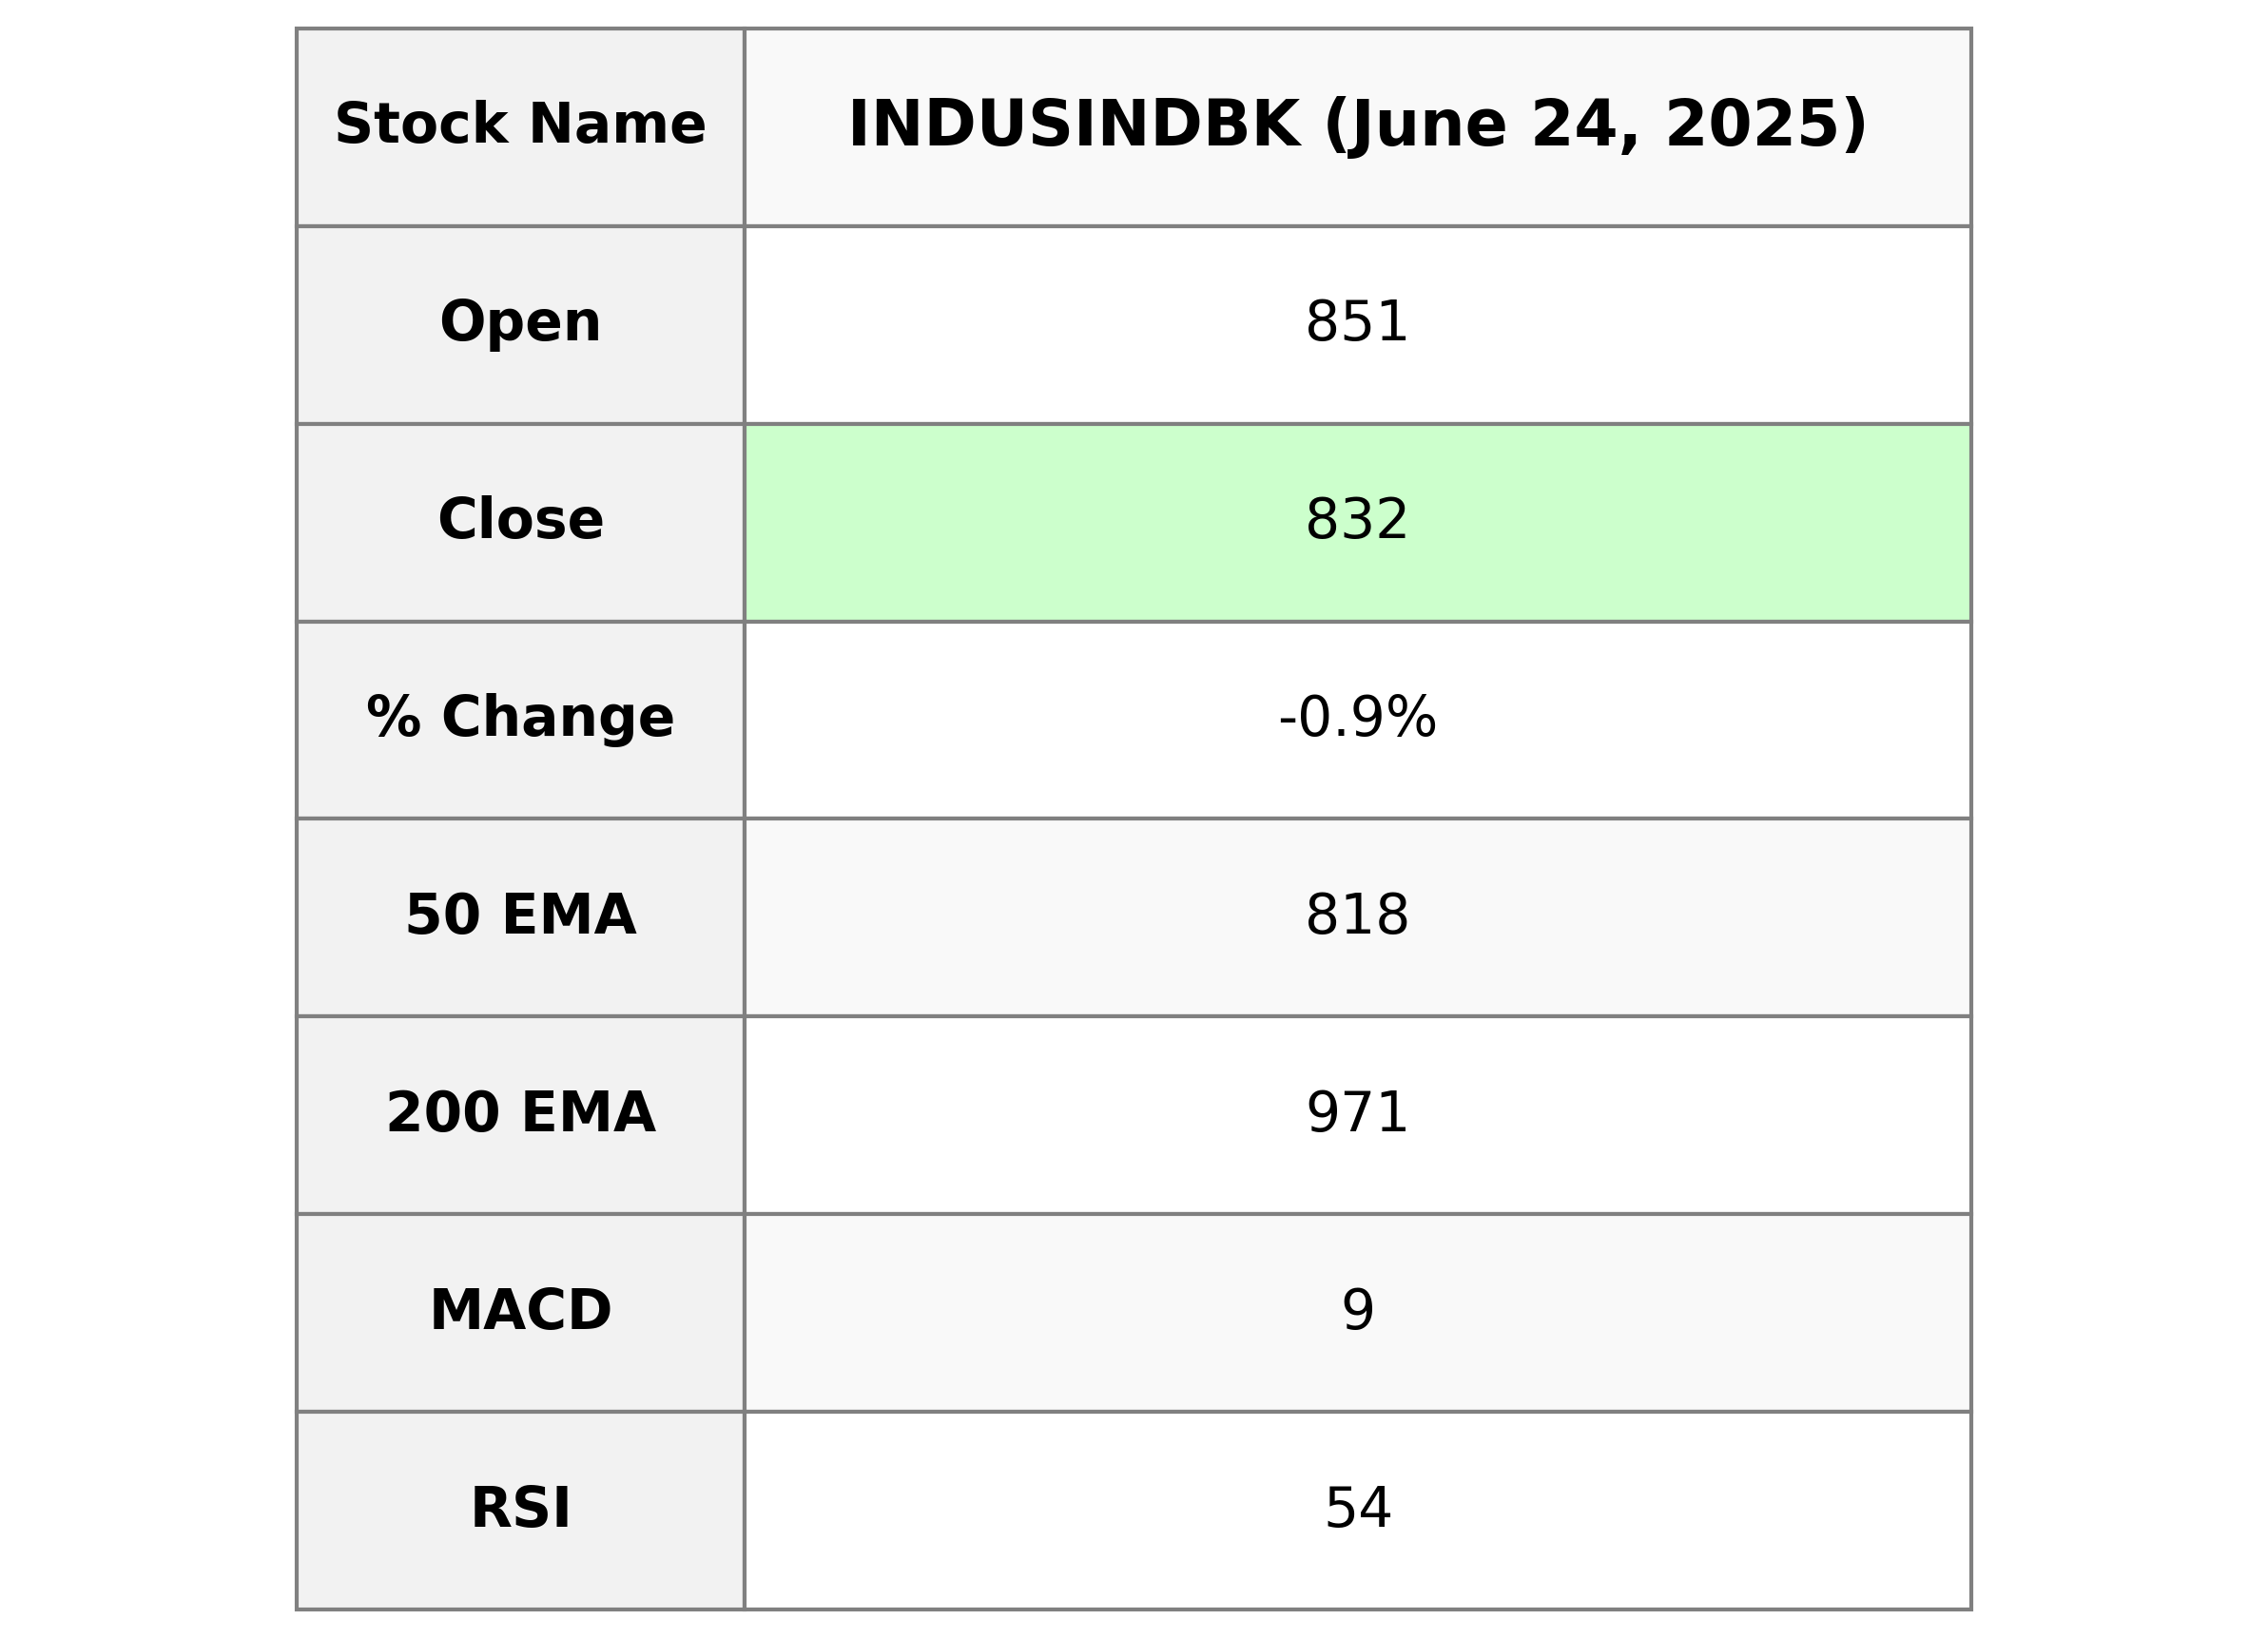
IndusInd Bank's recent trading data shows a decrease in its stock price with a close of 831.95 compared to the previous close of 839.90, marking a percentage change of -0.95%. The daily trading volume was 5,482,003. The stock also trades below its 200-day EMA of 971.03 but is above the 50-day EMA of 818.28, suggesting mixed momentum. The RSI value of 53.82 indicates a relatively neutral condition in terms of overbought or oversold status.
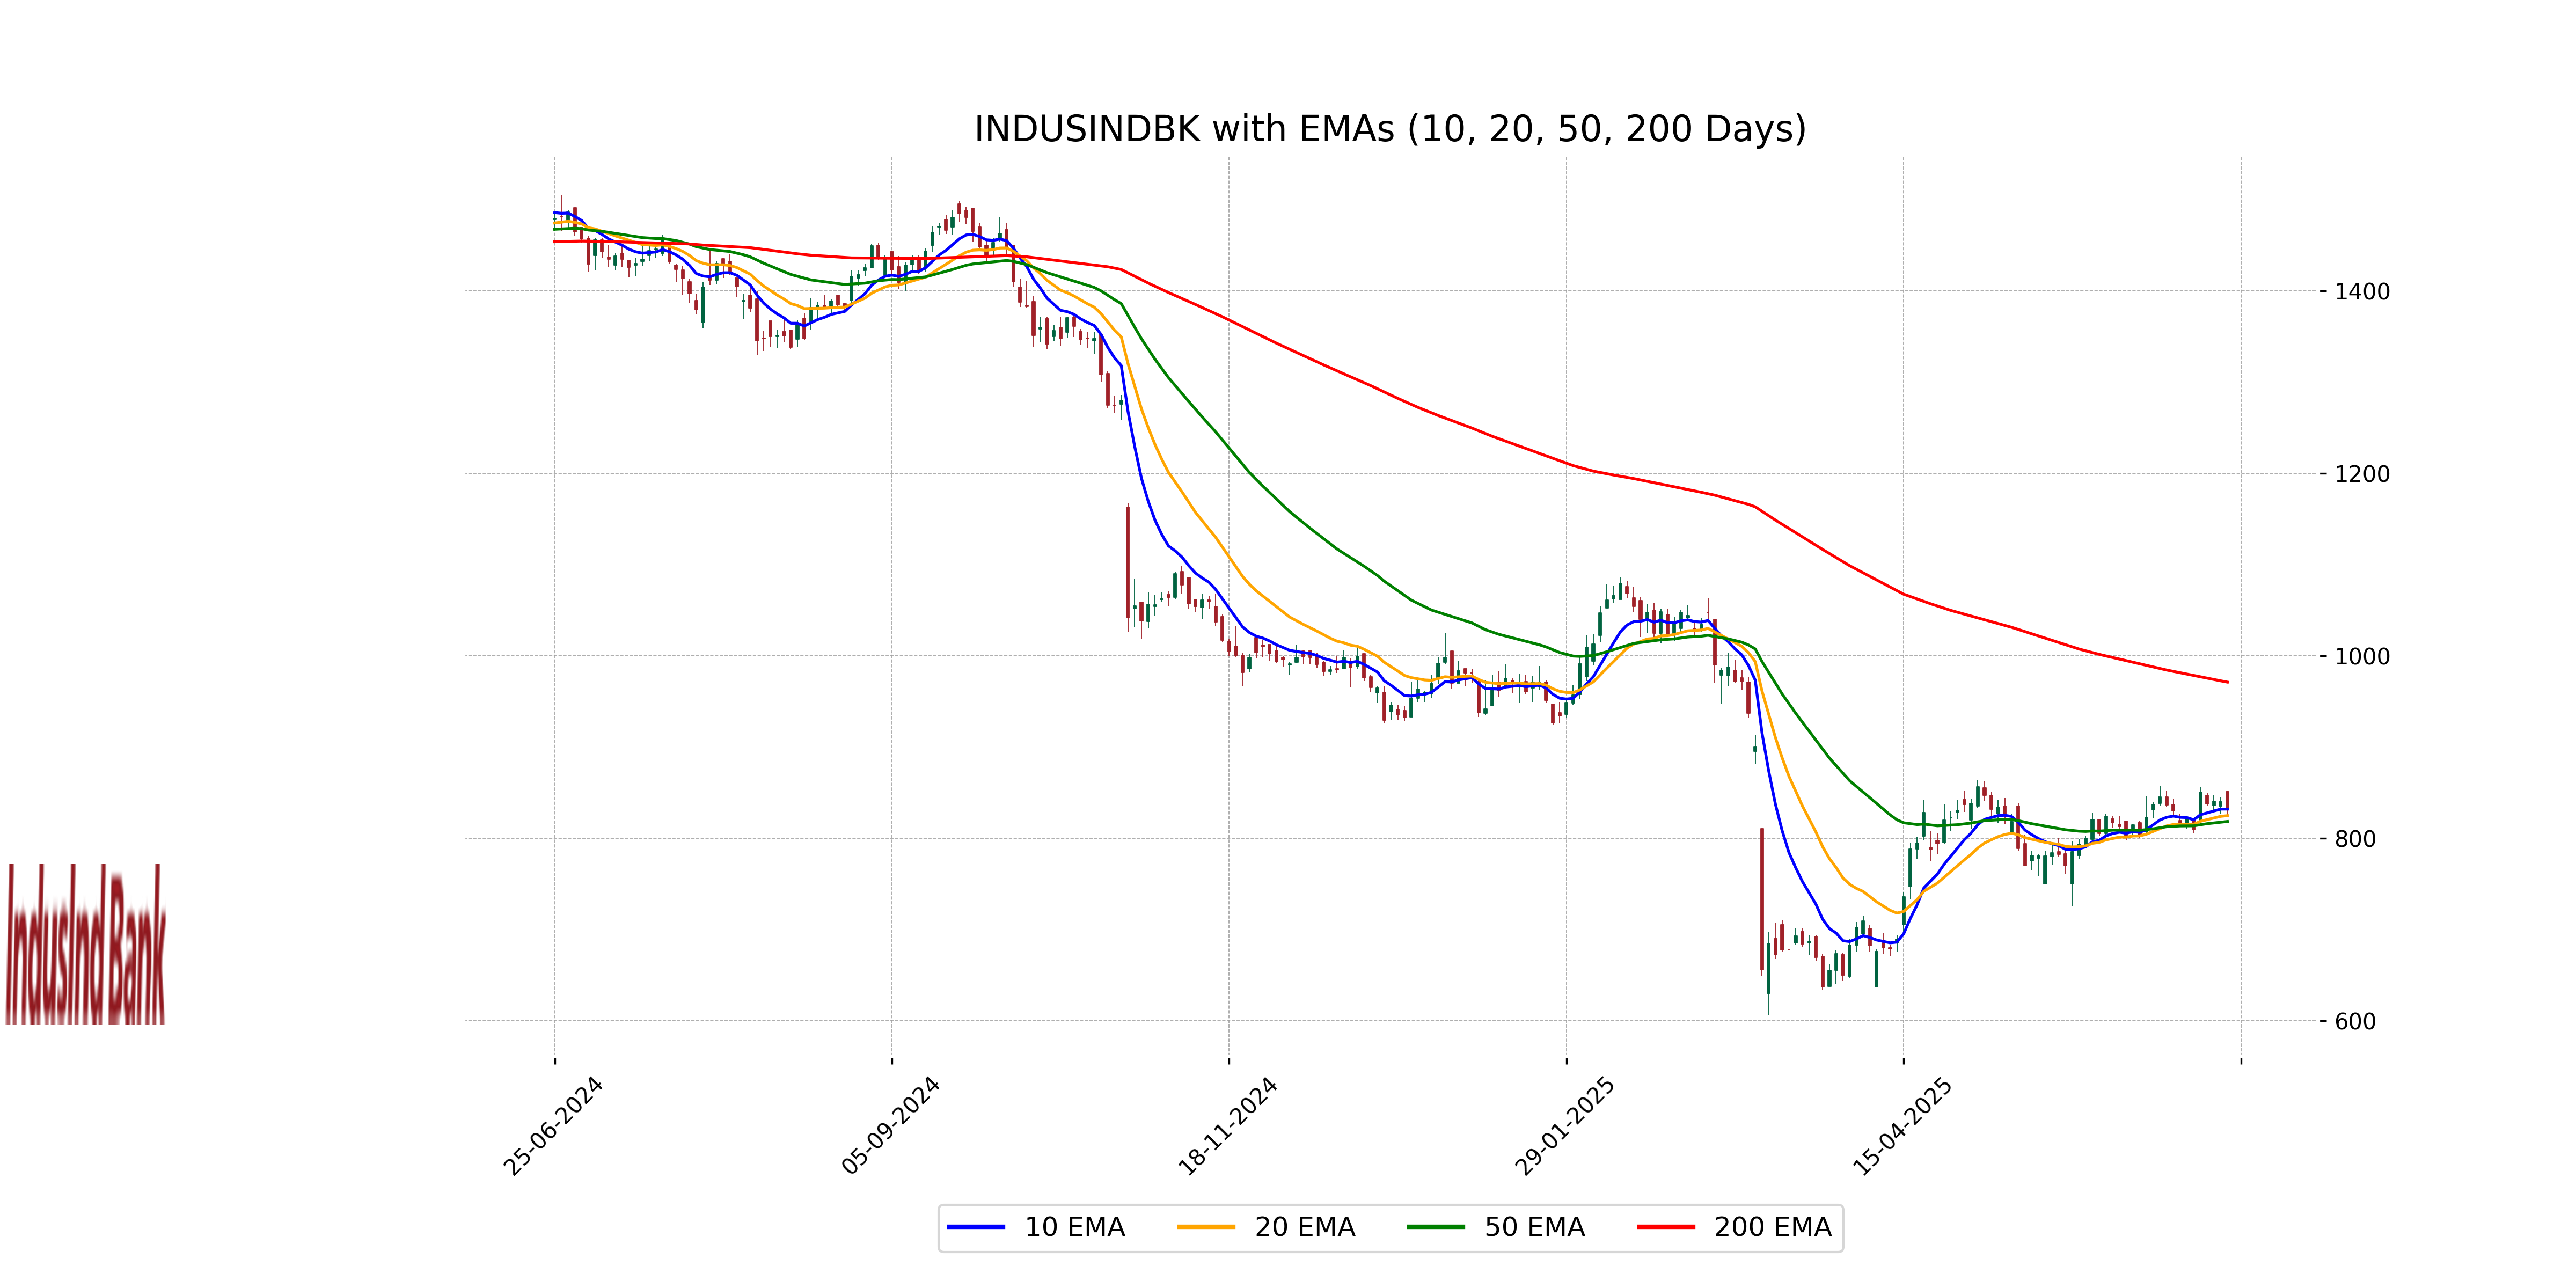
Relationship with Key Moving Averages
IndusInd Bank is trading slightly below its 50-day EMA of 818.28 but notably under its 200-day EMA of 971.03, showing a bearish trend over a longer term. However, it remains above its 10-day EMA of 831.87, indicating short-term stability.
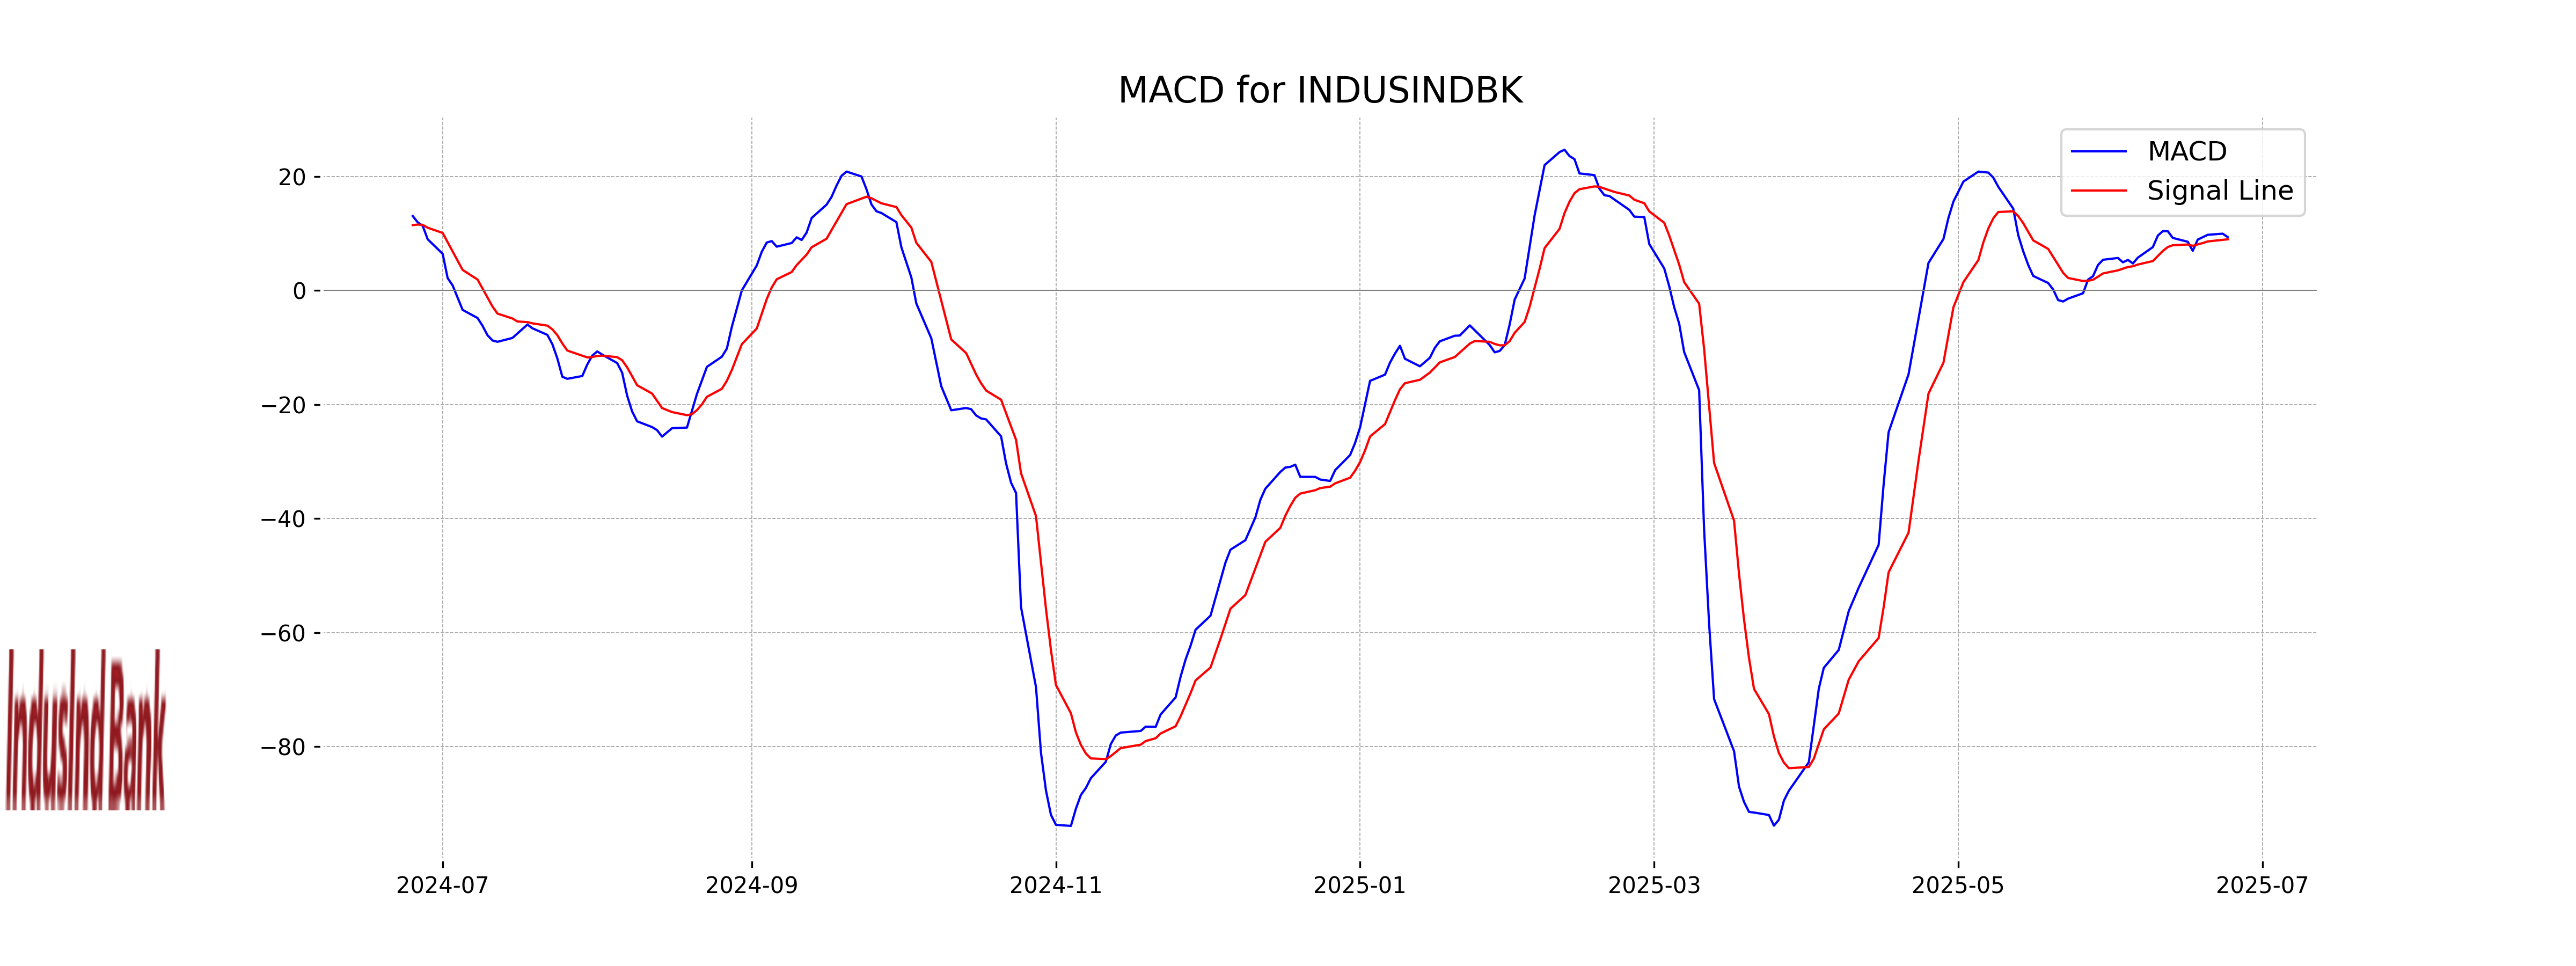
Moving Averages Trend (MACD)
IndusInd Bank's MACD is at 9.38, slightly above the Signal line at 8.98, indicating a potential bullish sentiment as the MACD line is trending upwards. This suggests that there may be an opportunity for momentum if the trend continues to strengthen.
RSI Analysis
RSI Analysis for IndusInd Bank: With an RSI of 53.82, IndusInd Bank is in a neutral zone, indicating neither overbought nor oversold conditions. This suggests that the stock may experience more stable price movements, as it is not currently at risk of significant market-driven volatility.
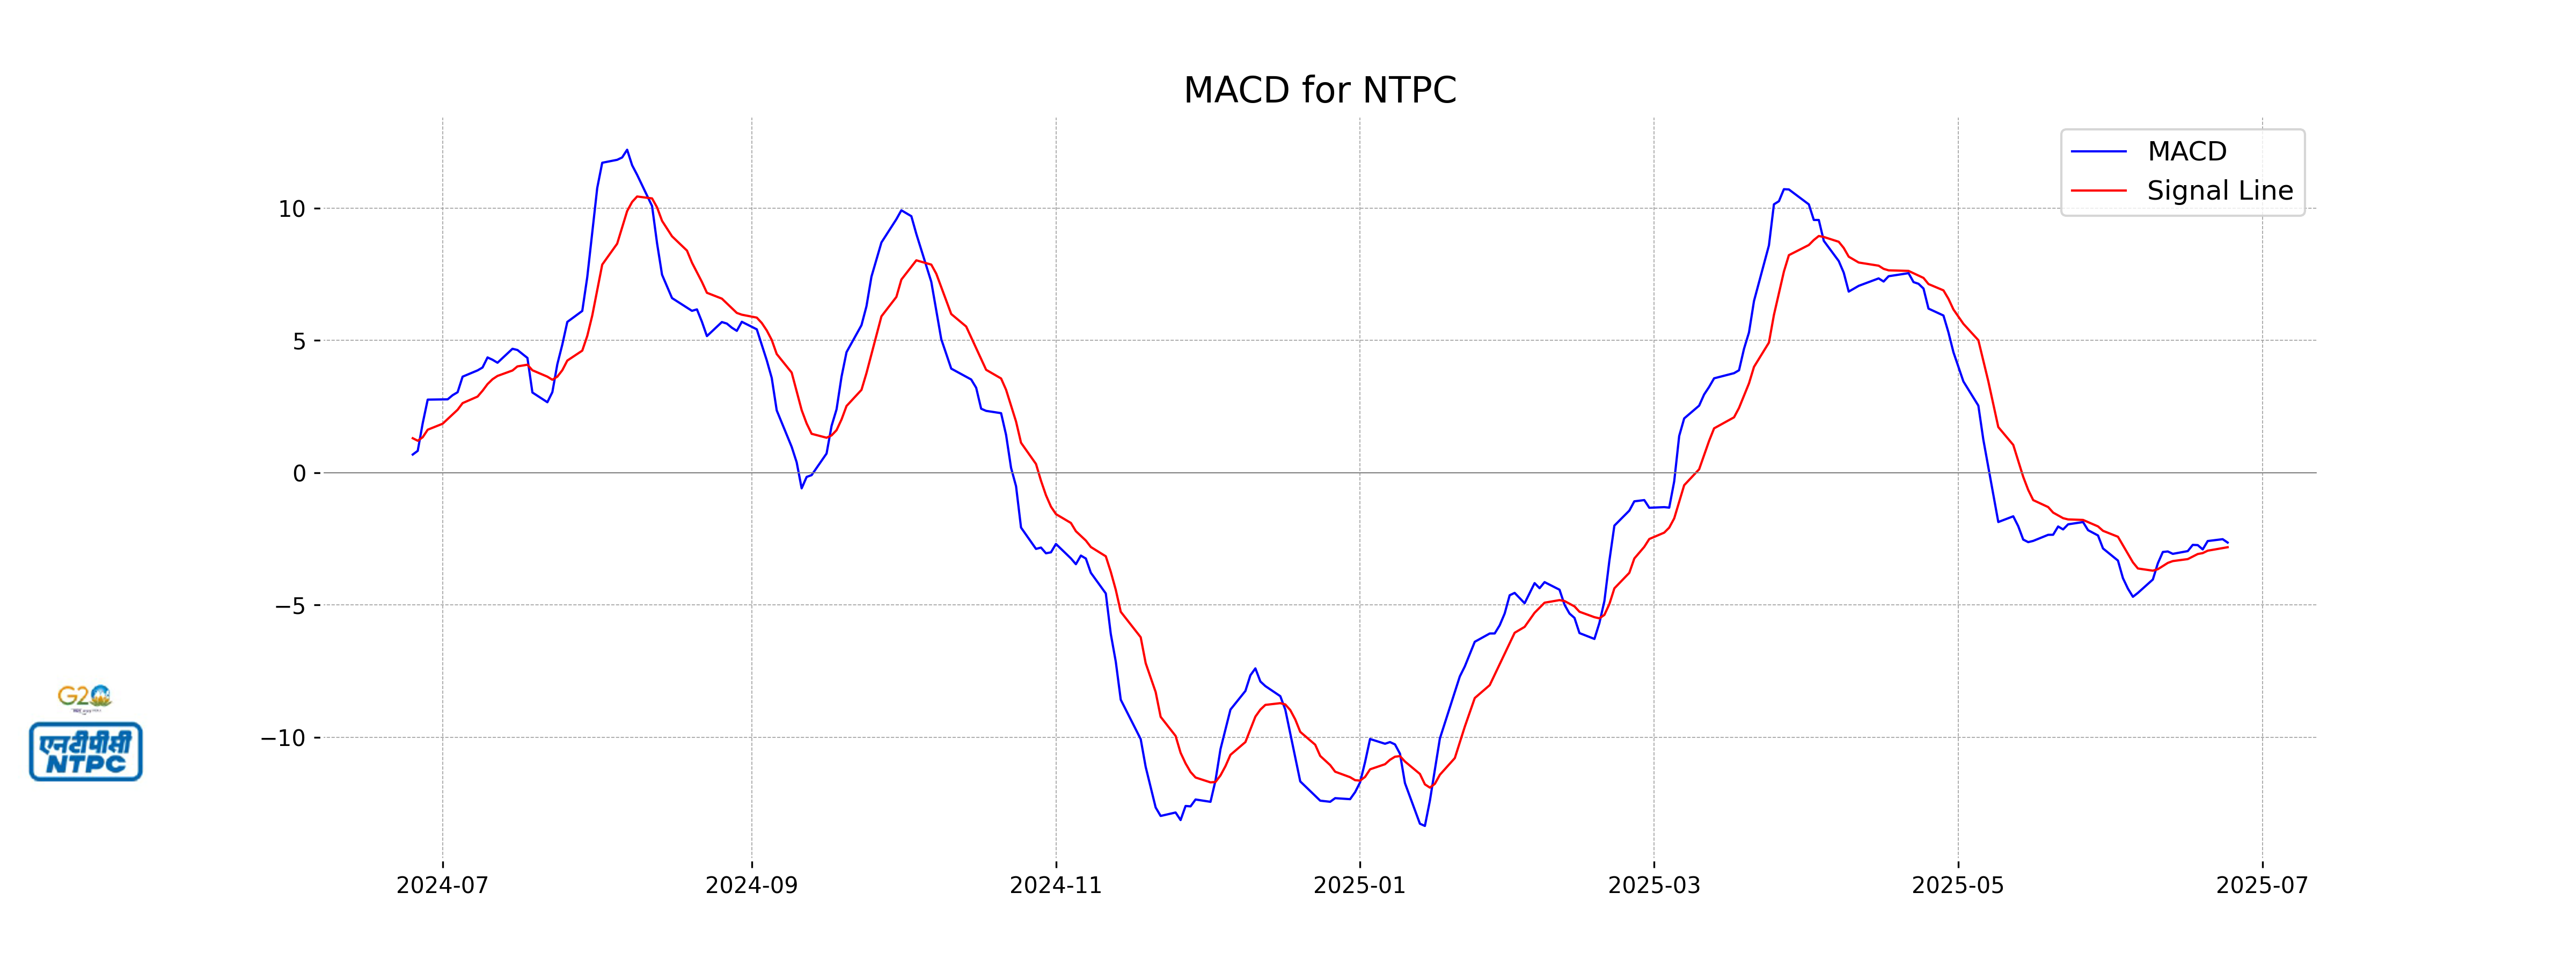
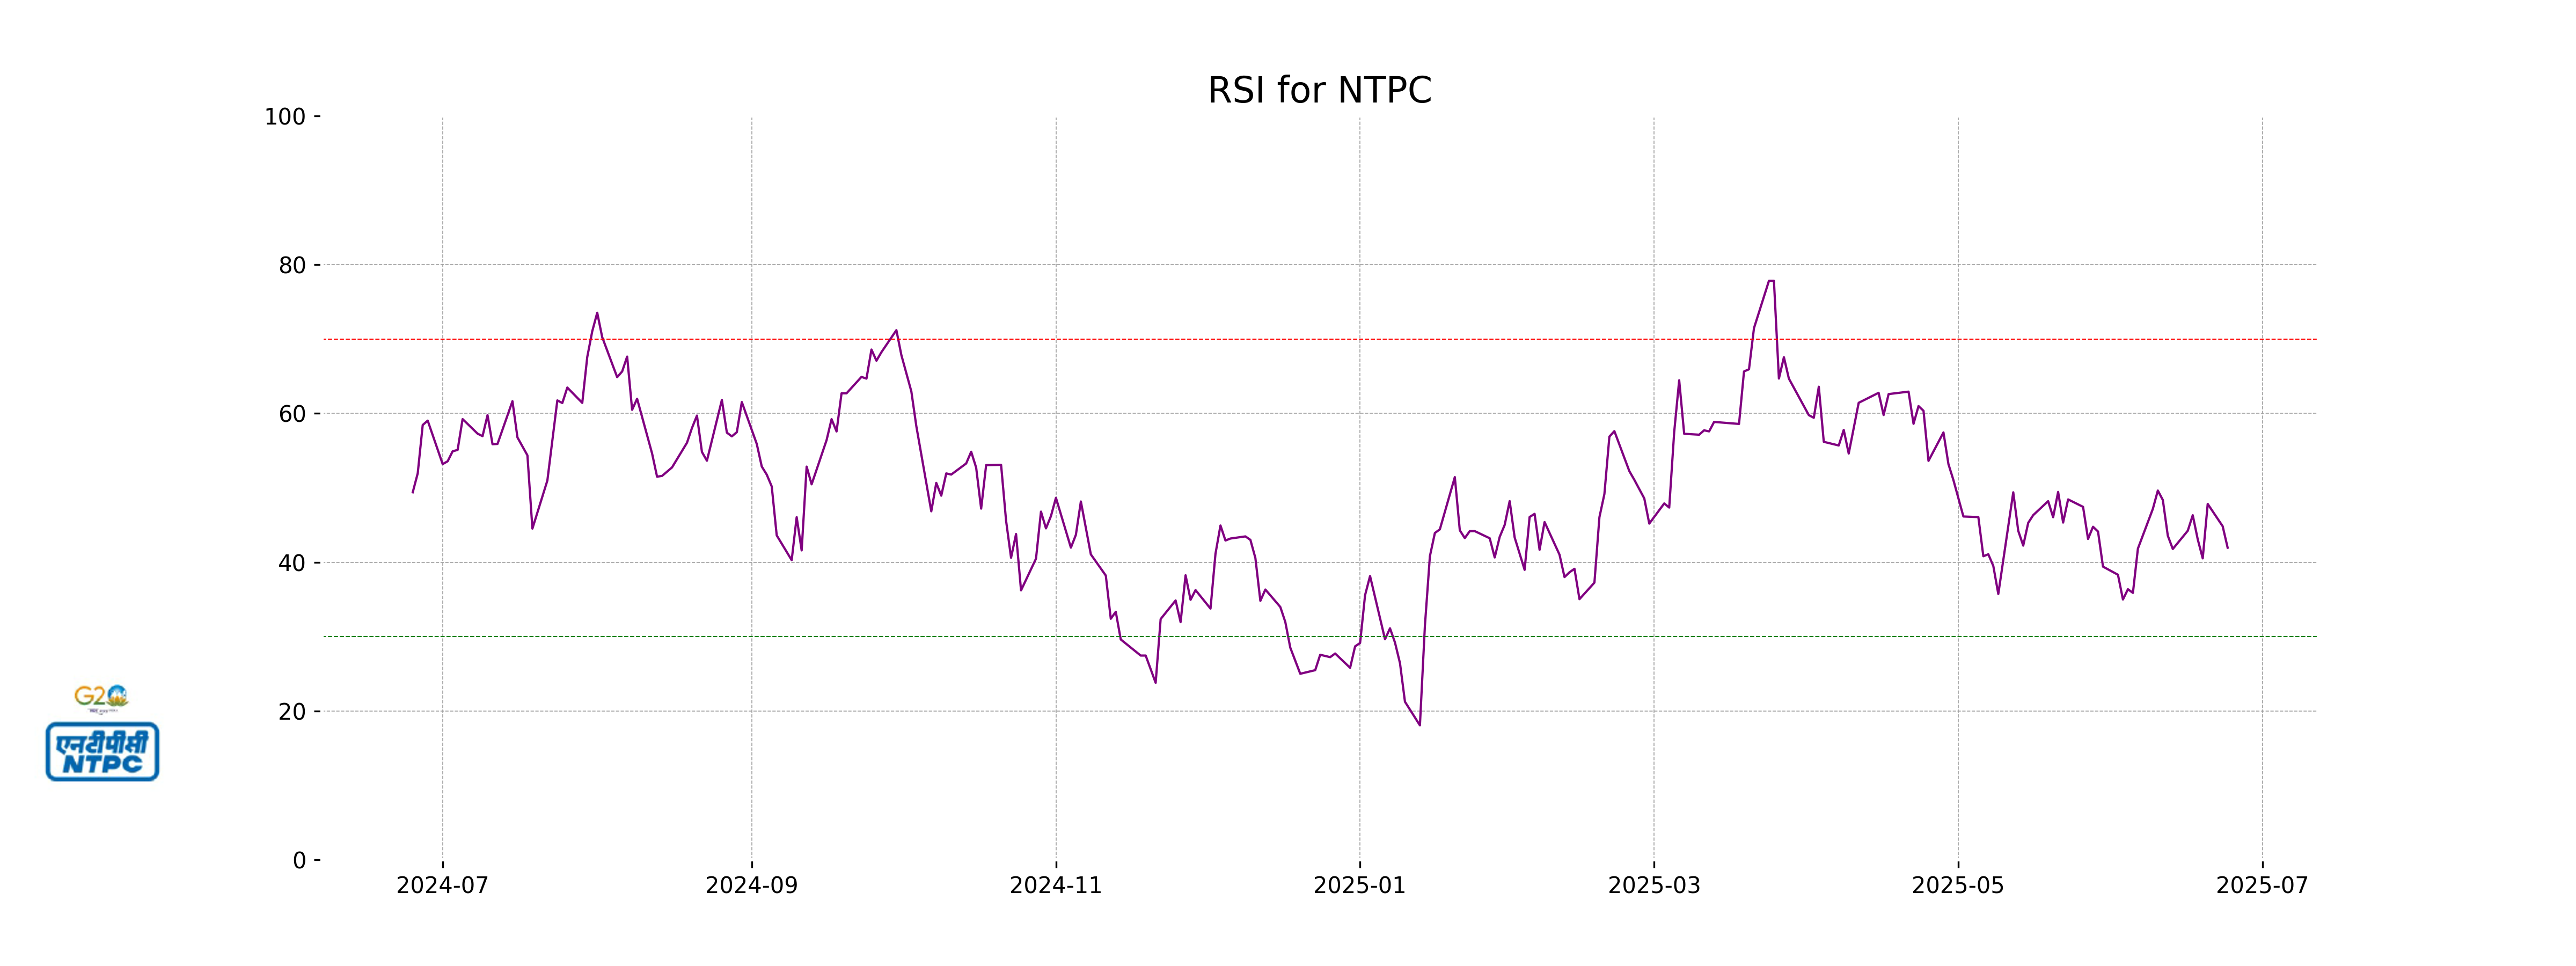
Analysis for NTPC - June 24, 2025
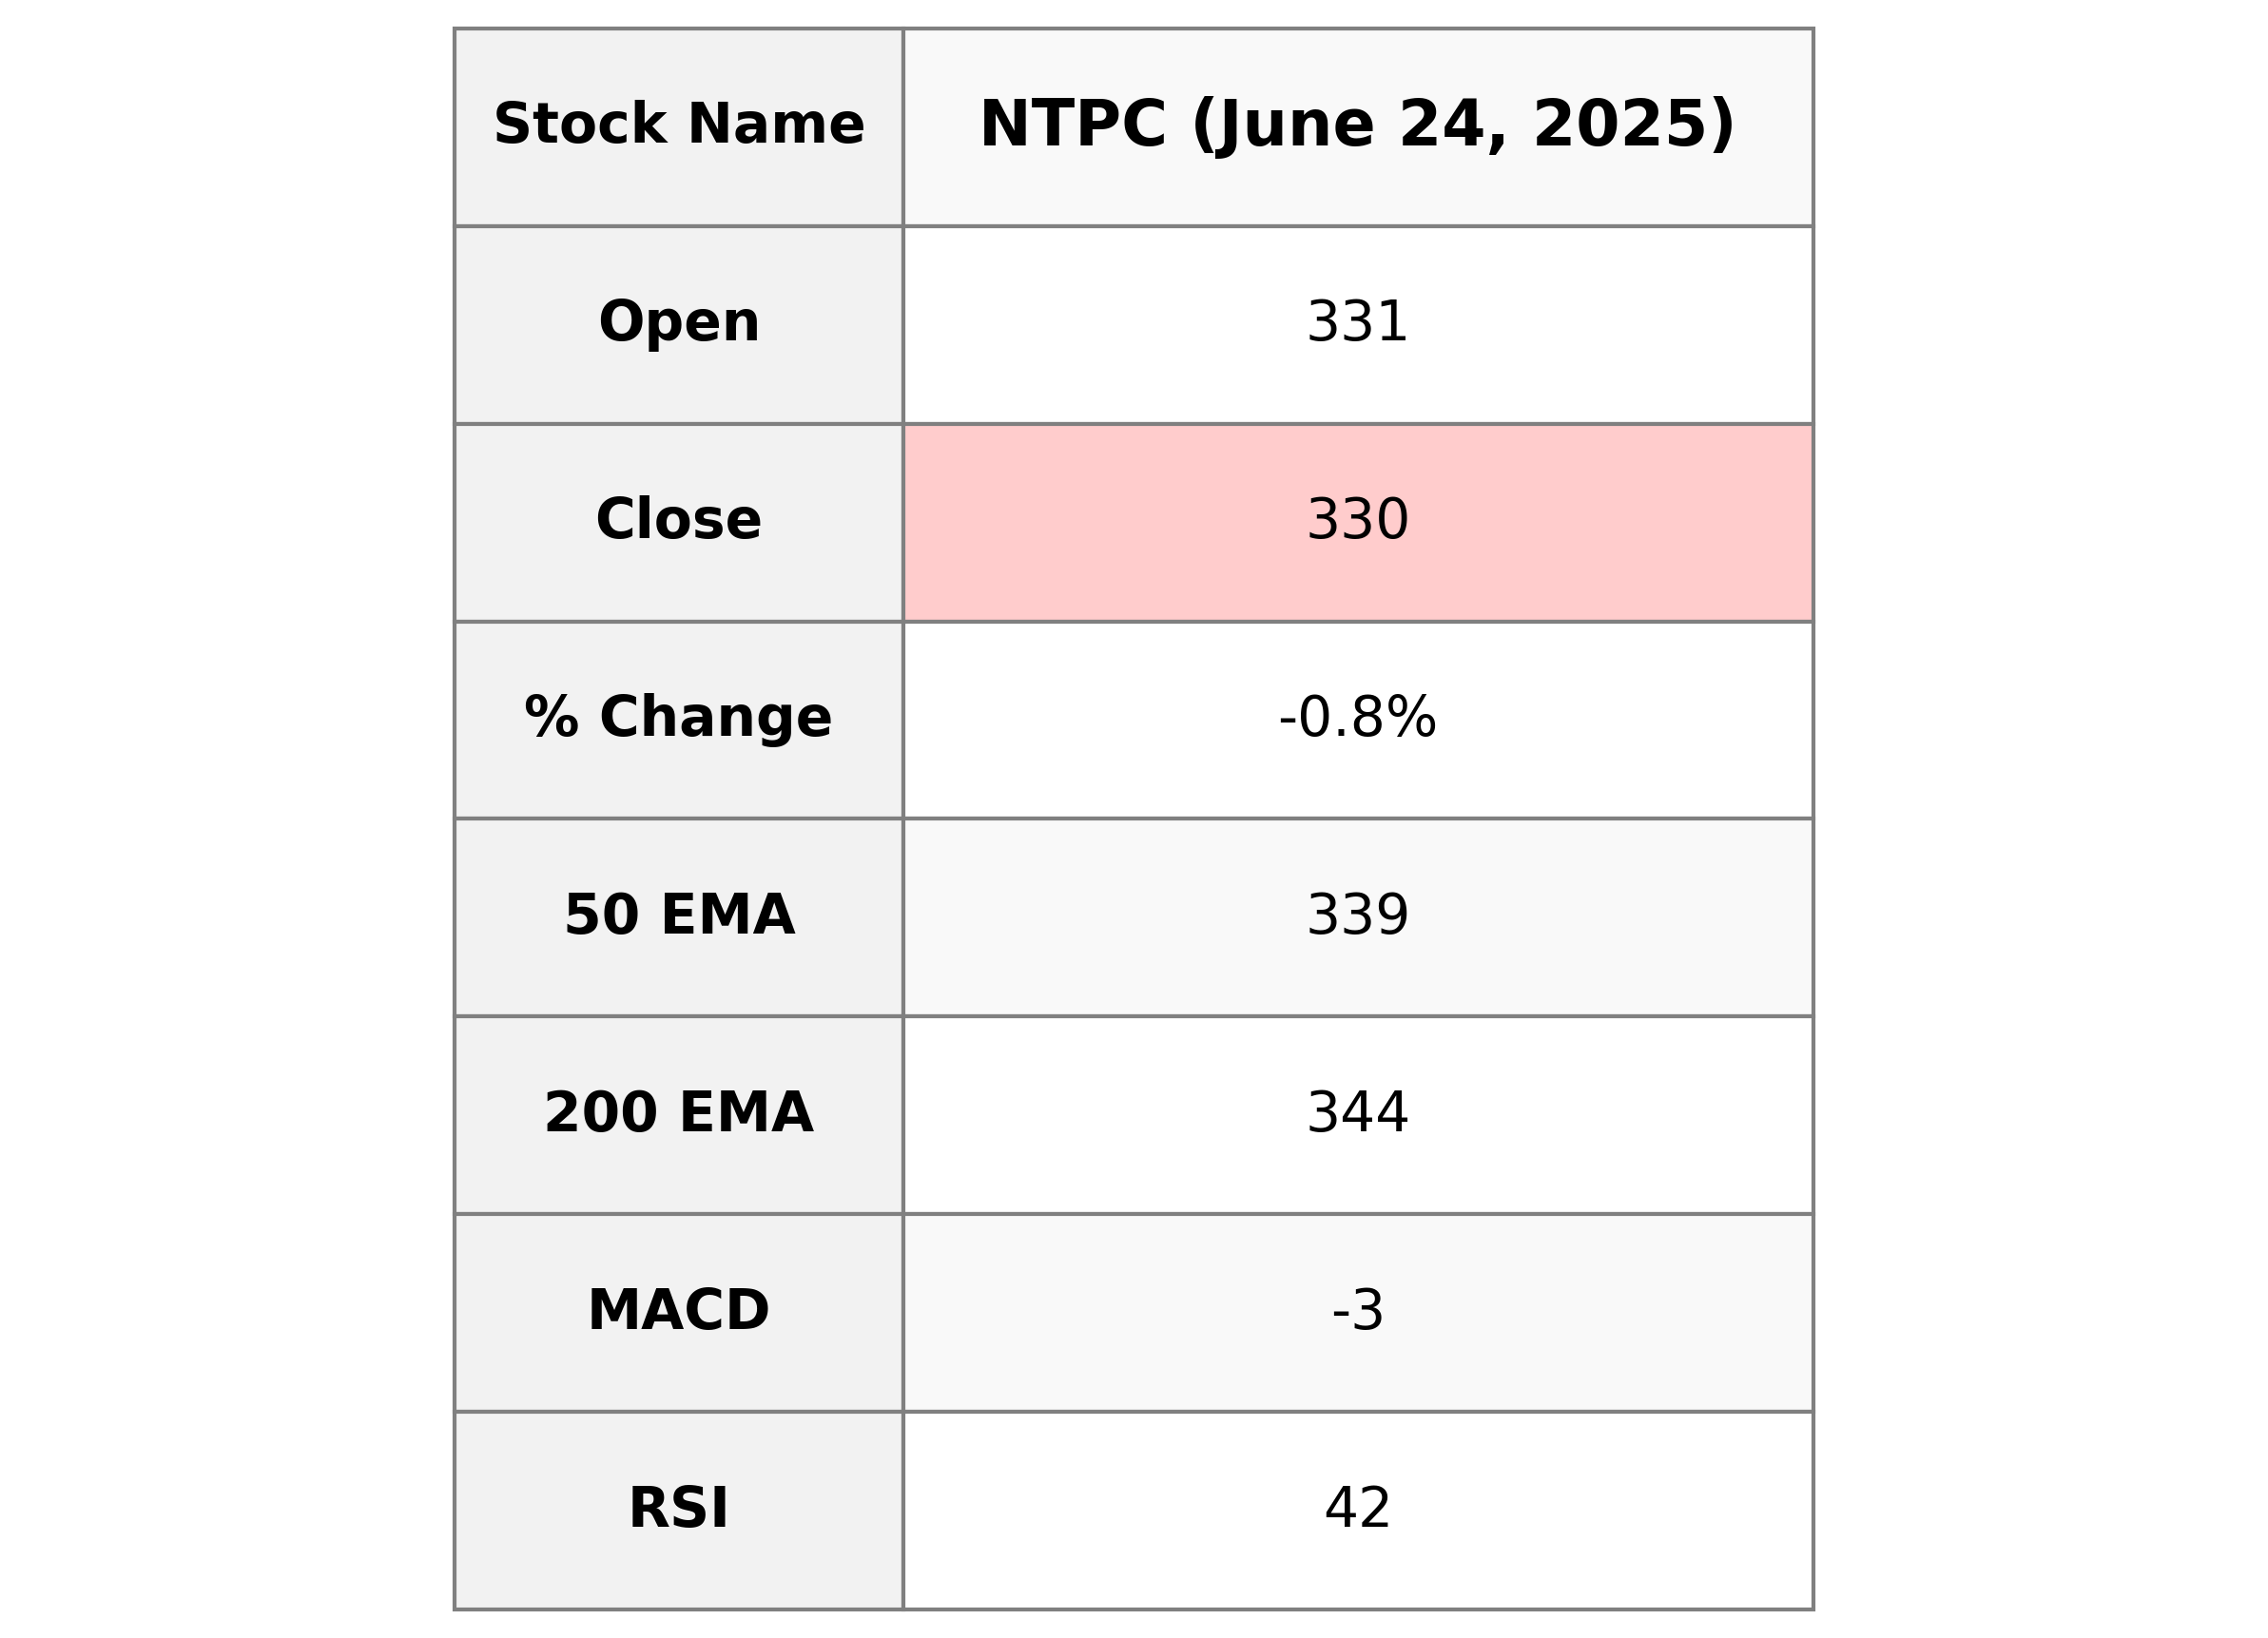
NTPC: NTPC's stock has experienced a slight decline, with the close price at 329.95, marking a -0.80% change from the previous close of 332.60. The trading volume was substantial at 100,814,404 shares. The stock's performance indicators, such as the RSI, suggest a fairly neutral to slightly oversold condition, with the MACD indicating a bearish trend. Despite this, NTPC remains a key player in the Utilities sector with a solid market cap.
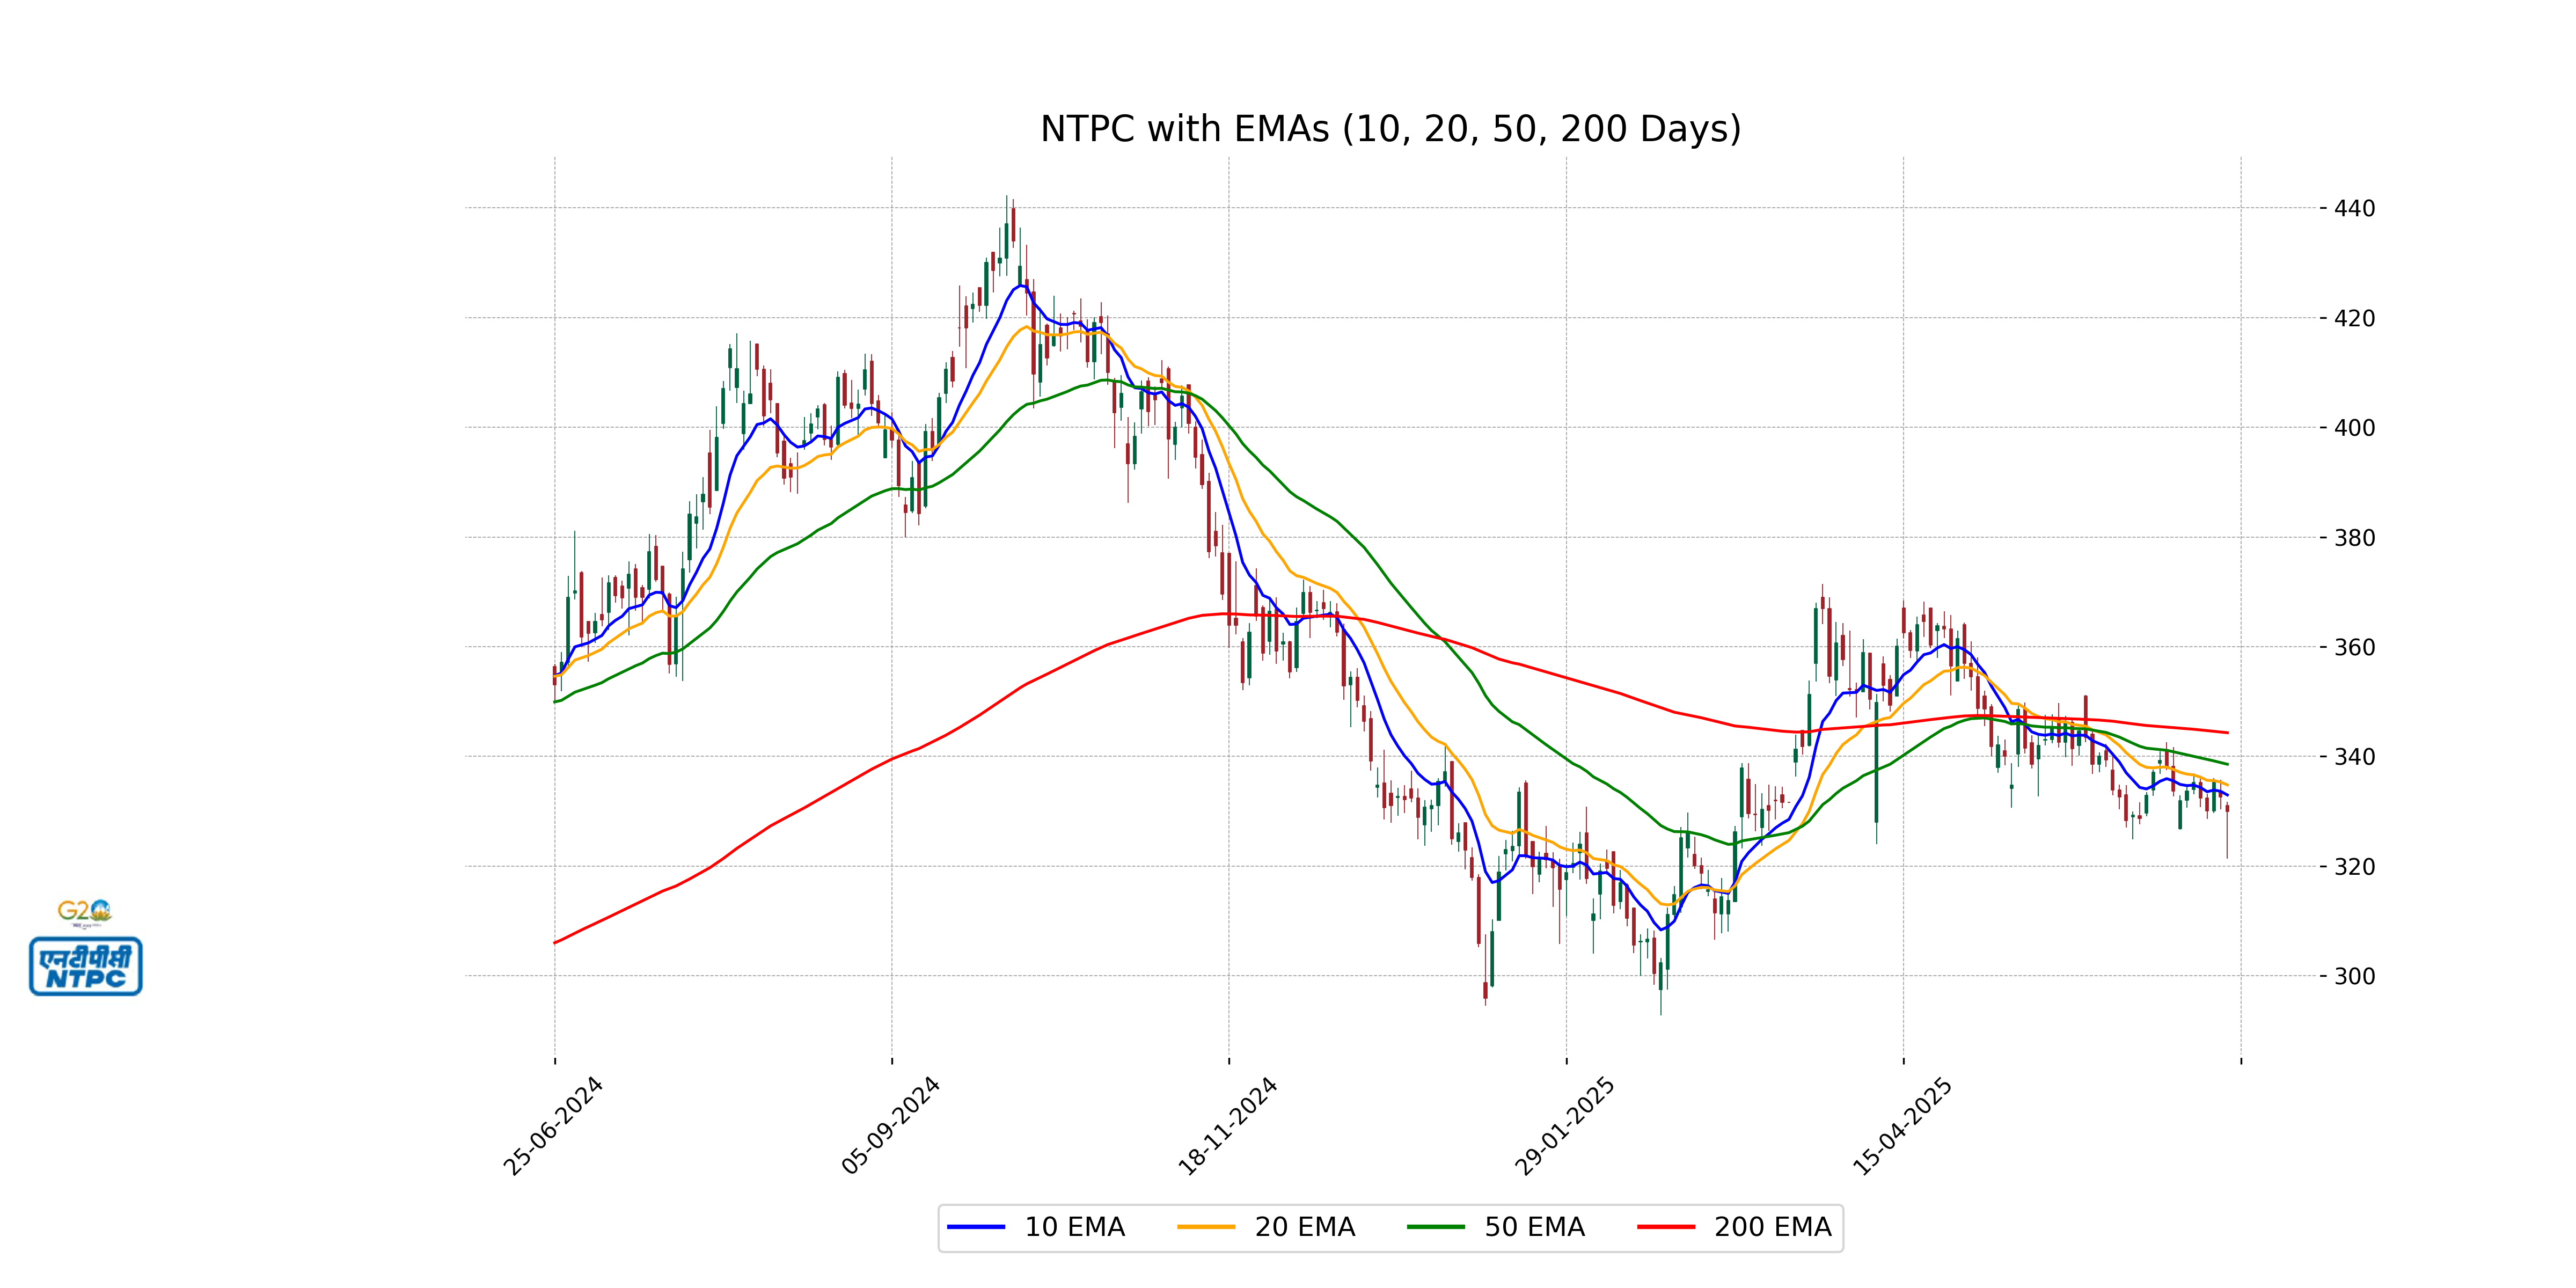
Relationship with Key Moving Averages
NTPC's current closing price is below its 50-day and 200-day EMAs, indicating a potential bearish trend. It is also below the 10-day and 20-day EMAs, suggesting short-term bearish sentiment in the stock.
Moving Averages Trend (MACD)
The MACD for NTPC is currently -2.64, with the MACD Signal at -2.82, indicating a bearish momentum as the MACD line is below the signal line. This suggests a potential downward trend or a continuation of the current bearish trend in the stock's price.
RSI Analysis
NTPC RSI Analysis: The Relative Strength Index (RSI) for NTPC is currently at 41.95, indicating that the stock is closer to being oversold rather than overbought. Typically, an RSI below 30 suggests a stock might be oversold, while levels above 70 indicate overbought conditions. Therefore, NTPC is nearing a potential buying opportunity if the RSI continues to drop closer to or below 30.
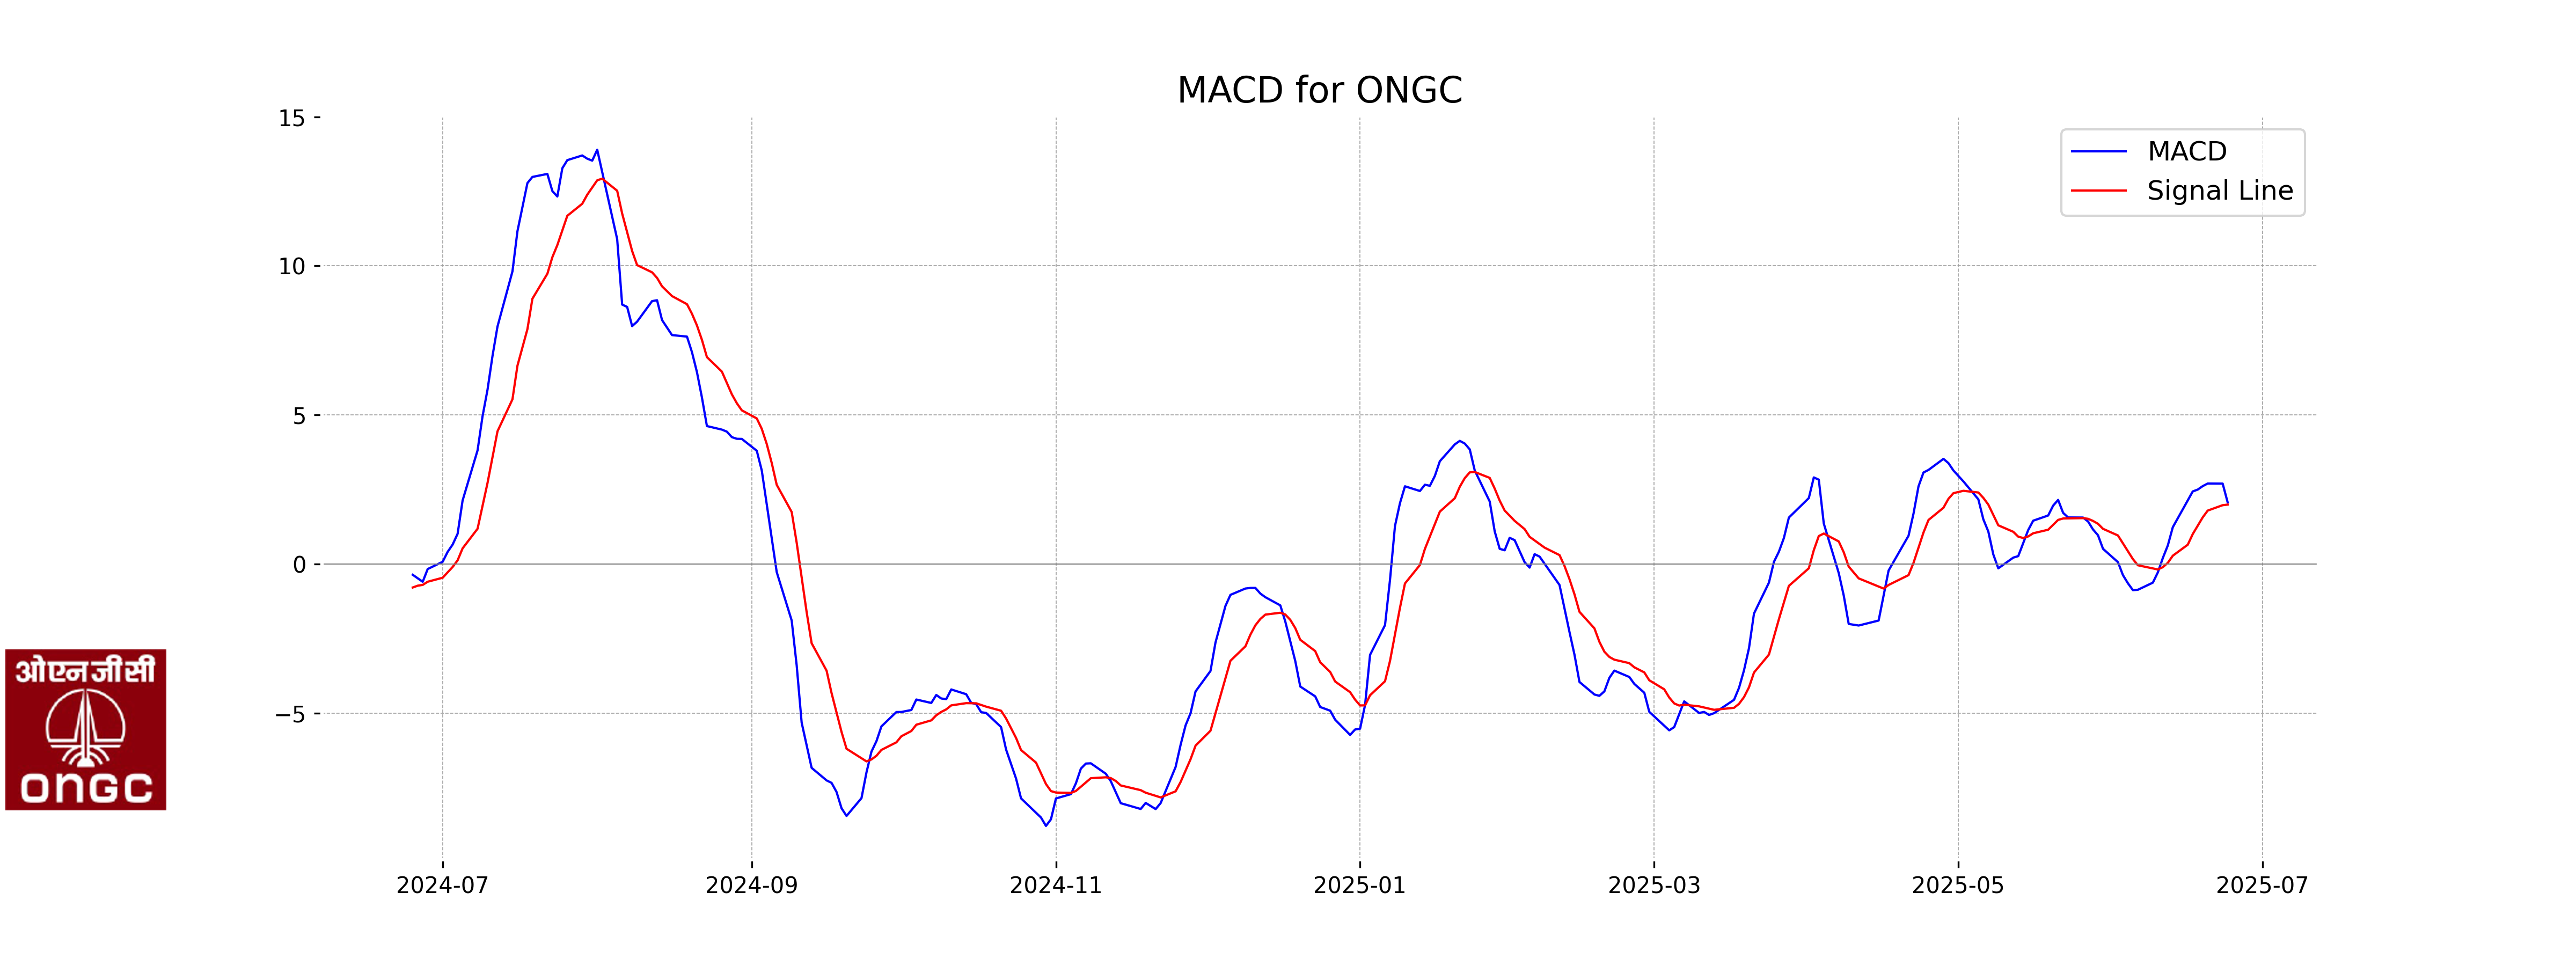
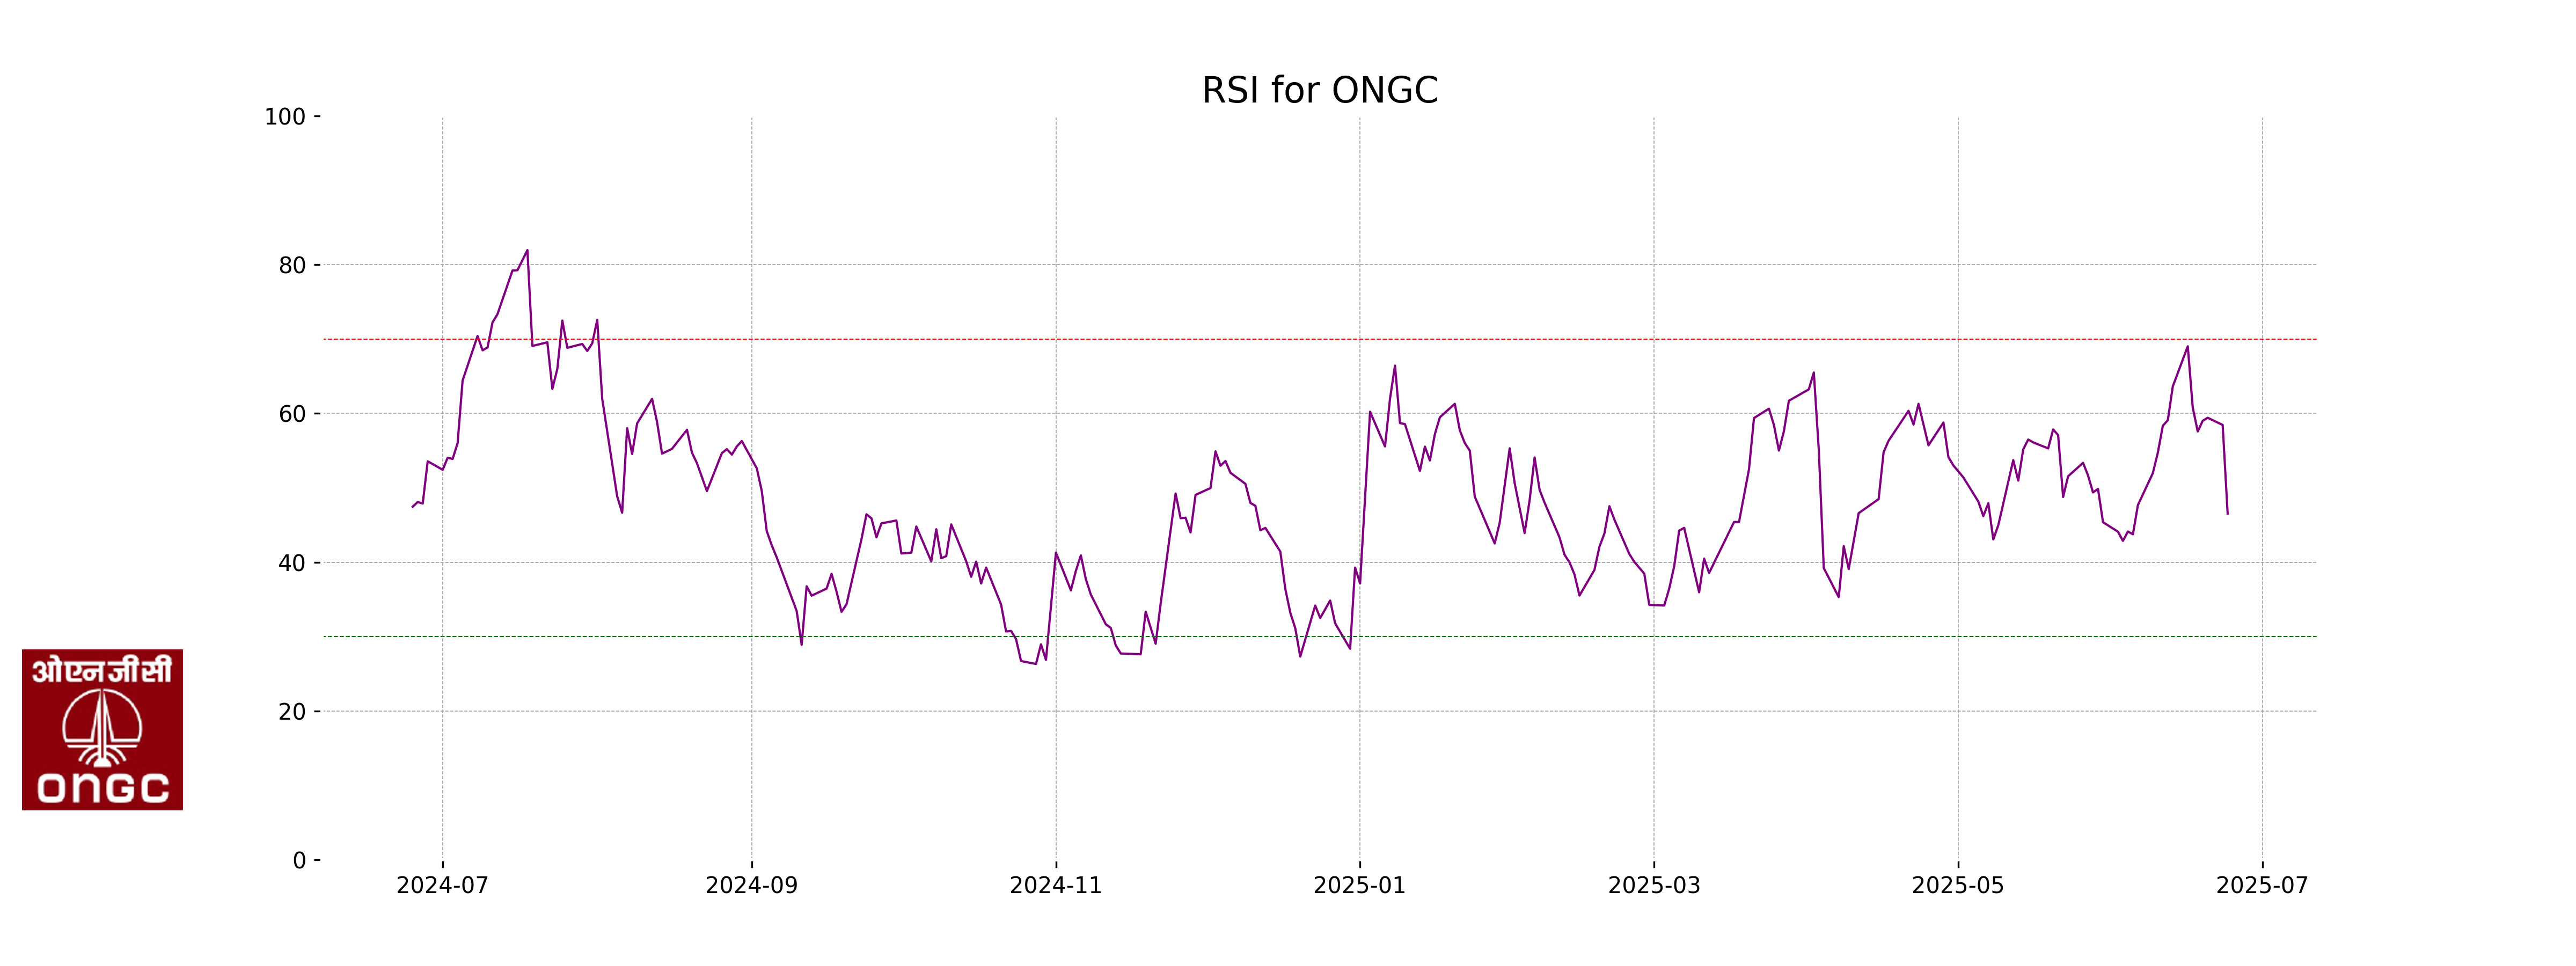
Analysis for ONGC - June 24, 2025
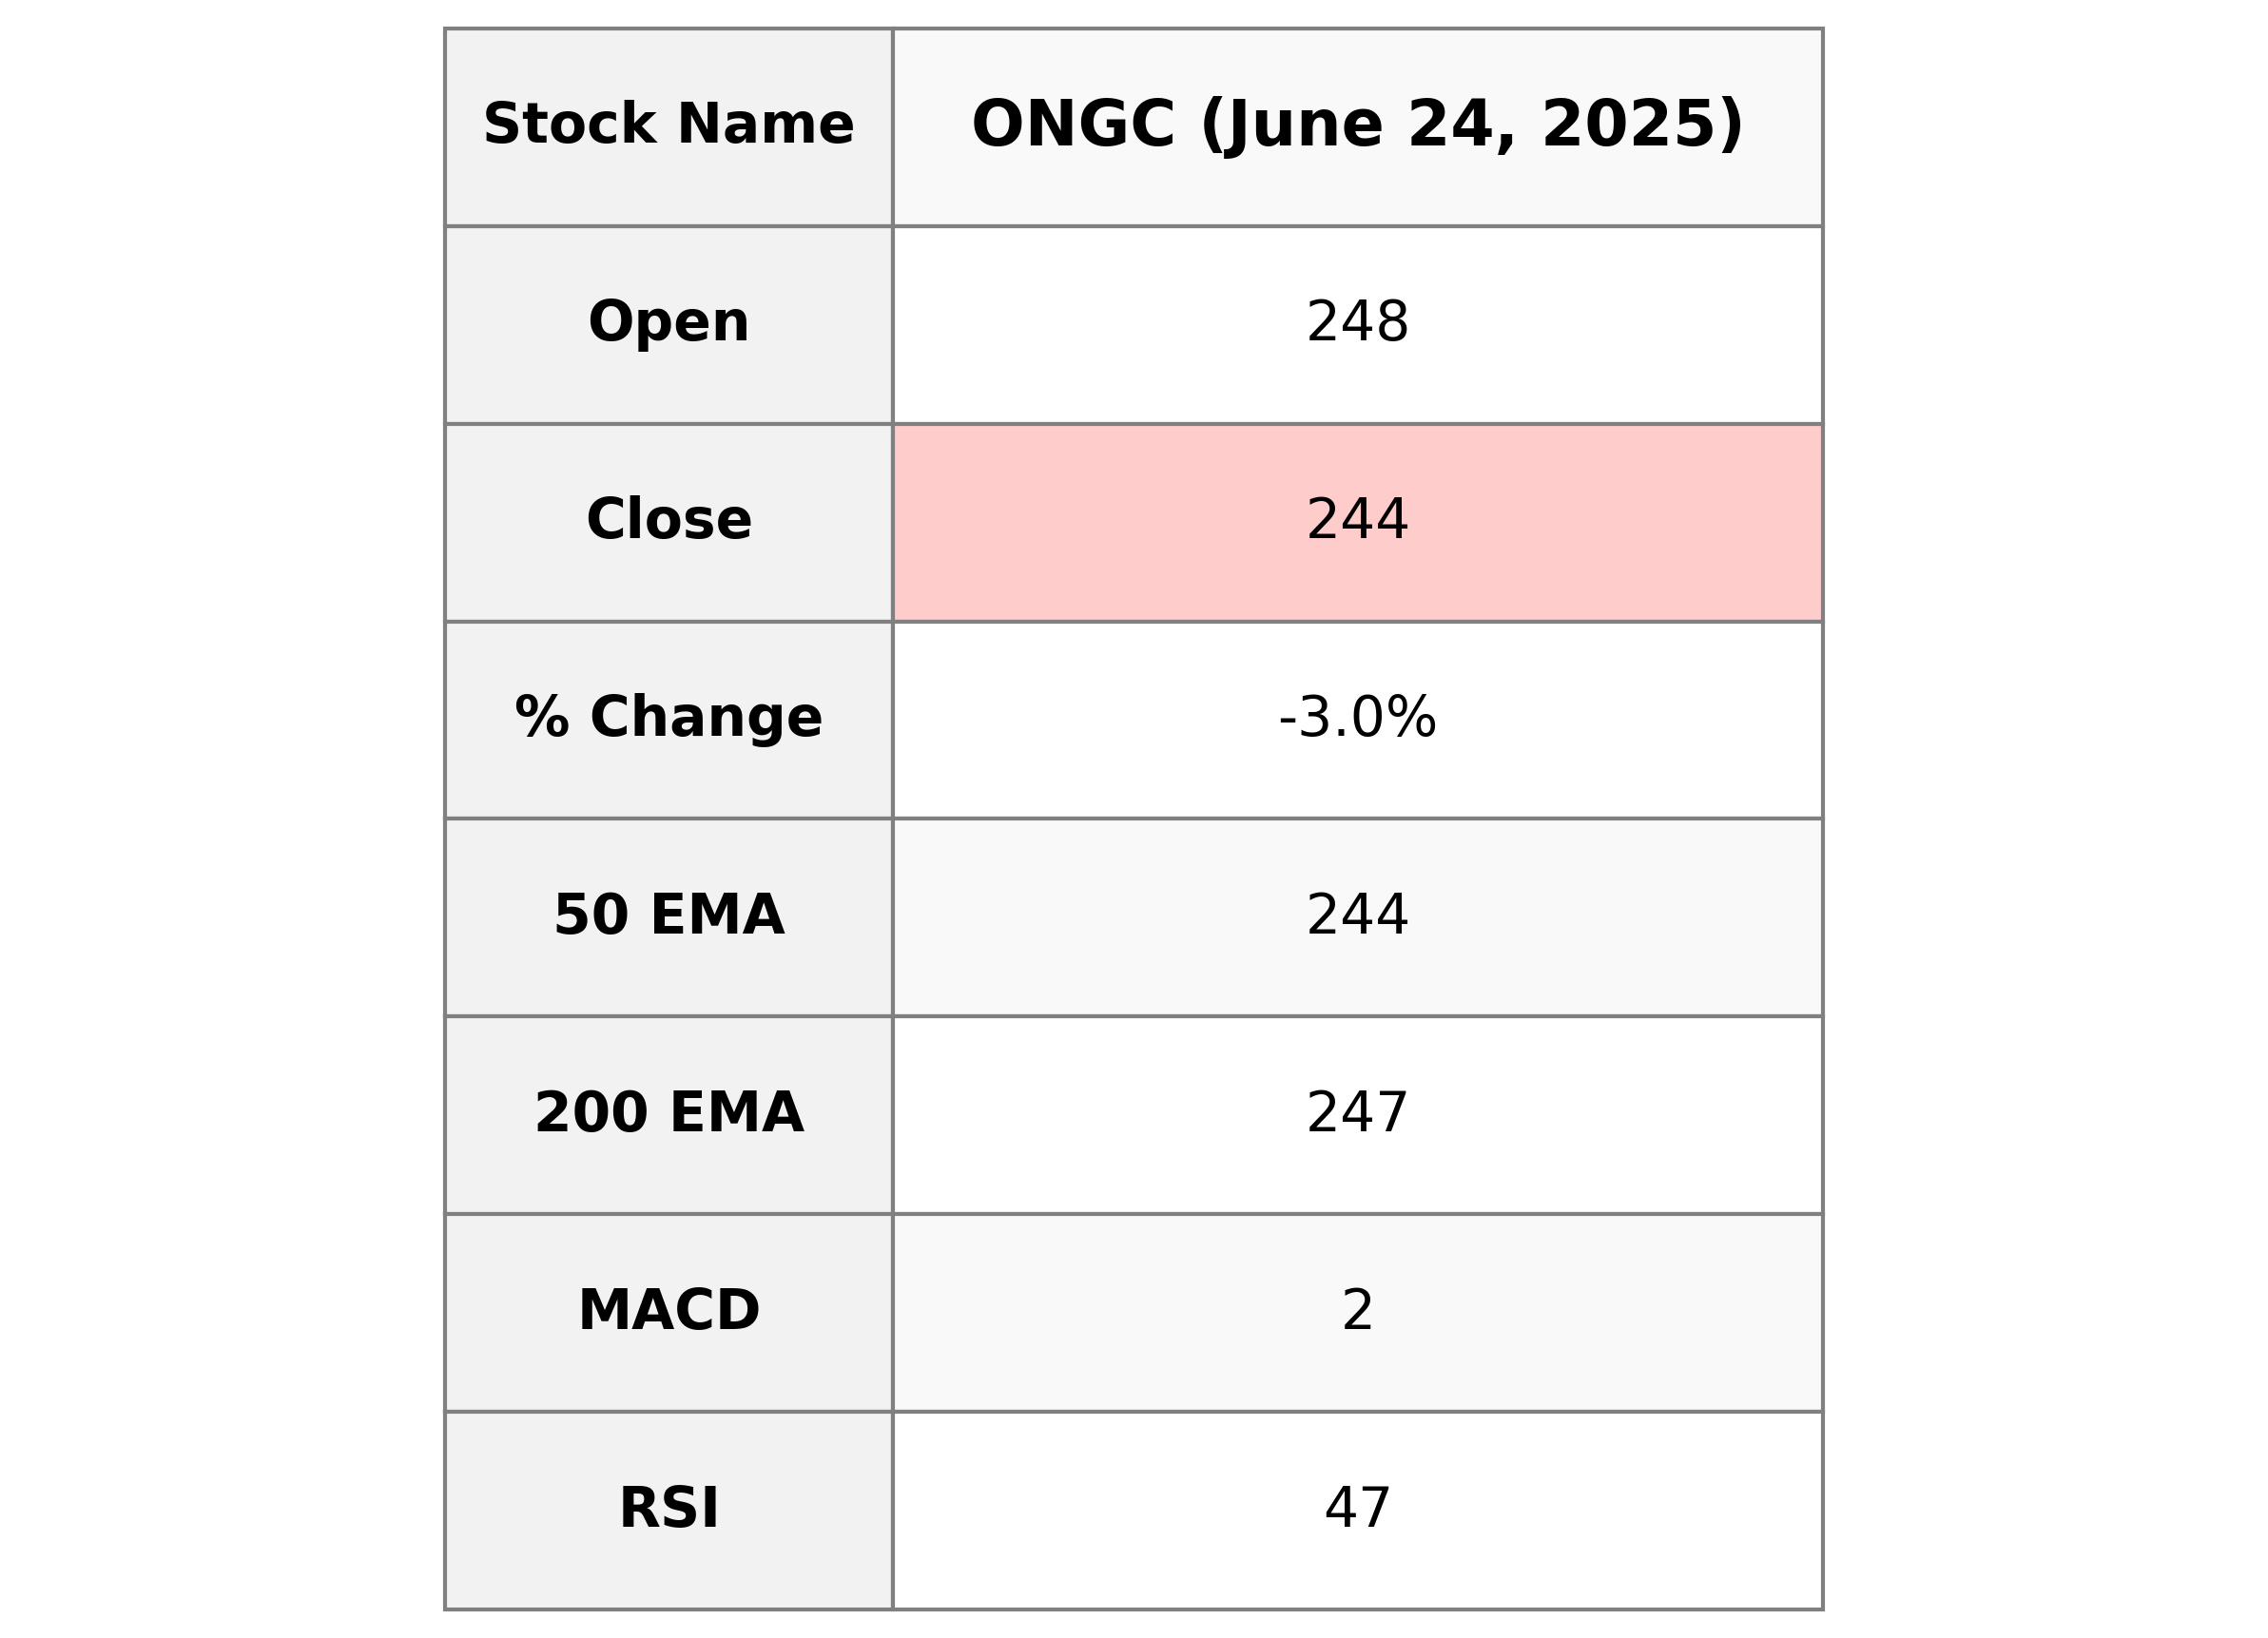
### ONGC Performance Summary ONGC experienced a decrease in stock price, closing at 243.92 with a significant drop of 2.97% from the previous close of 251.38. The Relative Strength Index (RSI) is at 46.52, suggesting a moderately weak level of buying pressure. Despite this short-term decline, its Market Cap remains robust at approximately 3,068.59 billion INR, indicating substantial market presence in the energy sector.
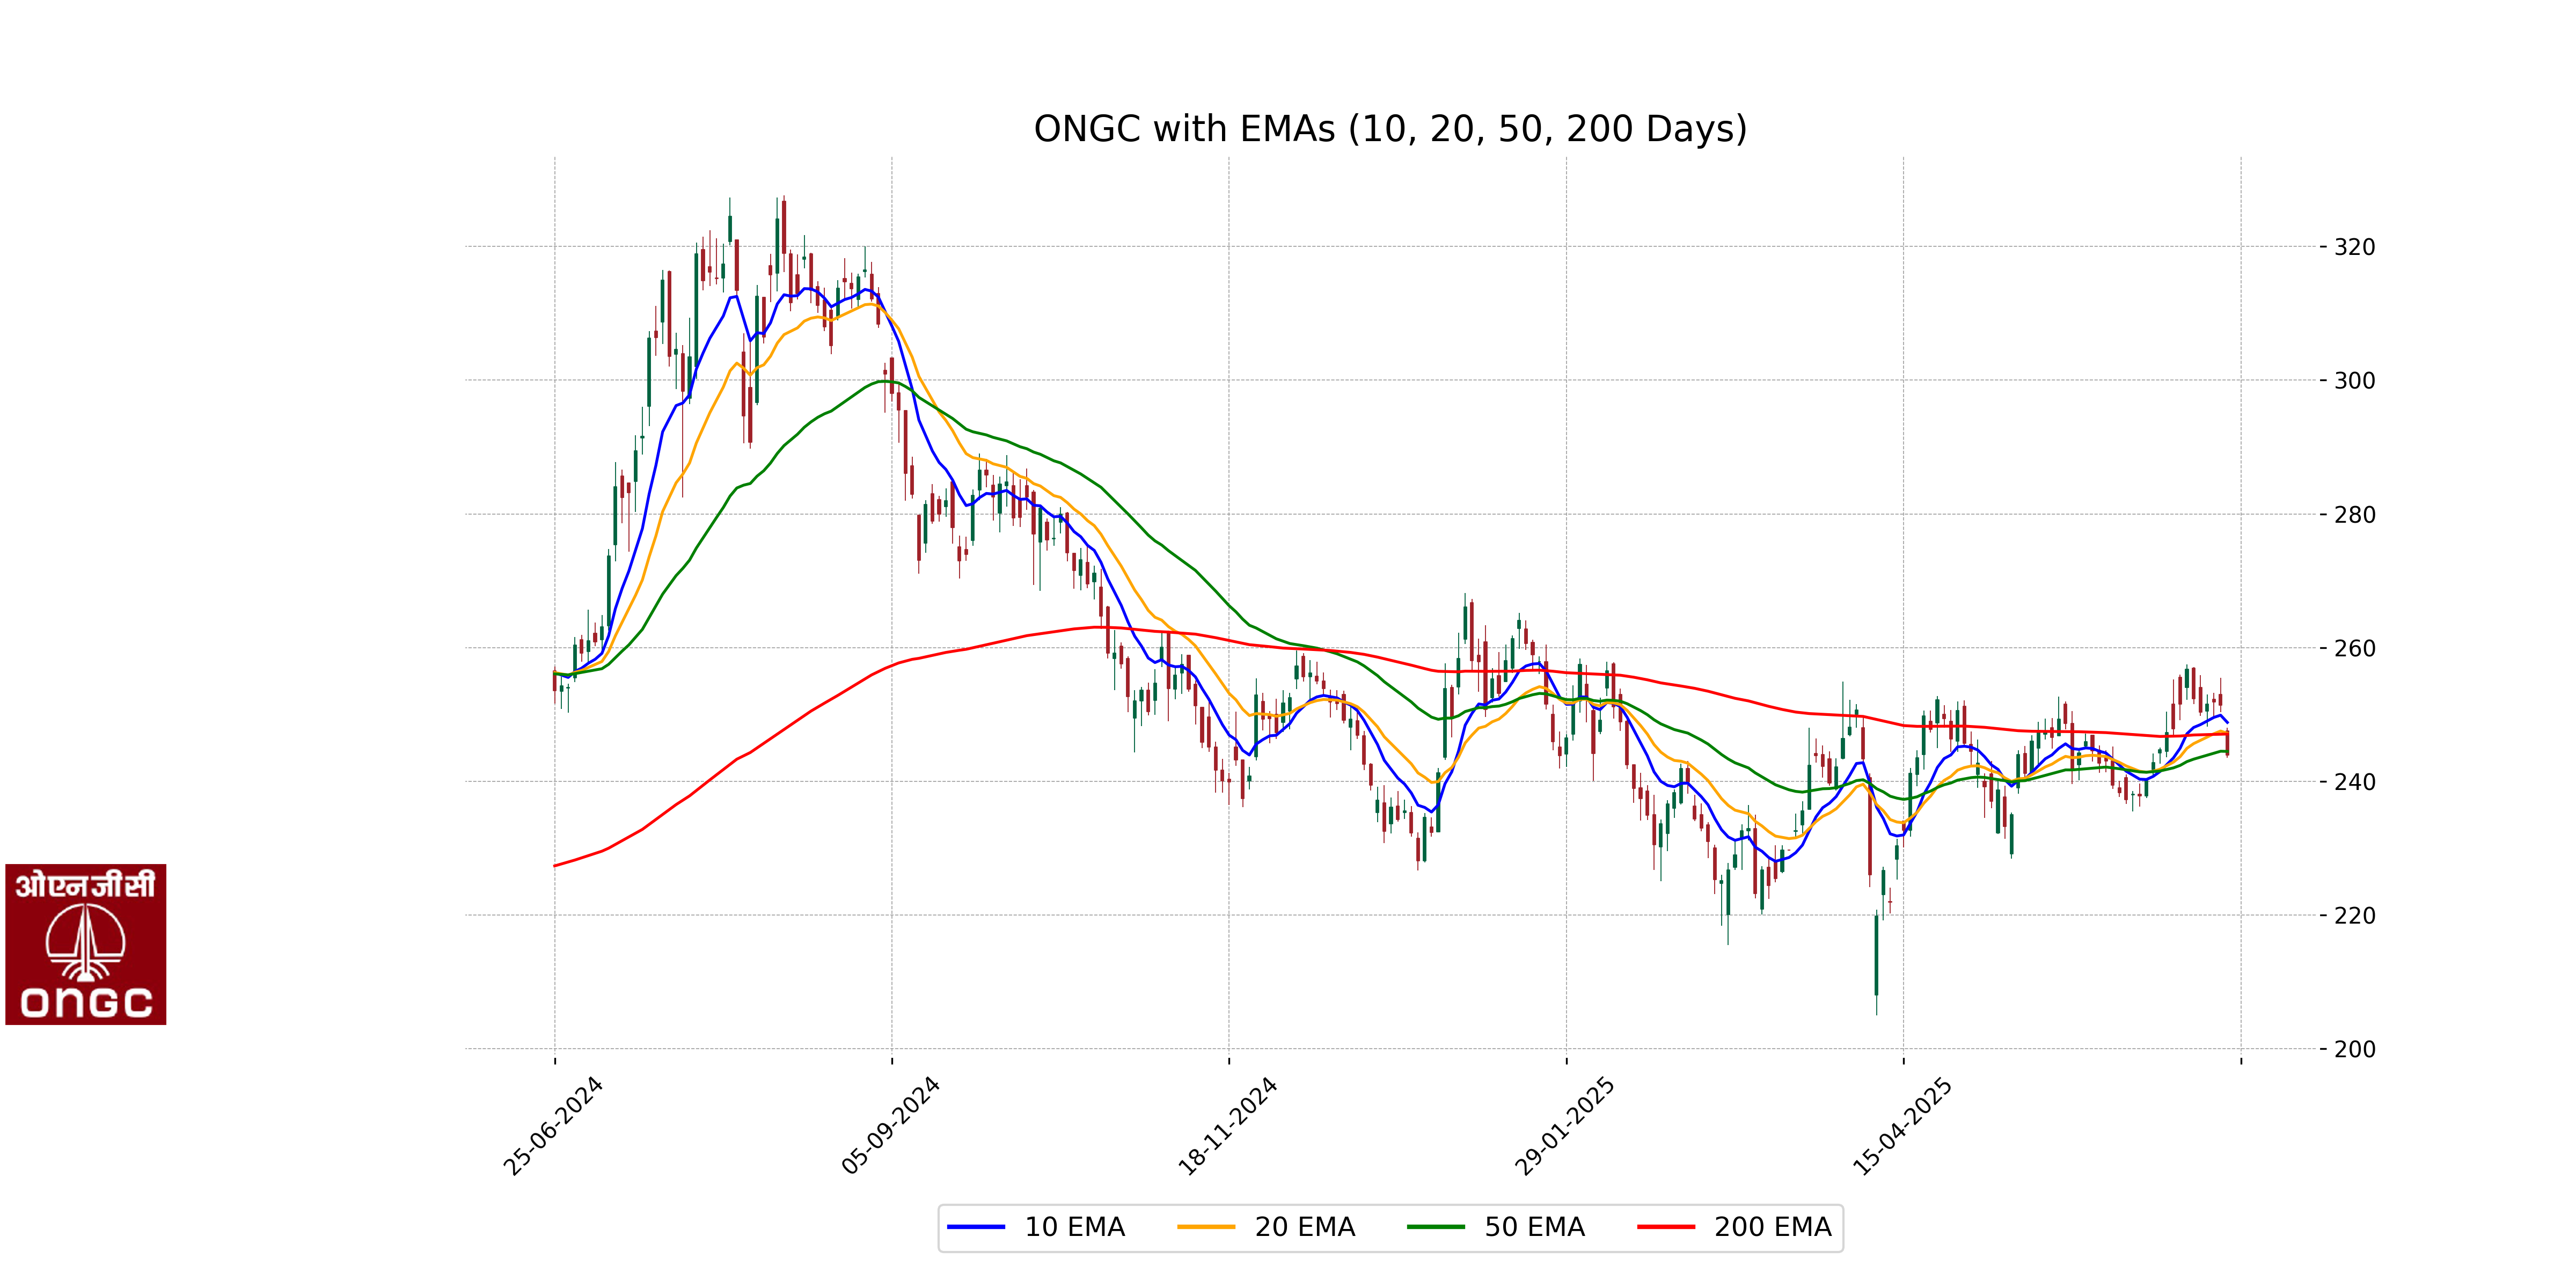
Relationship with Key Moving Averages
Based on the provided data, ONGC's close price of 243.92 is below its 50-day EMA of 244.47, 200-day EMA of 247.06, and significantly below the 10-day EMA of 248.80. This indicates a recent downward trend relative to key moving averages.
Moving Averages Trend (MACD)
ONGC's MACD value is 2.0689, slightly above the MACD Signal value of 1.9922, indicating a bullish momentum. However, the RSI at 46.52 suggests relatively neutral market conditions, leaning slightly towards being oversold. The combination of these indicators could imply that ONGC is potentially poised for a positive movement if the momentum continues to strengthen.
RSI Analysis
The RSI (Relative Strength Index) for ONGC is 46.52, indicating a neutral stance in the market, as it's neither in the overbought nor oversold territory. Typically, RSI values below 30 suggest oversold conditions, while values above 70 indicate overbought conditions.
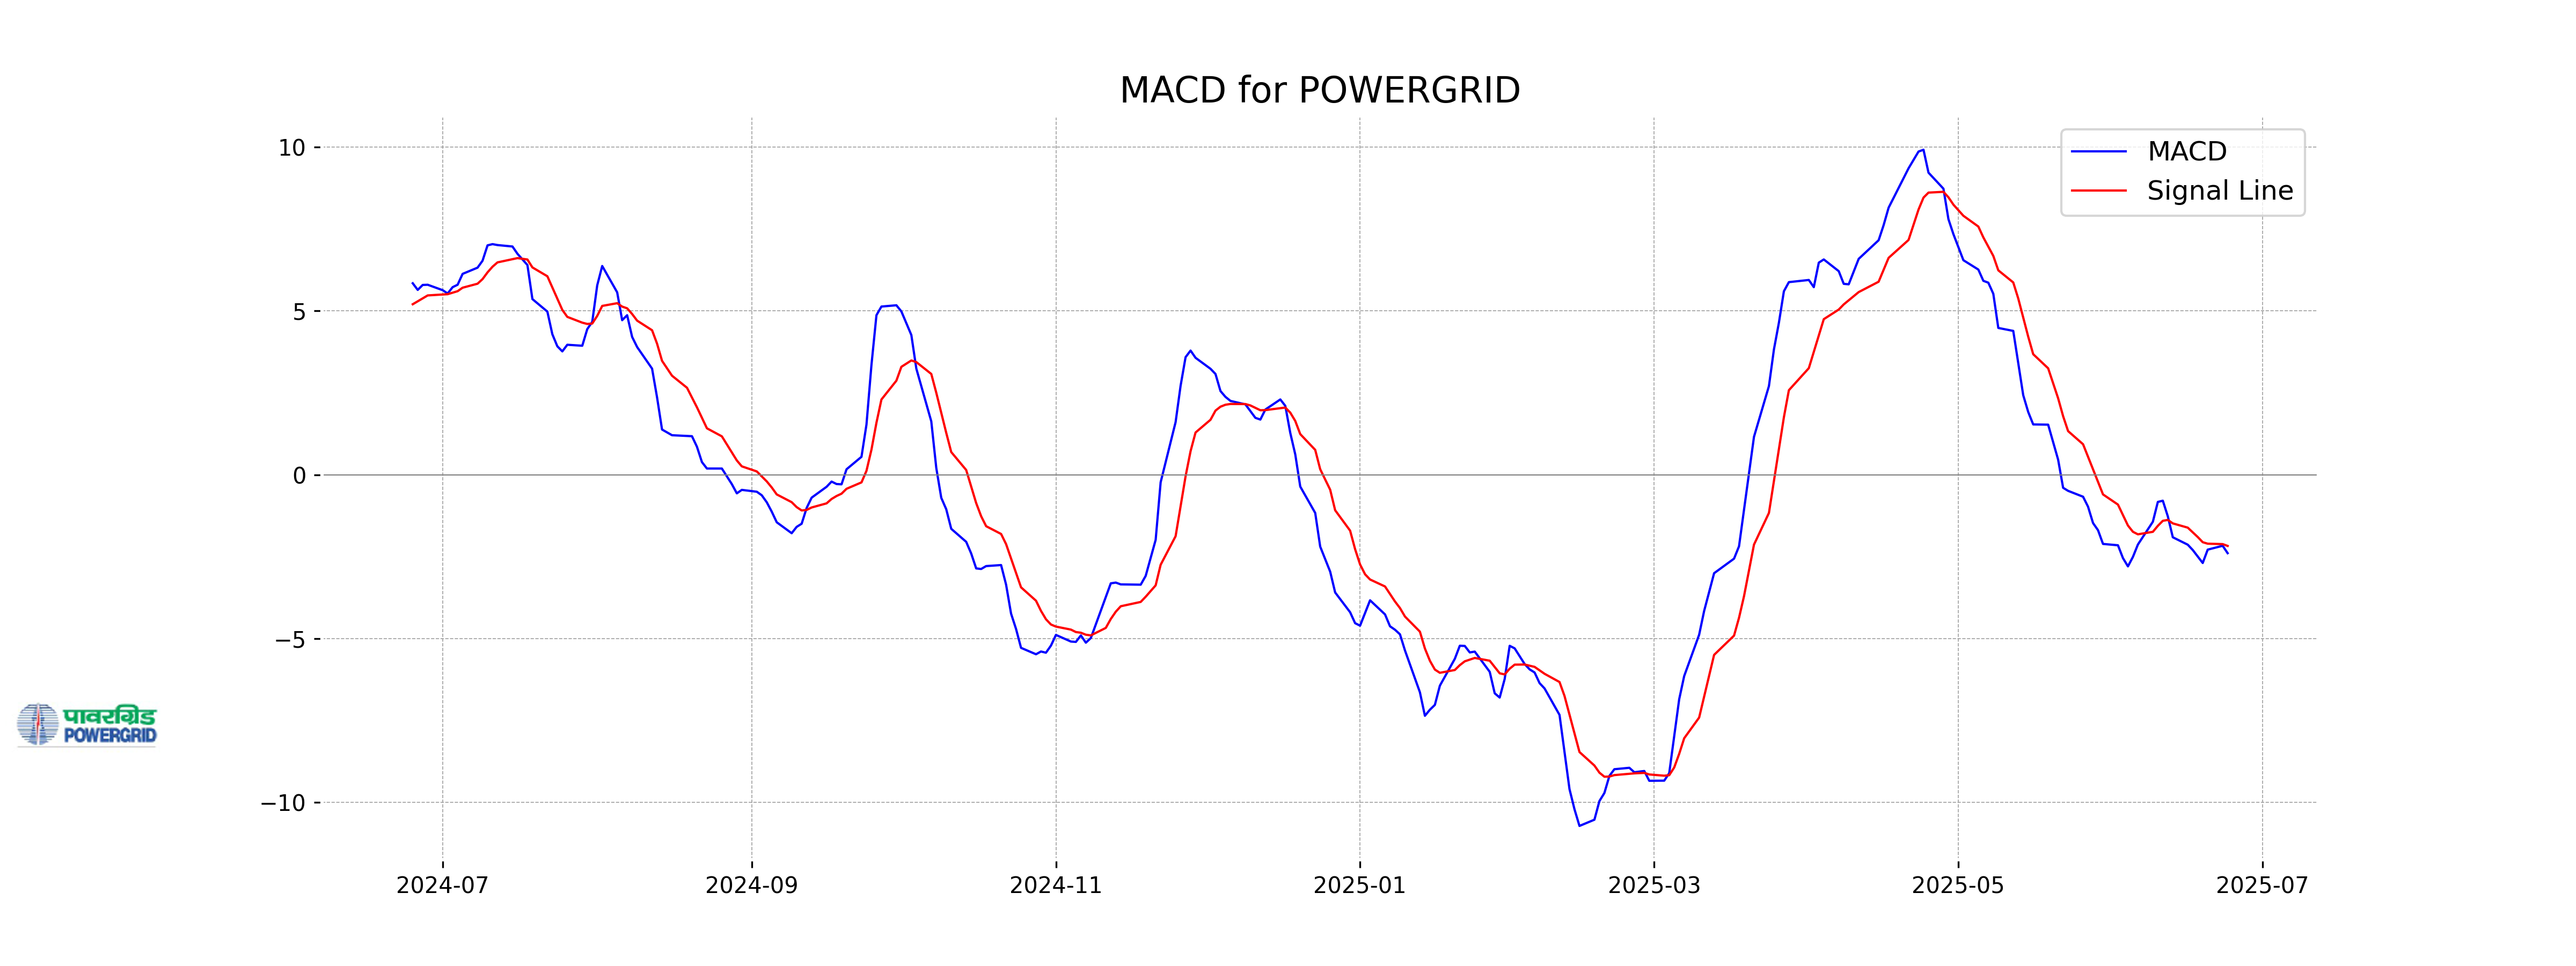
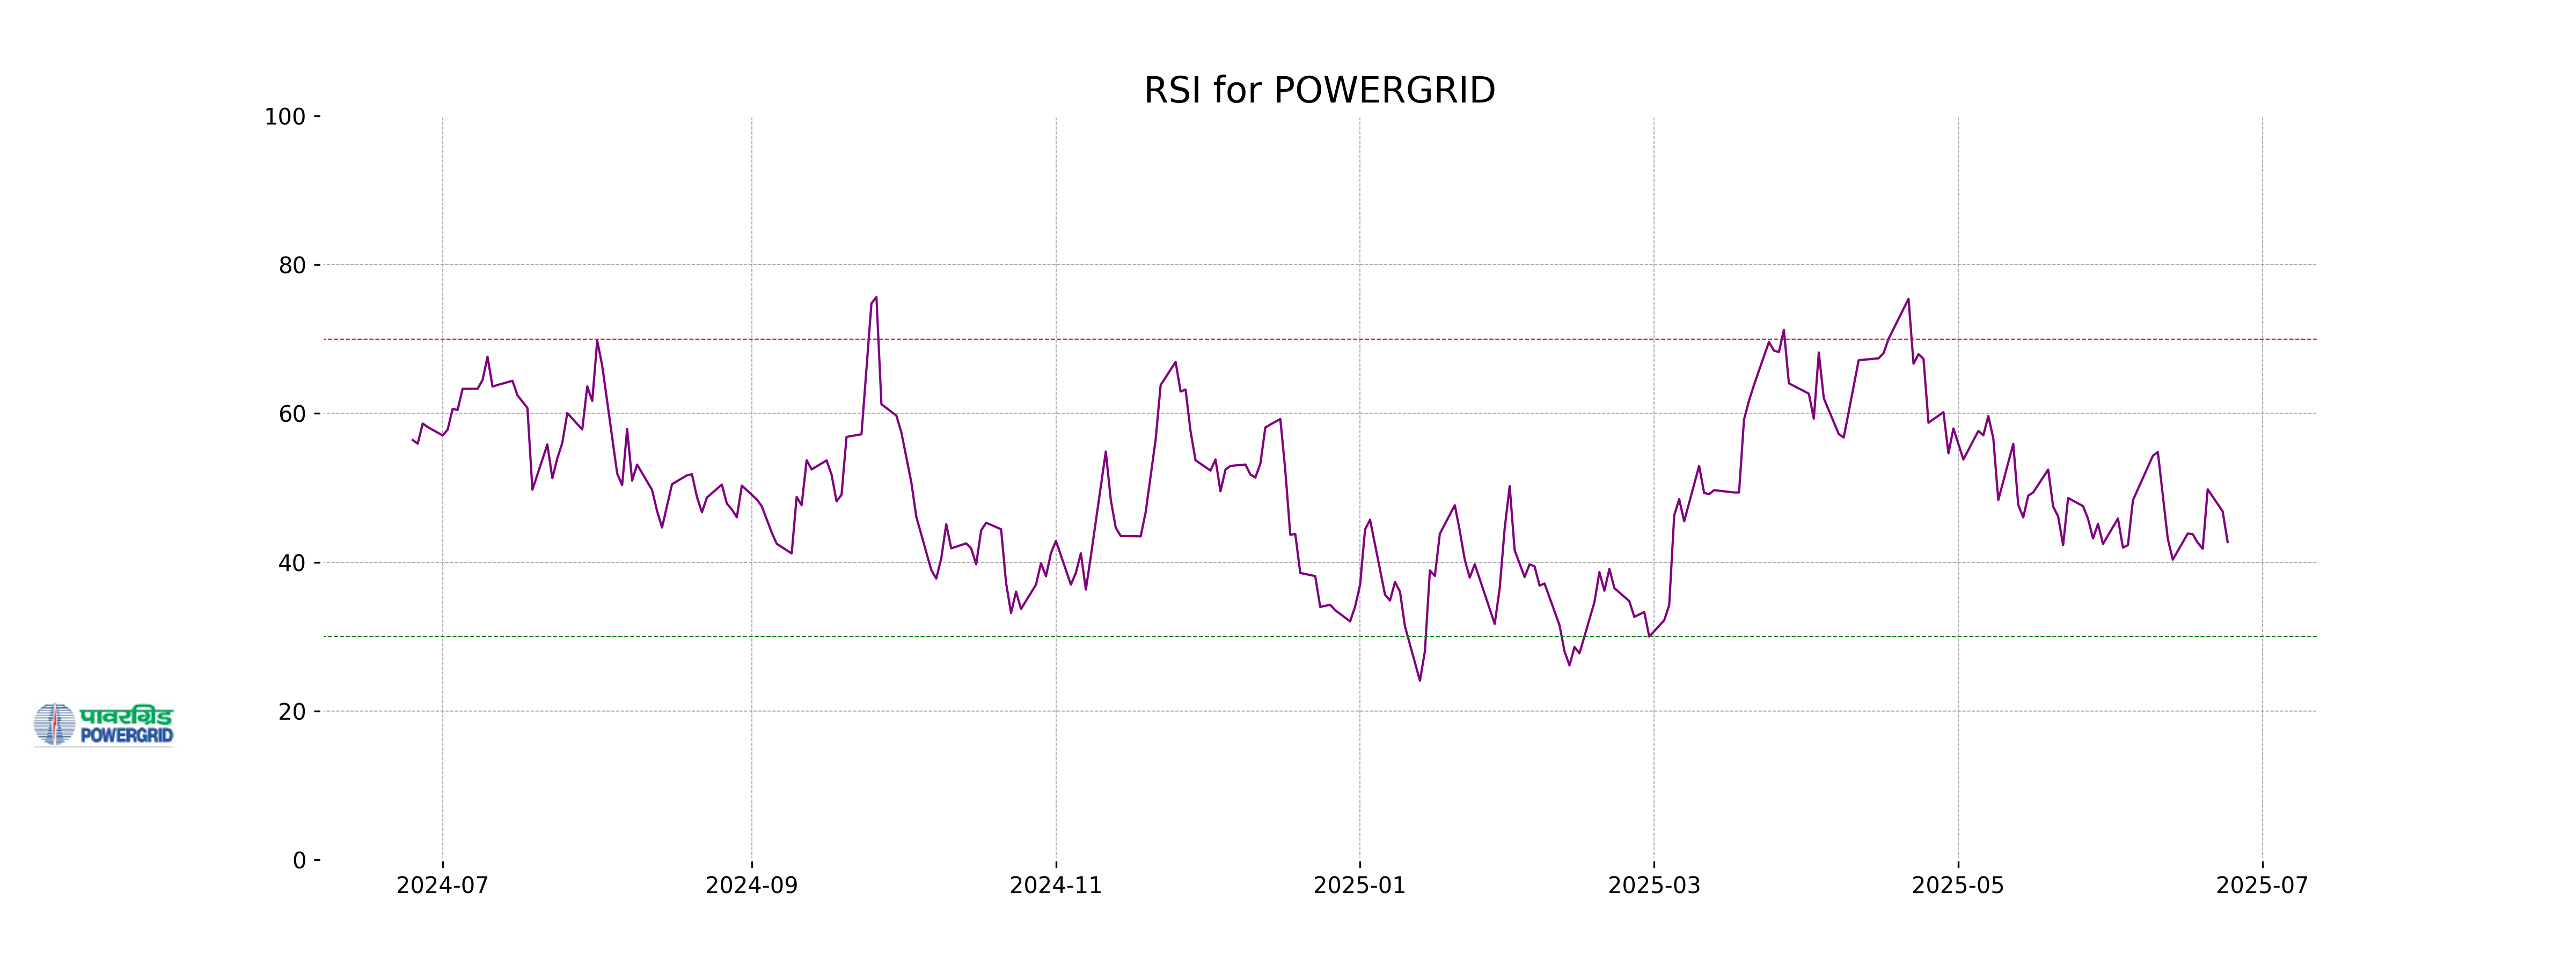
Analysis for Power Grid - June 24, 2025
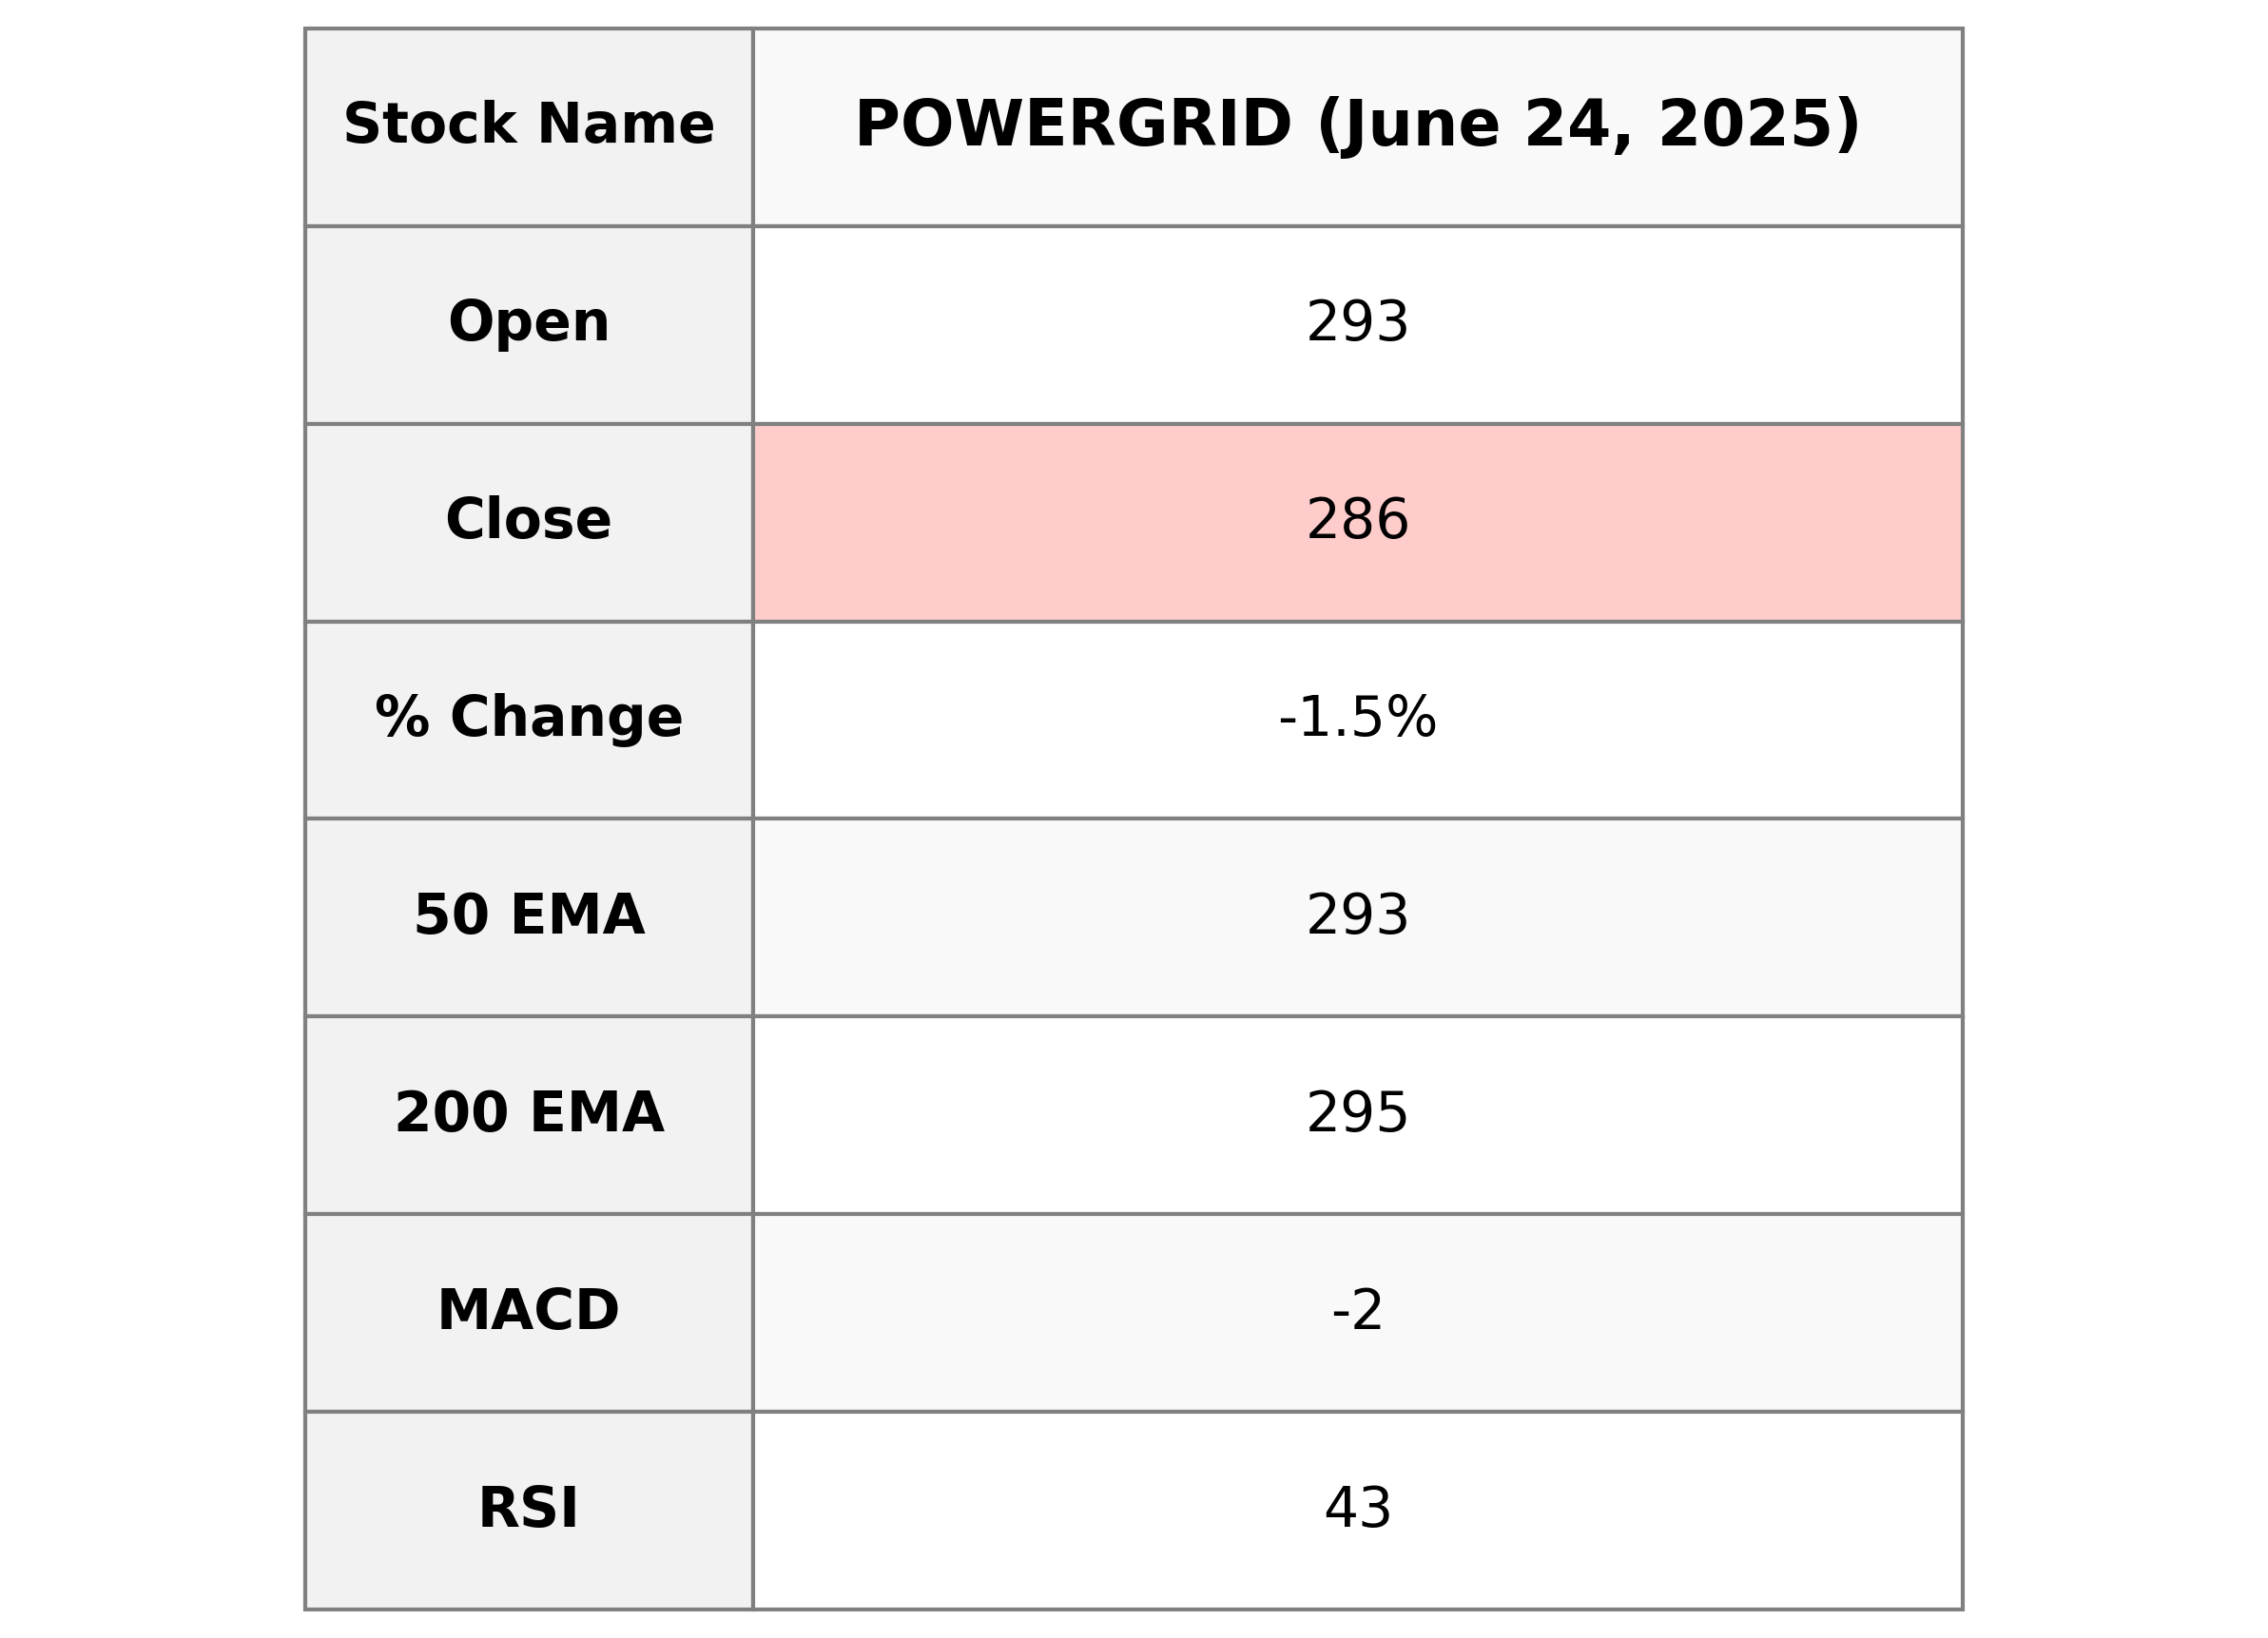
Power Grid Corporation of India Limited Performance Overview: Power Grid's stock opened at 293.45 and closed at 285.95, experiencing a decrease of approximately 1.48% from the previous close. The current market conditions show weakness, indicated by a declining MACD and an RSI below 50, suggesting bearish momentum. The volume of shares traded was 15,001,076, with the stock trading below both its 50-day and 200-day EMAs, reinforcing a short-term negative trend.
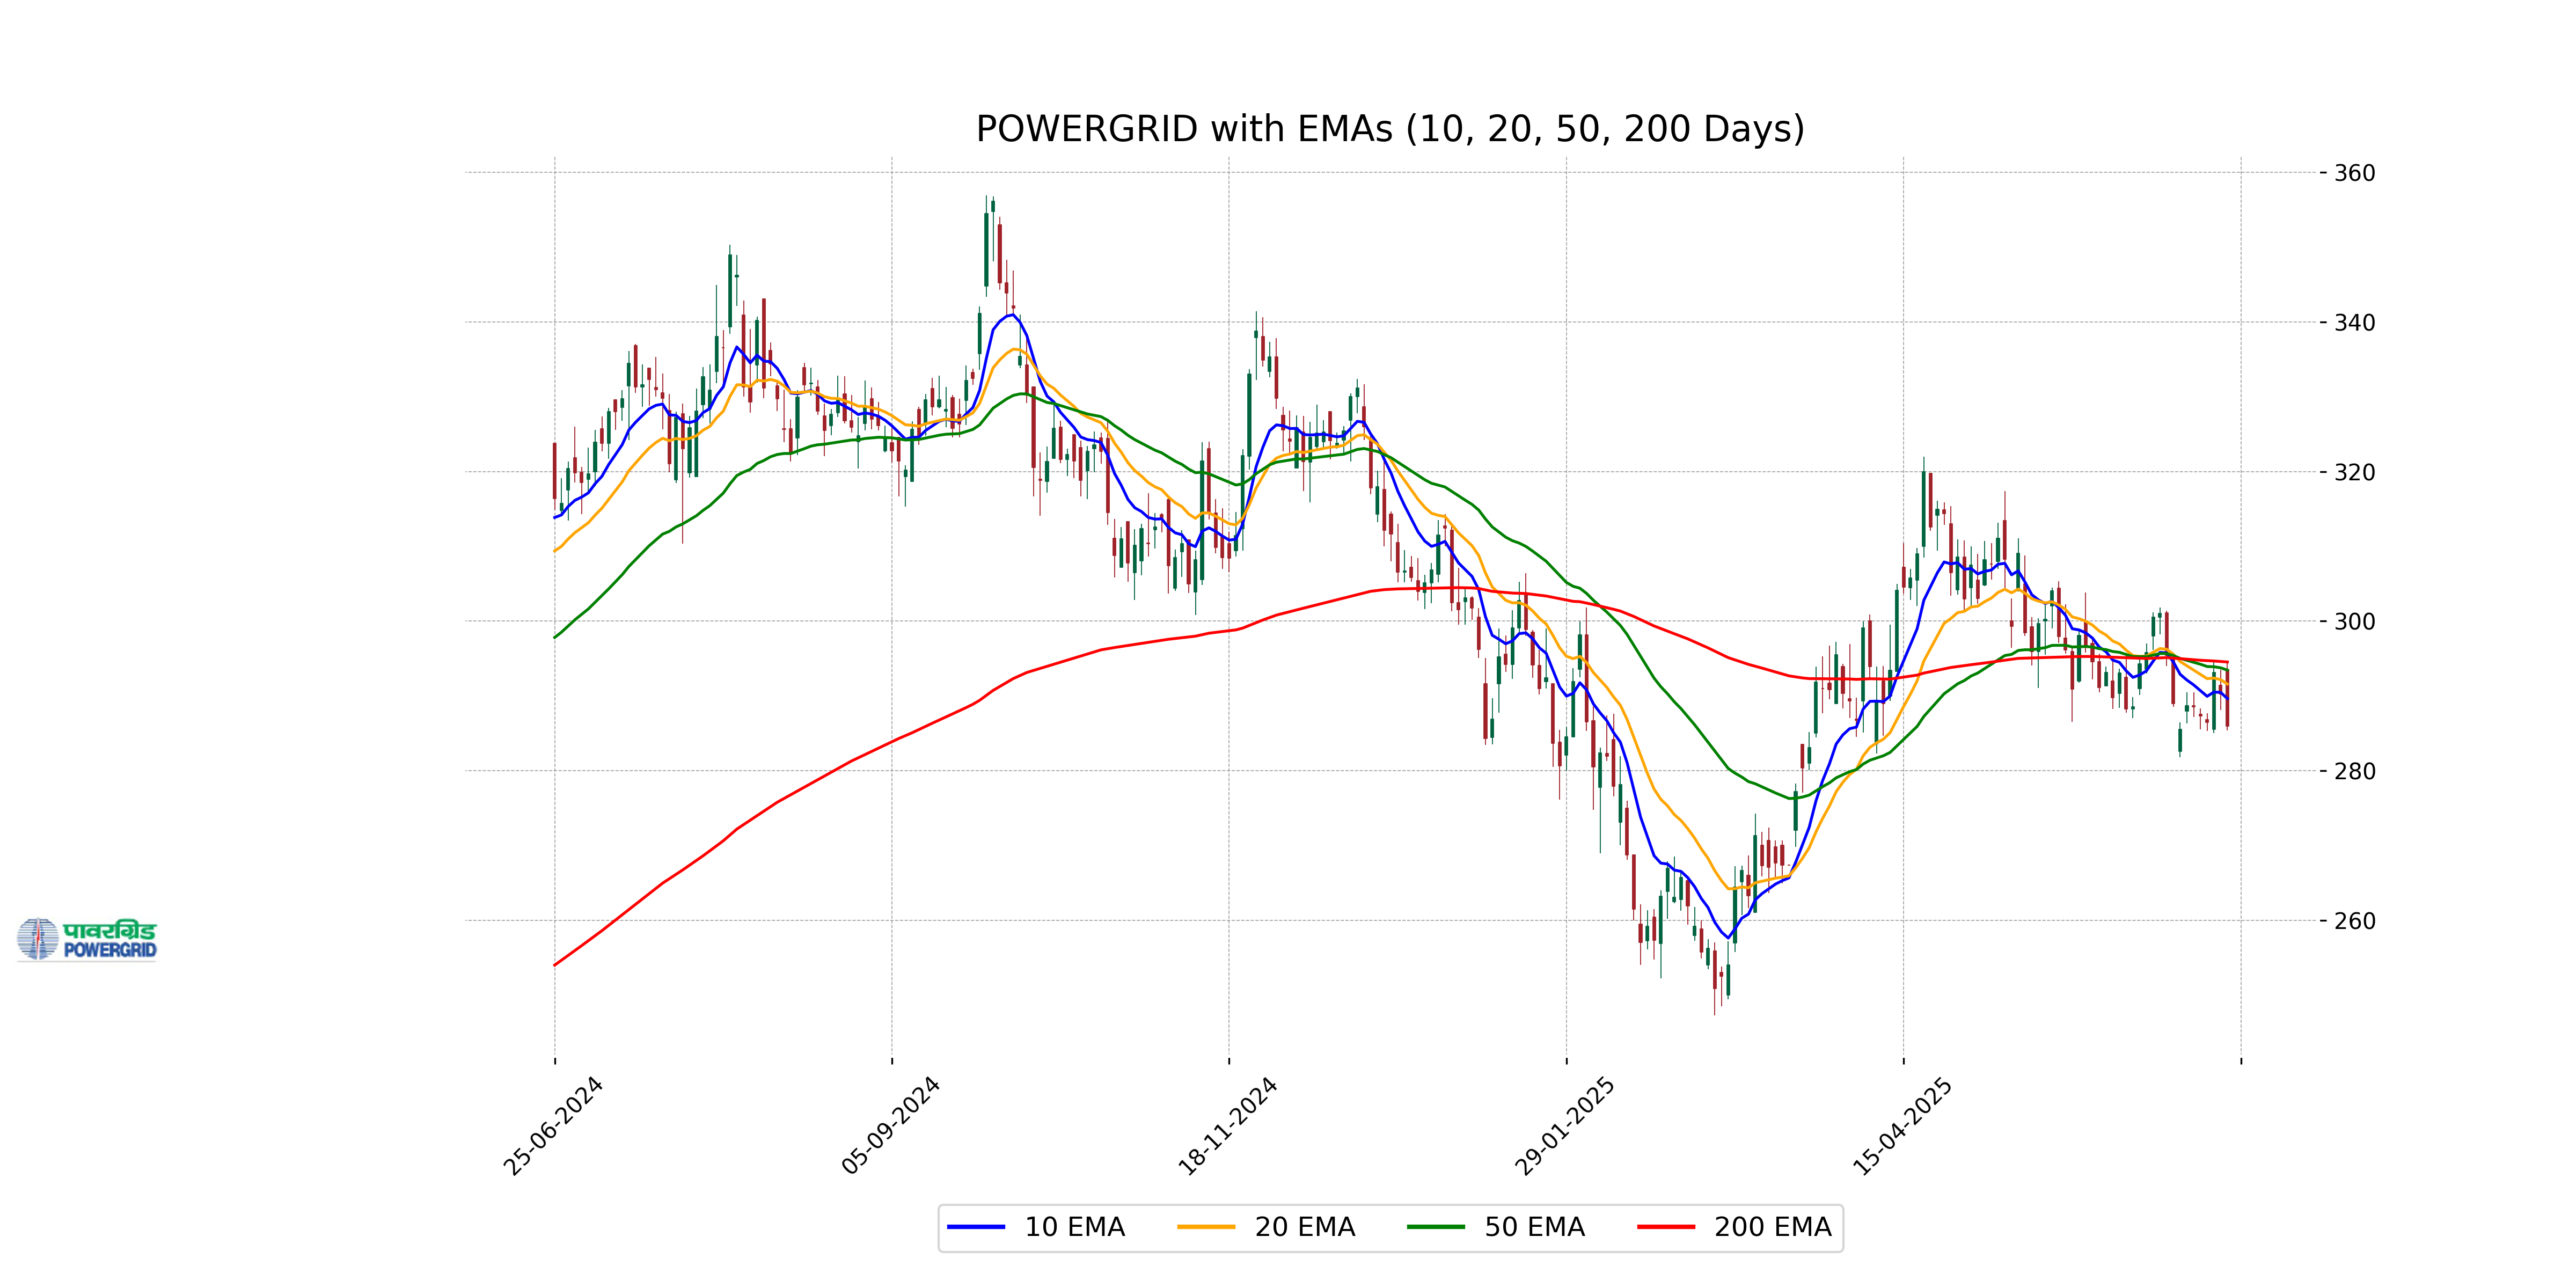
Relationship with Key Moving Averages
The closing price of Power Grid is below its 50-day and 200-day EMAs, suggesting a bearish trend. The 10-day and 20-day EMAs are also above the current price, further indicating bearish momentum.
Moving Averages Trend (MACD)
Power Grid's MACD is at -2.39, while the MACD Signal is at -2.17, indicating a bearish signal with the MACD line below the signal line. This suggests downward momentum in the stock's price trend.
RSI Analysis
Power Grid's Relative Strength Index (RSI) is 42.70, which indicates that the stock is in a neutral range. The RSI value suggests that the stock is neither overbought nor oversold, providing potential for movement in either direction depending on market conditions.
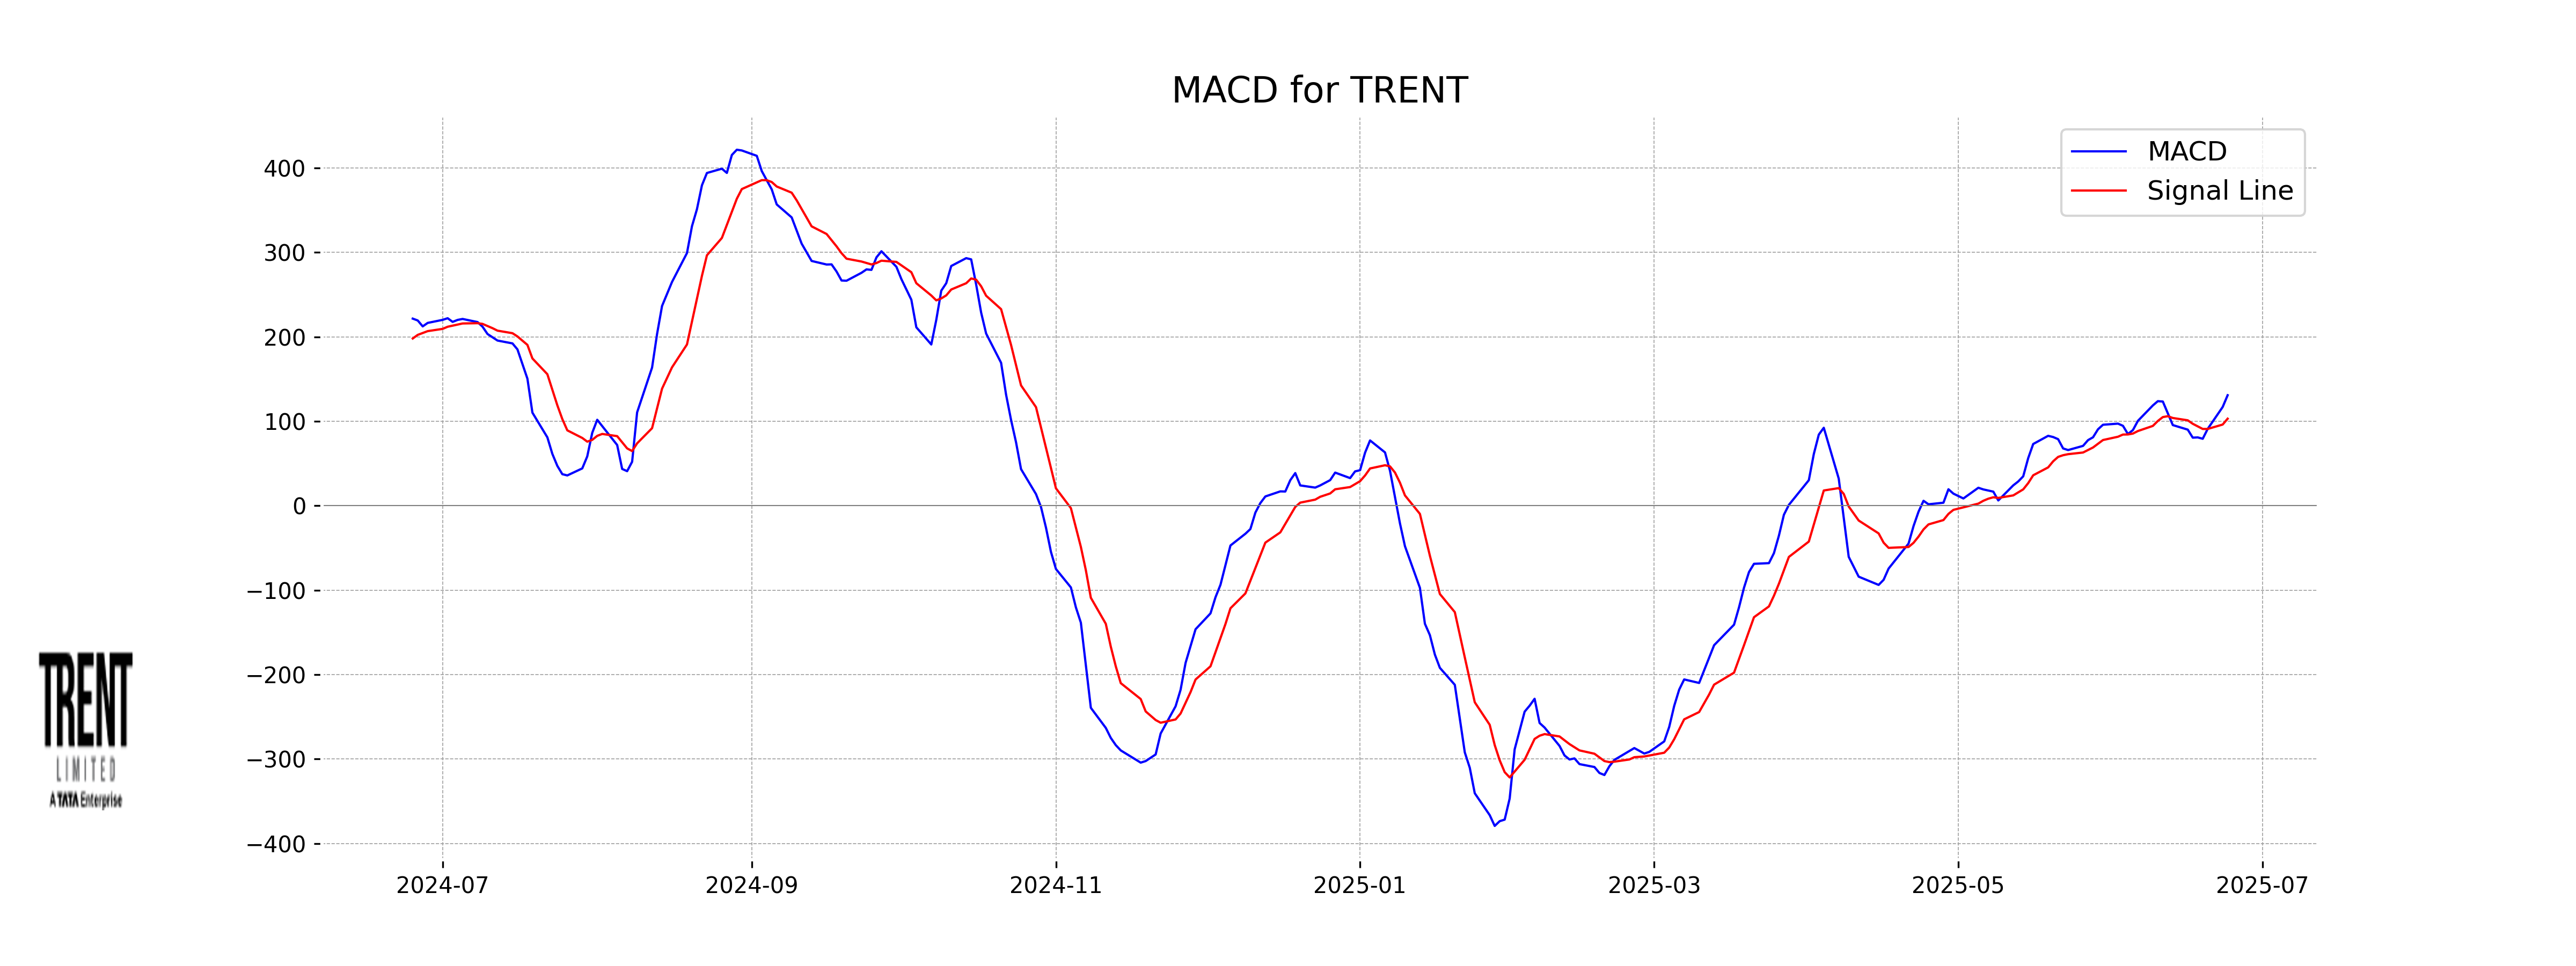
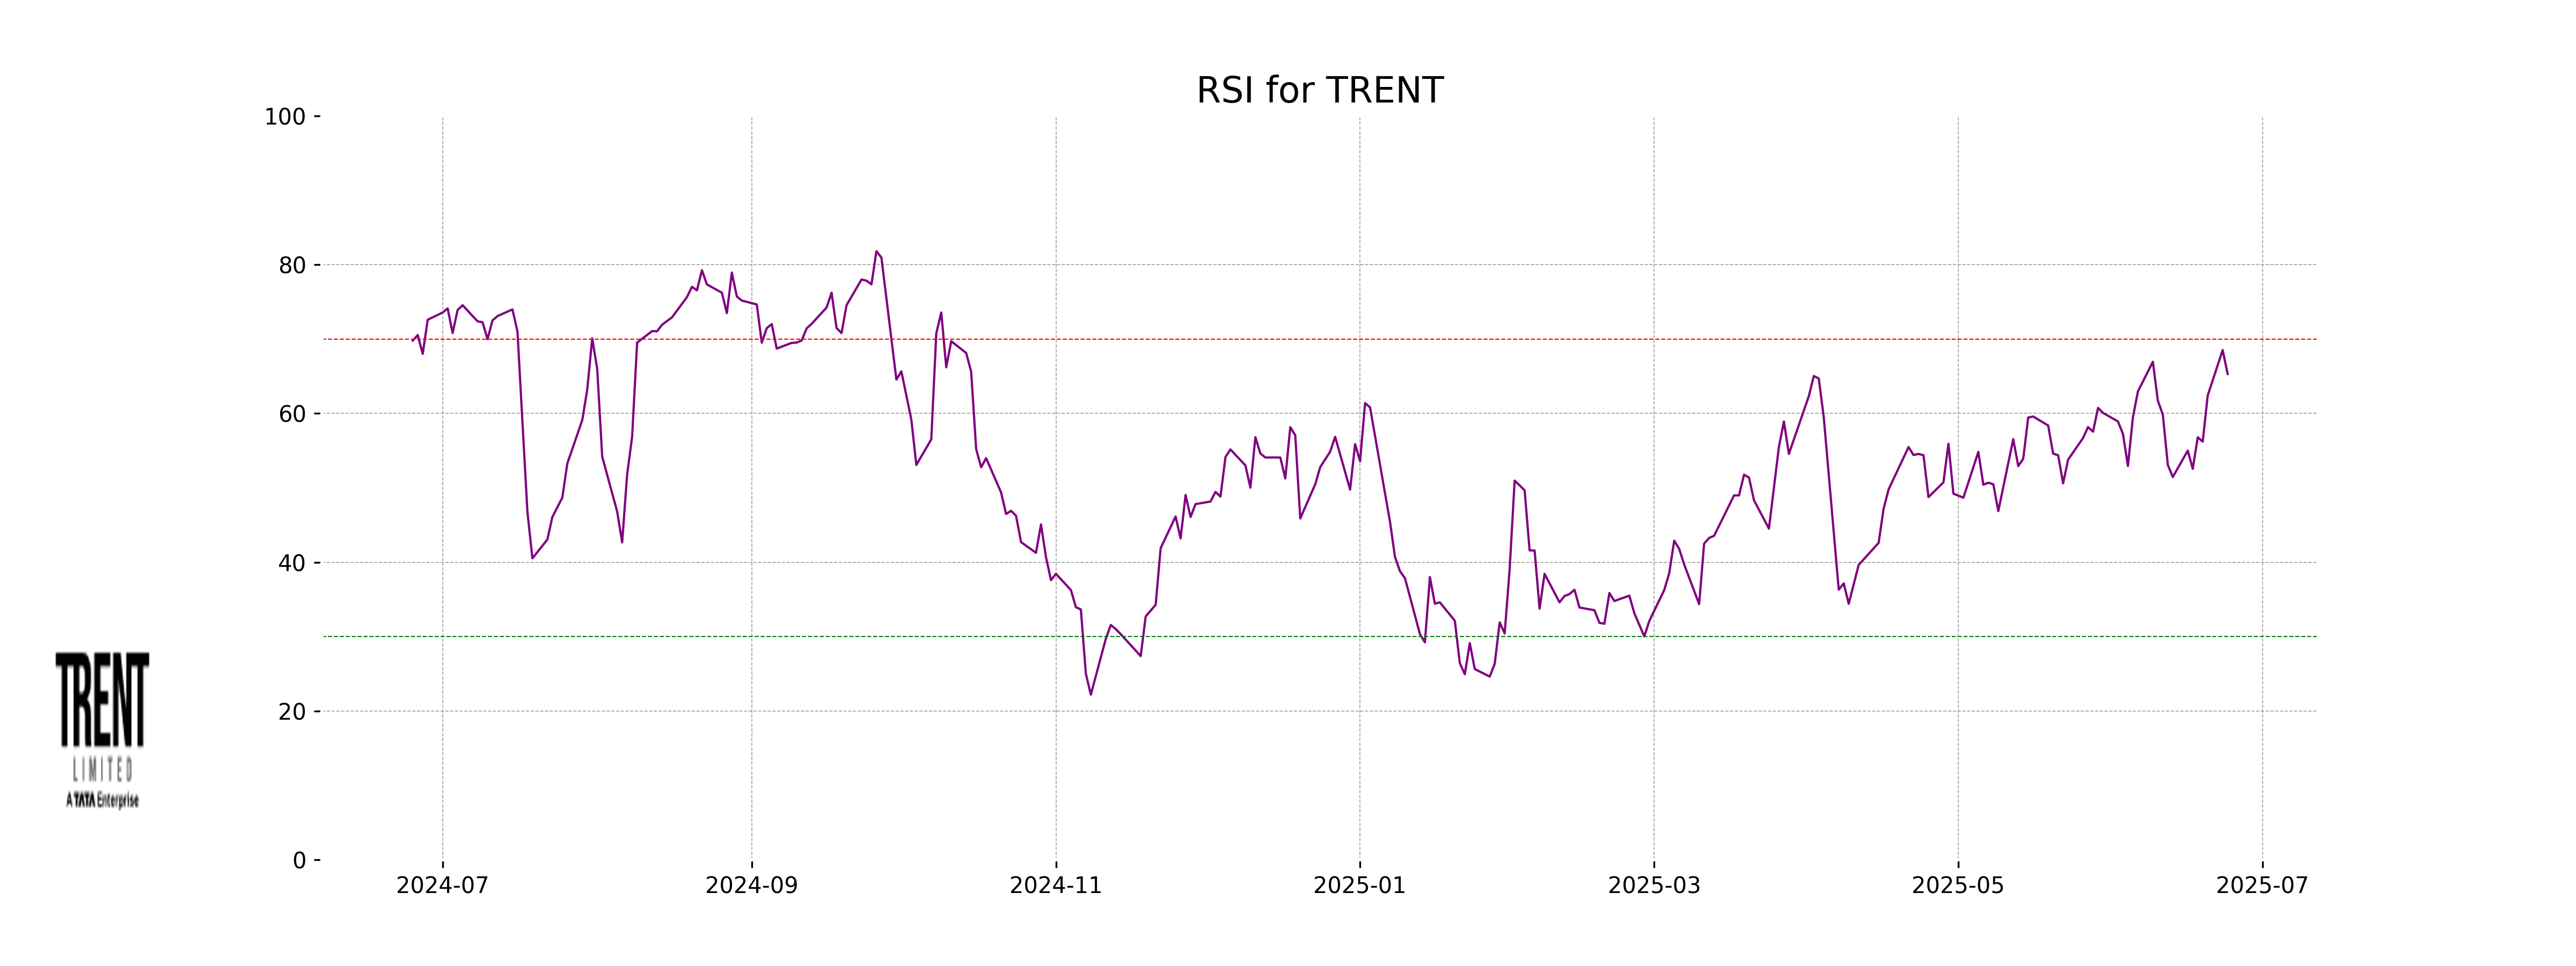
Analysis for Trent - June 24, 2025
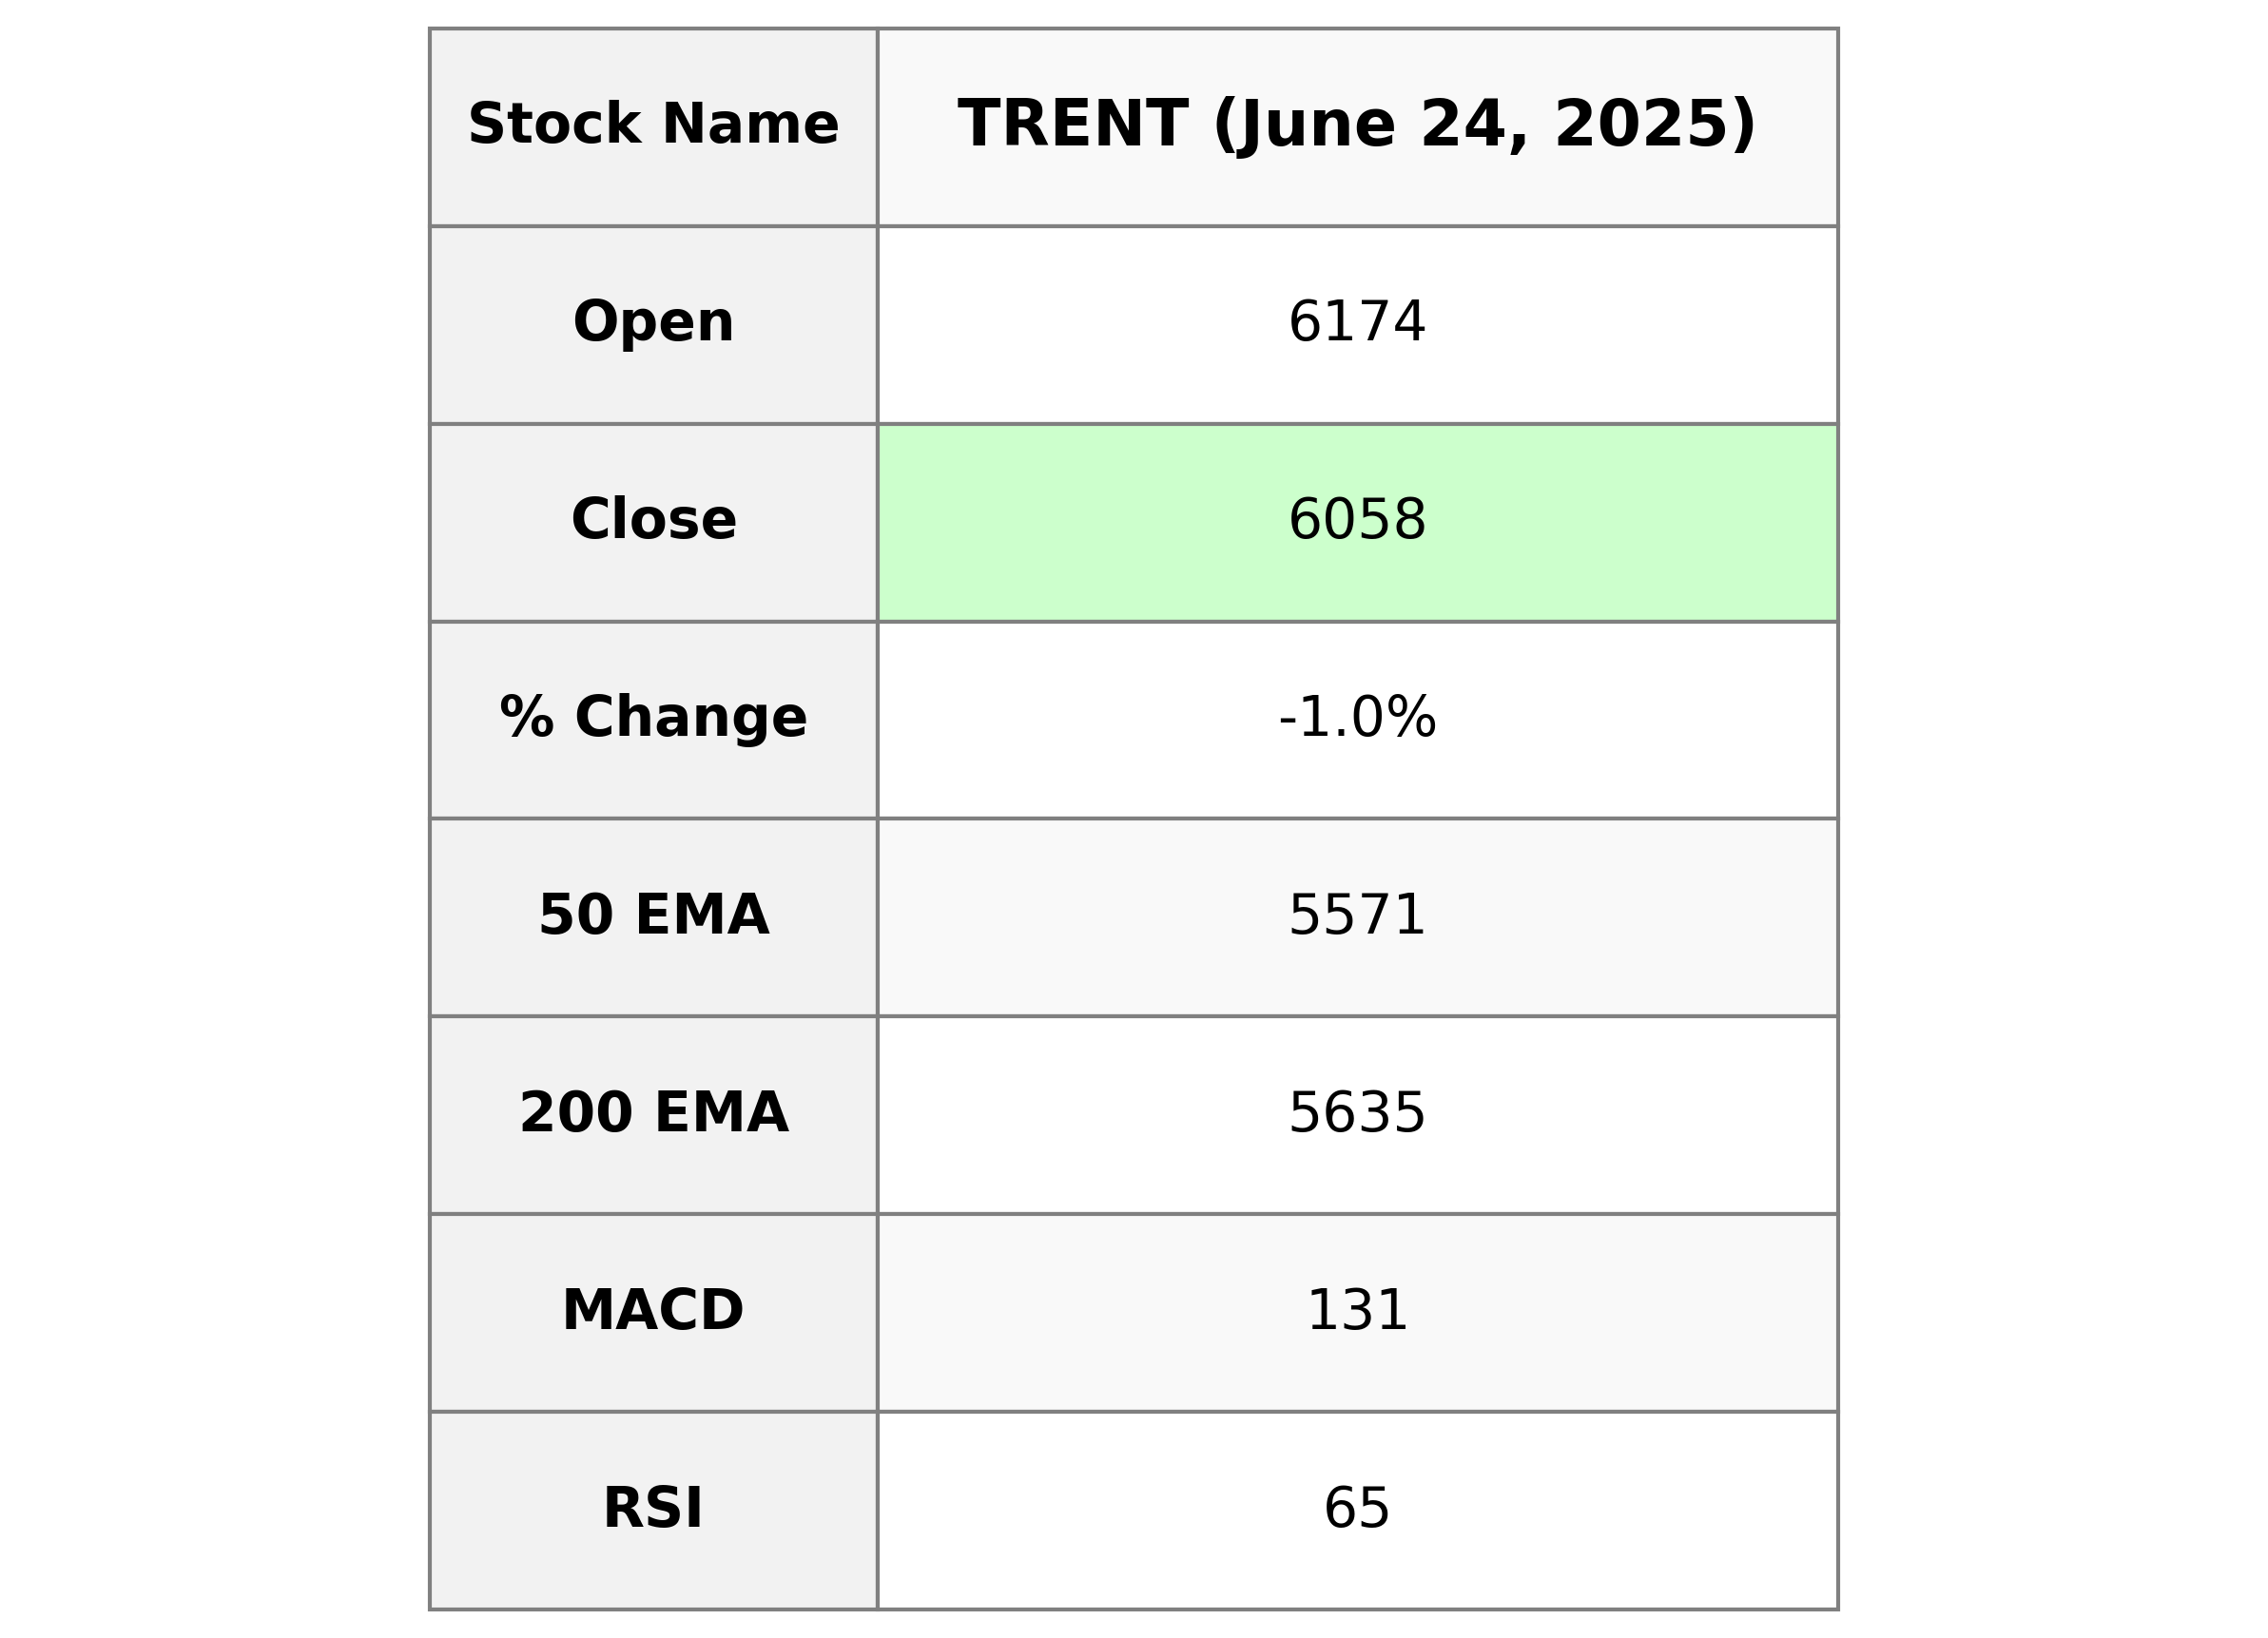
Trent Performance Description: Trent witnessed a decline in its stock price with a closing value of 6057.5, down by -62.5 points or -1.02% from the previous close, which was 6120. The stock experienced a daily high and low of 6205.0 and 6033.0, respectively. Despite a robust market cap standing at approximately 2.15 trillion INR, the PE ratio is high at 139.41, suggesting potential overvaluation. The sector under which Trent operates is Consumer Cyclical, while its specific industry is Apparel Retail in India. The technical indicators such as RSI suggest a moderately strong momentum, and the MACD indicates positive market trends, as it is above the MACD signal line.
Relationship with Key Moving Averages
Trent's closing price of 6057.5 is above its 50 EMA of 5571.39 and its 200 EMA of 5634.84, indicating a bullish trend. However, it is below its 10 EMA of 5843.42 and its 20 EMA of 5735.80, displaying potential short-term weakness.
Moving Averages Trend (MACD)
Trent's MACD value of 130.94 is above the MACD Signal of 103.14, indicating a bullish trend signal. This suggests that the stock might continue its upward momentum despite the recent 1.02% price drop from the previous close. The RSI of 65.31 is approaching overbought territory, which may warrant caution for traders.
RSI Analysis
Trent's RSI stands at 65.31, which suggests that the stock is close to being overbought, but not yet in the extreme overbought zone. This indicates that while the stock has seen significant price gains, there's still room for a potential upward trend before reaching a critical threshold.
Up Next
NSE Nifty 50: Top 5 stock losers of June 24, 2025

Centre plans to borrow Rs 8.20 lakh cr from market in first half of FY27

Reliance denies buying Iranian oil amid US sanctions waiver

Premium petrol price up Rs 2, industrial diesel up Rs 22; no change in normal petrol, diesel rates

India's GDP expected to register over 8 pc growth in Sep-Dec: Report

Govt announces seven measures to help boost exports

More videos

RBI keeps interest rates on hold after US trade deal boosts outlook

RBI proposes to compensate customers up to Rs 25,000 loss due to fraud

RBI raises GDP growth projection of Q1, Q2 of FY27

RBI pauses rate cuts, retains interest rate at 5.25 pc

Rupee jumps 122 paise to close at 90.27 against US dollar on India-US trade deal

Stock markets cheer India-US trade deal: Sensex, Nifty surge 2.5 pc

UPI transactions hit record high of Rs 230 lakh crore in 2025-26 till Dec: Govt

Explained: India-US trade deal, tariffs and trade benefits

Trade deal with US adds momentum to India's growth ambition: Industry leaders

Rupee jumps 119 paise to 90.30 against the US dollar on India-US trade deal
Editorji Technologies Pvt. Ltd. © 2022 All Rights Reserved.