


Highlights
- Adani stocks show bearish momentum below EMAs
- Hindustan Unilever nears oversold zone, weak trend
- TCS holds neutral RSI with bullish MACD
Latest news

Samsung Galaxy Z Fold 8, Fold 8 Ultra & Z Flip 8: A More Mature Foldable Family

Dell Launches New Alienware 16X Aurora, 16 Area-51 and 18 Area-51 Gaming Laptops in India

Samsung Takes on Premium Home Audio With New Music Studio Series

The End of OxygenOS: OnePlus Confirms Shift to Oppo's ColorOS

Fujifilm Instax Mini Evo Cinema Review: A Hybrid Camera That Prints Memories Differently

iQOO Teases Z11 Lite With AI Tools, Military-Grade Durability and a 6500mAh Battery

Editorji Launches Hook Global, Its International Digital News Brand

Samsung's Bespoke AI ACs Focus on Humidity, Hygiene and Smarter Cooling
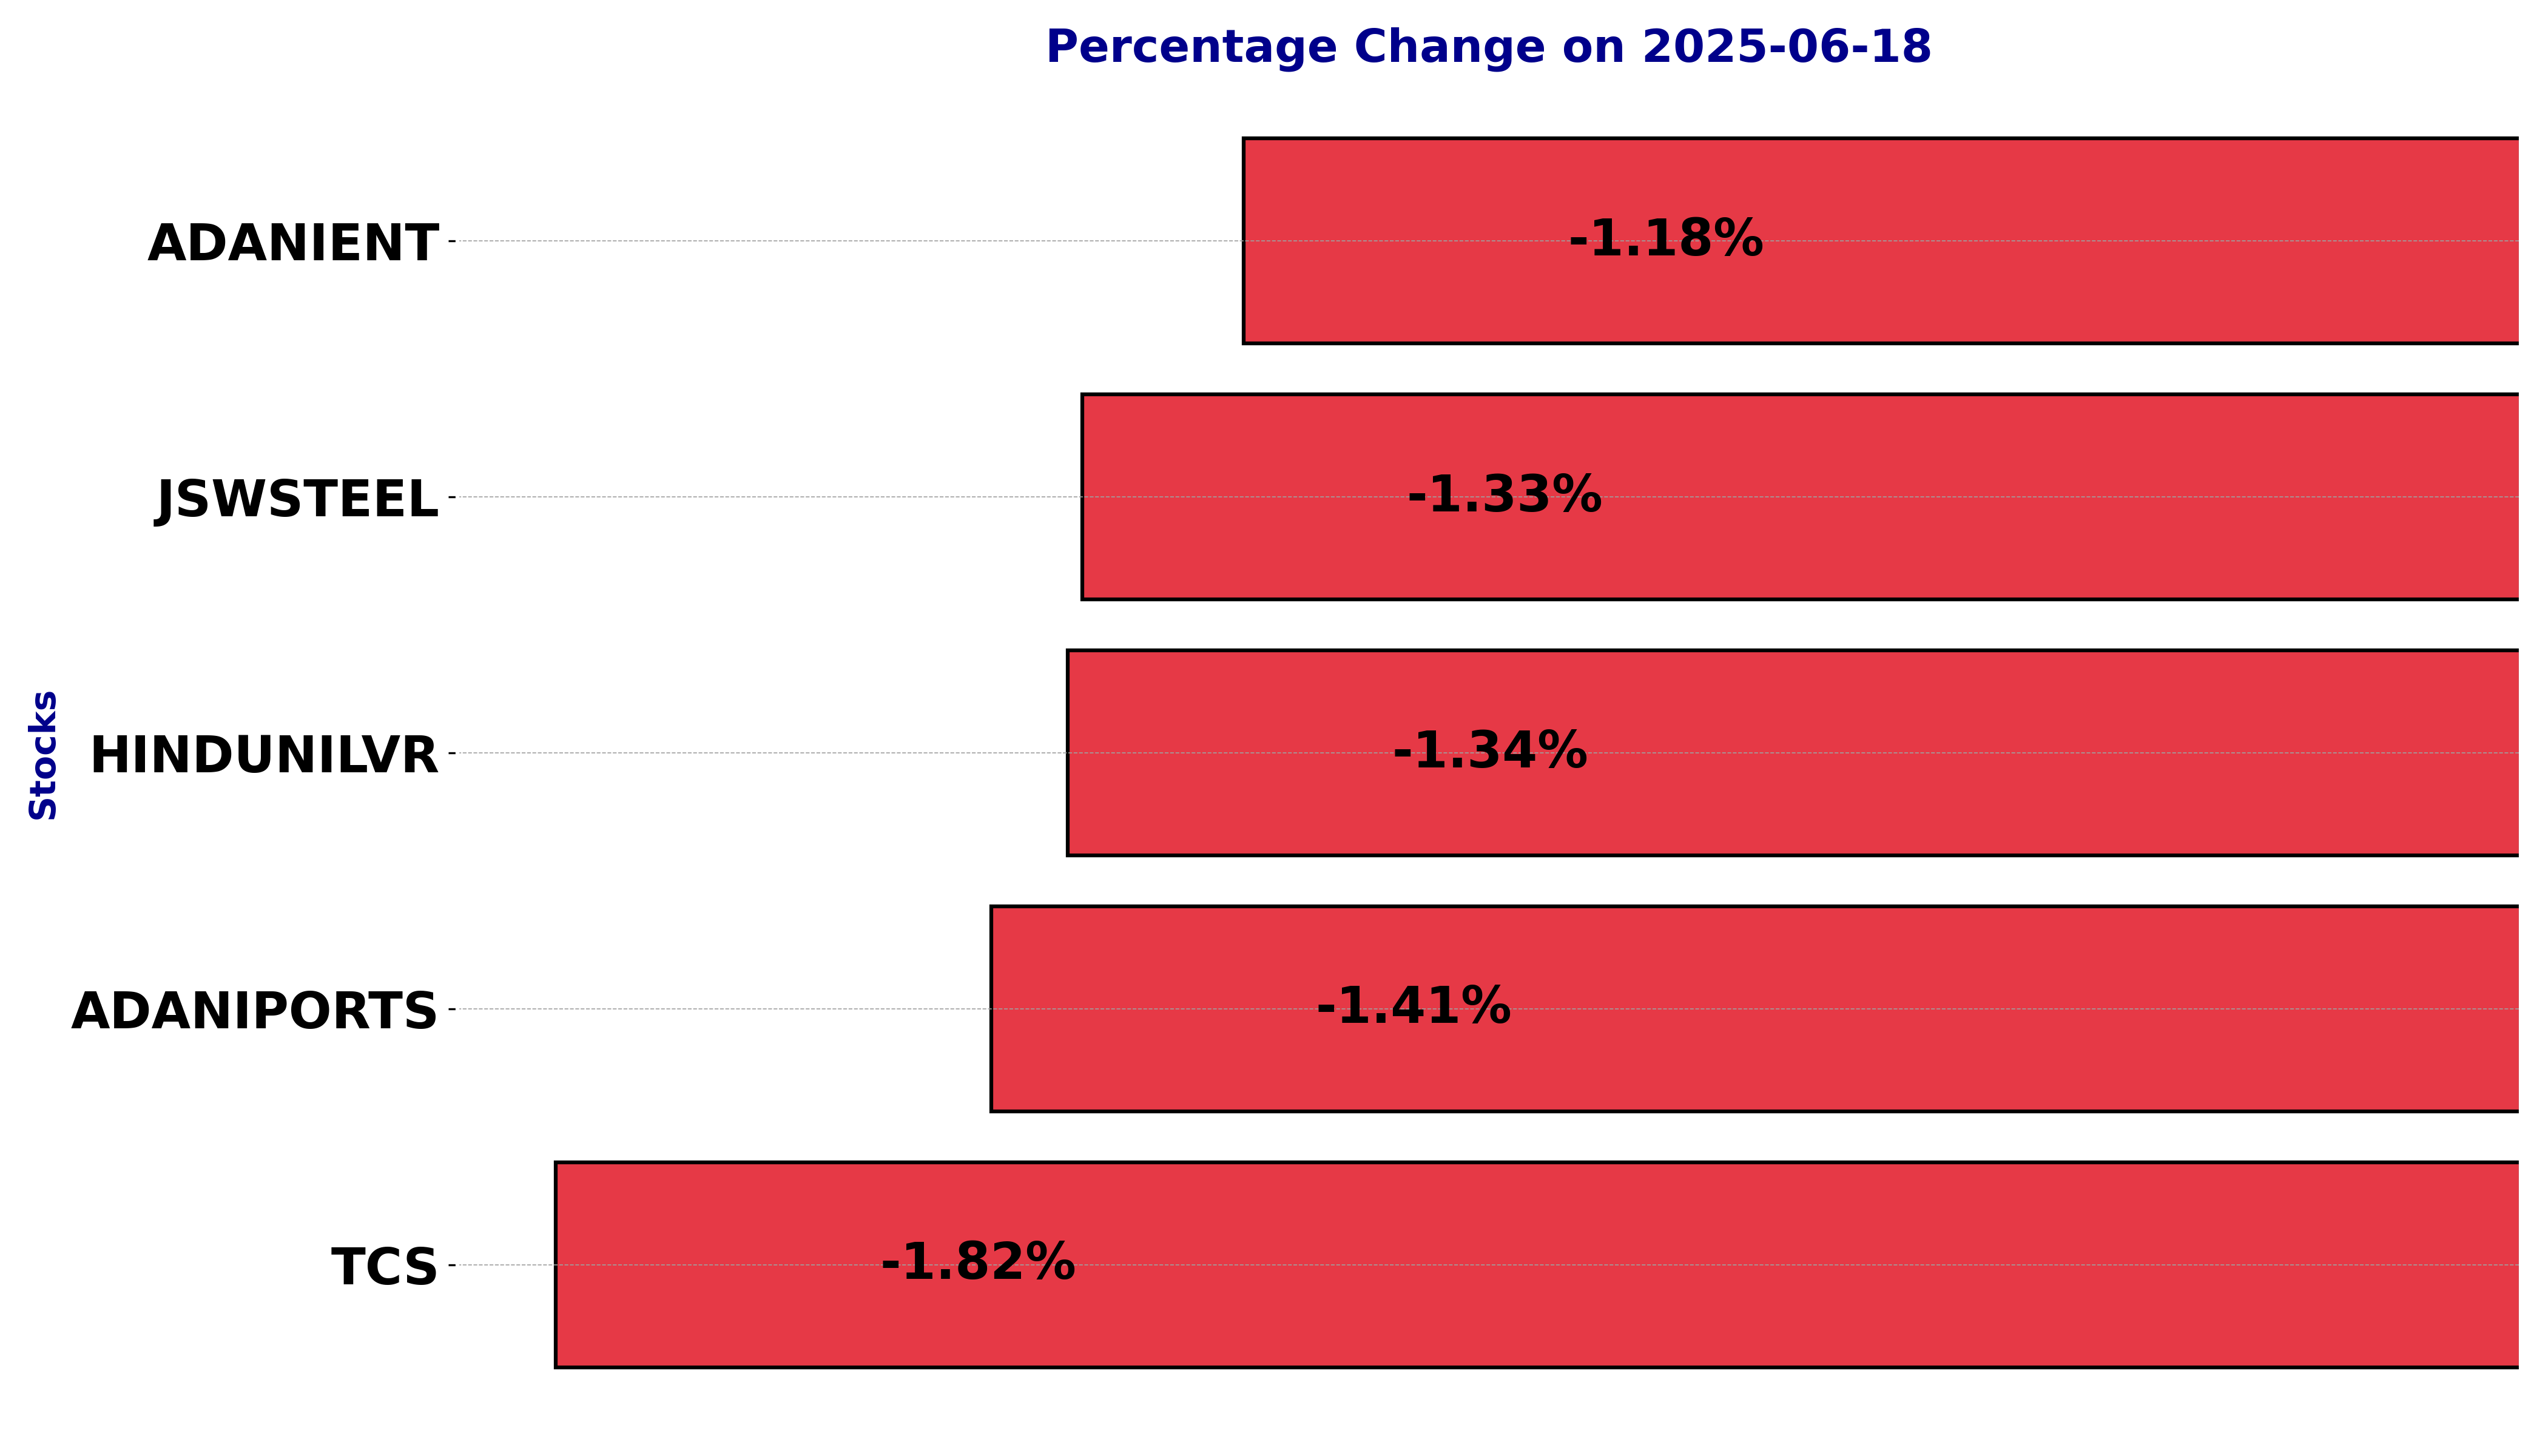
NSE Nifty 50: Top 5 stock losers of June 18, 2025


In this article, we will explore the technical indicators of some of the low-performing stocks on the Indian stock market, including ADANIENT, ADANIPORTS, HINDUNILVR, JSWSTEEL, and TCS.
By looking at these stocks through the lens of key technical factors, we aim to better understand their price movements, trends, and potential future performance.
Analysis for Adani Enterprises - June 18, 2025

Adani Enterprises, a prominent player in the energy sector in India, experienced a slight decline in stock value with a close at 2459.10, marking a -1.18% change from the previous close. With an RSI of 45.55, it indicates moderate trading activity, while showing a MACD below the signal line, hinting at potential bearish momentum.
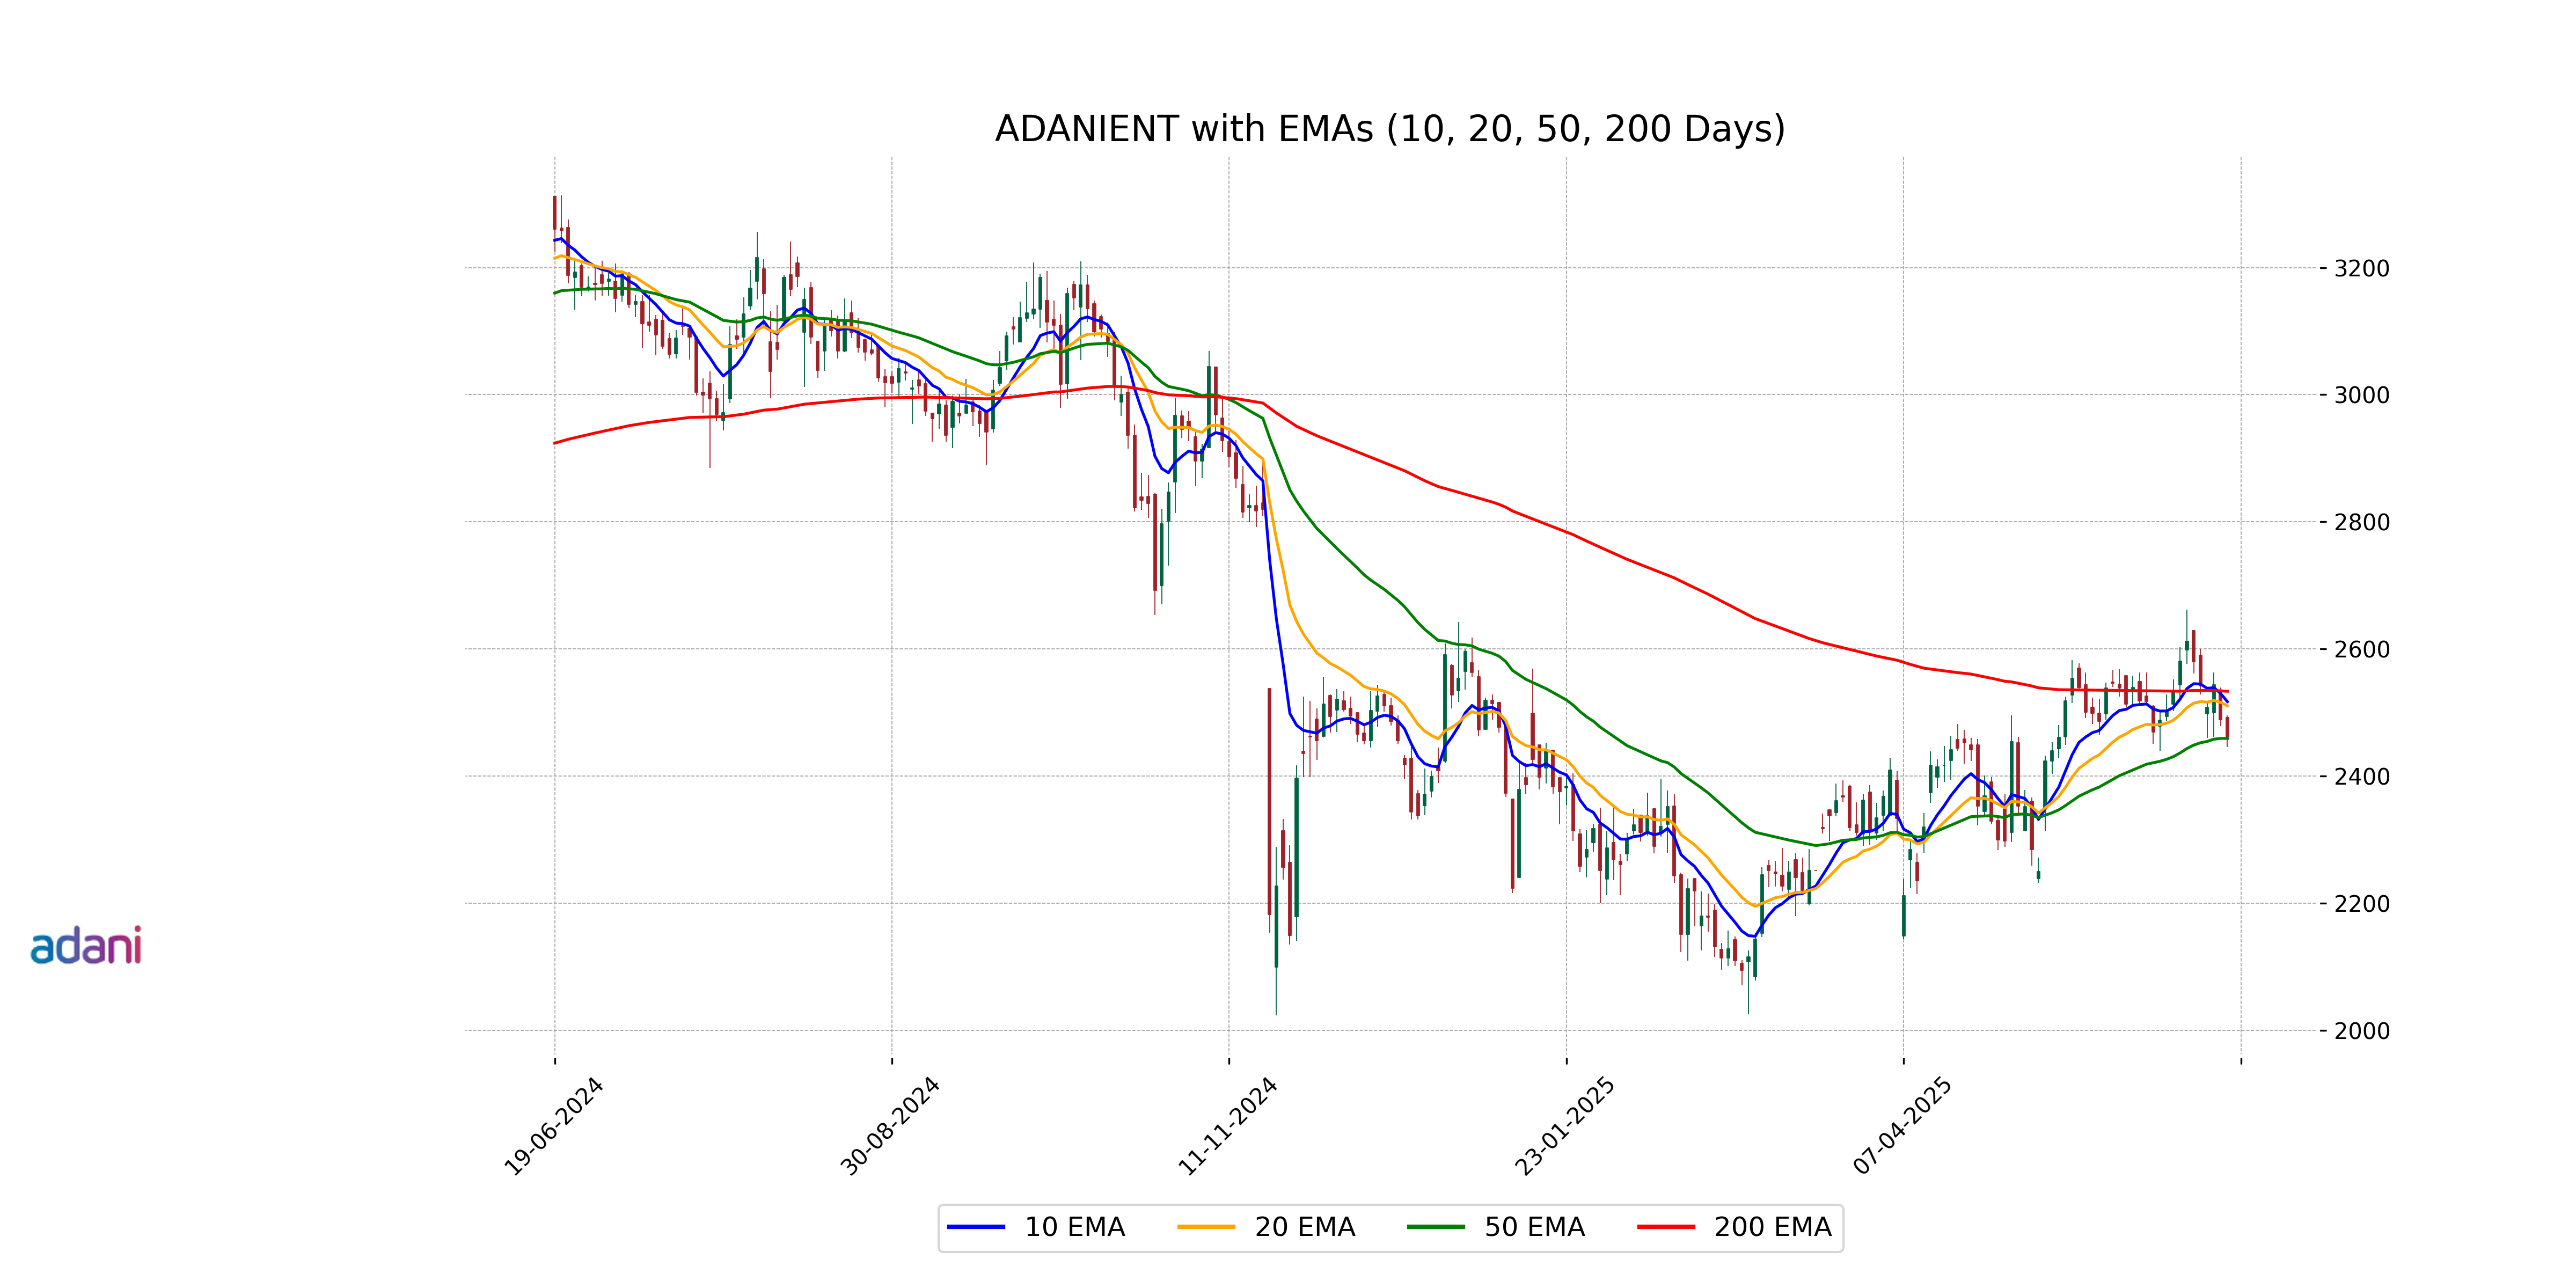
Relationship with Key Moving Averages
Adani Enterprises' stock price is currently slightly below its 50 EMA of 2459.30 but significantly below its 200 EMA of 2533.51. This suggests a short-term equilibrium around the 50 EMA while indicating a downward trend relative to the long-term moving average.
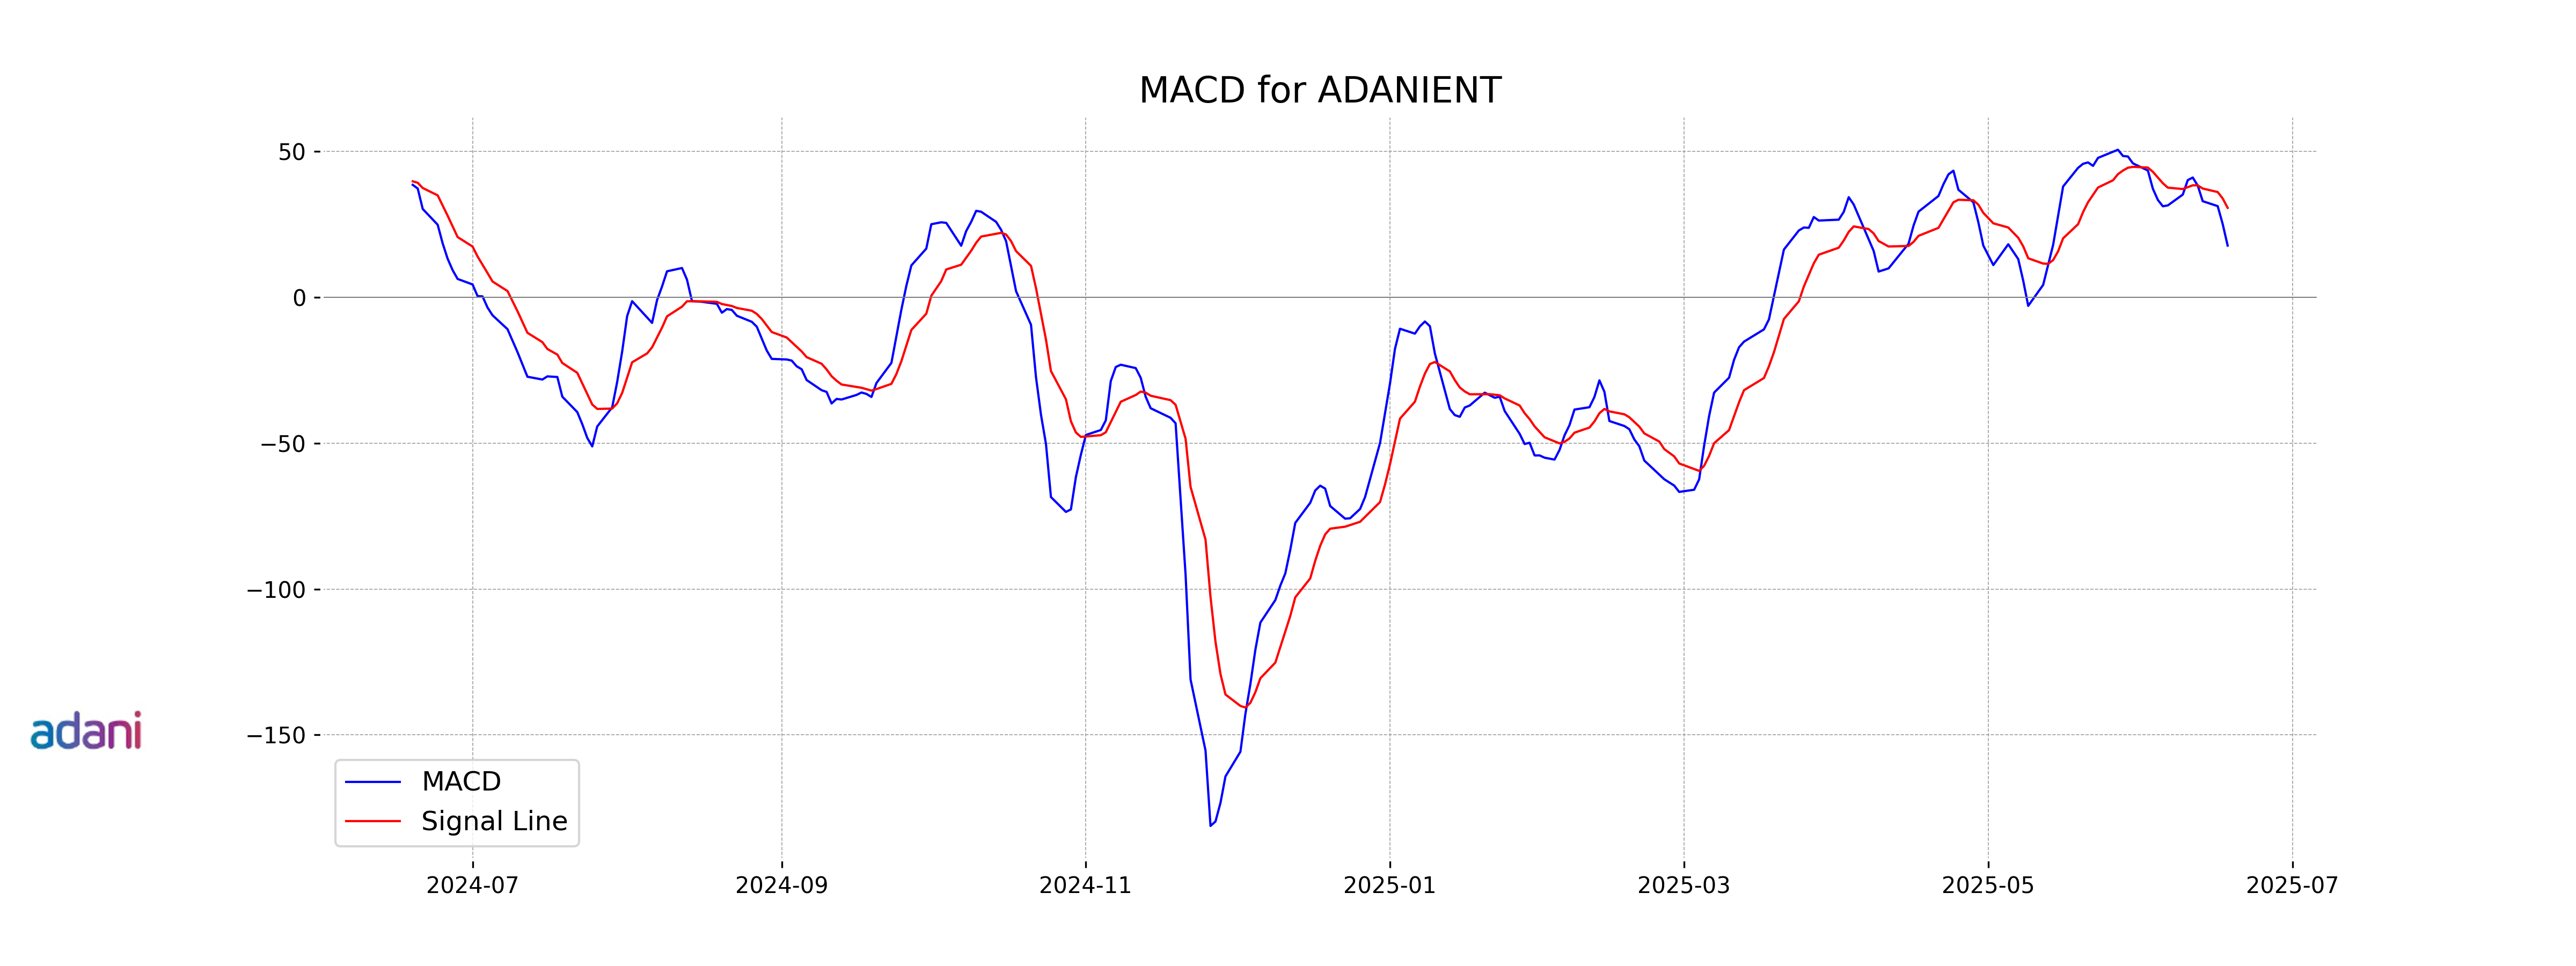
Moving Averages Trend (MACD)
Adani Enterprises' MACD is currently at 17.76, which is below the MACD Signal line at 30.68. This suggests that the stock is experiencing bearish momentum, indicating that it might continue to face downward pressure in the short term. Investors should watch for any crossover events for potential trend reversals.
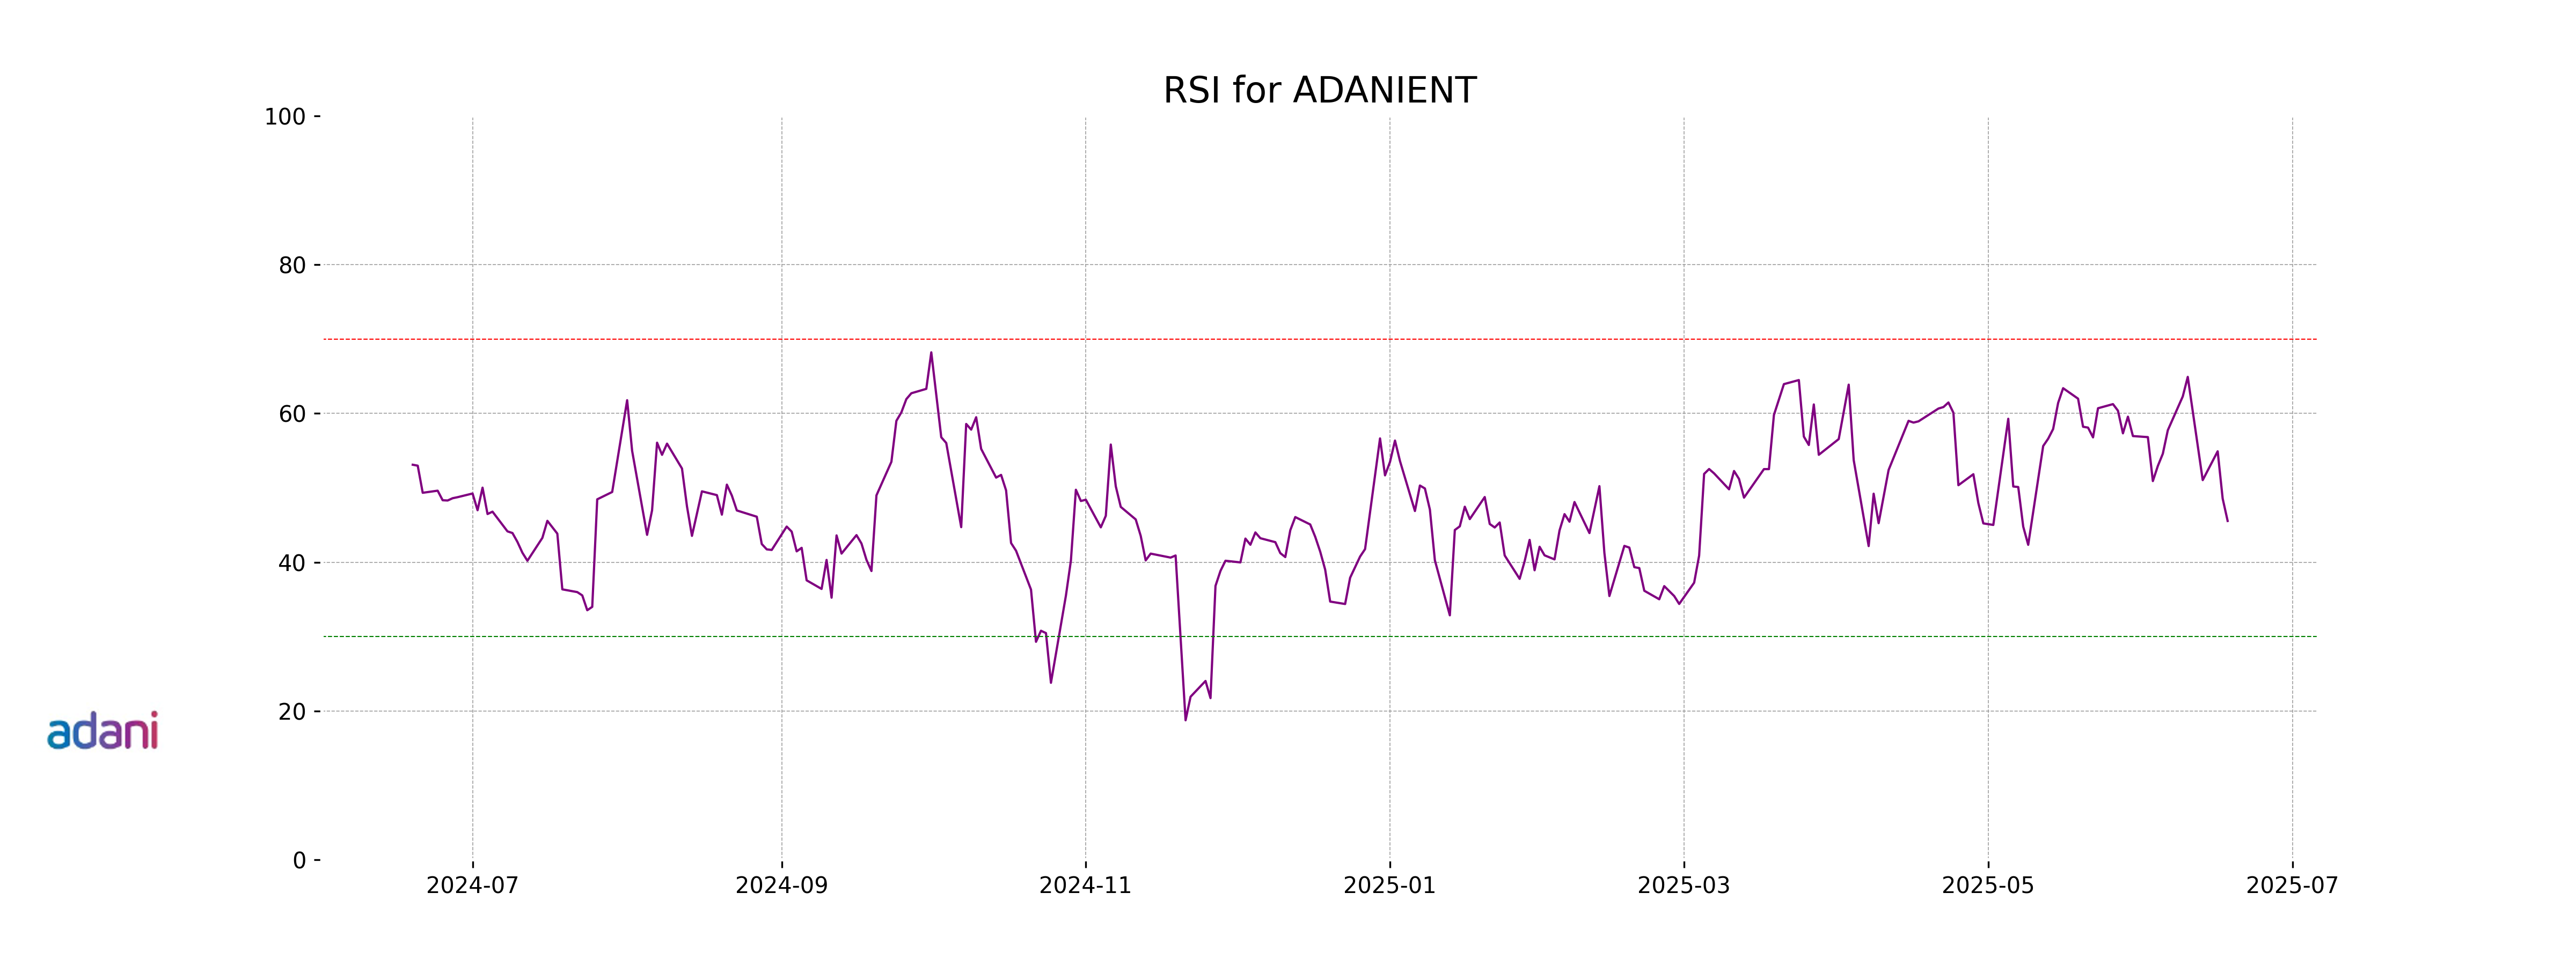
RSI Analysis
Adani Enterprises has an RSI of 45.55, indicating that the stock is neither in overbought nor oversold territory. This suggests a relatively neutral momentum, where neither buyers nor sellers are showing strong dominance. This level could signal potential stability or a period of sideways trading.
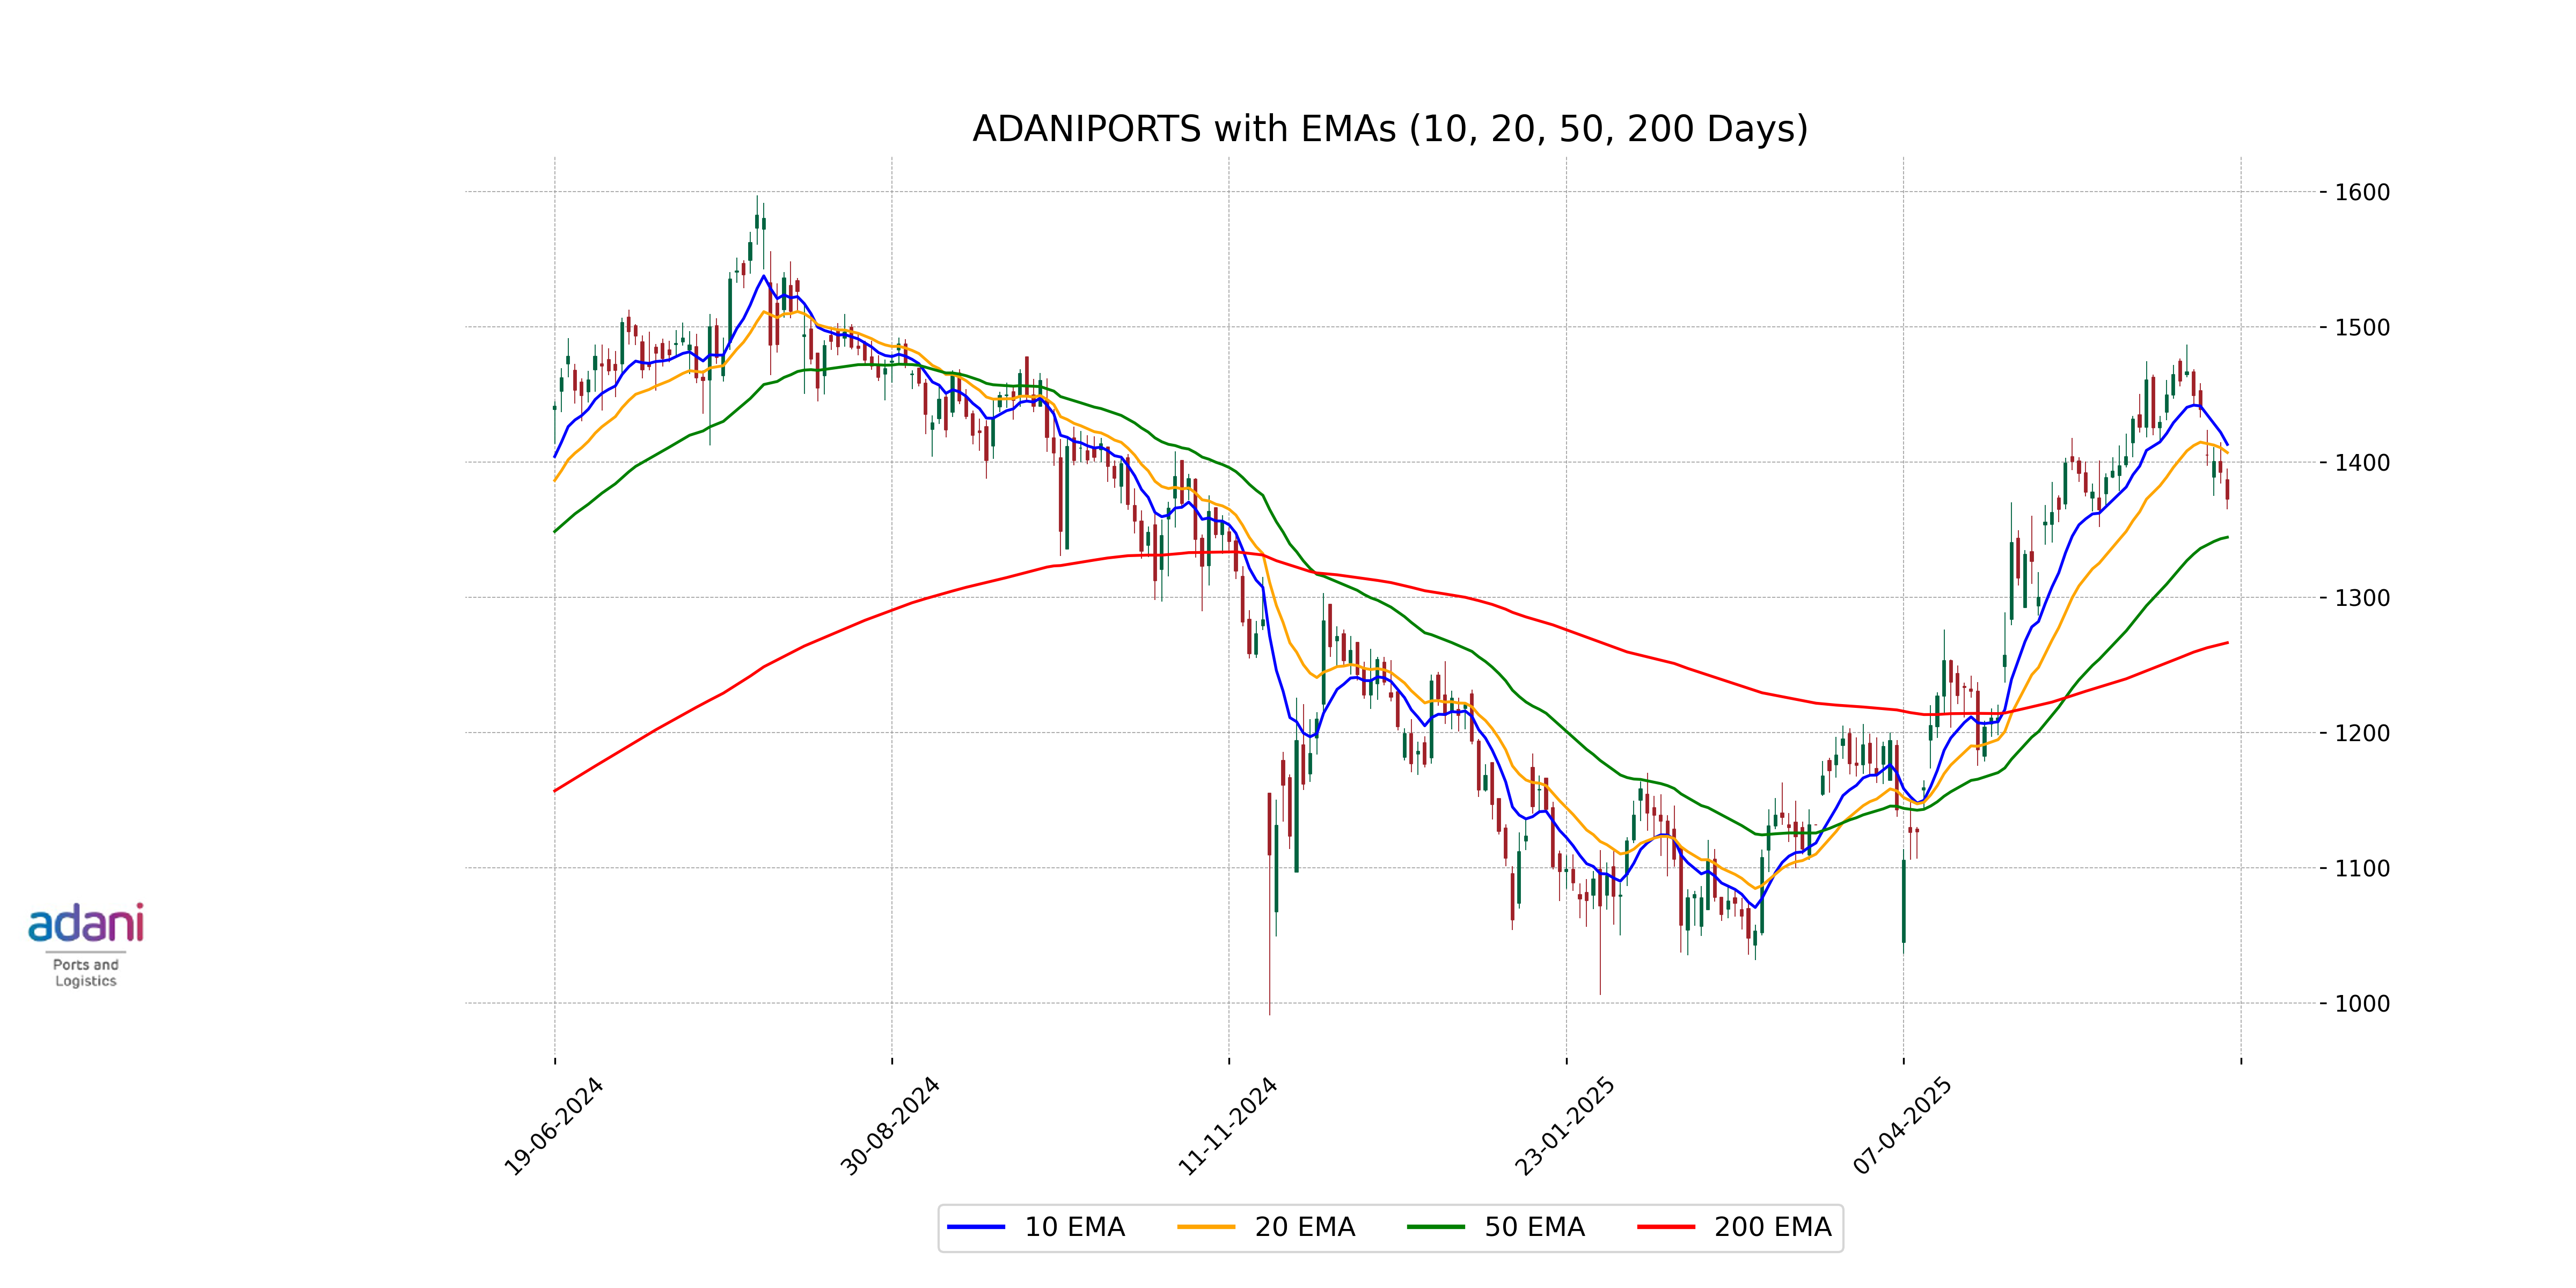
Analysis for Adani Ports - June 18, 2025
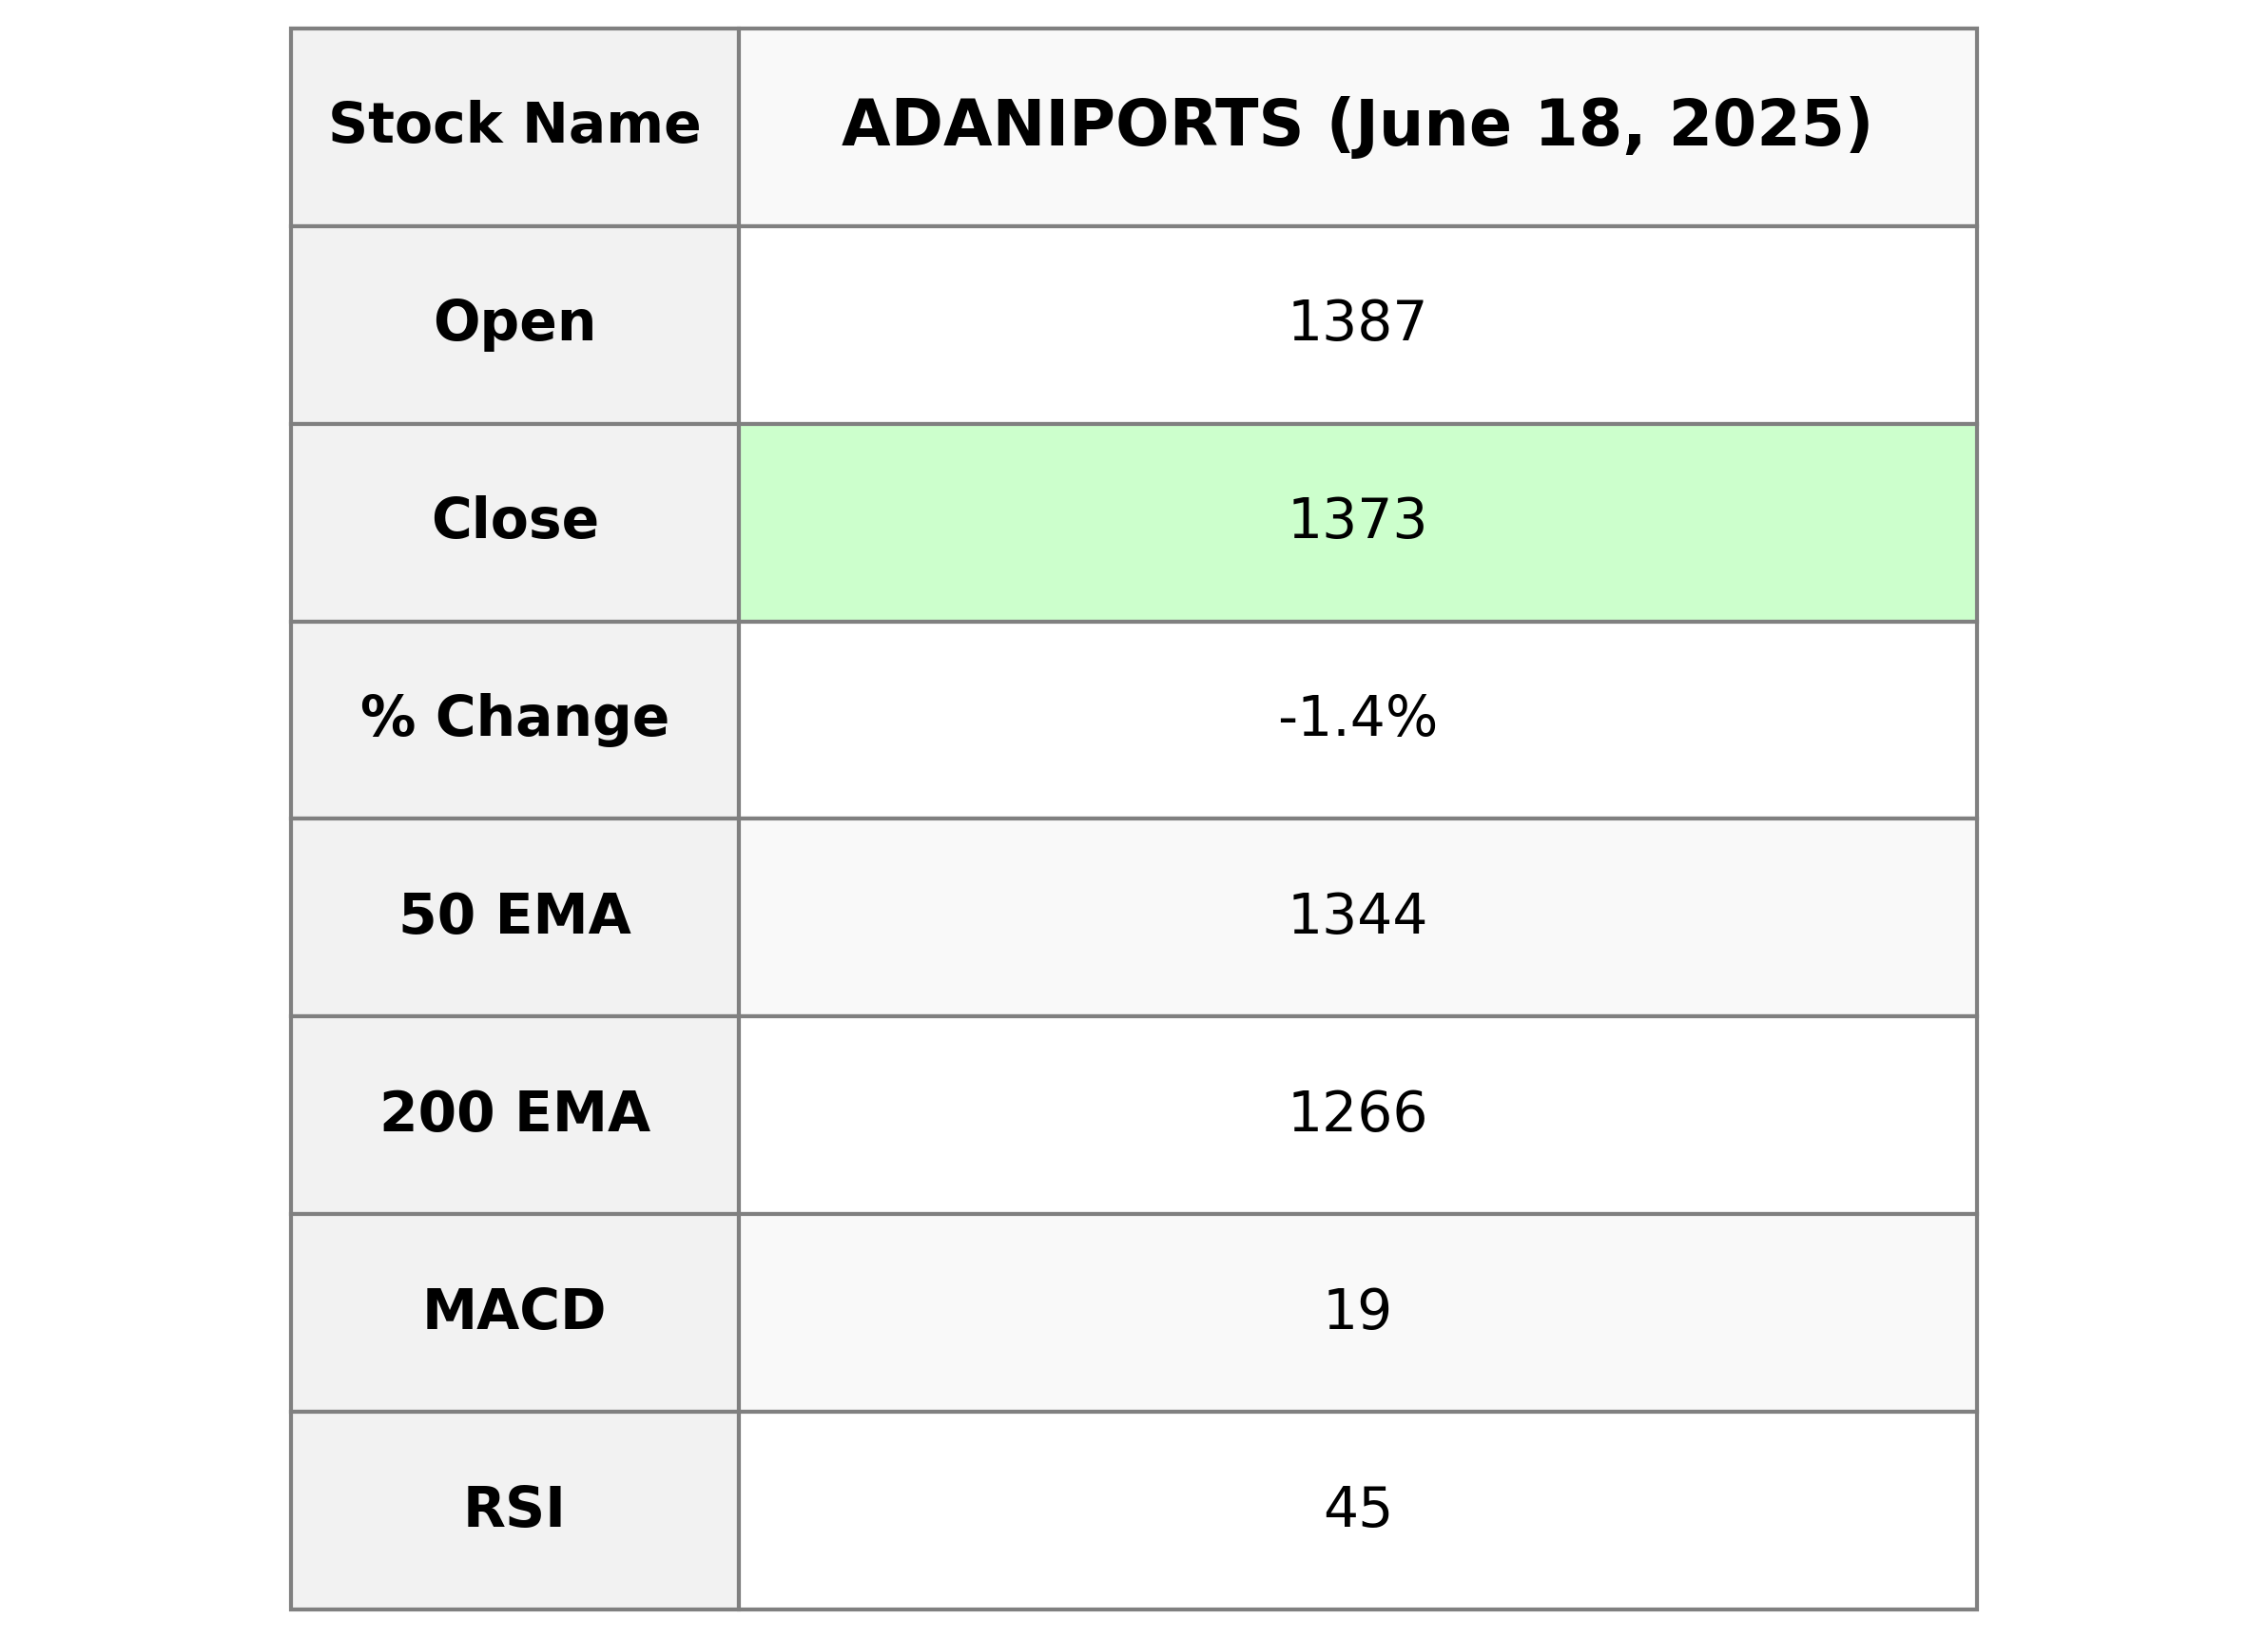
Adani Ports had a negative performance with a closing price of 1372.60, experiencing a -1.41% change from the previous close. The stock traded with a volume of 1,731,843 shares. With a Relative Strength Index (RSI) of 44.94, it suggests moderate momentum, and the stock is below its recent EMAs, indicating potential further weakness in the short term.
Relationship with Key Moving Averages
Adani Ports' current stock price is below both its 10-day and 20-day EMAs but above the 50-day and 200-day EMAs. This positioning suggests a short-term bearish trend with potential longer-term support.
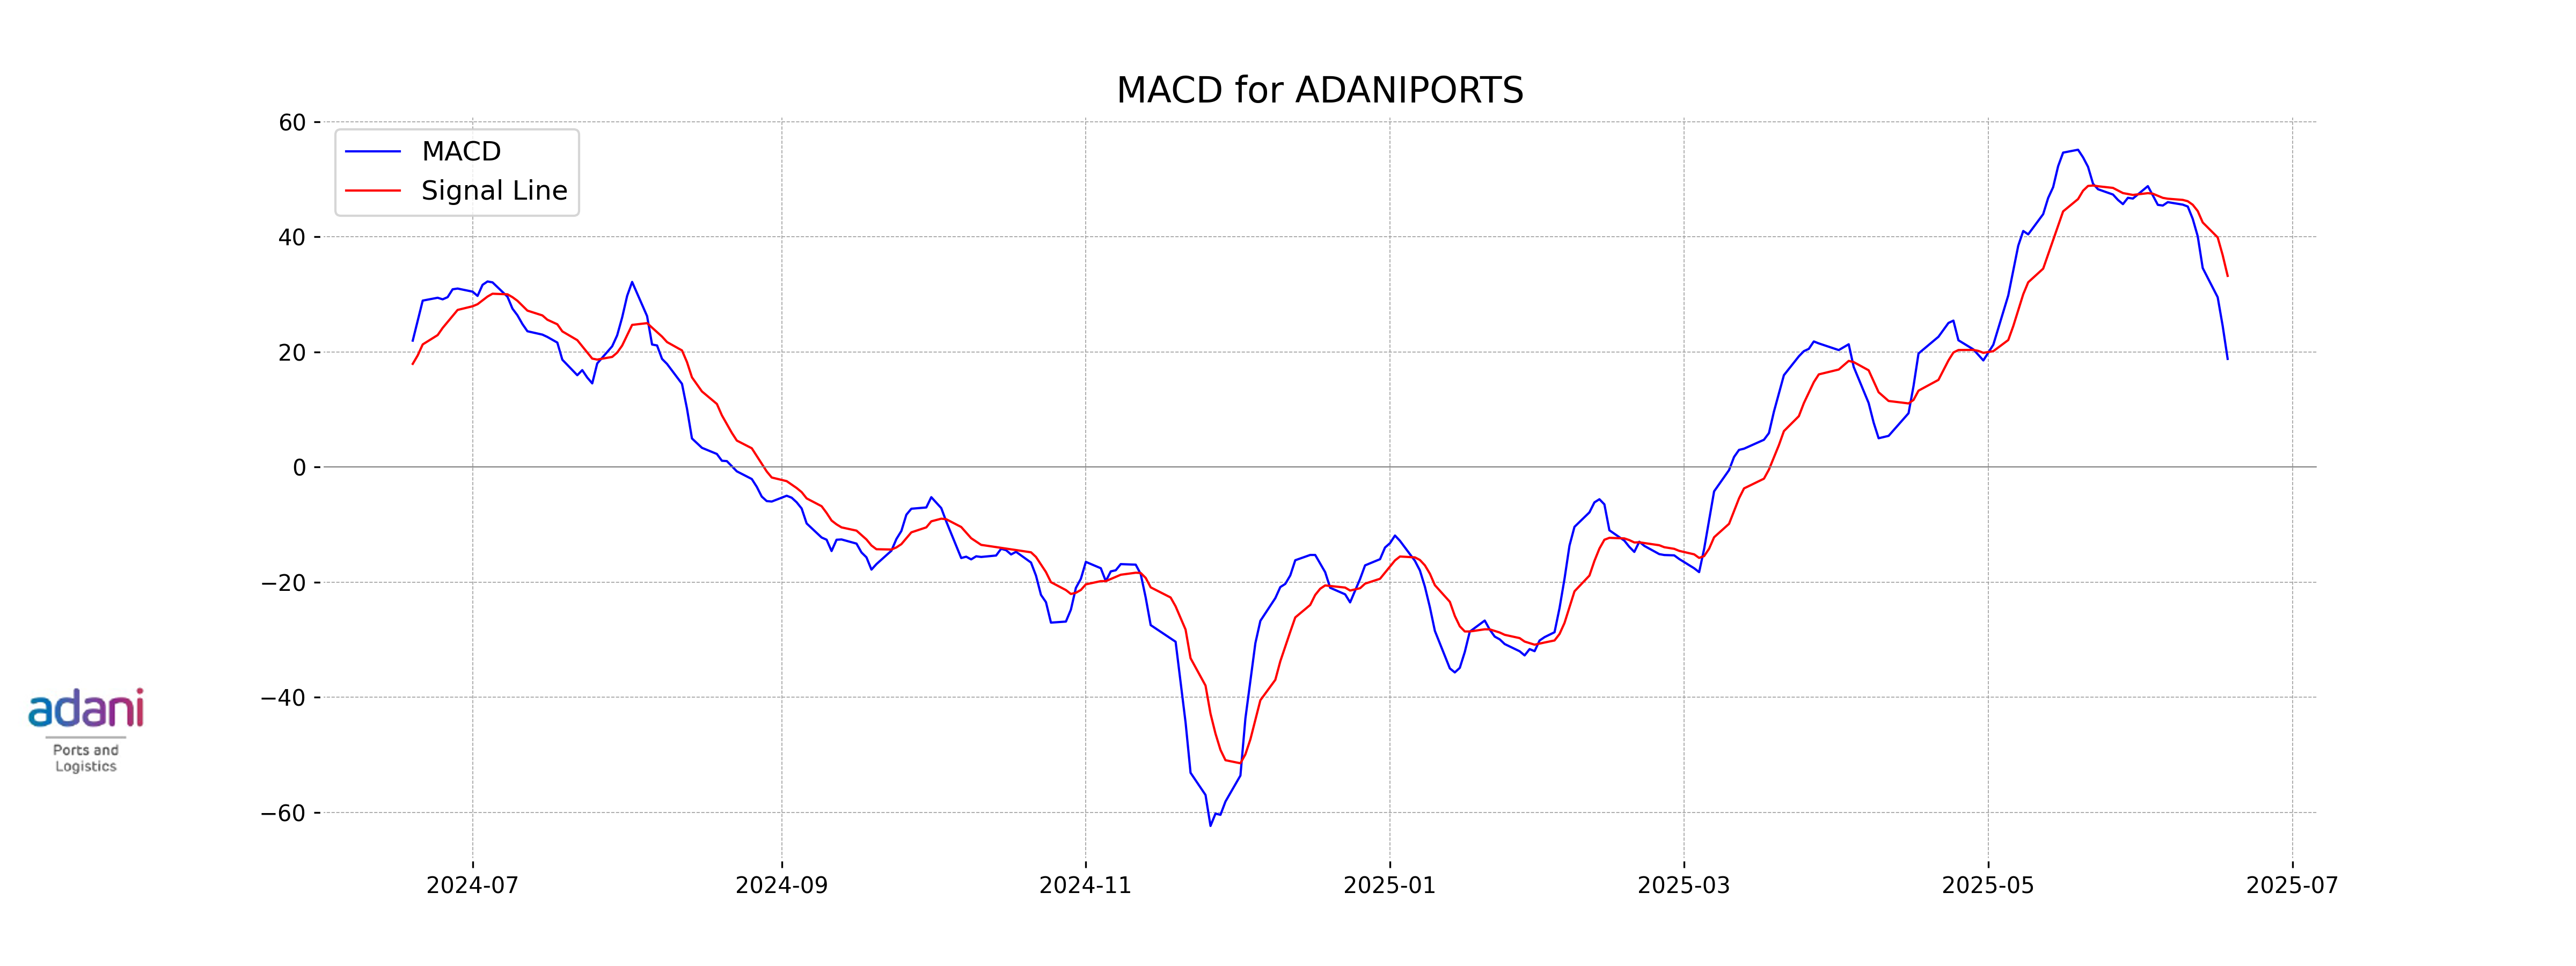
Moving Averages Trend (MACD)
The MACD for Adani Ports is currently at 18.81, which is below the MACD Signal line of 33.24. This indicates a bearish momentum as the MACD line crossing below the signal line is typically seen as a sell signal.
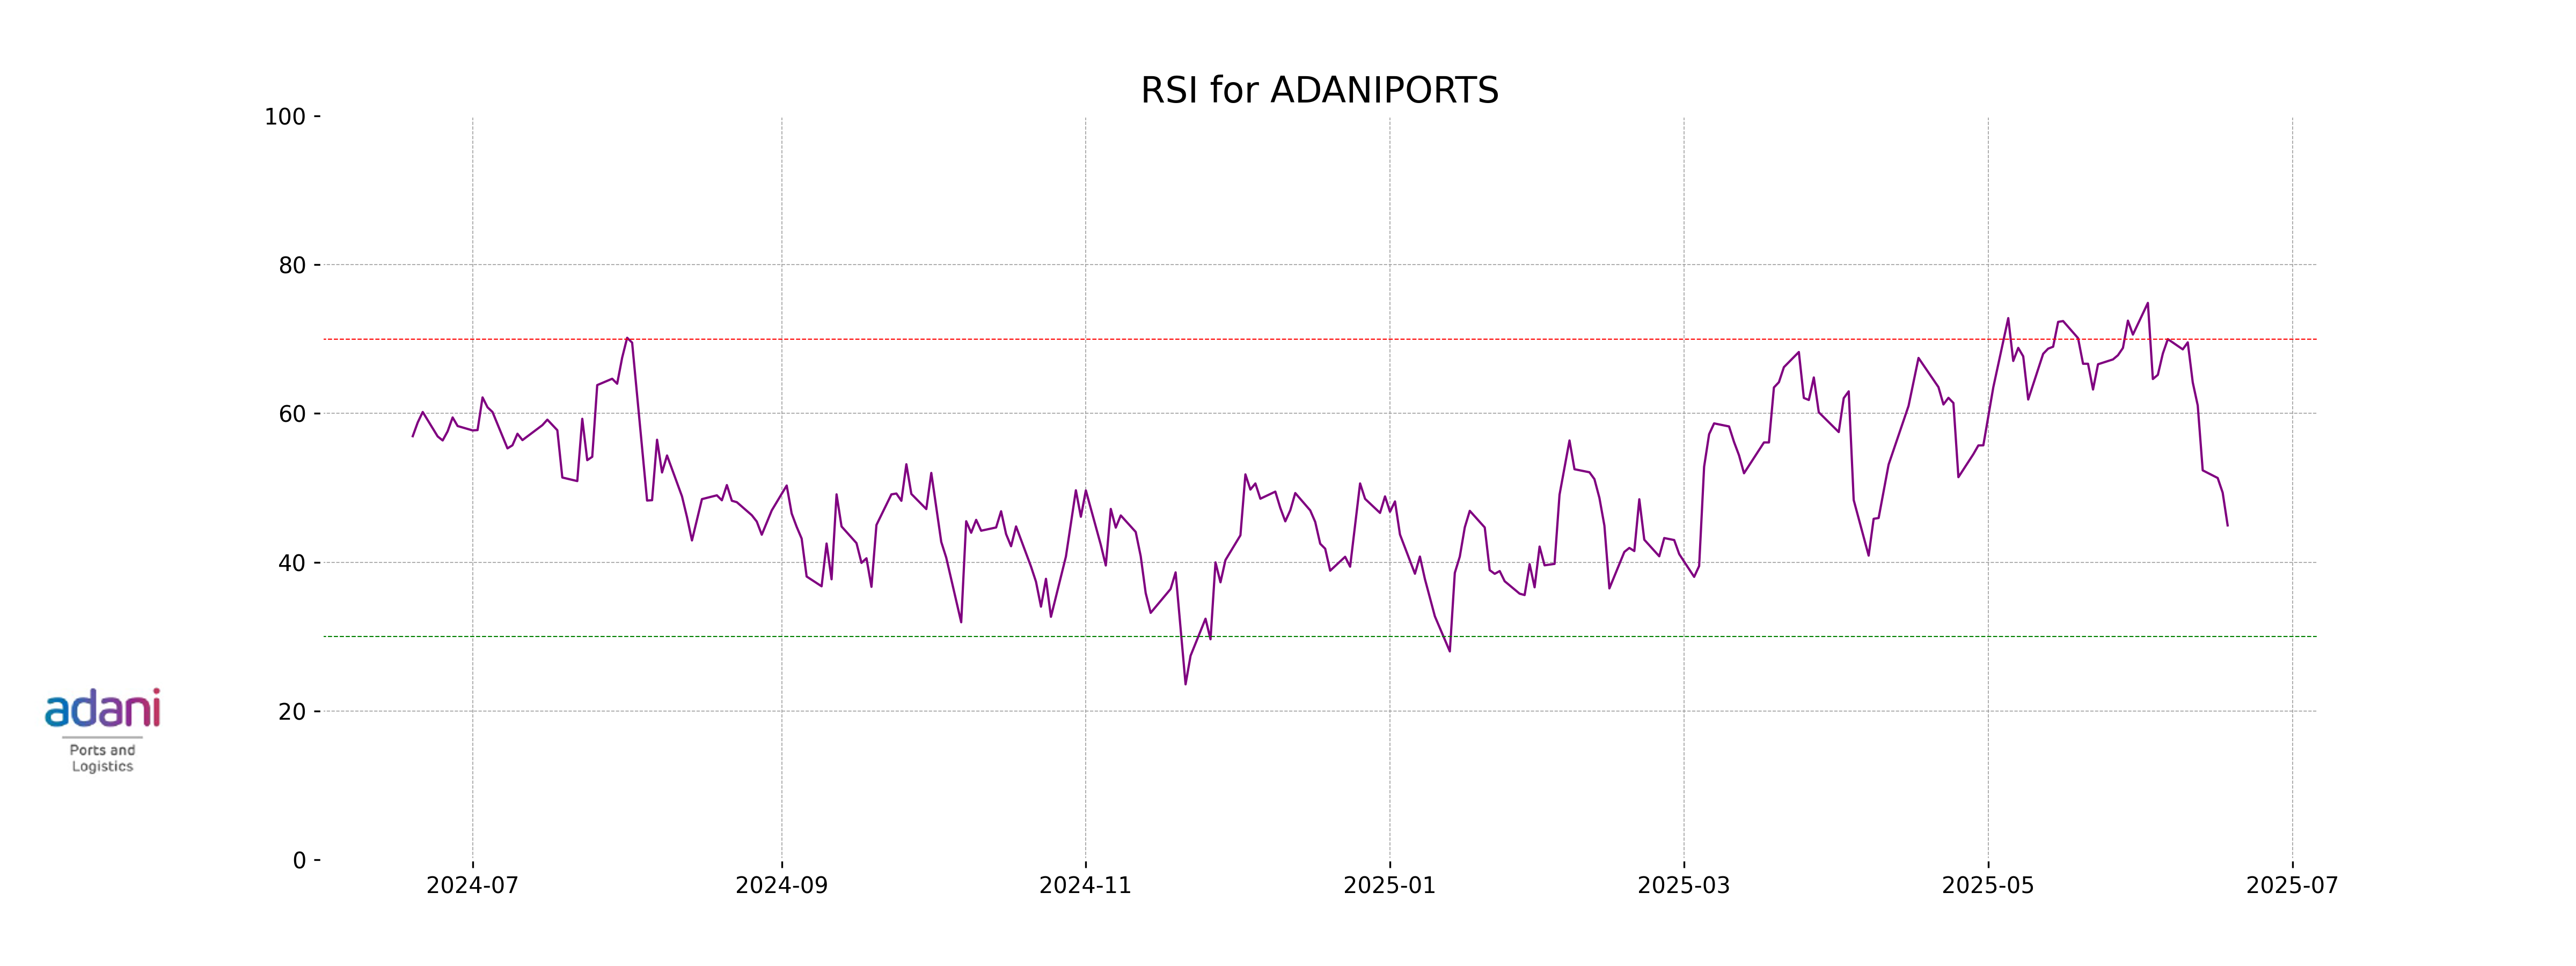
RSI Analysis
Adani Ports' RSI of 44.95 indicates that the stock is in a neutral position, suggesting neither an overbought nor oversold condition. Generally, RSI values above 70 indicate overbought conditions, whereas values below 30 suggest oversold conditions. This neutral RSI suggests there may be a balanced demand and supply in the current market for Adani Ports.
Analysis for Hindustan Unilever - June 18, 2025
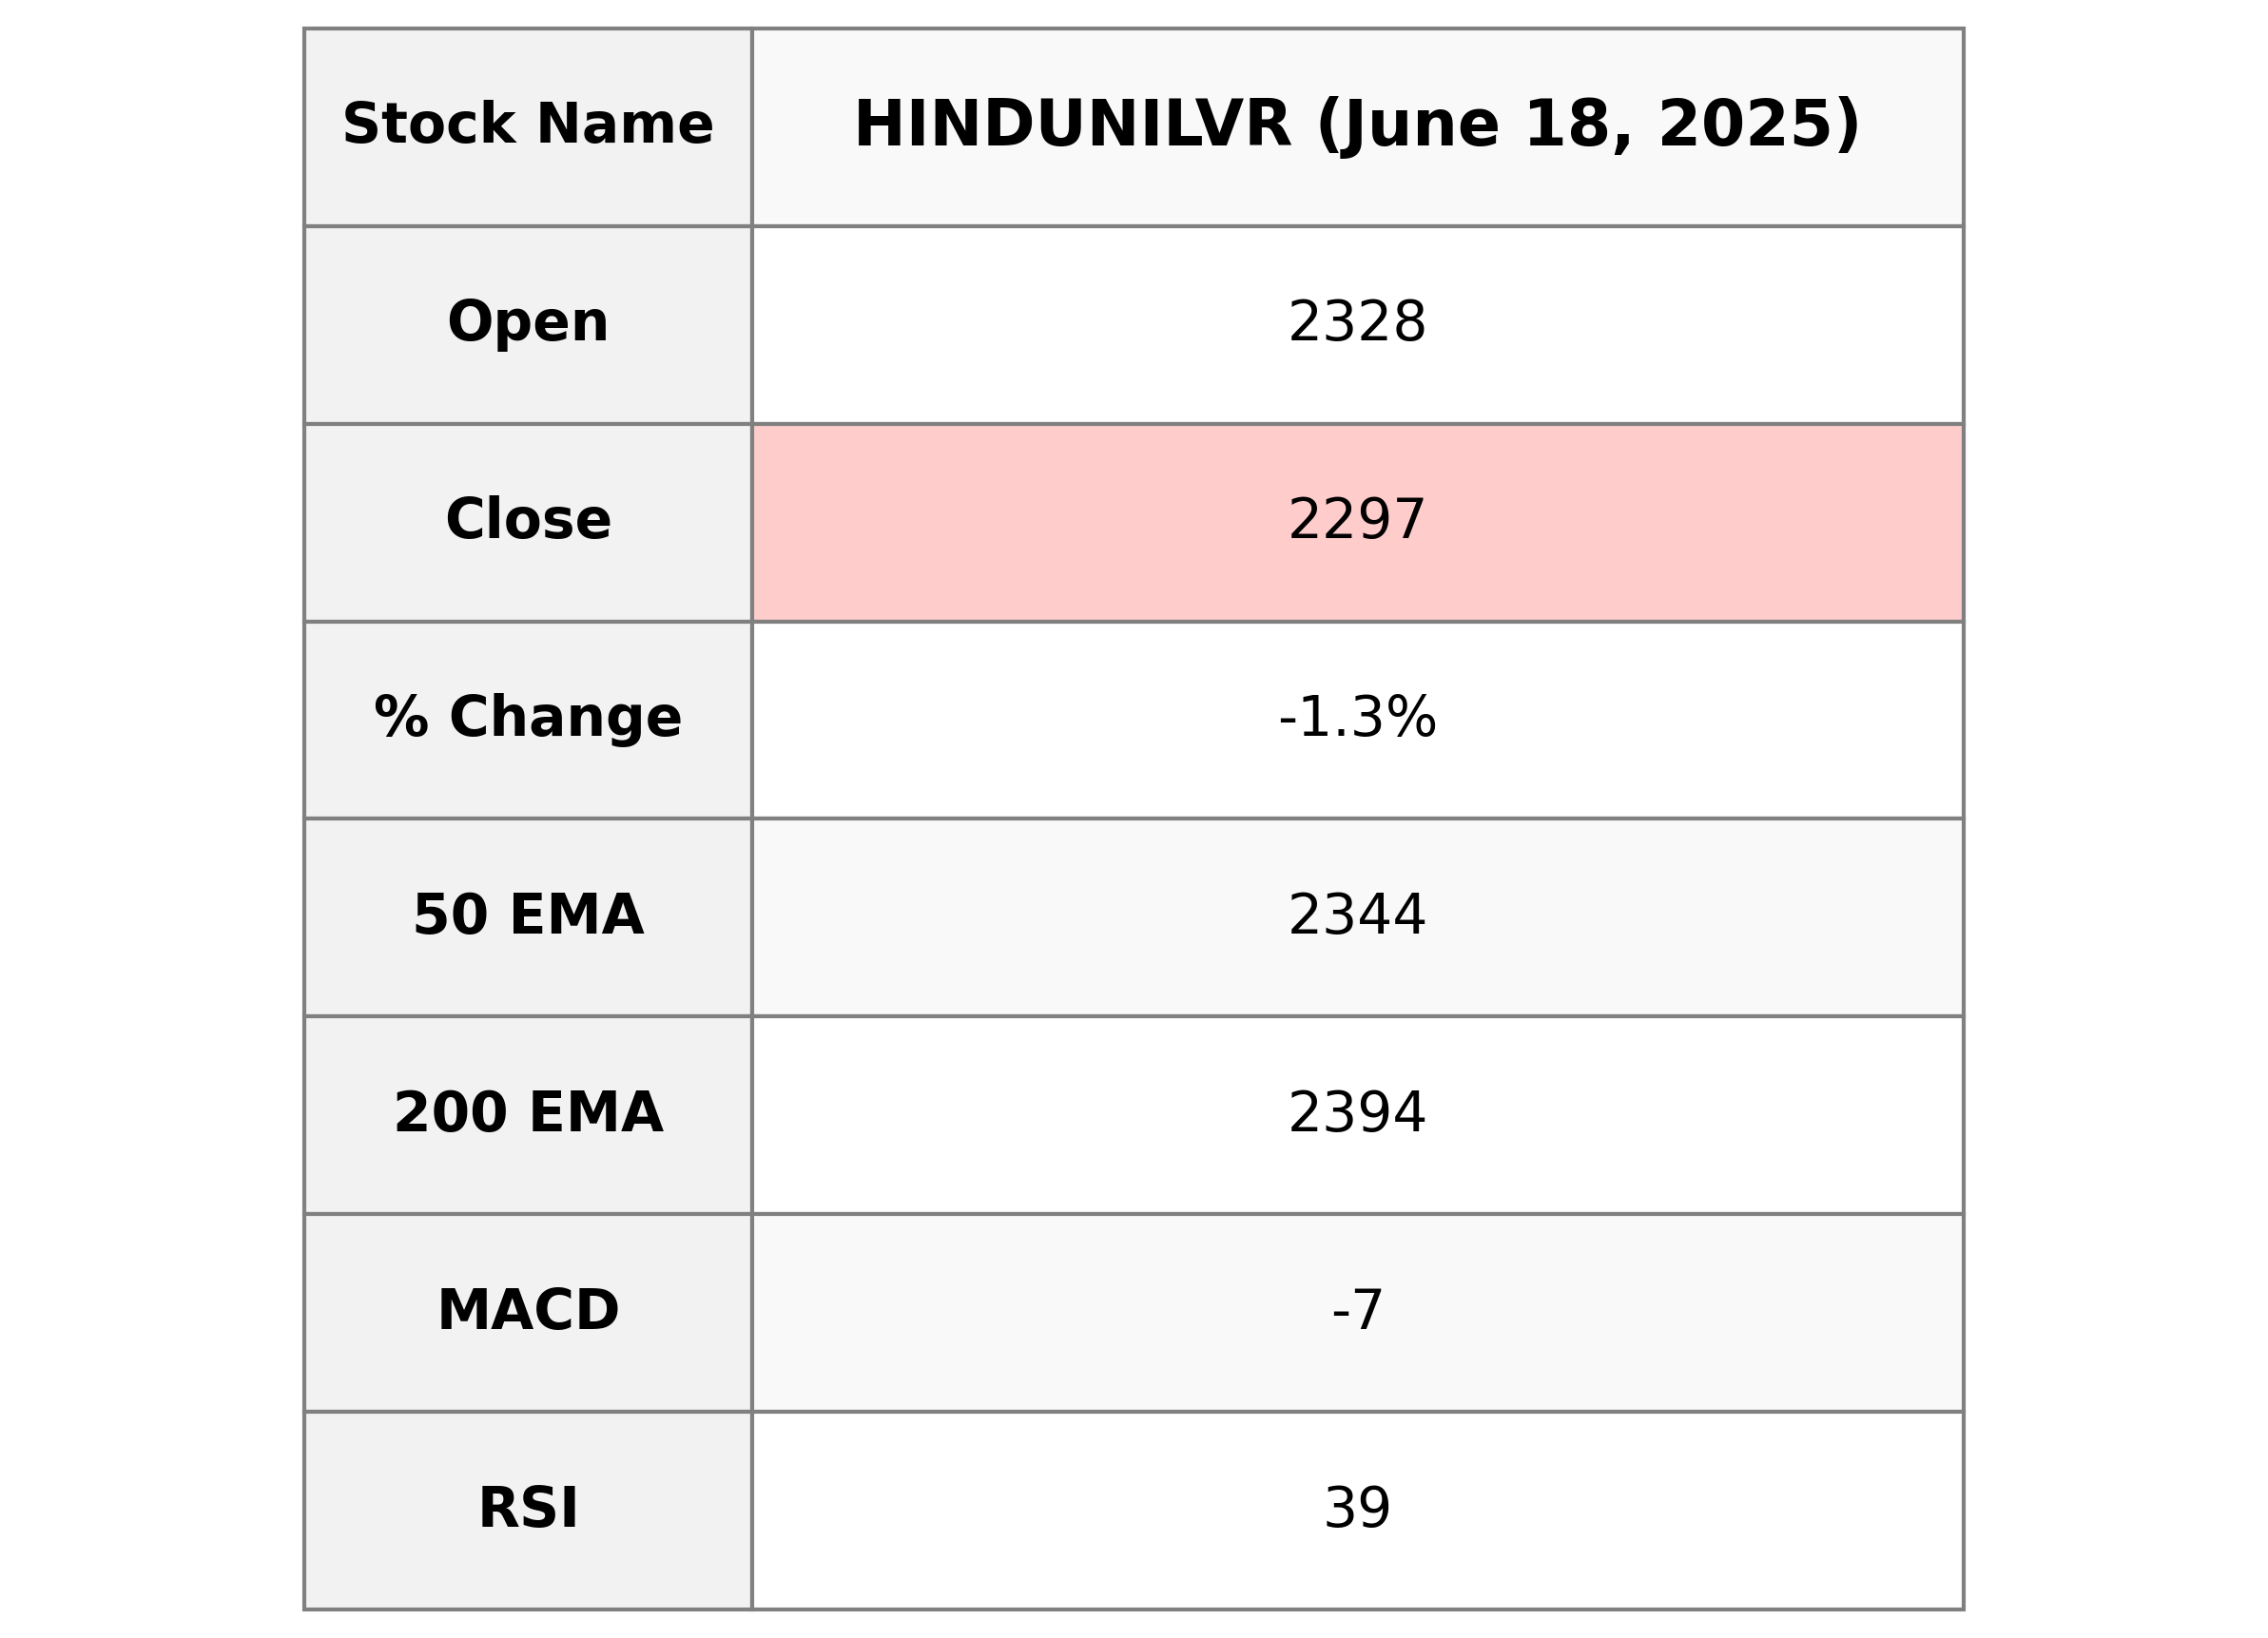
Hindustan Unilever Performance Summary: Hindustan Unilever experienced a drop in its stock price with a close of 2297.30, falling by approximately 1.34% from the previous close of 2328.60. The stock has struggled against its significant moving averages, featuring a negative MACD, indicating potential bearish momentum, and an RSI suggesting it is approaching oversold territory. The company's market cap stands at ₹5.40 trillion, reflecting its significant presence within the Consumer Defensive sector in India.
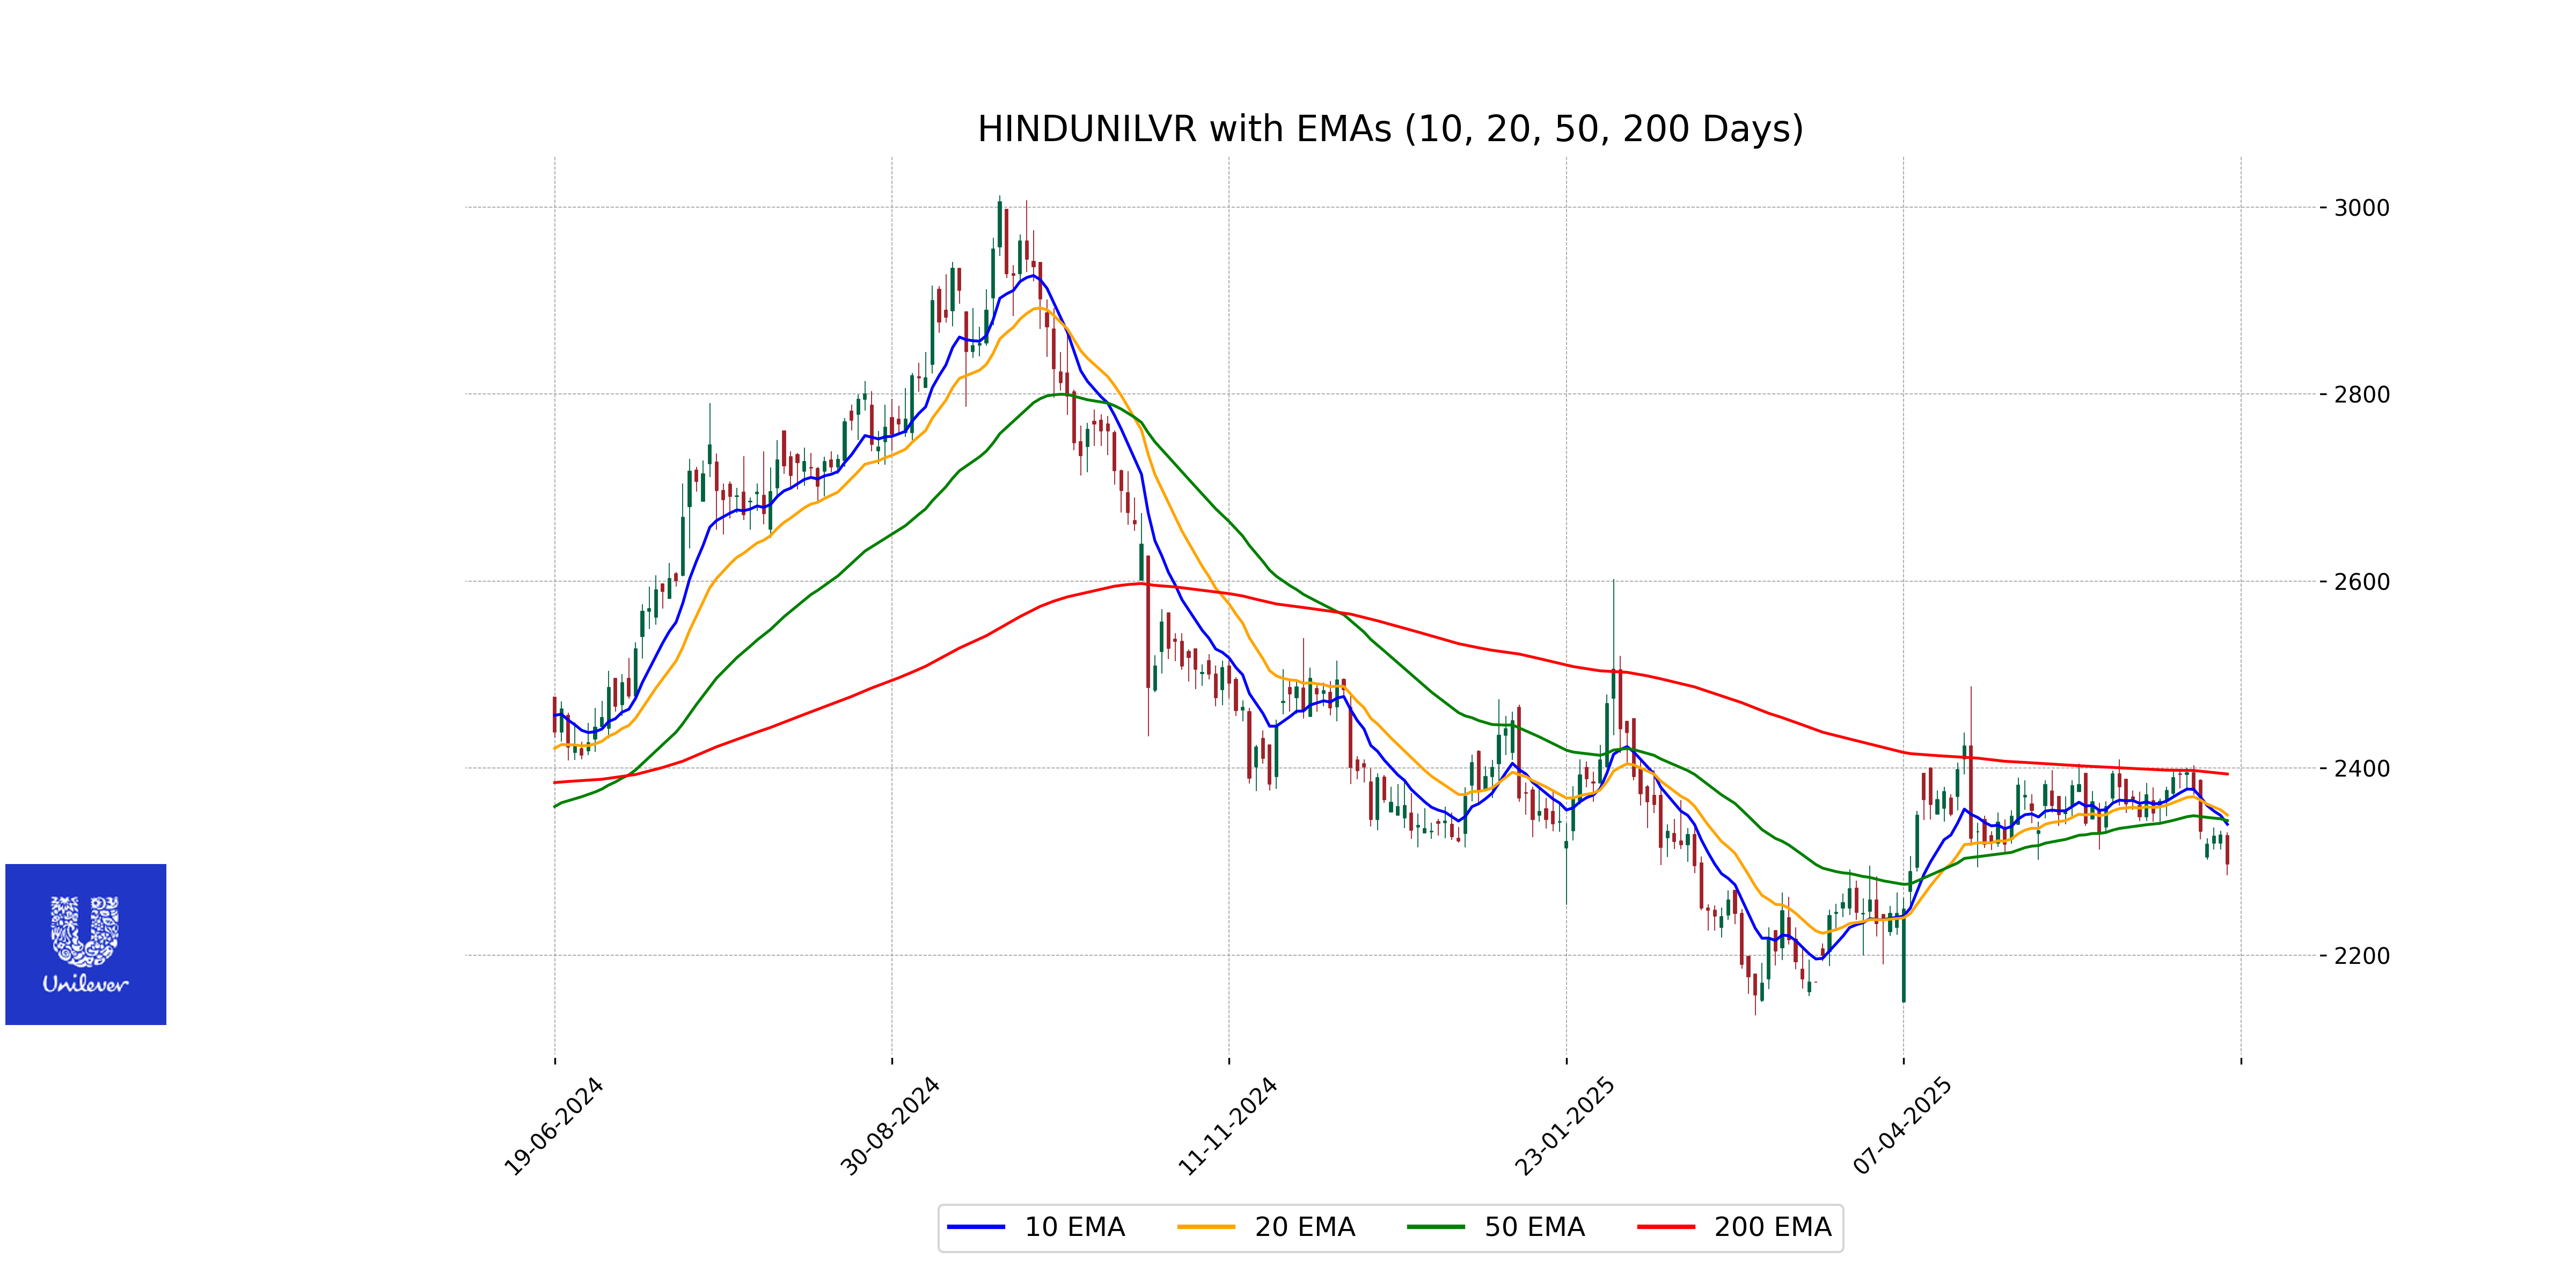
Relationship with Key Moving Averages
Hindustan Unilever's current stock price of 2297.30 is trading below its key moving averages, including the 50-day EMA (2344.02), the 20-day EMA (2349.92), and the 10-day EMA (2340.04), indicating a potential bearish trend. The stock is also below the 200-day EMA (2393.80), suggesting long-term weakness compared to historical performance.
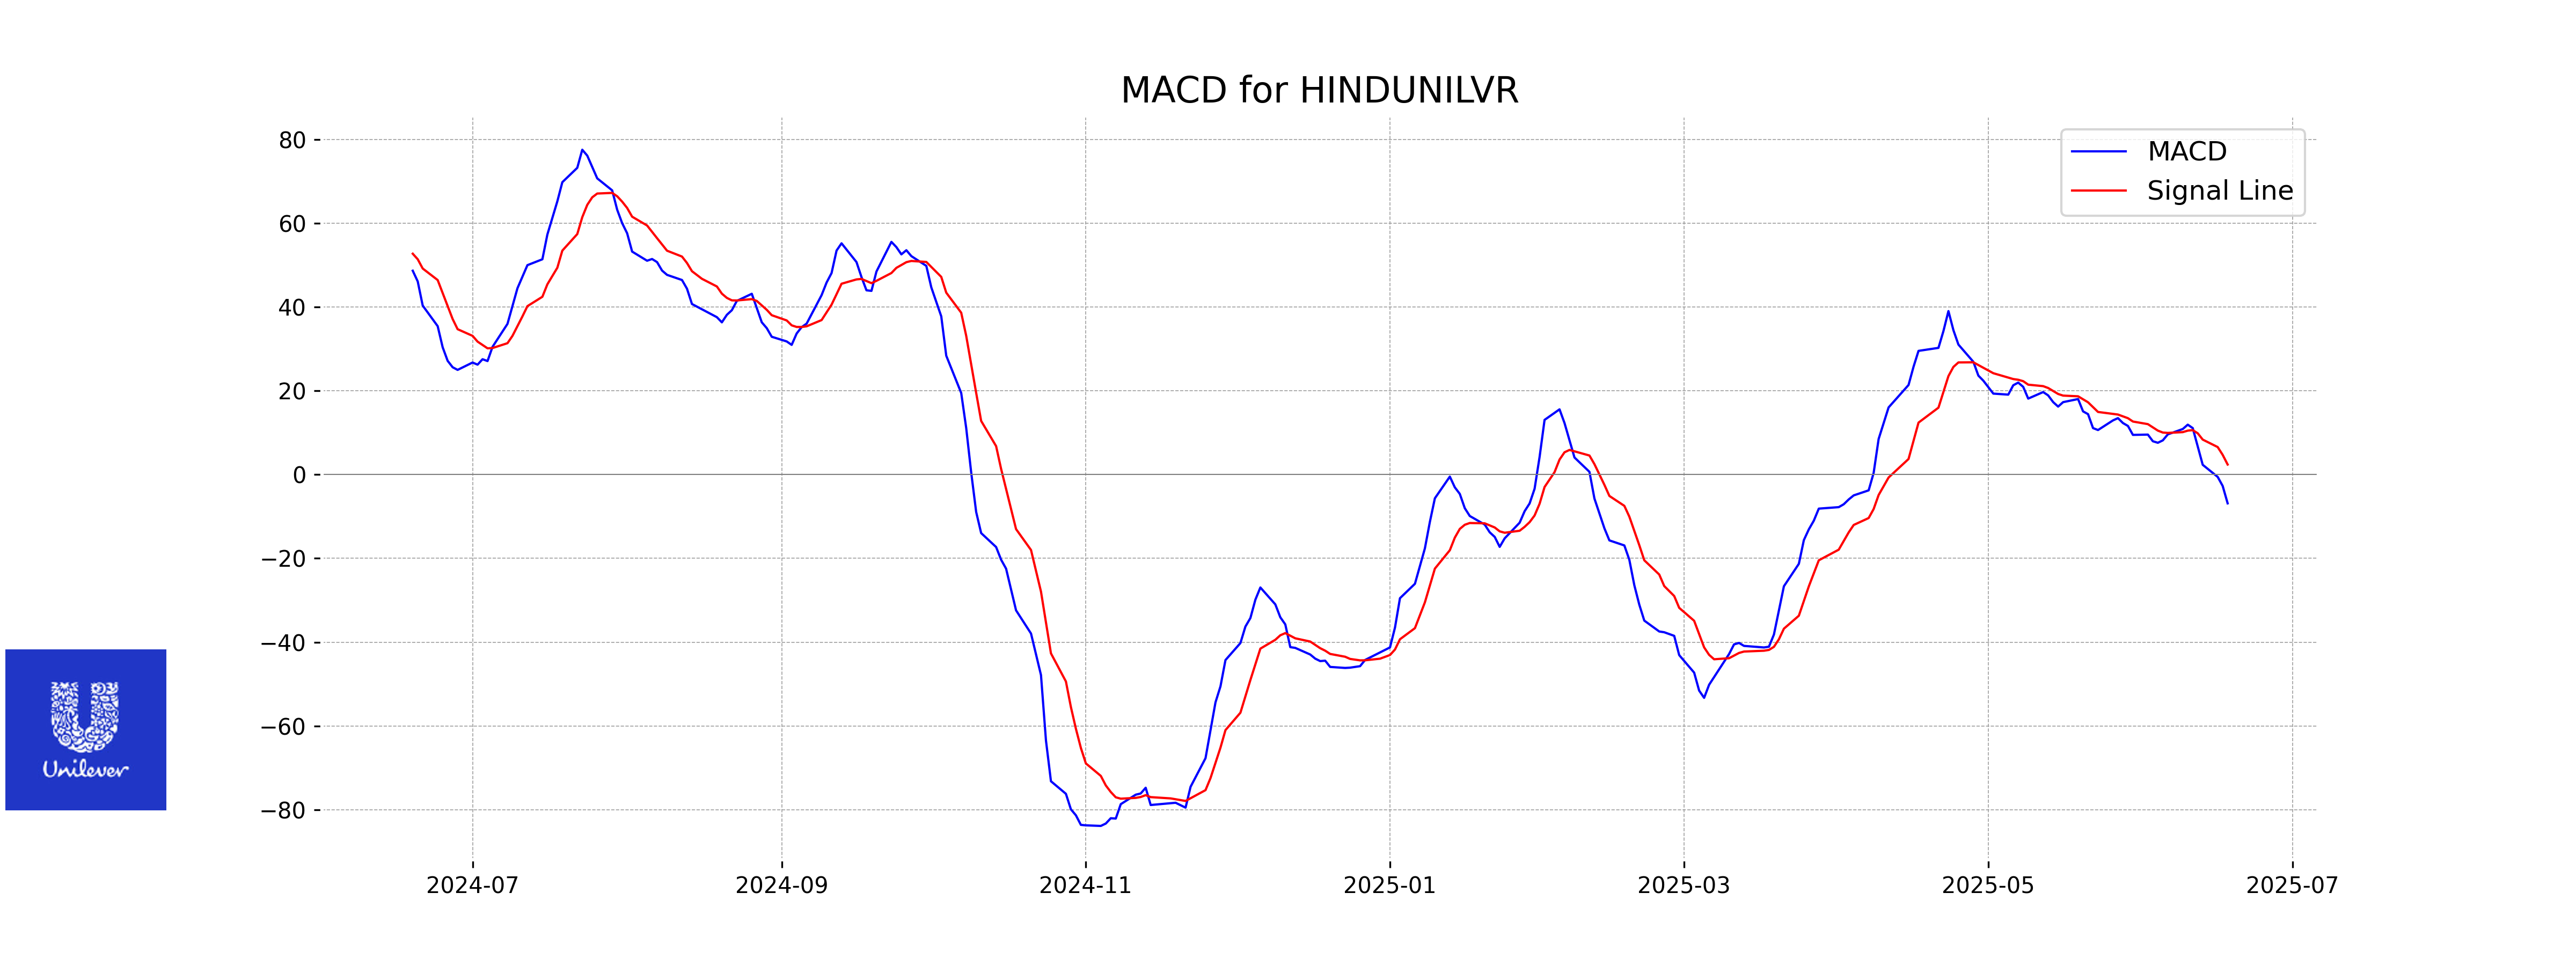
Moving Averages Trend (MACD)
Hindustan Unilever MACD Analysis: The MACD value for Hindustan Unilever is -6.85, which is below the MACD Signal value of 2.41. This negative MACD suggests a bearish momentum for the stock, indicating the possibility of continued downward movement unless there is a reversal.
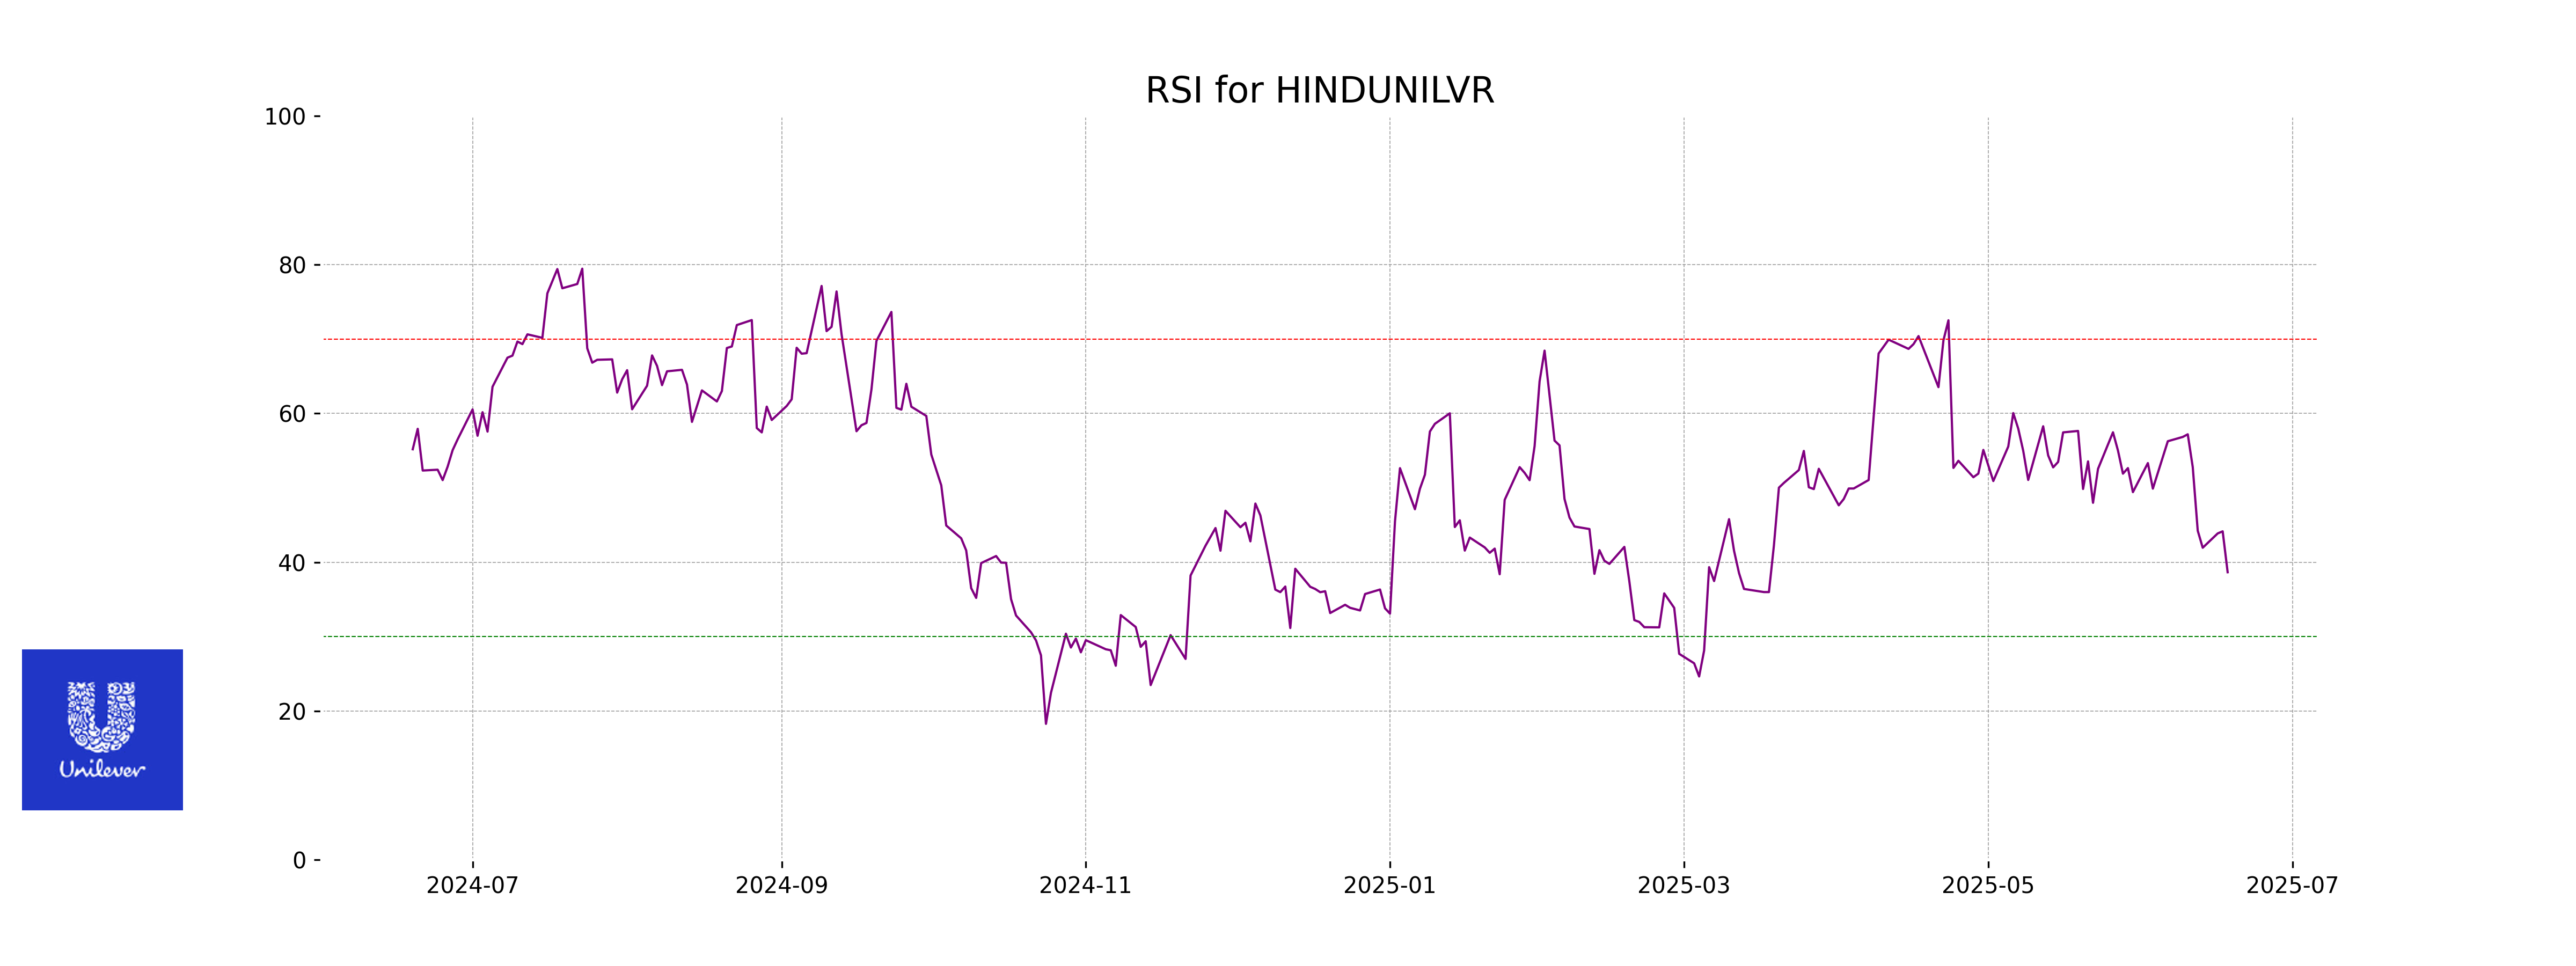
RSI Analysis
The RSI for Hindustan Unilever is currently at 38.65, indicating that the stock is in the lower range on the RSI scale. Generally, an RSI below 30 is considered oversold, while an RSI above 70 is considered overbought. While the stock is not yet in the oversold territory, it is moving towards it, suggesting potential buying opportunities if it continues to decrease.
Analysis for JSW Steel - June 18, 2025
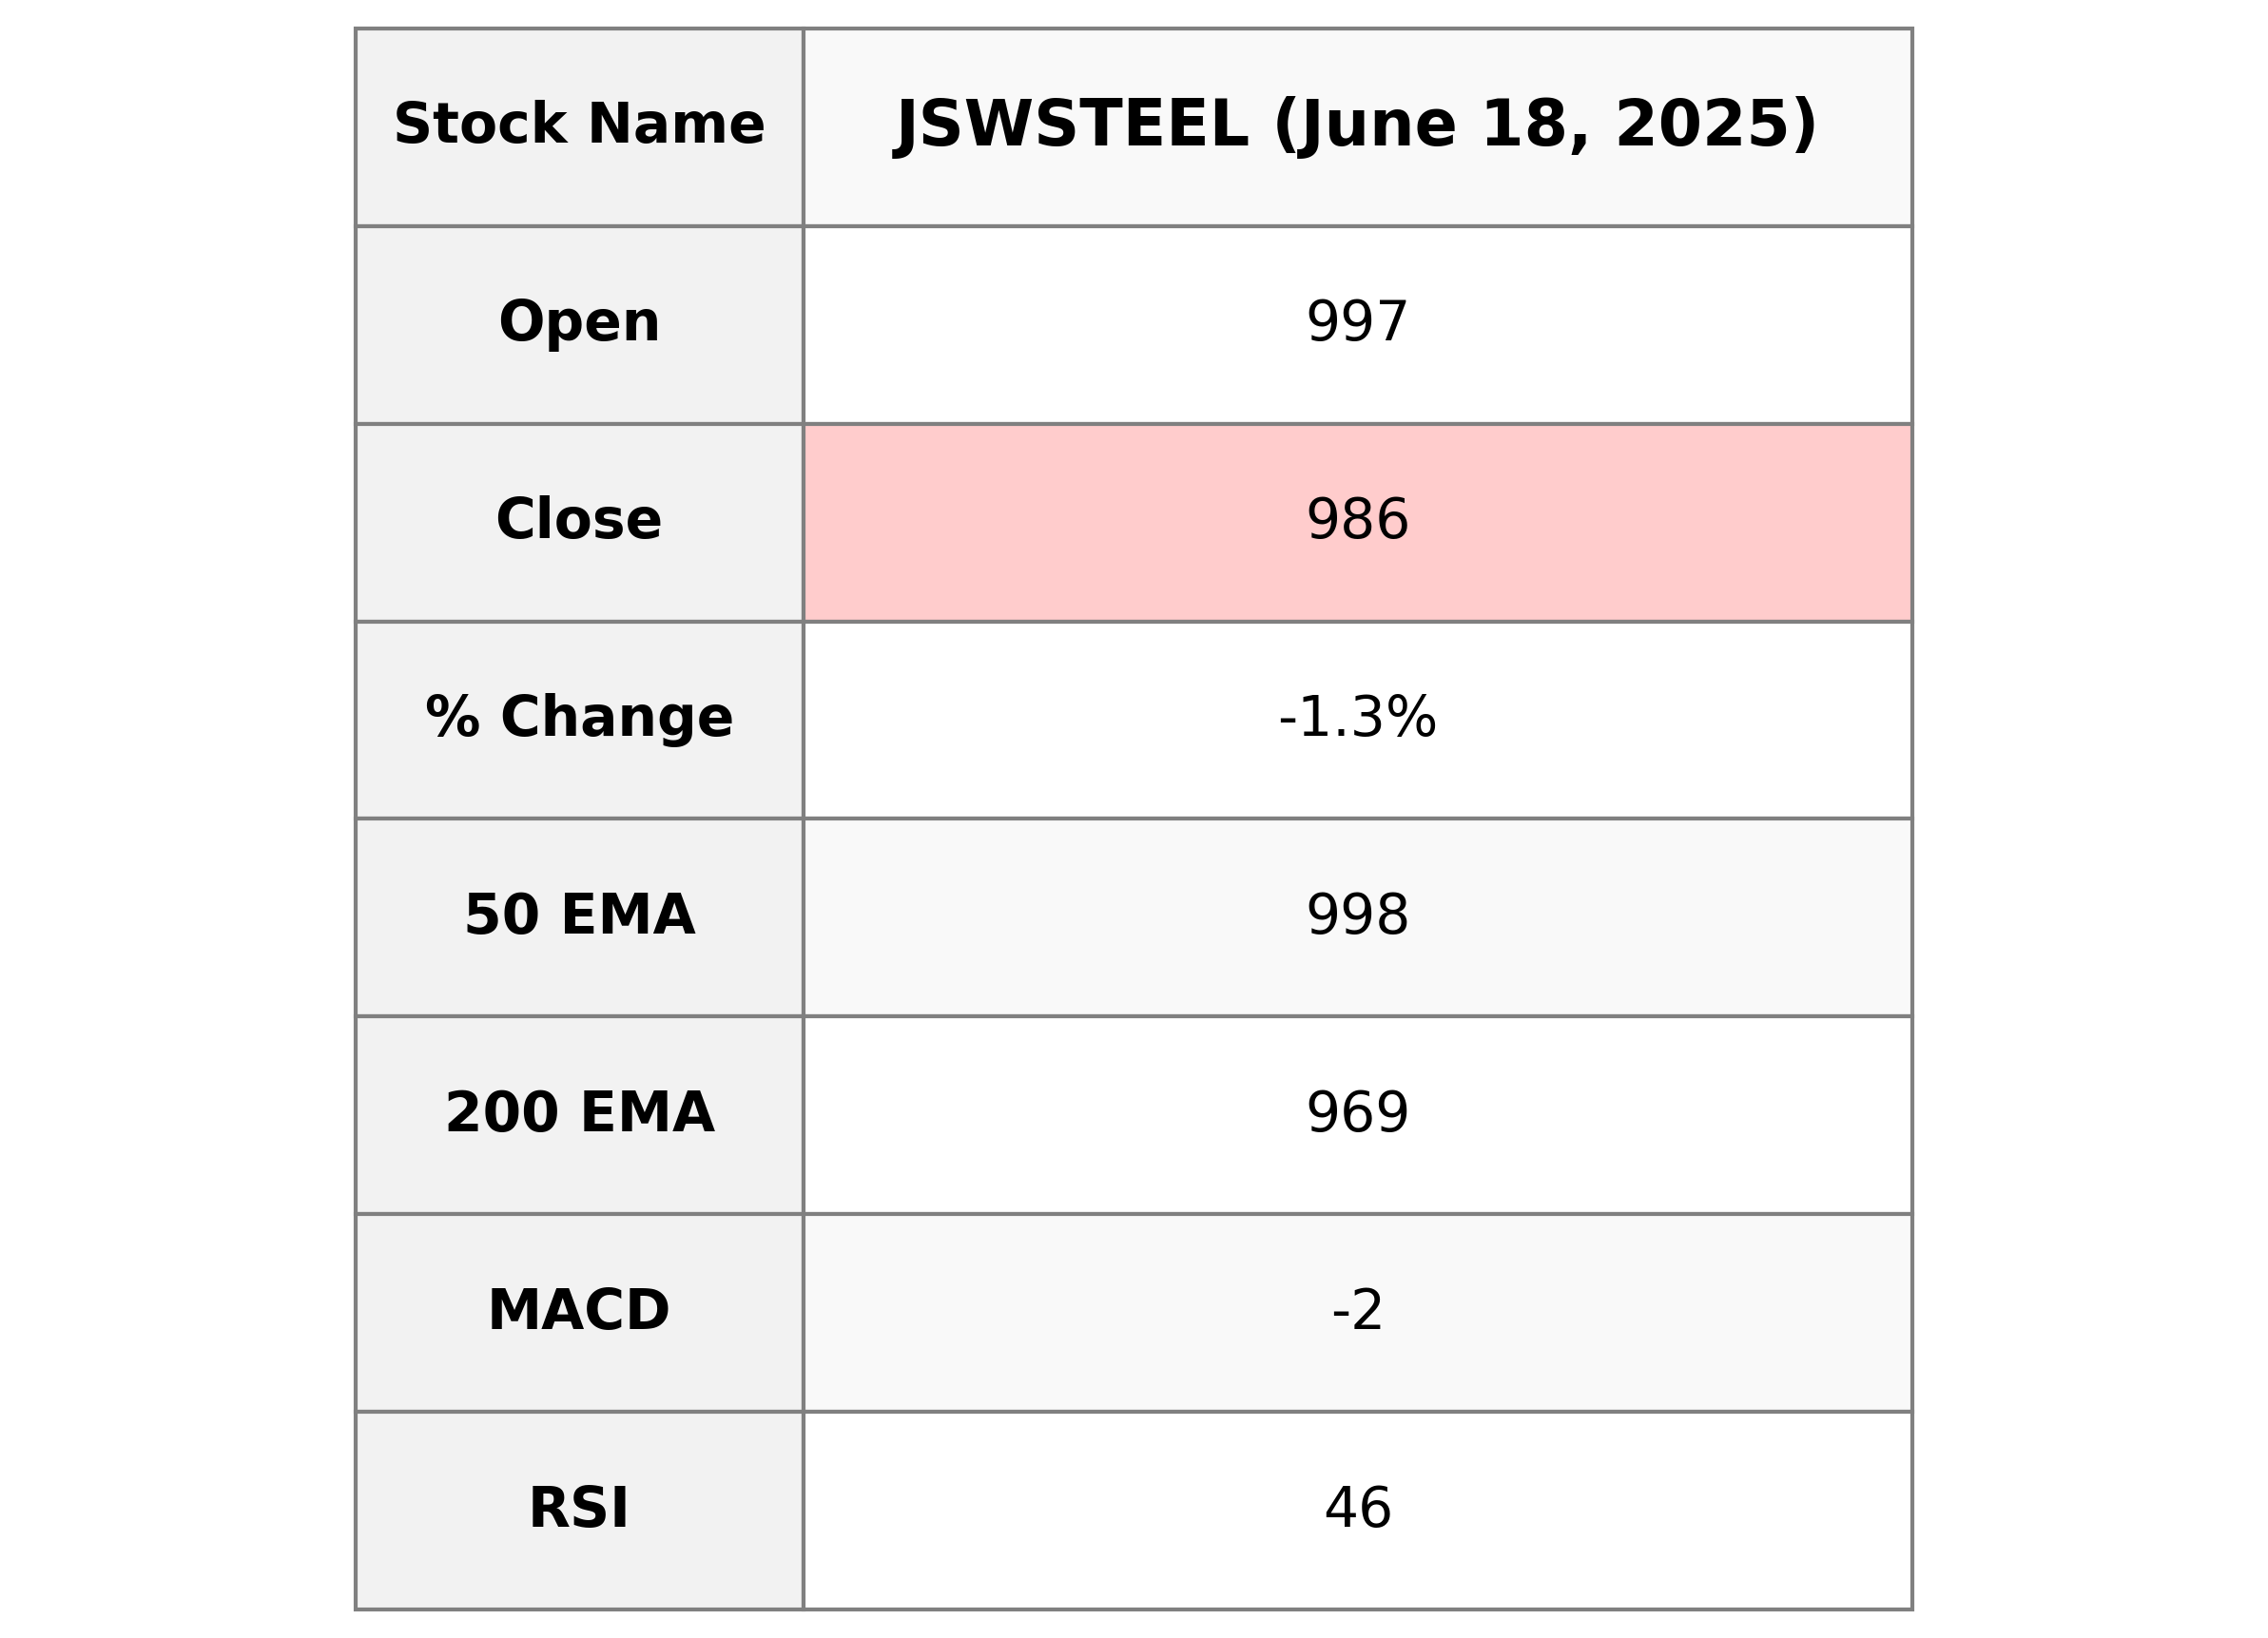
JSW Steel closed at 986.35, down by 1.33% from the previous close of 999.65, with a points change of -13.30. The stock's performance shows it is trading below its 50 EMA (998.40) and 10 EMA (995.35), indicating a potential short-term bearish trend. The RSI is at 46.19, suggesting a neutral momentum, while the MACD indicates a slight bearish signal with a value below the MACD Signal line. The company is a key player in the Basic Materials sector, specifically in the Steel industry, with a market cap of over 2.4 trillion INR.
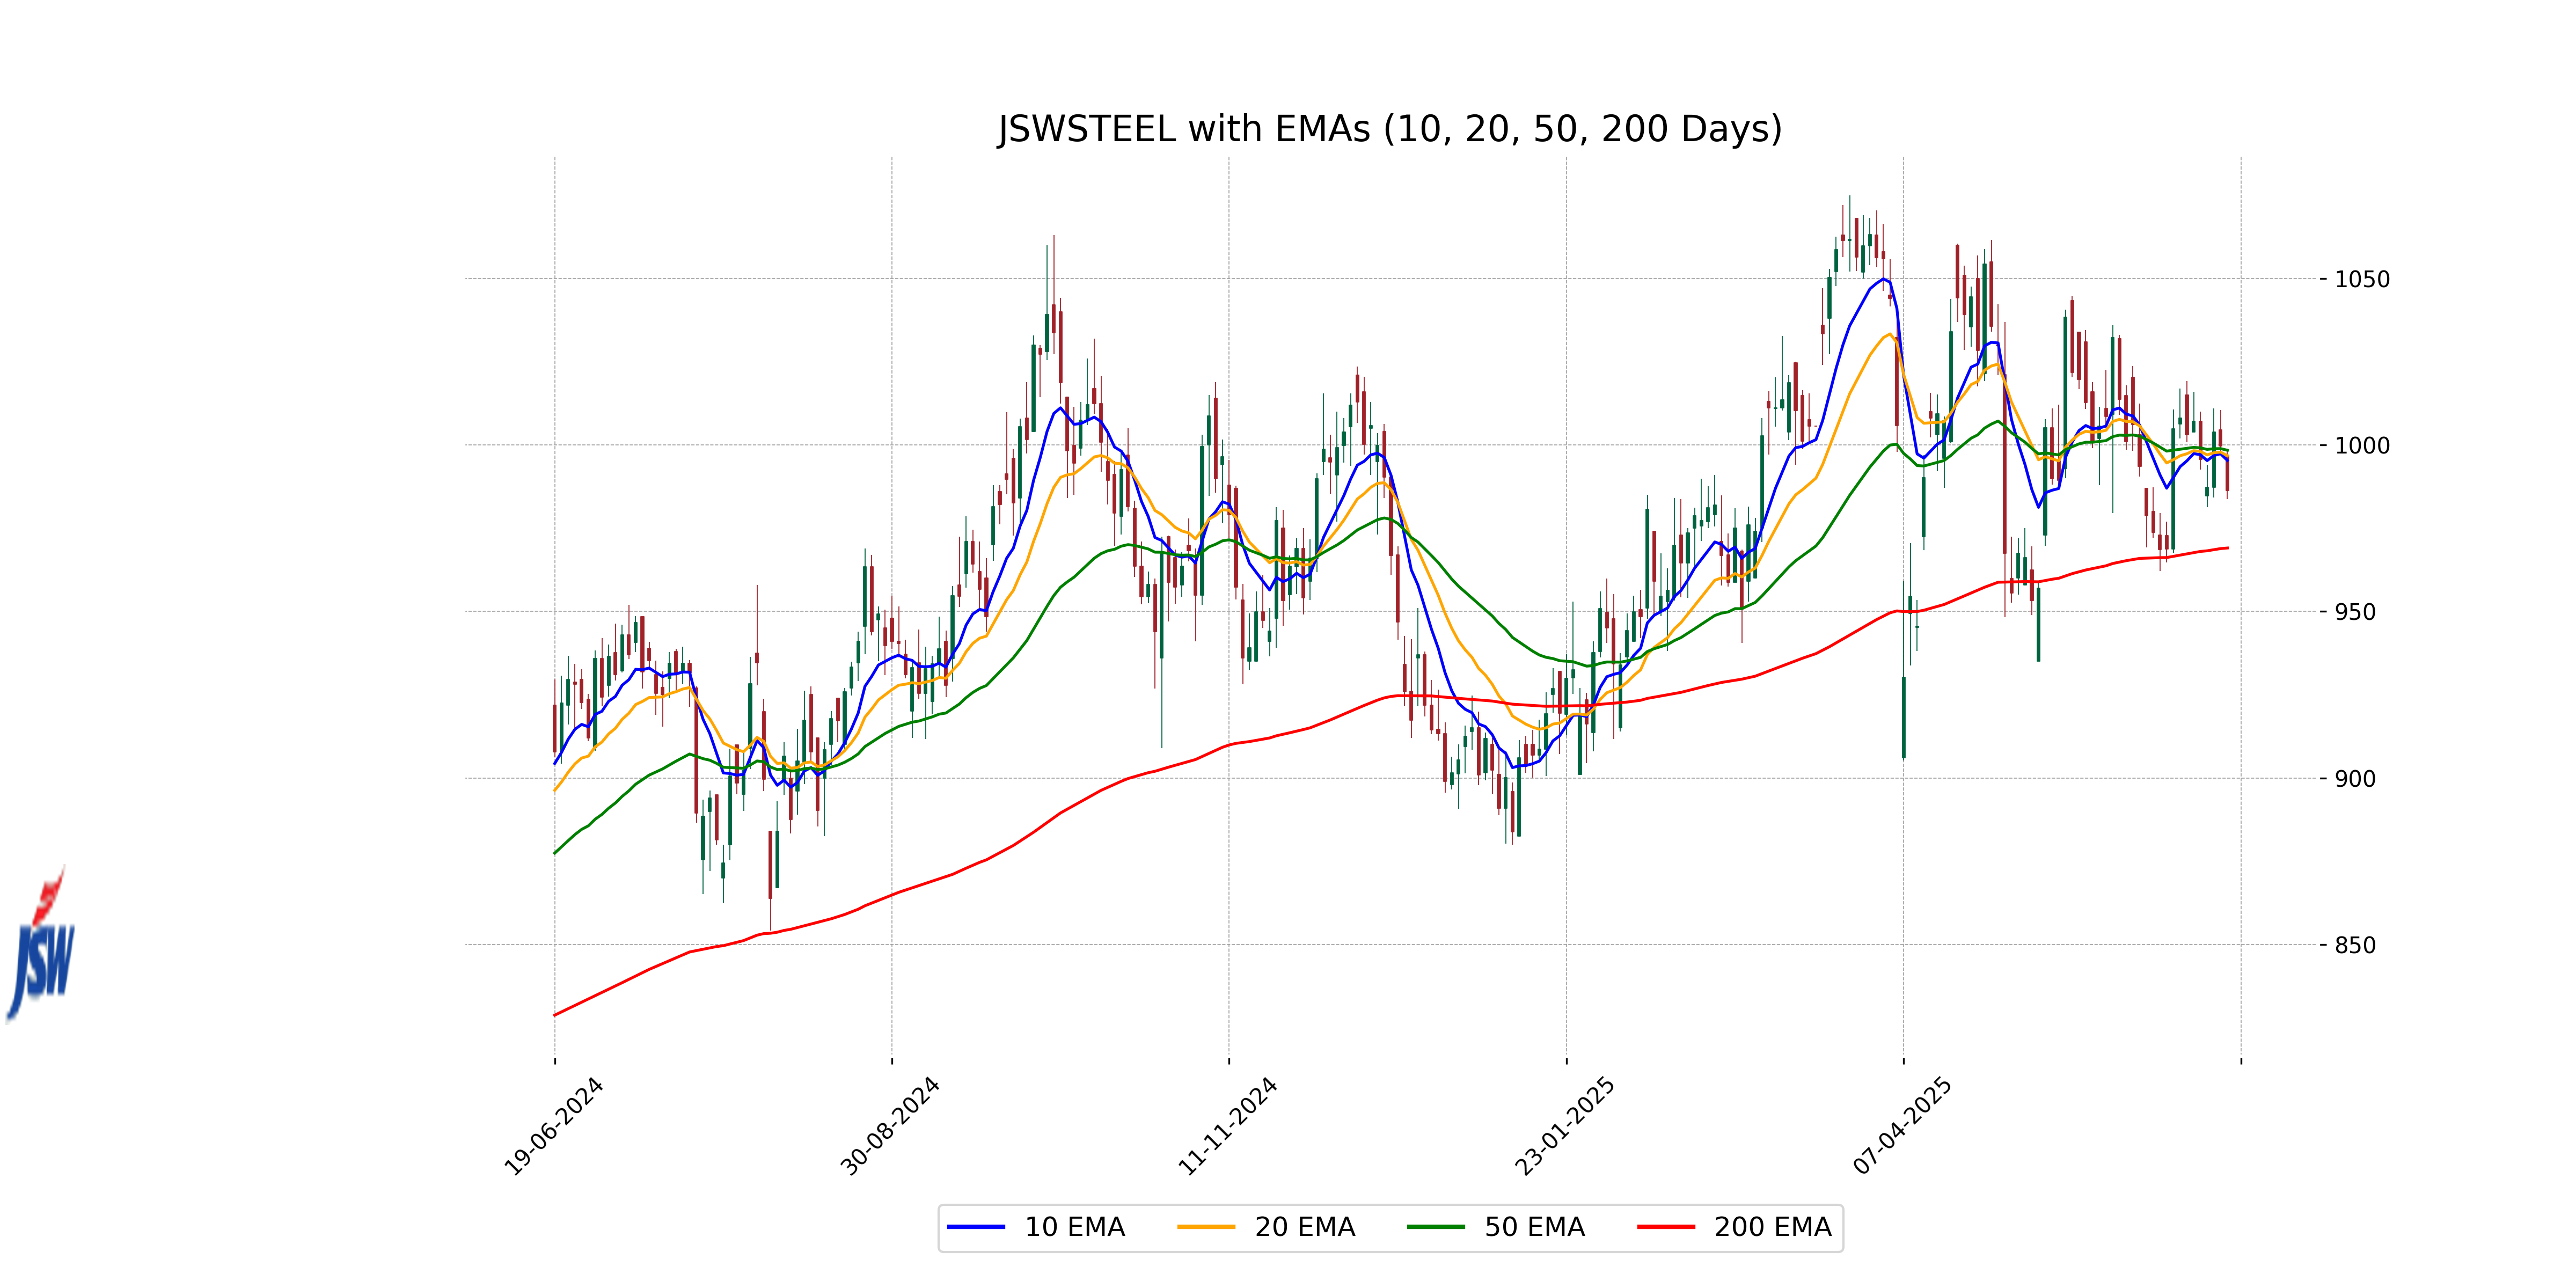
Relationship with Key Moving Averages
JSW Steel's current closing price of 986.35 is below its 50-day EMA of 998.40 and 10-day EMA of 995.35, indicating a potential short-term downtrend. However, it remains above the 200-day EMA of 969.05, suggesting a longer-term uptrend.
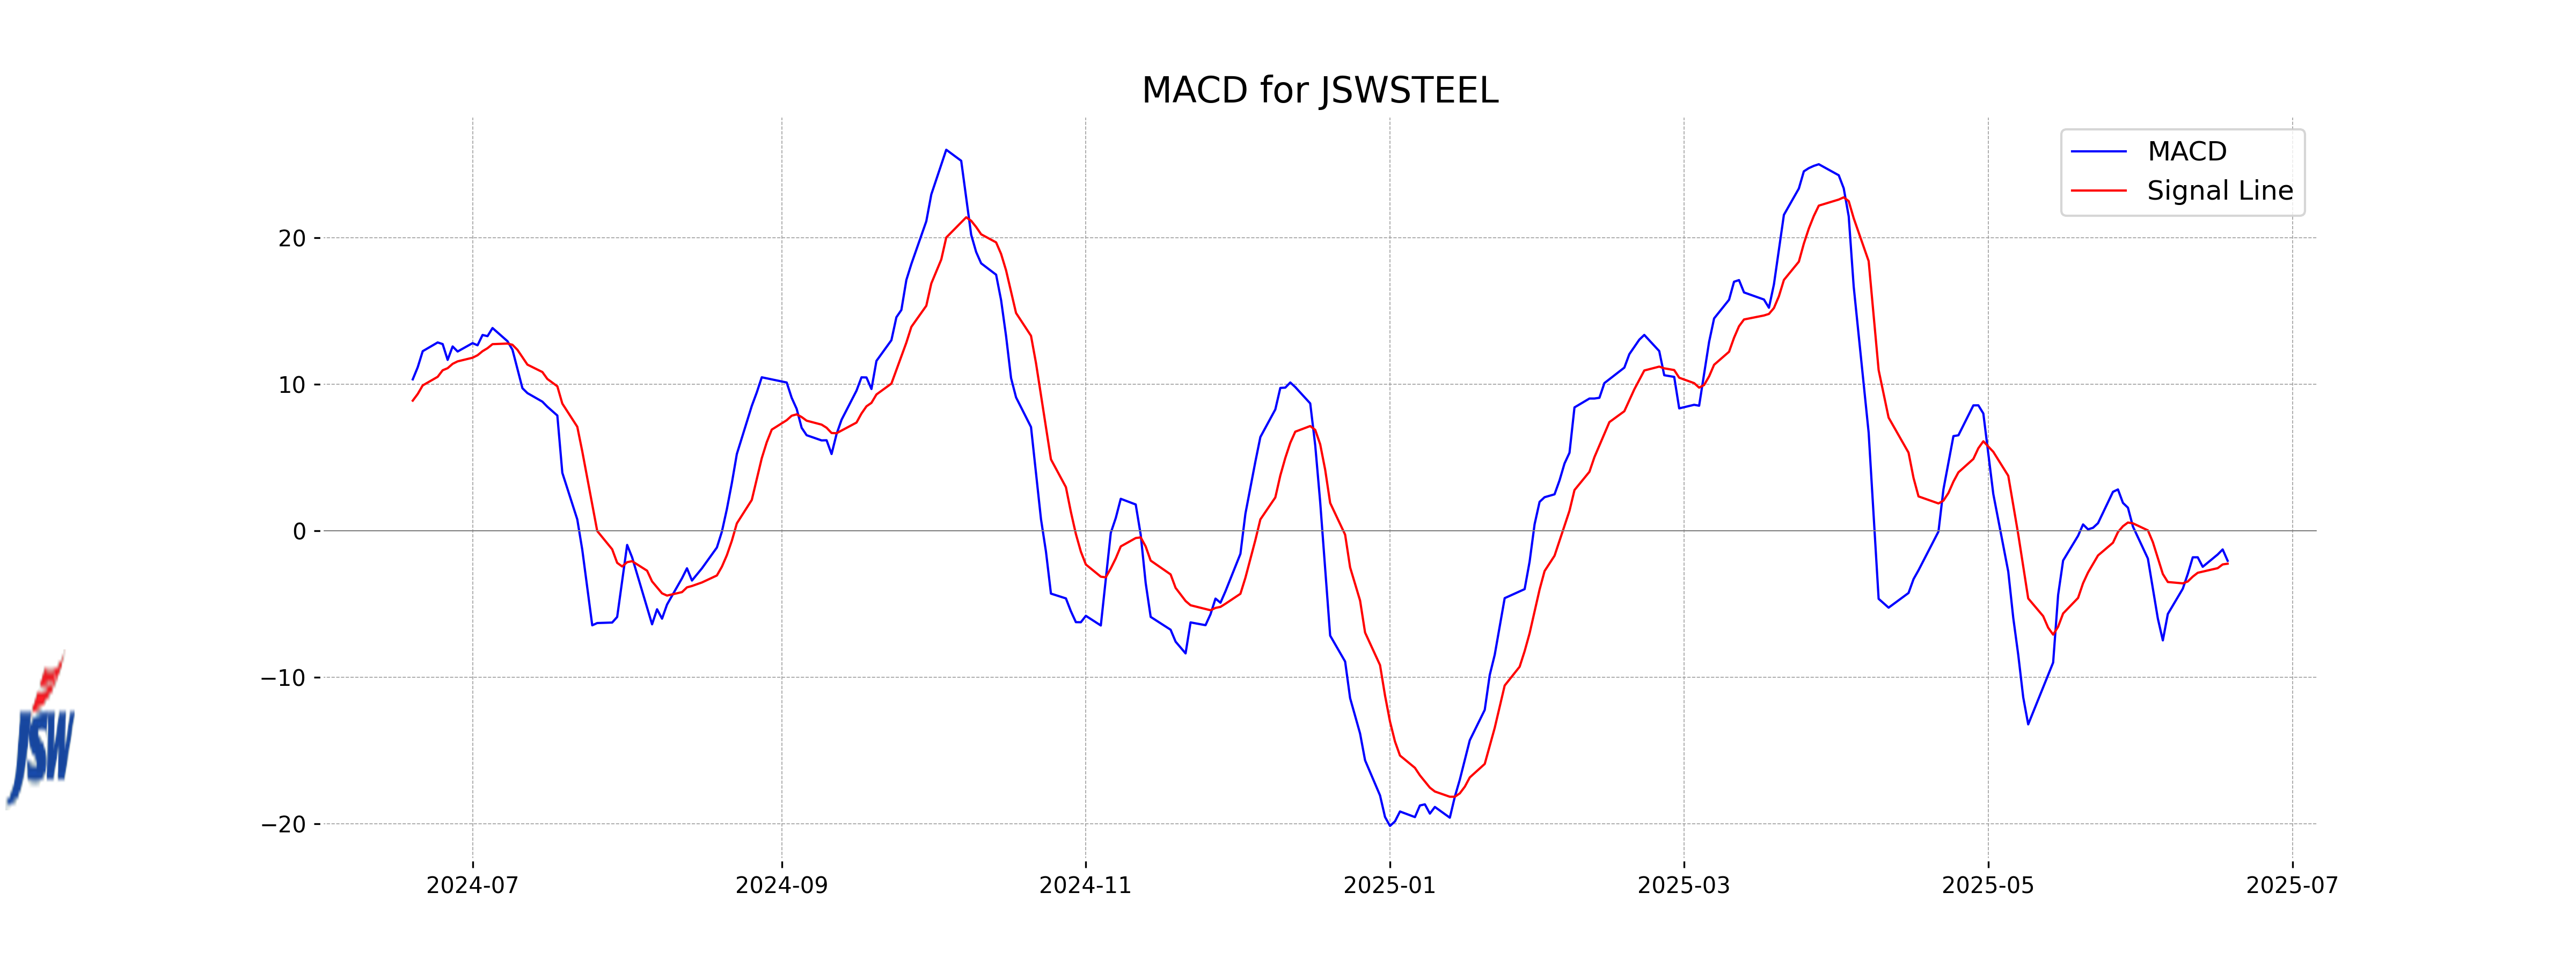
Moving Averages Trend (MACD)
JSW Steel's MACD is at -2.0589, which is below the MACD signal line of -2.2567, indicating a bearish trend. This could suggest potential downward momentum in the stock. Additionally, RSI is at 46.19, suggesting JSW Steel is approaching oversold conditions but isn't there yet.
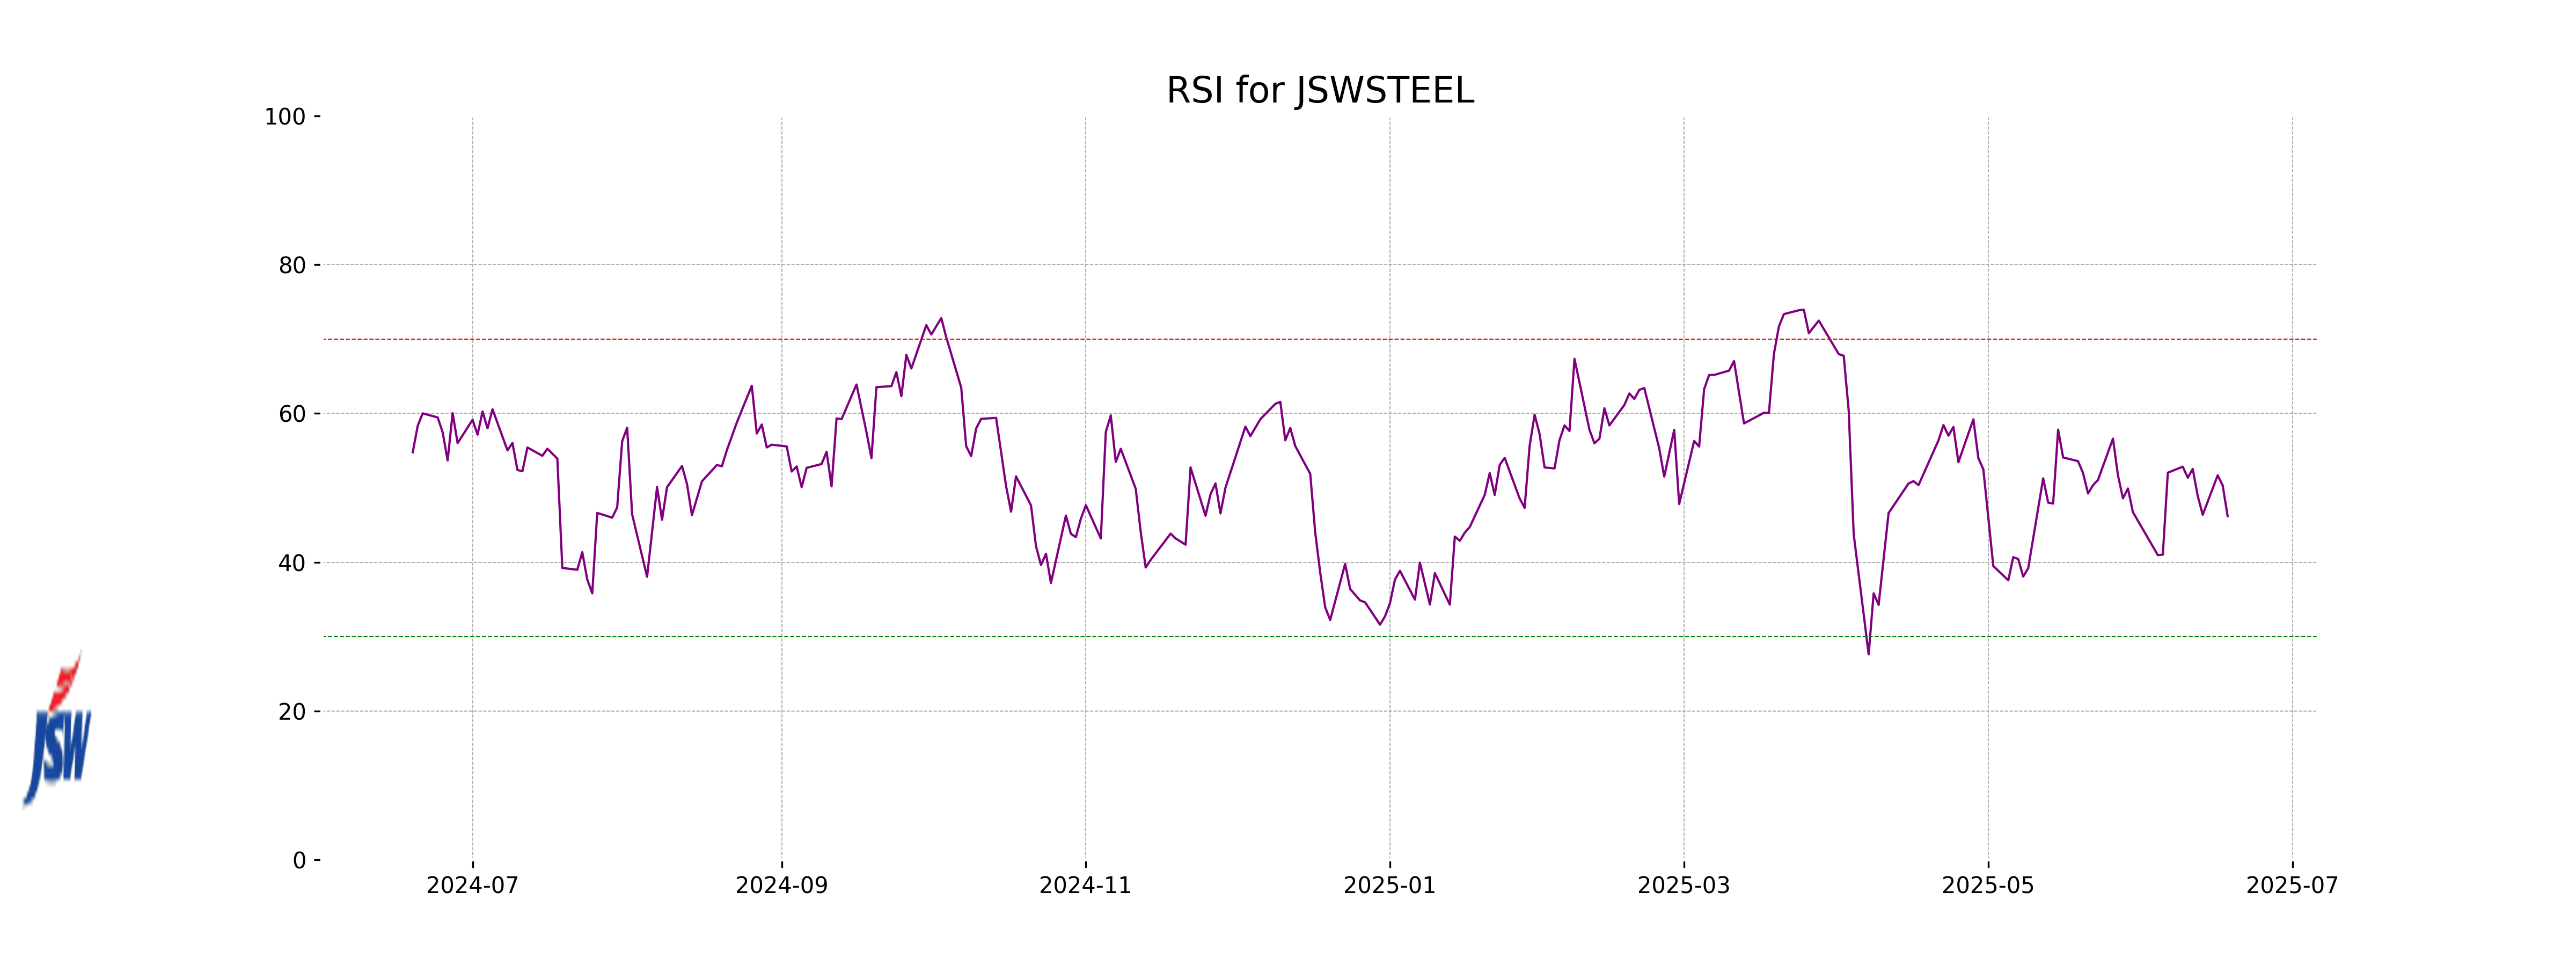
RSI Analysis
The RSI (Relative Strength Index) value for JSW Steel is 46.19. This indicates that the stock is in a neutral zone as it's neither in oversold (below 30) nor overbought (above 70) territory. This suggests that there may not be any significant momentum or extreme price conditions affecting the stock at the moment.
Analysis for TCS - June 18, 2025
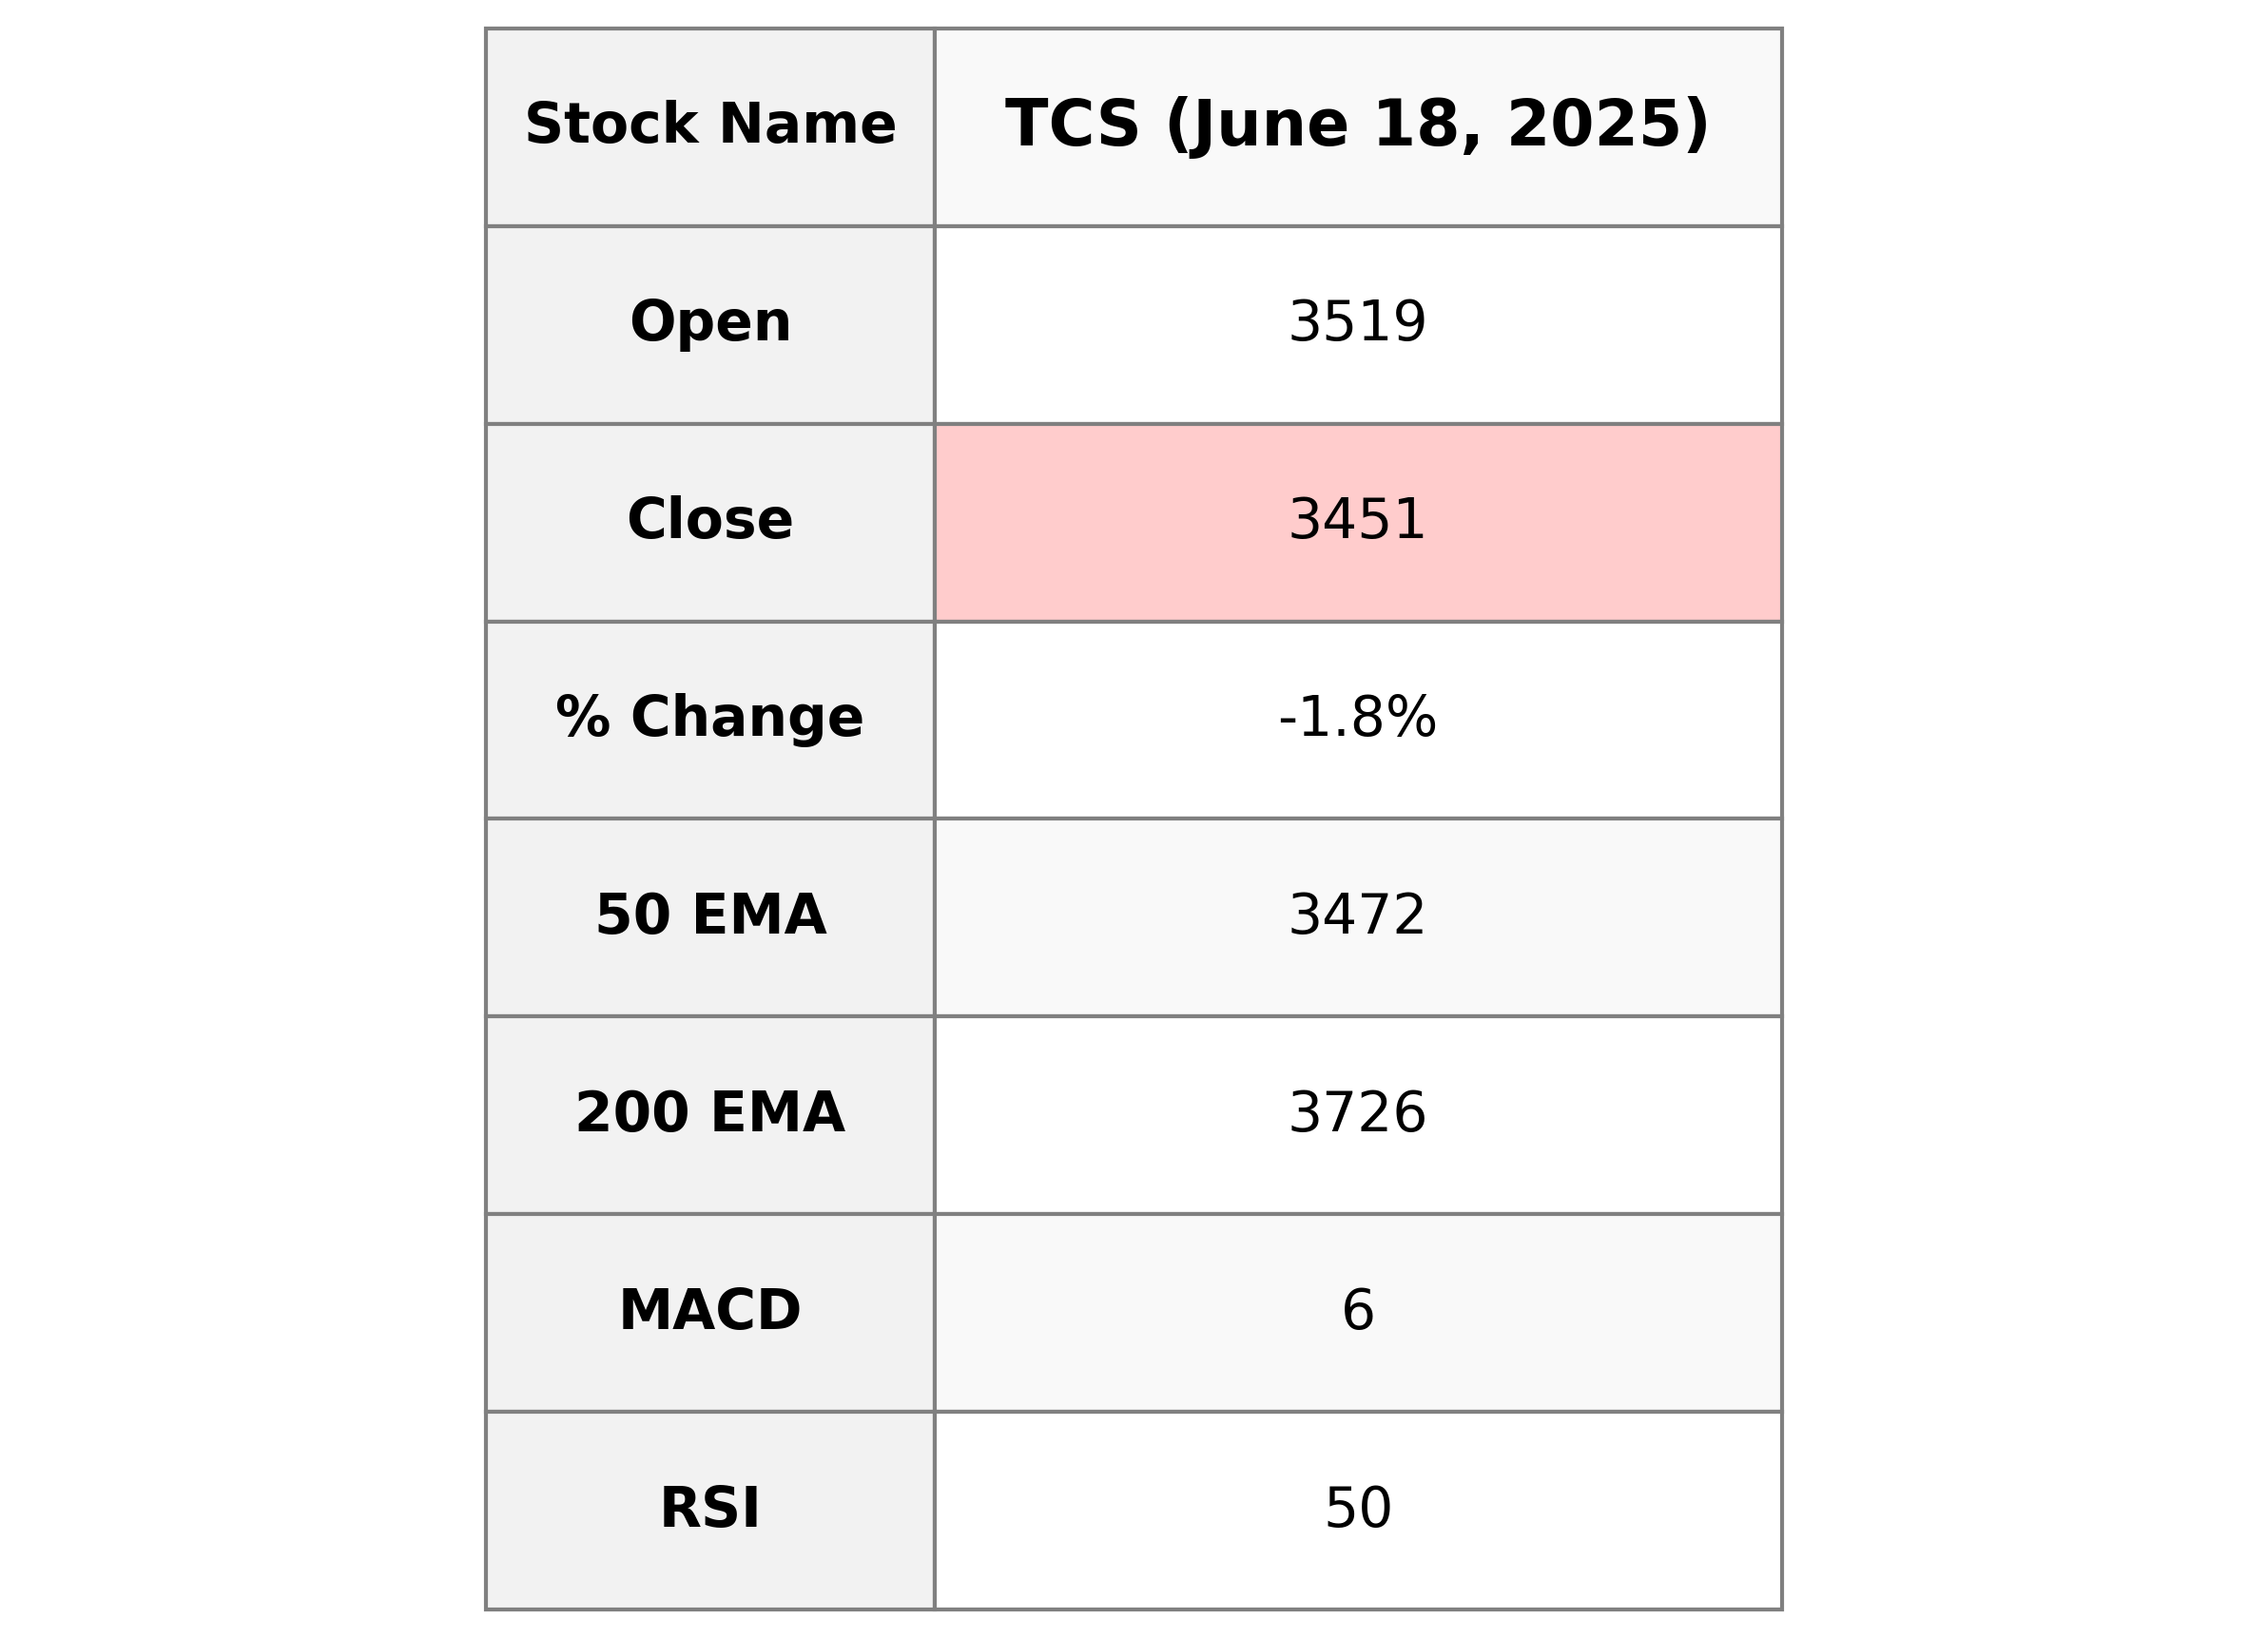
Tata Consultancy Services (TCS) has experienced a decline in its stock price, closing at 3451.40 with a percentage change of -1.82% from the previous close. The trading volume was 2,696,187, and the company operates within the Technology sector in India. With a market capitalization of $12,487,475,855, the stock has a PE ratio of 25.70 and an EPS of 134.28, indicating its performance in the Information Technology Services industry.
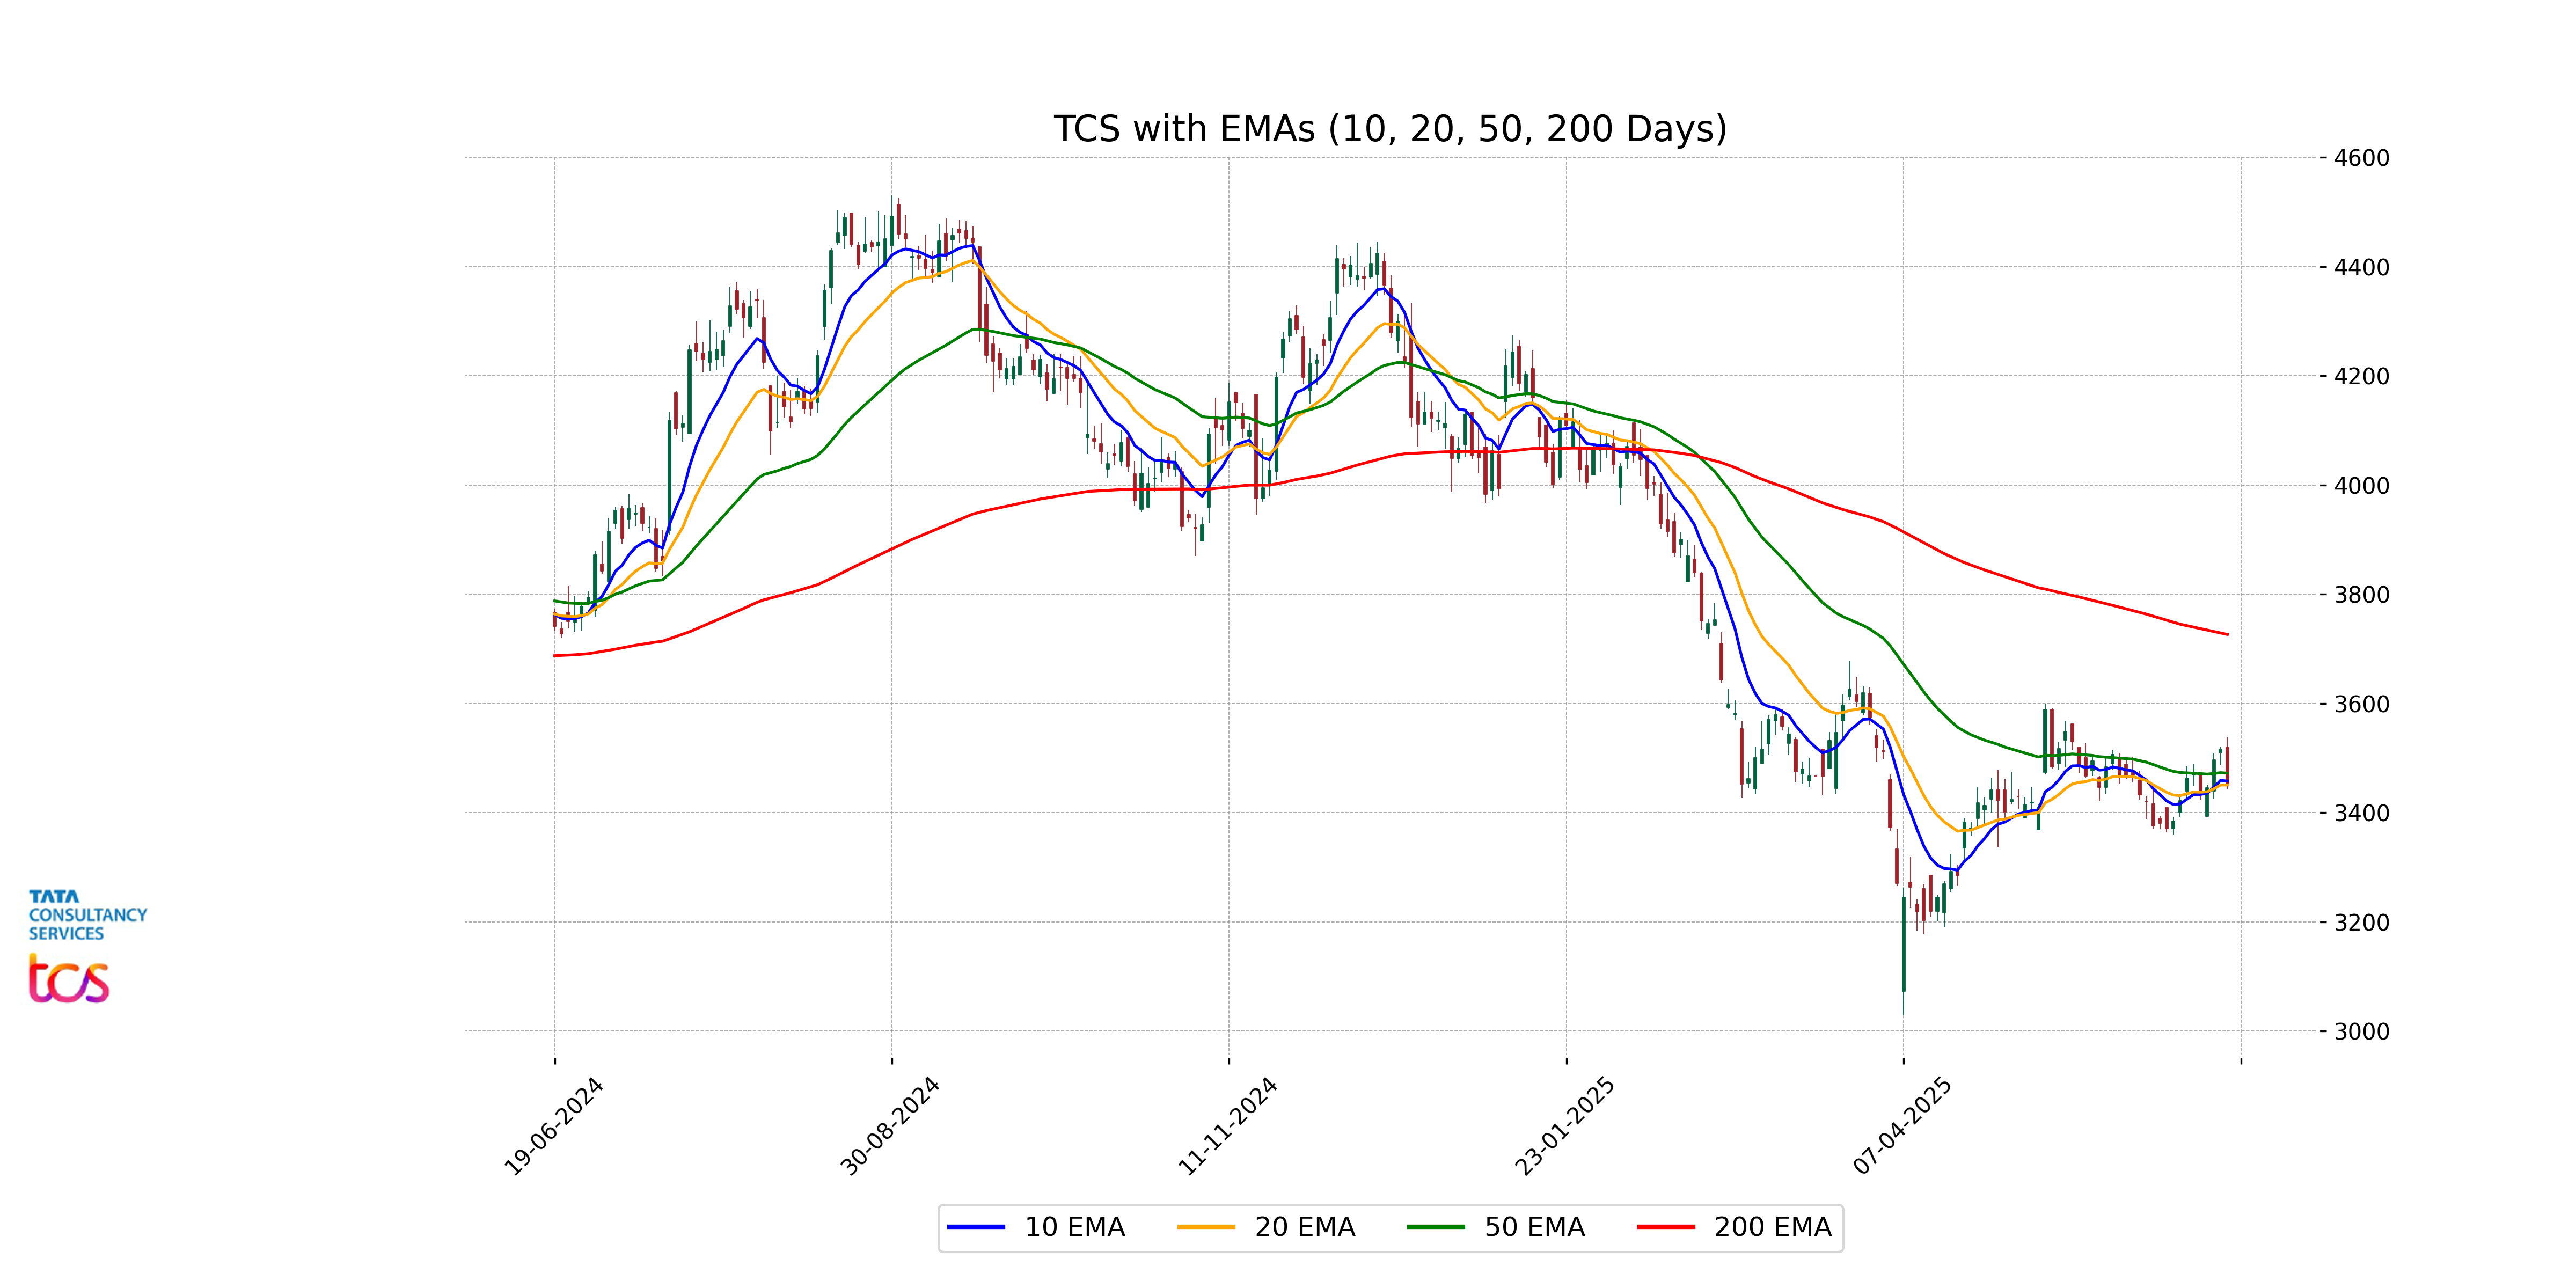
Relationship with Key Moving Averages
TCS's closing price of 3451.40 is slightly below its 50 EMA of 3472.32 and closely aligns with its 20 EMA of 3450.66, indicating a convergence with short-term trends. However, the price remains well below the 200 EMA of 3726.27, suggesting a longer-term bearish trend.
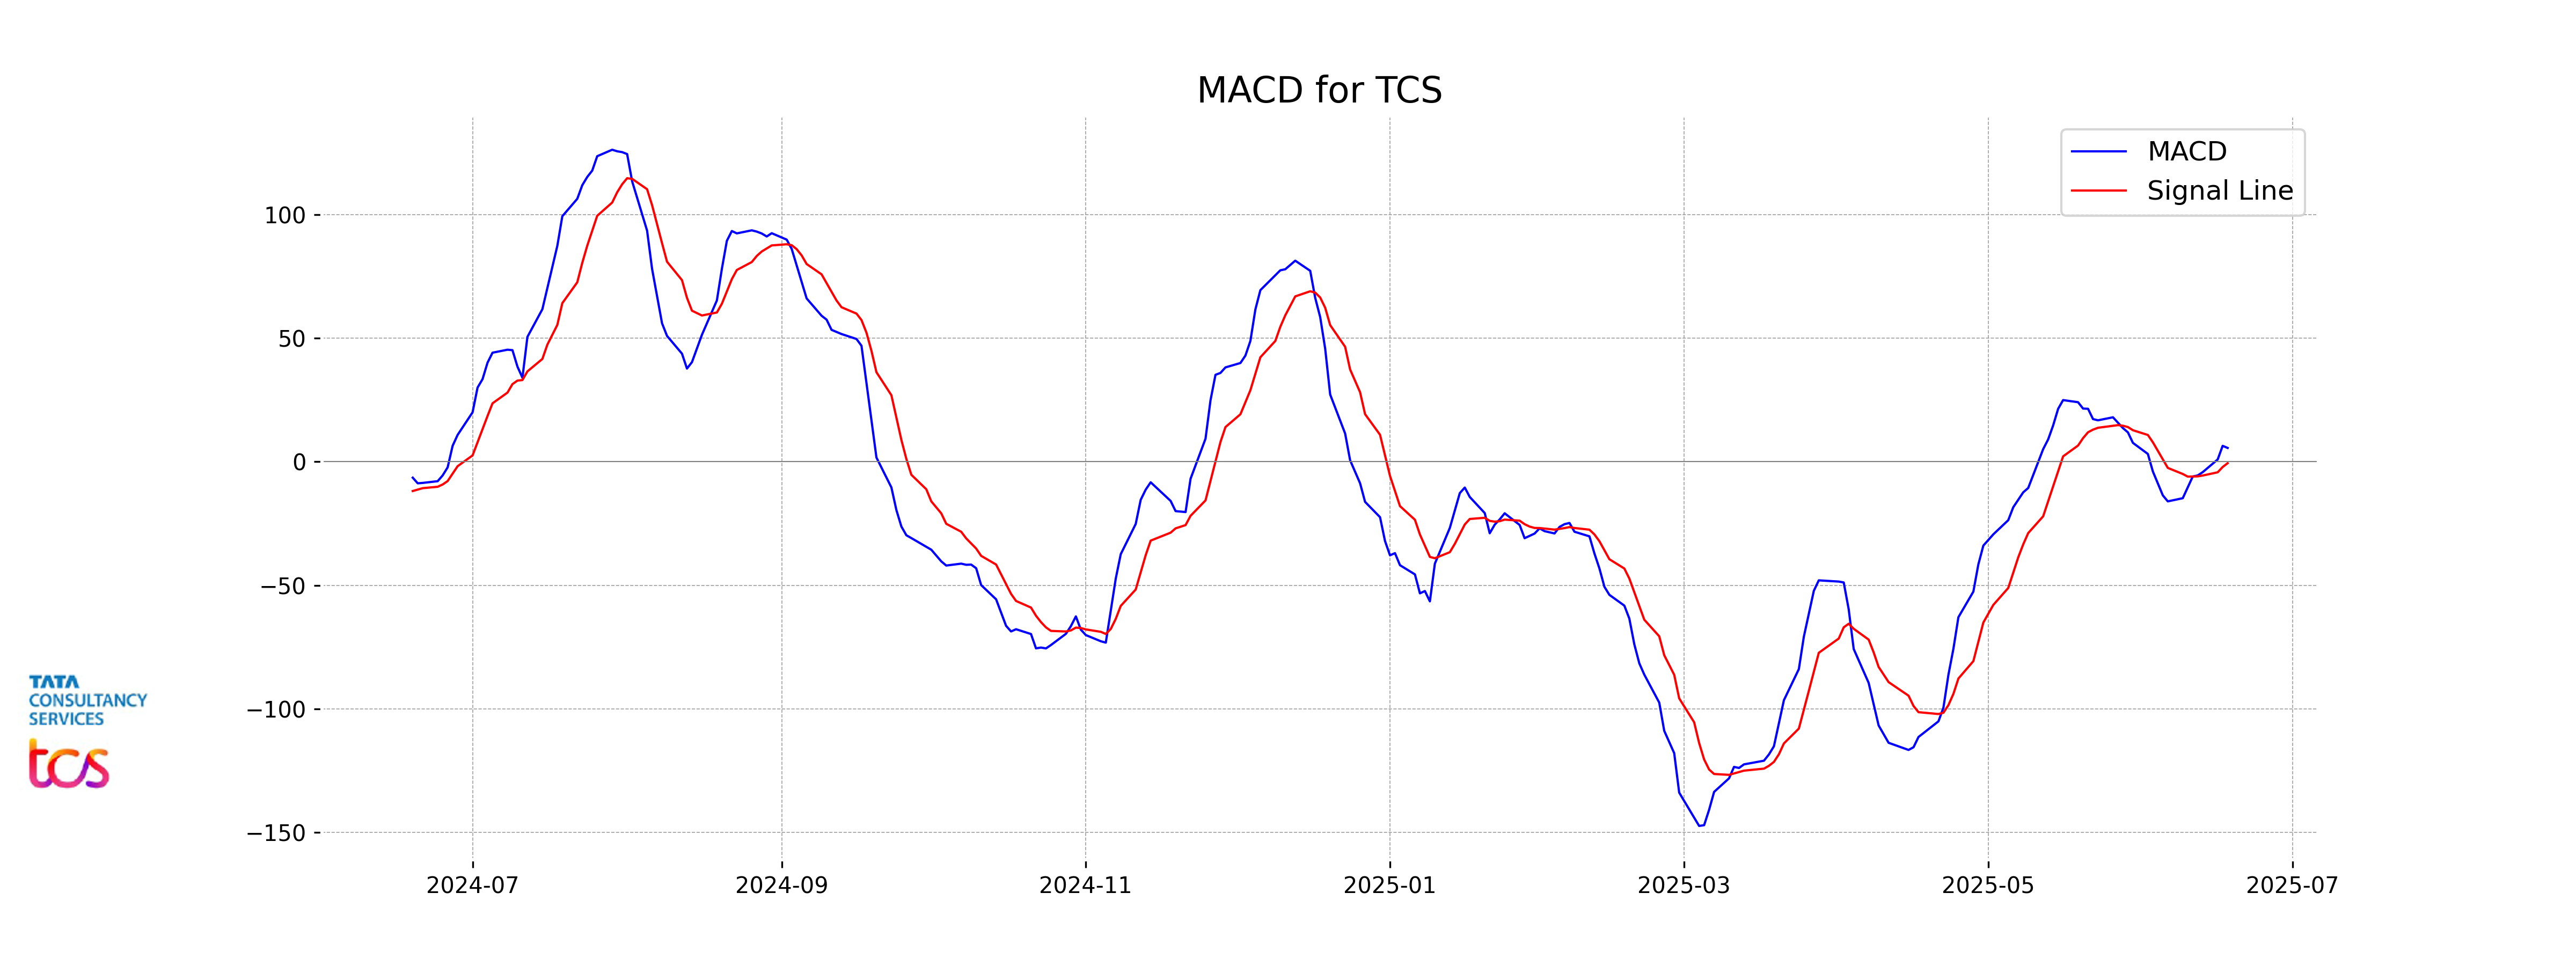
Moving Averages Trend (MACD)
TCS exhibits a positive MACD value of 5.61, indicating a potential upward momentum in its stock price. The MACD line is above the signal line (-0.57), suggesting a bullish trend. However, investors should also consider other factors such as market conditions before making any decisions.
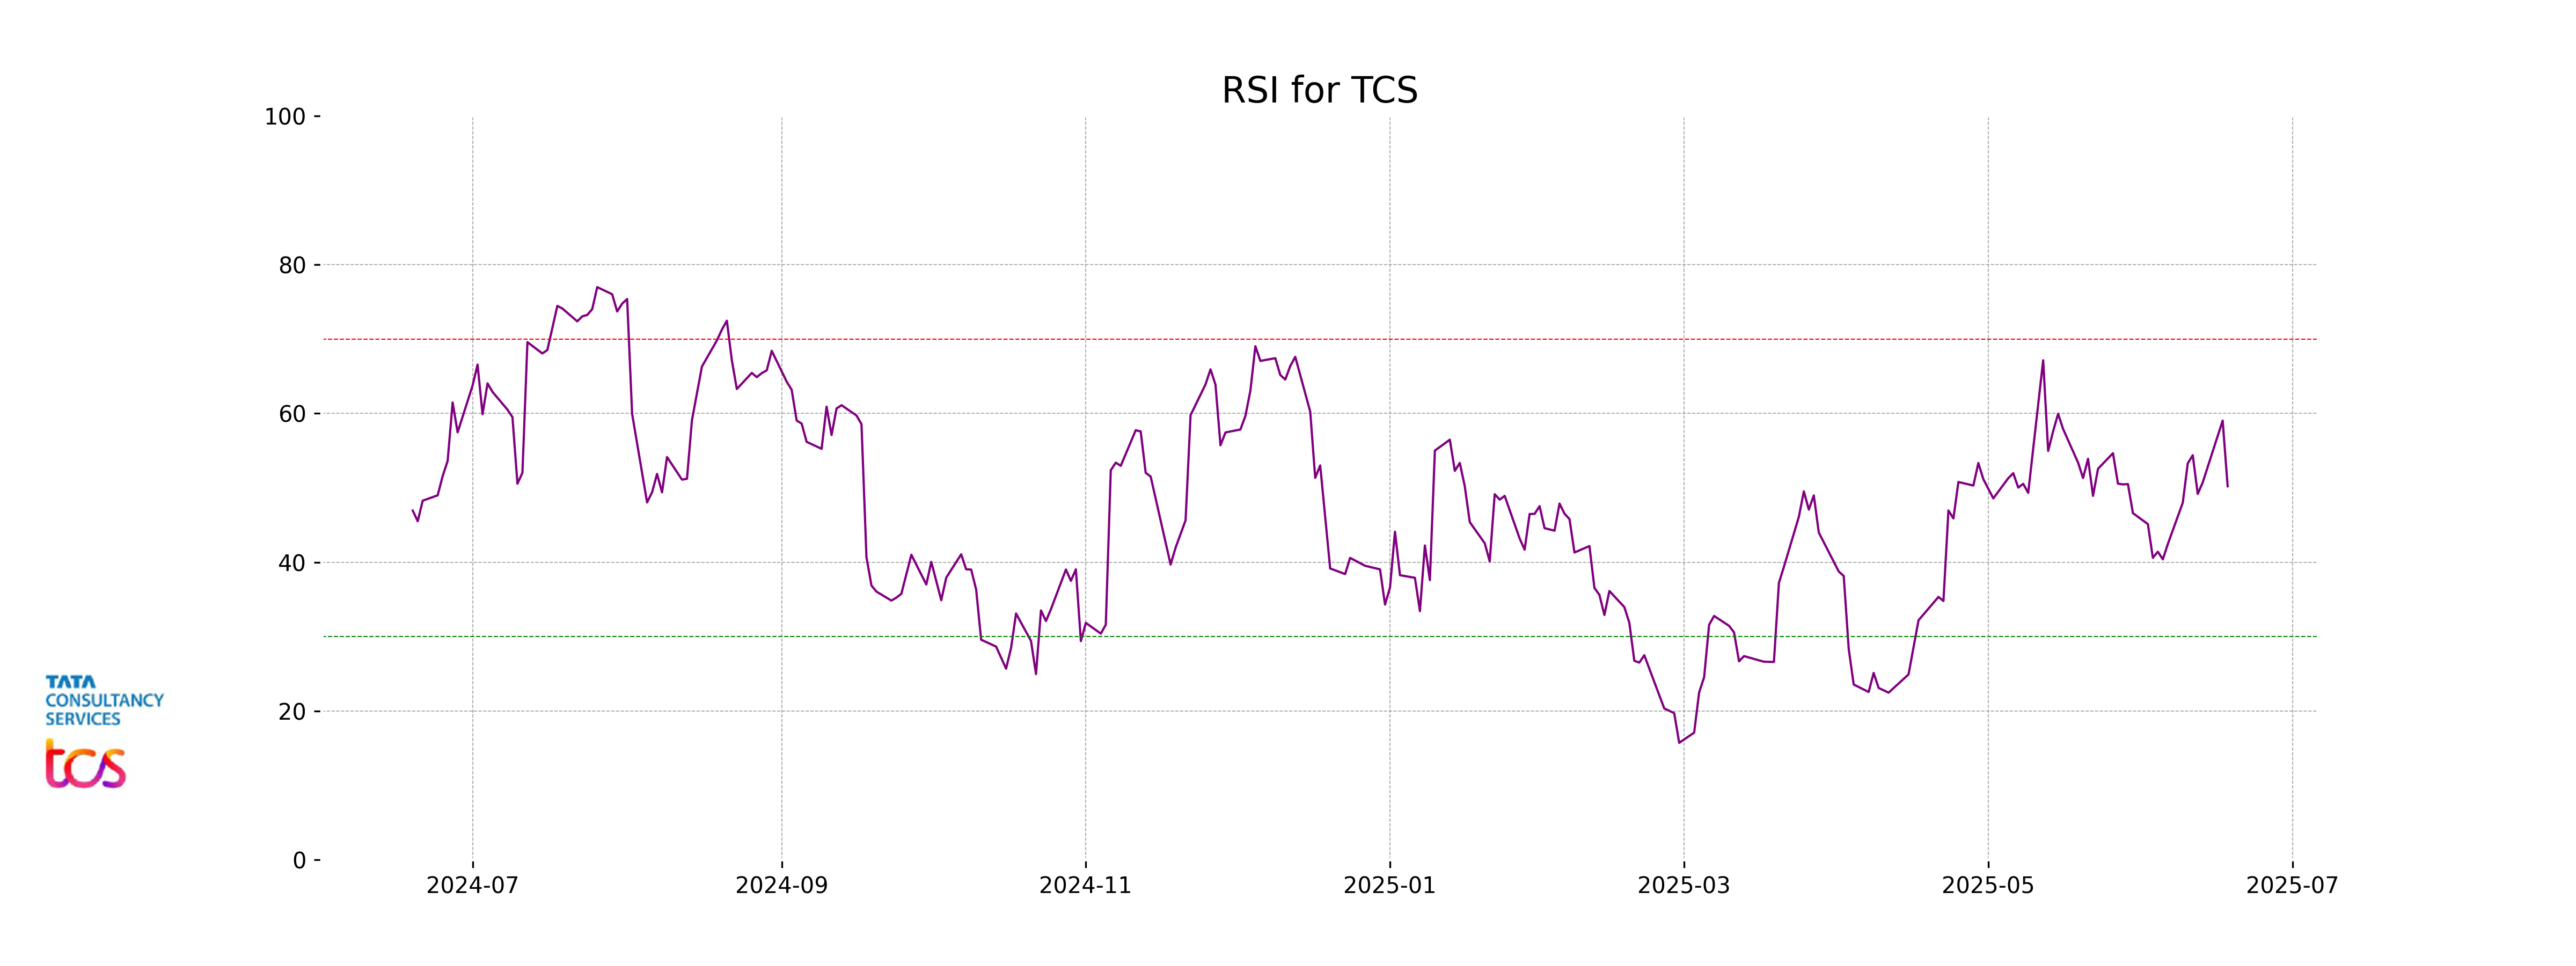
RSI Analysis
The Relative Strength Index (RSI) for TCS is 50.21, which indicates a neutral position. Typically, an RSI value between 30 and 70 reflects a balanced state where the stock is neither overbought nor oversold, suggesting a period of consolidation or stabilization.
Up Next
NSE Nifty 50: Top 5 stock losers of June 18, 2025

Step-by-step guide to apply for a mortgage loan online with minimal documentation

Honda Activa 6G: Everything You Need to Know Before Buying

How much does a ULIP plan really cost? A break-down of all charges

Centre plans to borrow Rs 8.20 lakh cr from market in first half of FY27

Reliance denies buying Iranian oil amid US sanctions waiver

More videos

Premium petrol price up Rs 2, industrial diesel up Rs 22; no change in normal petrol, diesel rates

India's GDP expected to register over 8 pc growth in Sep-Dec: Report

Govt announces seven measures to help boost exports

RBI keeps interest rates on hold after US trade deal boosts outlook

RBI proposes to compensate customers up to Rs 25,000 loss due to fraud

RBI raises GDP growth projection of Q1, Q2 of FY27

RBI pauses rate cuts, retains interest rate at 5.25 pc

Rupee jumps 122 paise to close at 90.27 against US dollar on India-US trade deal

Stock markets cheer India-US trade deal: Sensex, Nifty surge 2.5 pc

UPI transactions hit record high of Rs 230 lakh crore in 2025-26 till Dec: Govt