


Highlights
- Axis Bank nears oversold zone with bearish signals
- Bajaj Finserv, Bajaj Finance show downward pressure
- Tata Consumer, IndusInd Bank trade near neutral zone
Latest news

Samsung Galaxy Z Fold 8, Fold 8 Ultra & Z Flip 8: A More Mature Foldable Family

Dell Launches New Alienware 16X Aurora, 16 Area-51 and 18 Area-51 Gaming Laptops in India

Samsung Takes on Premium Home Audio With New Music Studio Series

The End of OxygenOS: OnePlus Confirms Shift to Oppo's ColorOS

Fujifilm Instax Mini Evo Cinema Review: A Hybrid Camera That Prints Memories Differently

iQOO Teases Z11 Lite With AI Tools, Military-Grade Durability and a 6500mAh Battery

Editorji Launches Hook Global, Its International Digital News Brand

Samsung's Bespoke AI ACs Focus on Humidity, Hygiene and Smarter Cooling
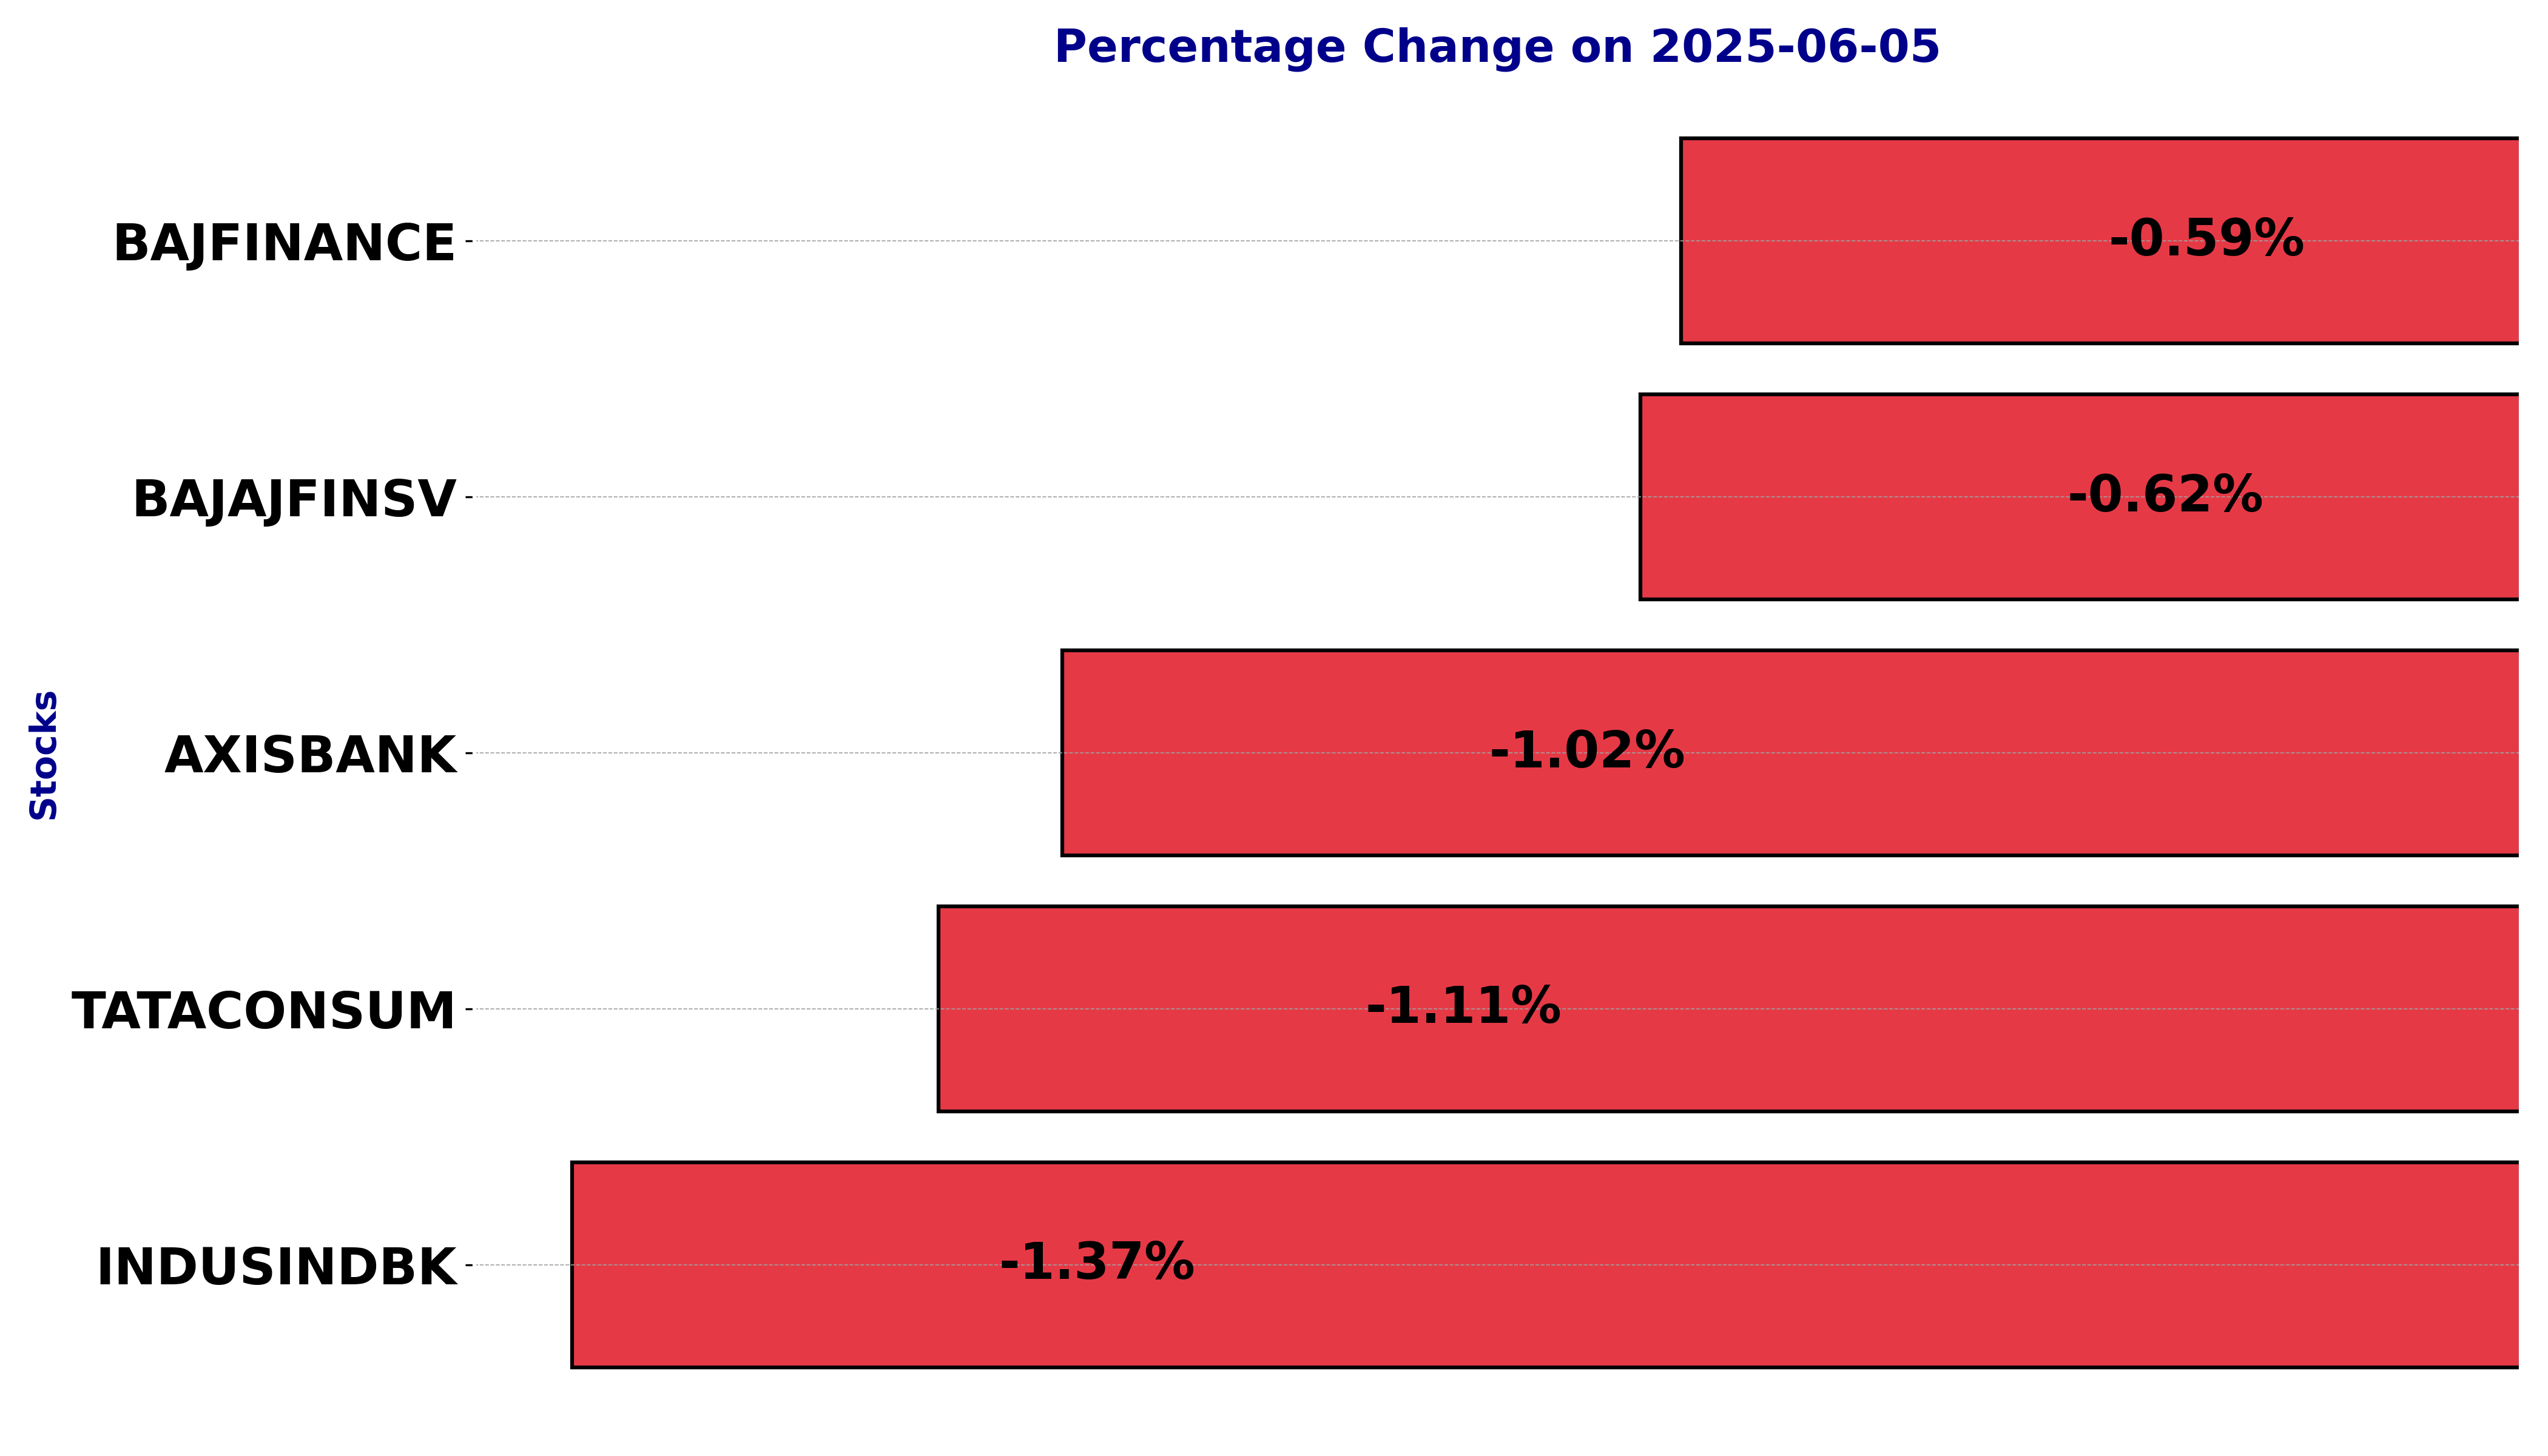
NSE Nifty 50: Top 5 stock losers of June 05, 2025


In this article, we will explore the technical indicators of some of the low-performing stocks on the Indian stock market, including AXISBANK, BAJAJFINSV, BAJFINANCE, INDUSINDBK, and TATACONSUM.
By looking at these stocks through the lens of key technical factors, we aim to better understand their price movements, trends, and potential future performance.
Analysis for Axis Bank - June 05, 2025
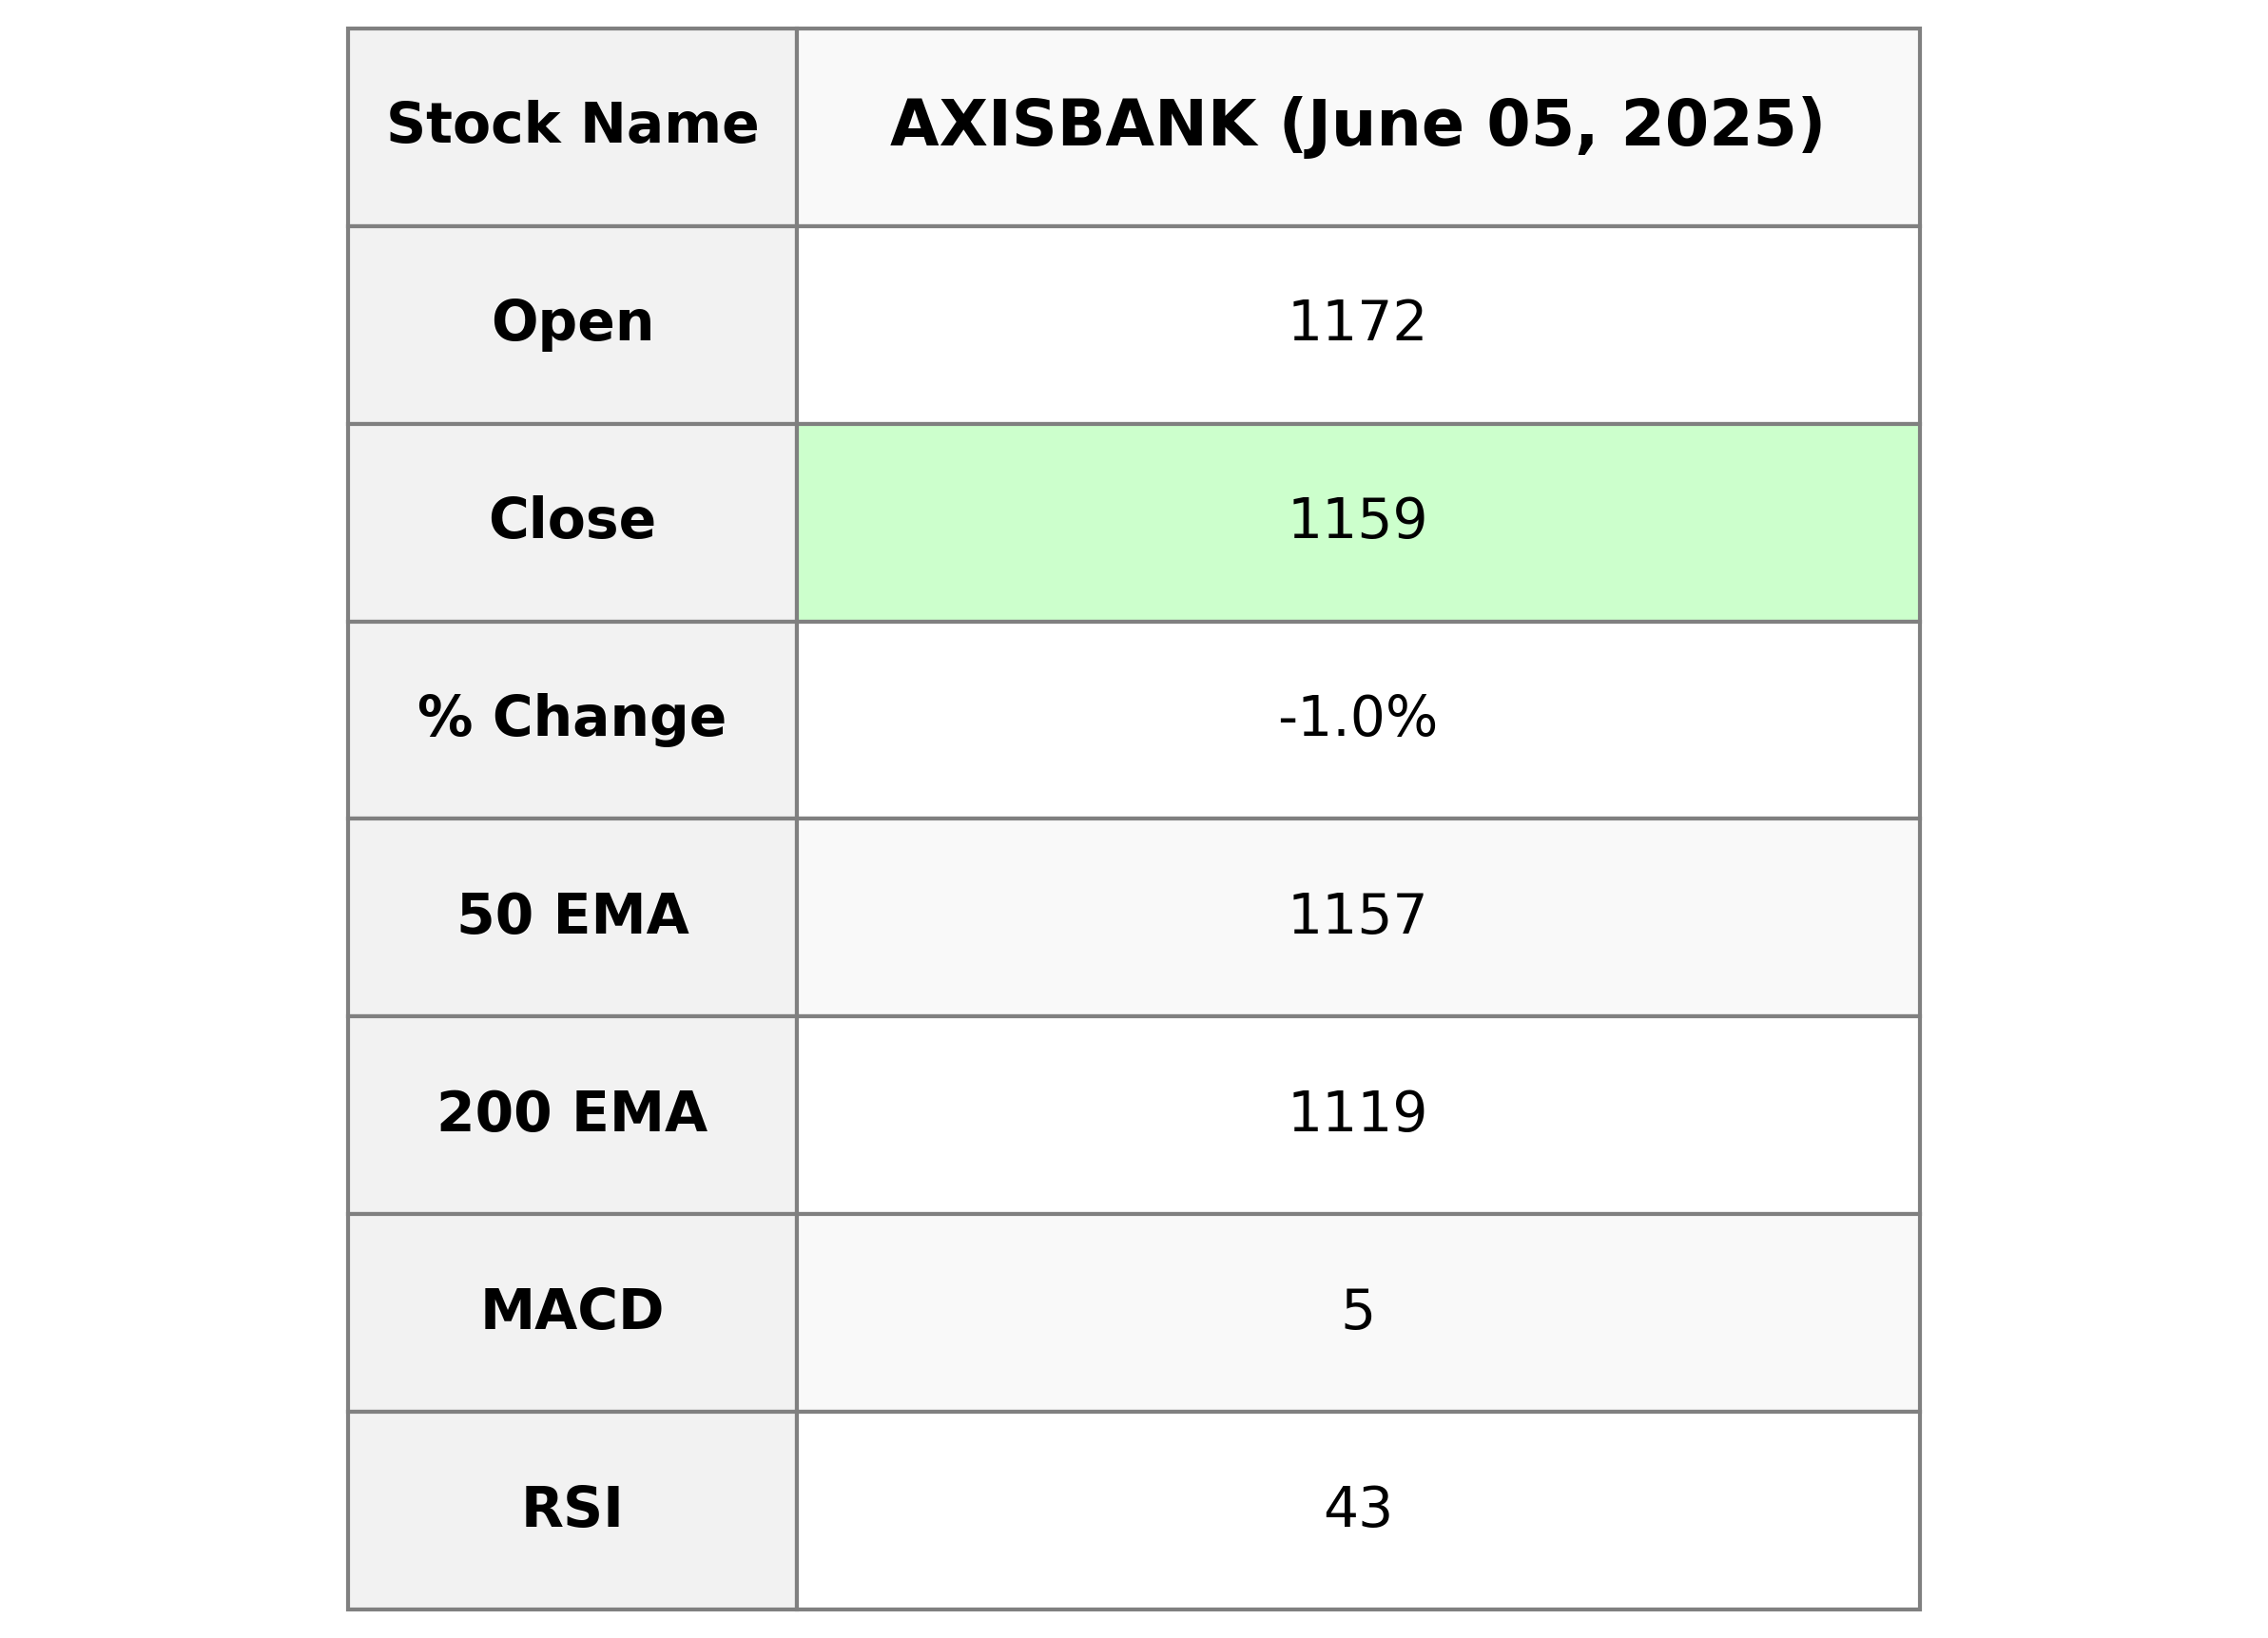
Stock Name: Axis Bank Performance Description: On the given trading day, Axis Bank opened at 1172.5 and closed lower at 1159.0, marking a decrease of about 1.02% from its previous close of 1171. The trading volume was significant at 10,478,890 shares. The stock is currently trading close to its 50-day EMA of 1156.69 but below its 10-day and 20-day EMAs, indicating potential short-term bearish momentum. The RSI is 42.64, suggesting the stock is nearing oversold conditions. In terms of valuation, the market cap stands at approximately 3.59 trillion INR with a PE ratio of 12.85.
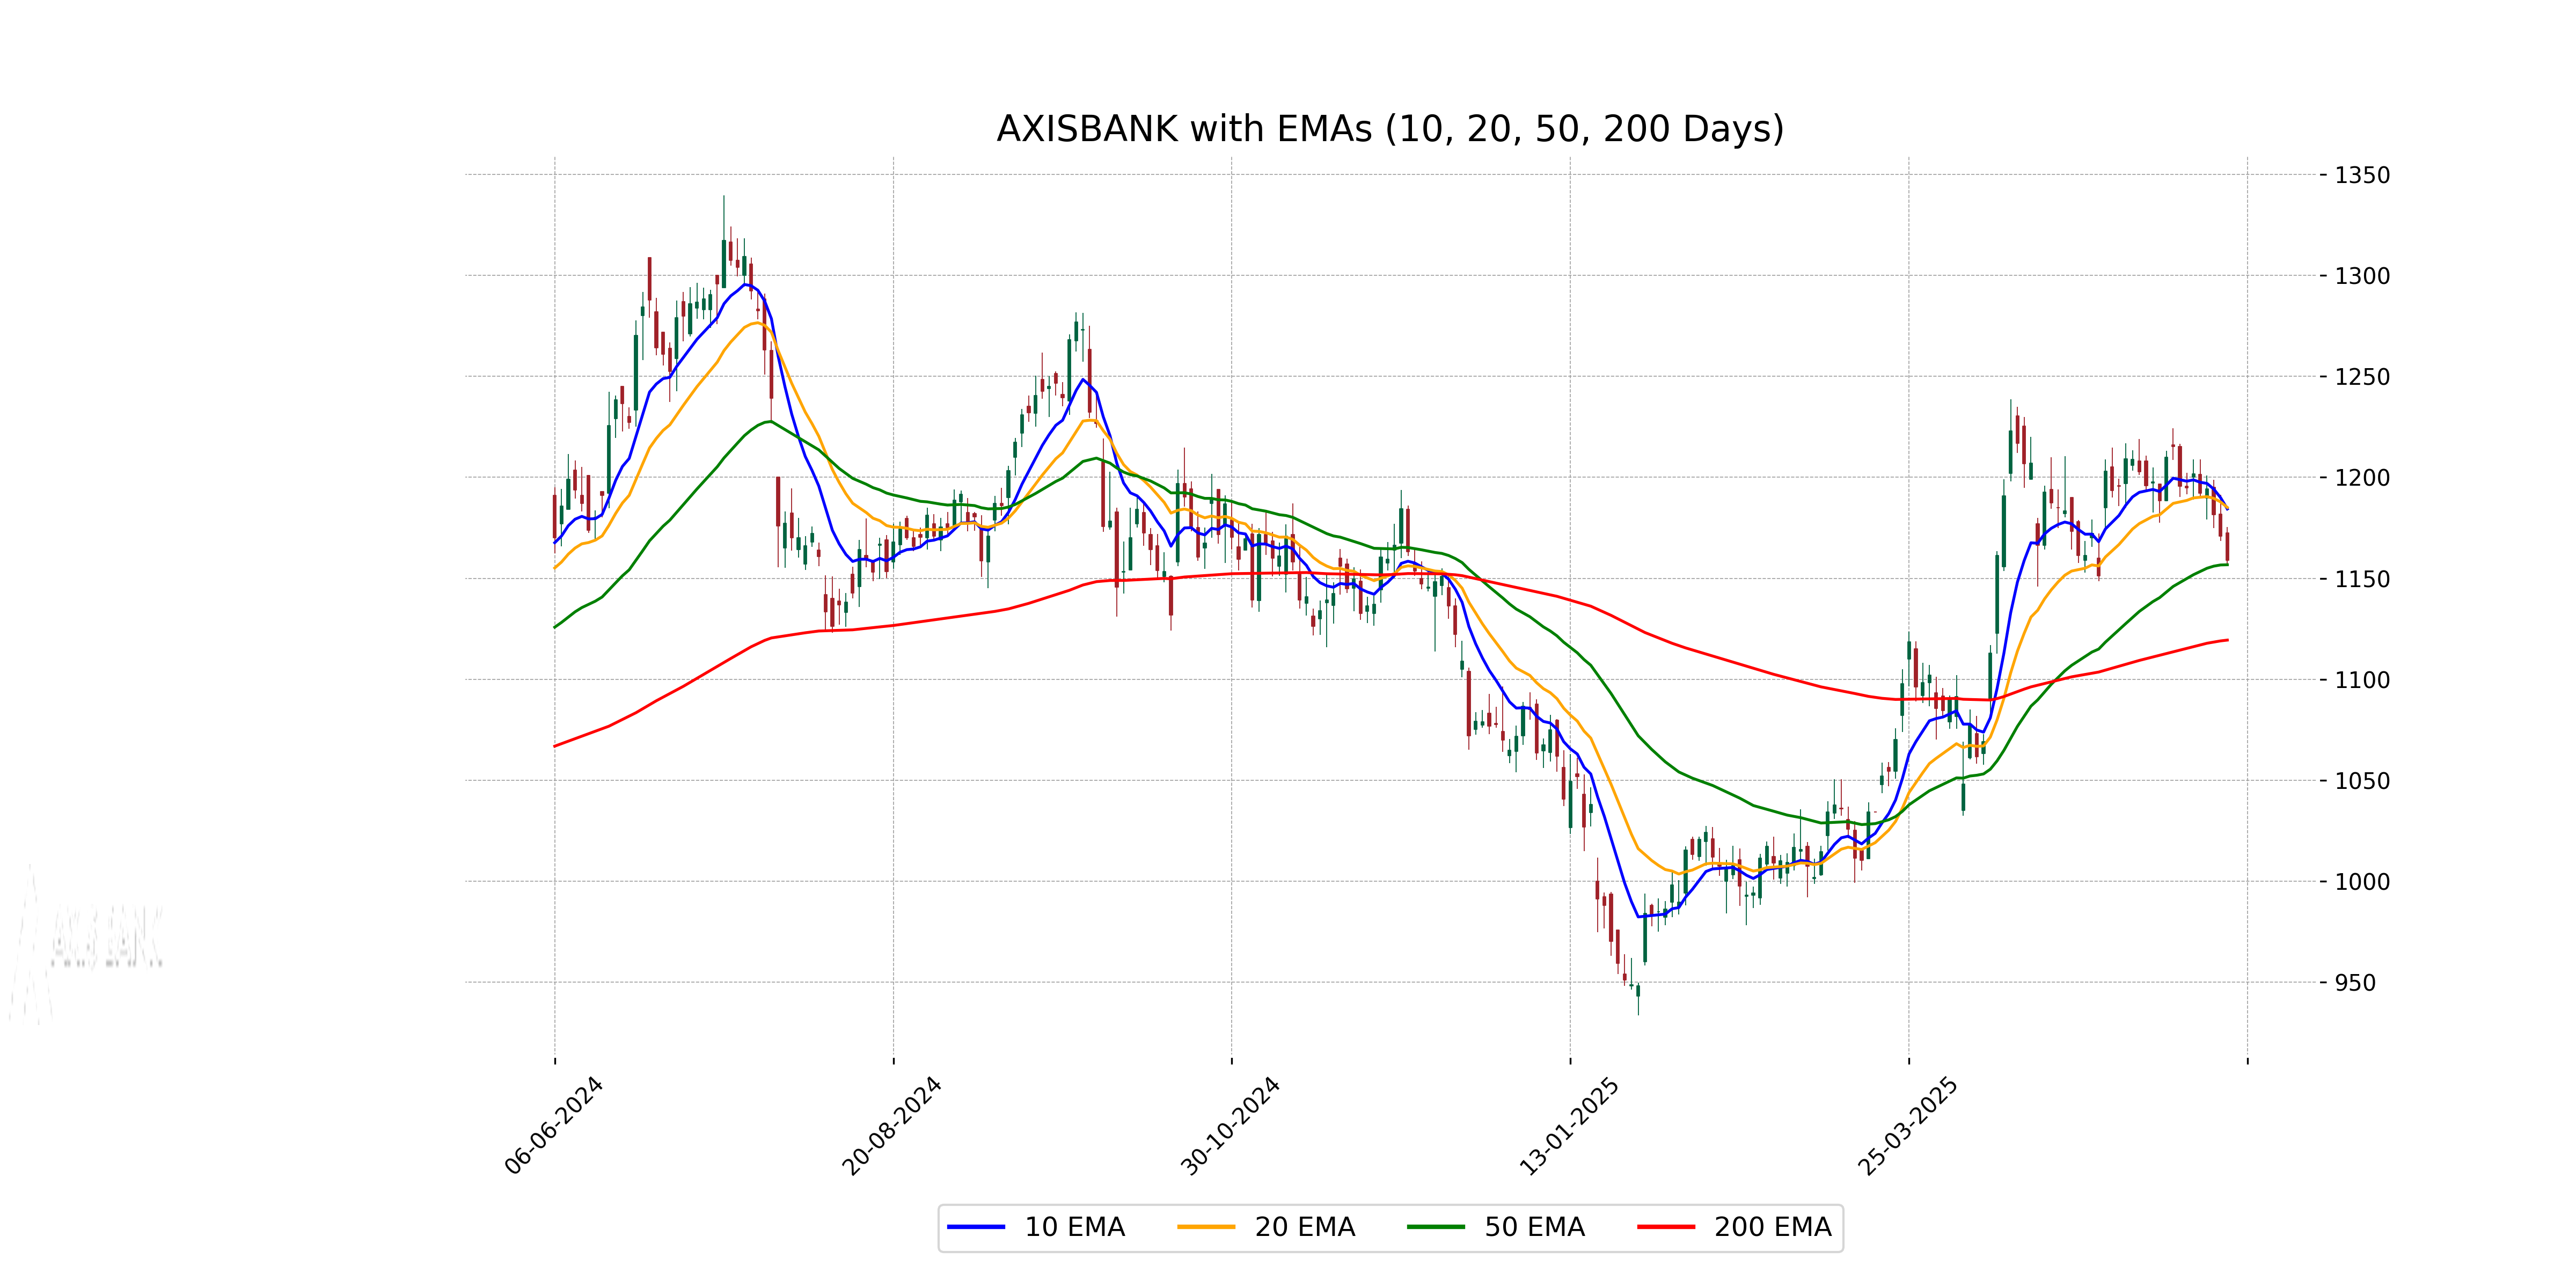
Relationship with Key Moving Averages
Axis Bank's current closing price of 1159.0 is slightly above its 50-day EMA of 1156.69, indicating potential short-term support. However, it is below both the 10-day EMA of 1184.33 and the 20-day EMA of 1185.09, suggesting short-term resistance. The price remains above the 200-day EMA of 1119.36, which indicates a longer-term bullish trend.
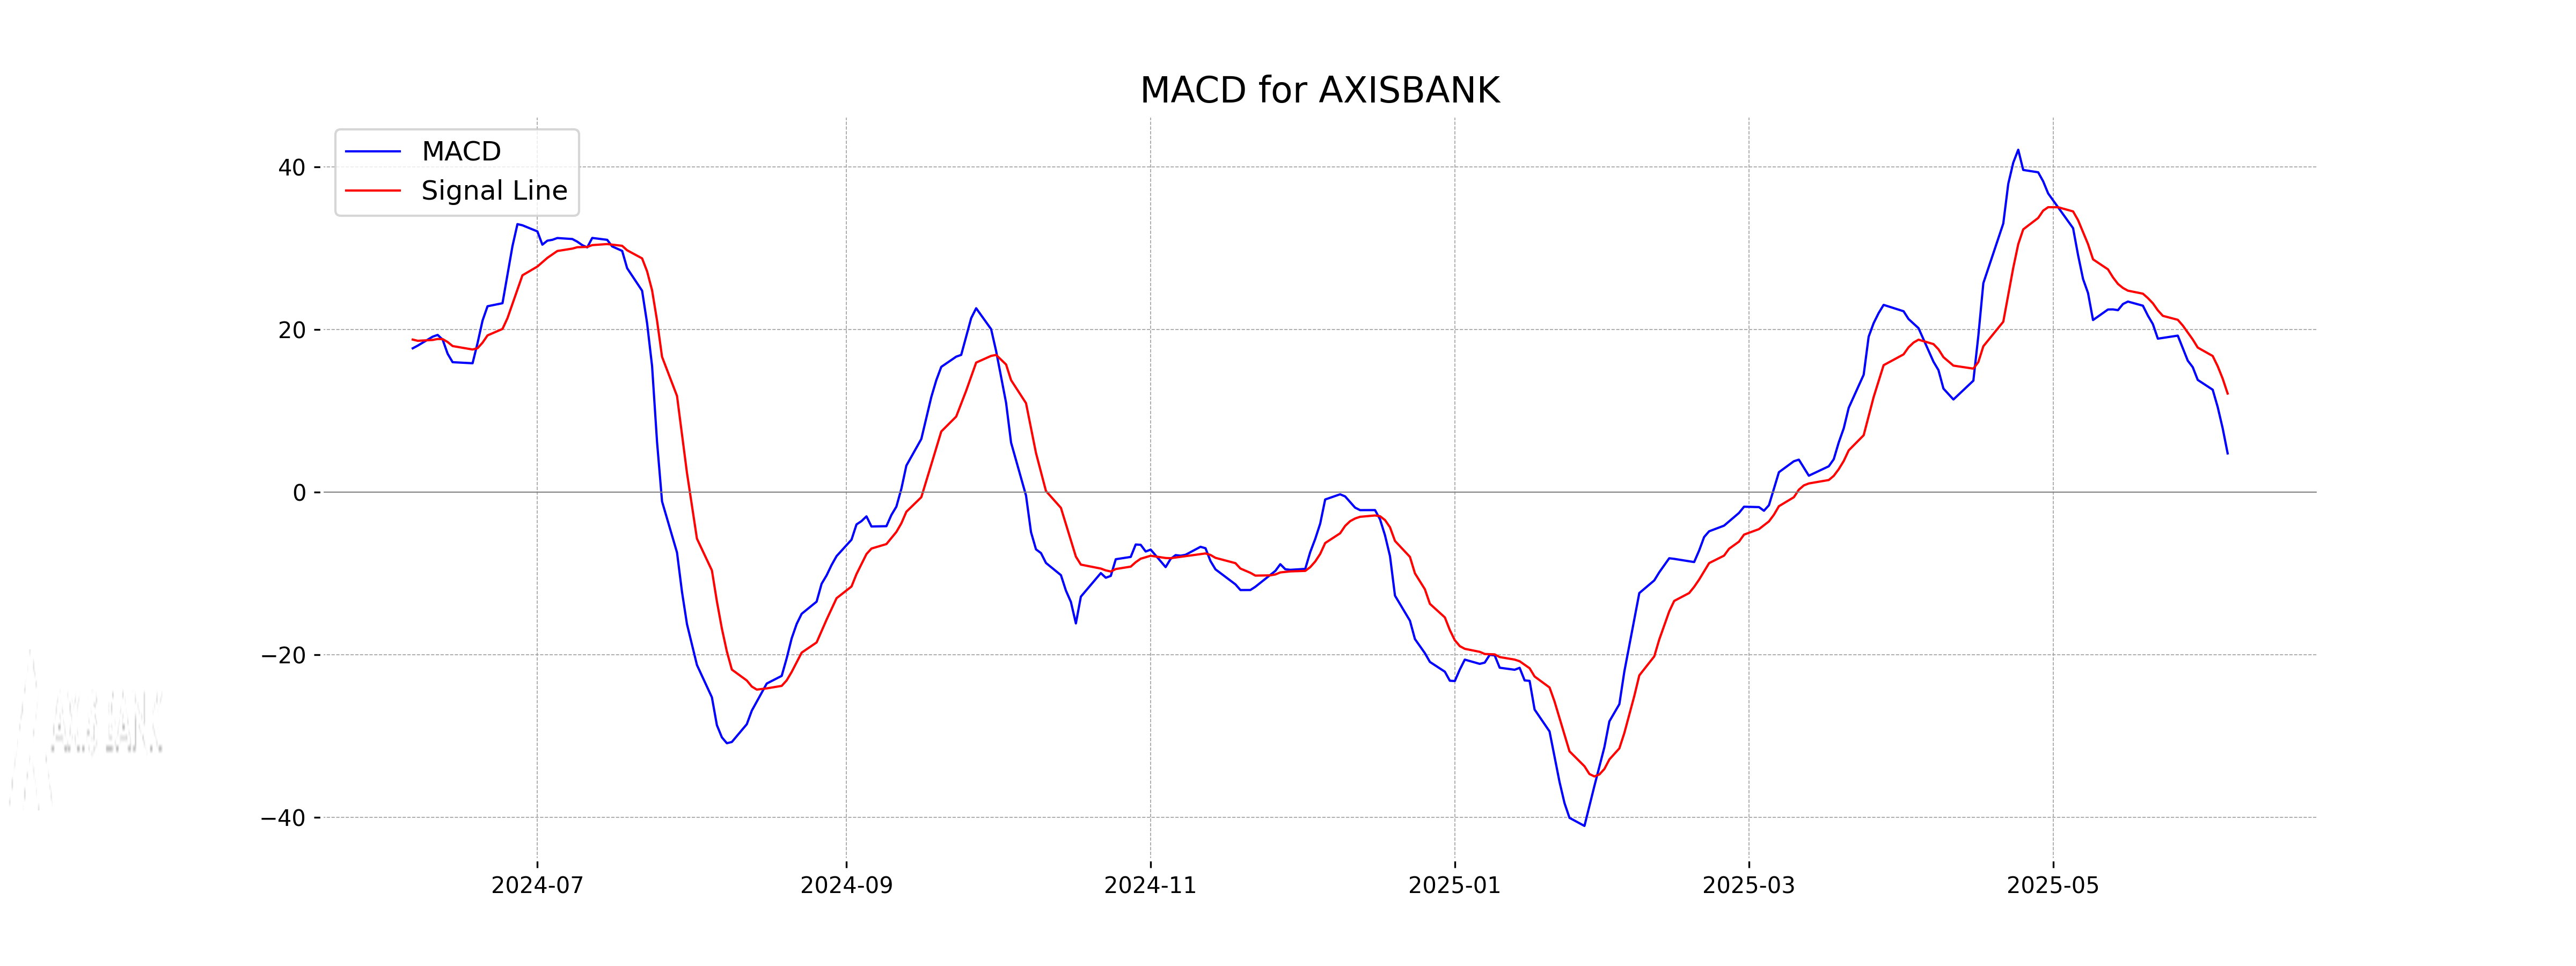
Moving Averages Trend (MACD)
Axis Bank has a MACD value of 4.78, which is below the MACD Signal line at 12.14. This indicates a bearish trend, as the MACD crossing below the signal line often suggests downward momentum in the stock price.
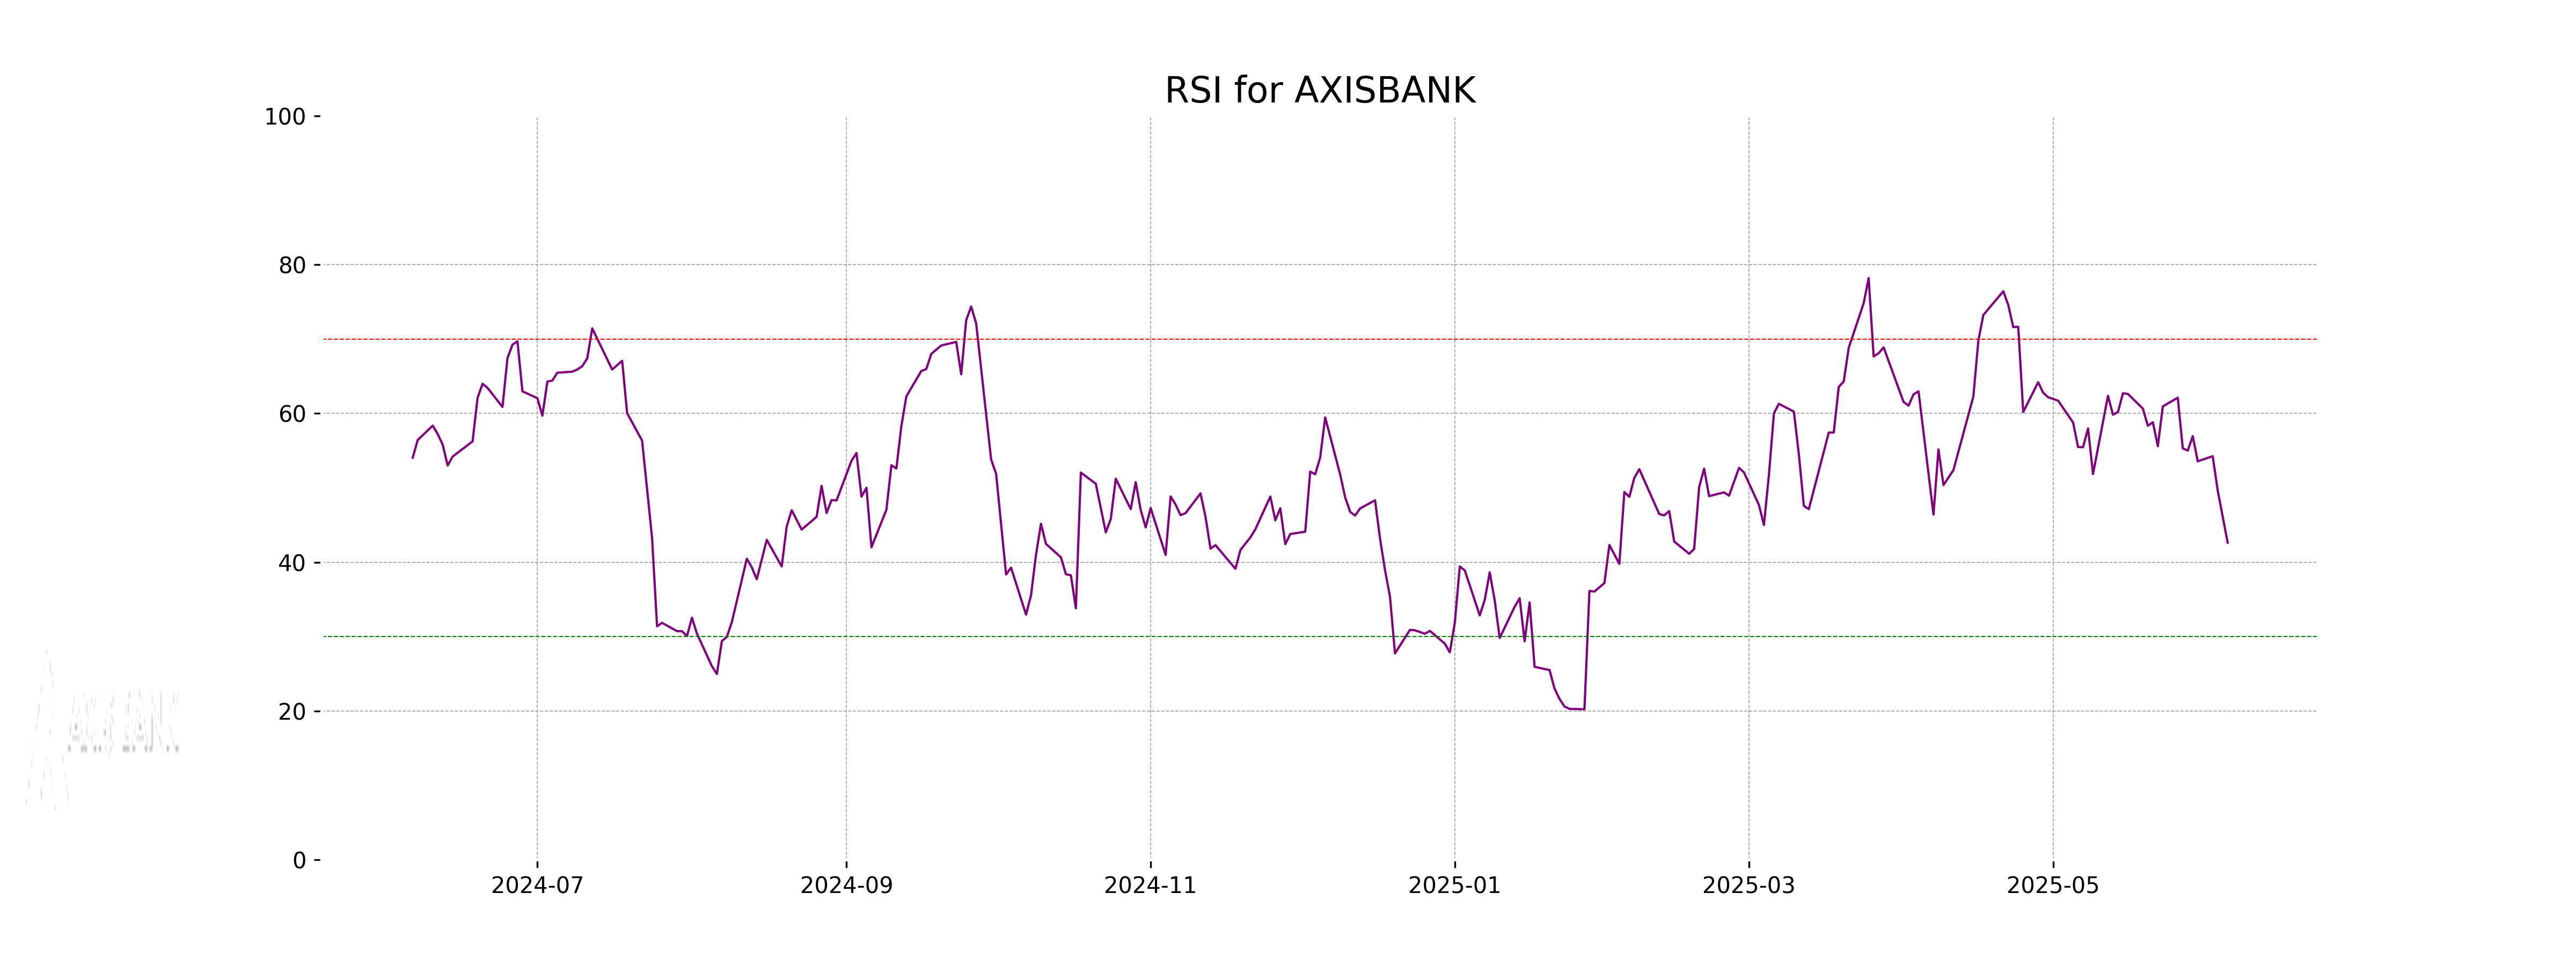
RSI Analysis
Axis Bank's current RSI stands at 42.64, which suggests it is nearing the oversold territory but not yet in it. Generally, an RSI below 30 is considered oversold, and above 70 is considered overbought. This indicates the stock might have further declines in the short term before potentially reversing.
Analysis for Bajaj Finserv - June 05, 2025
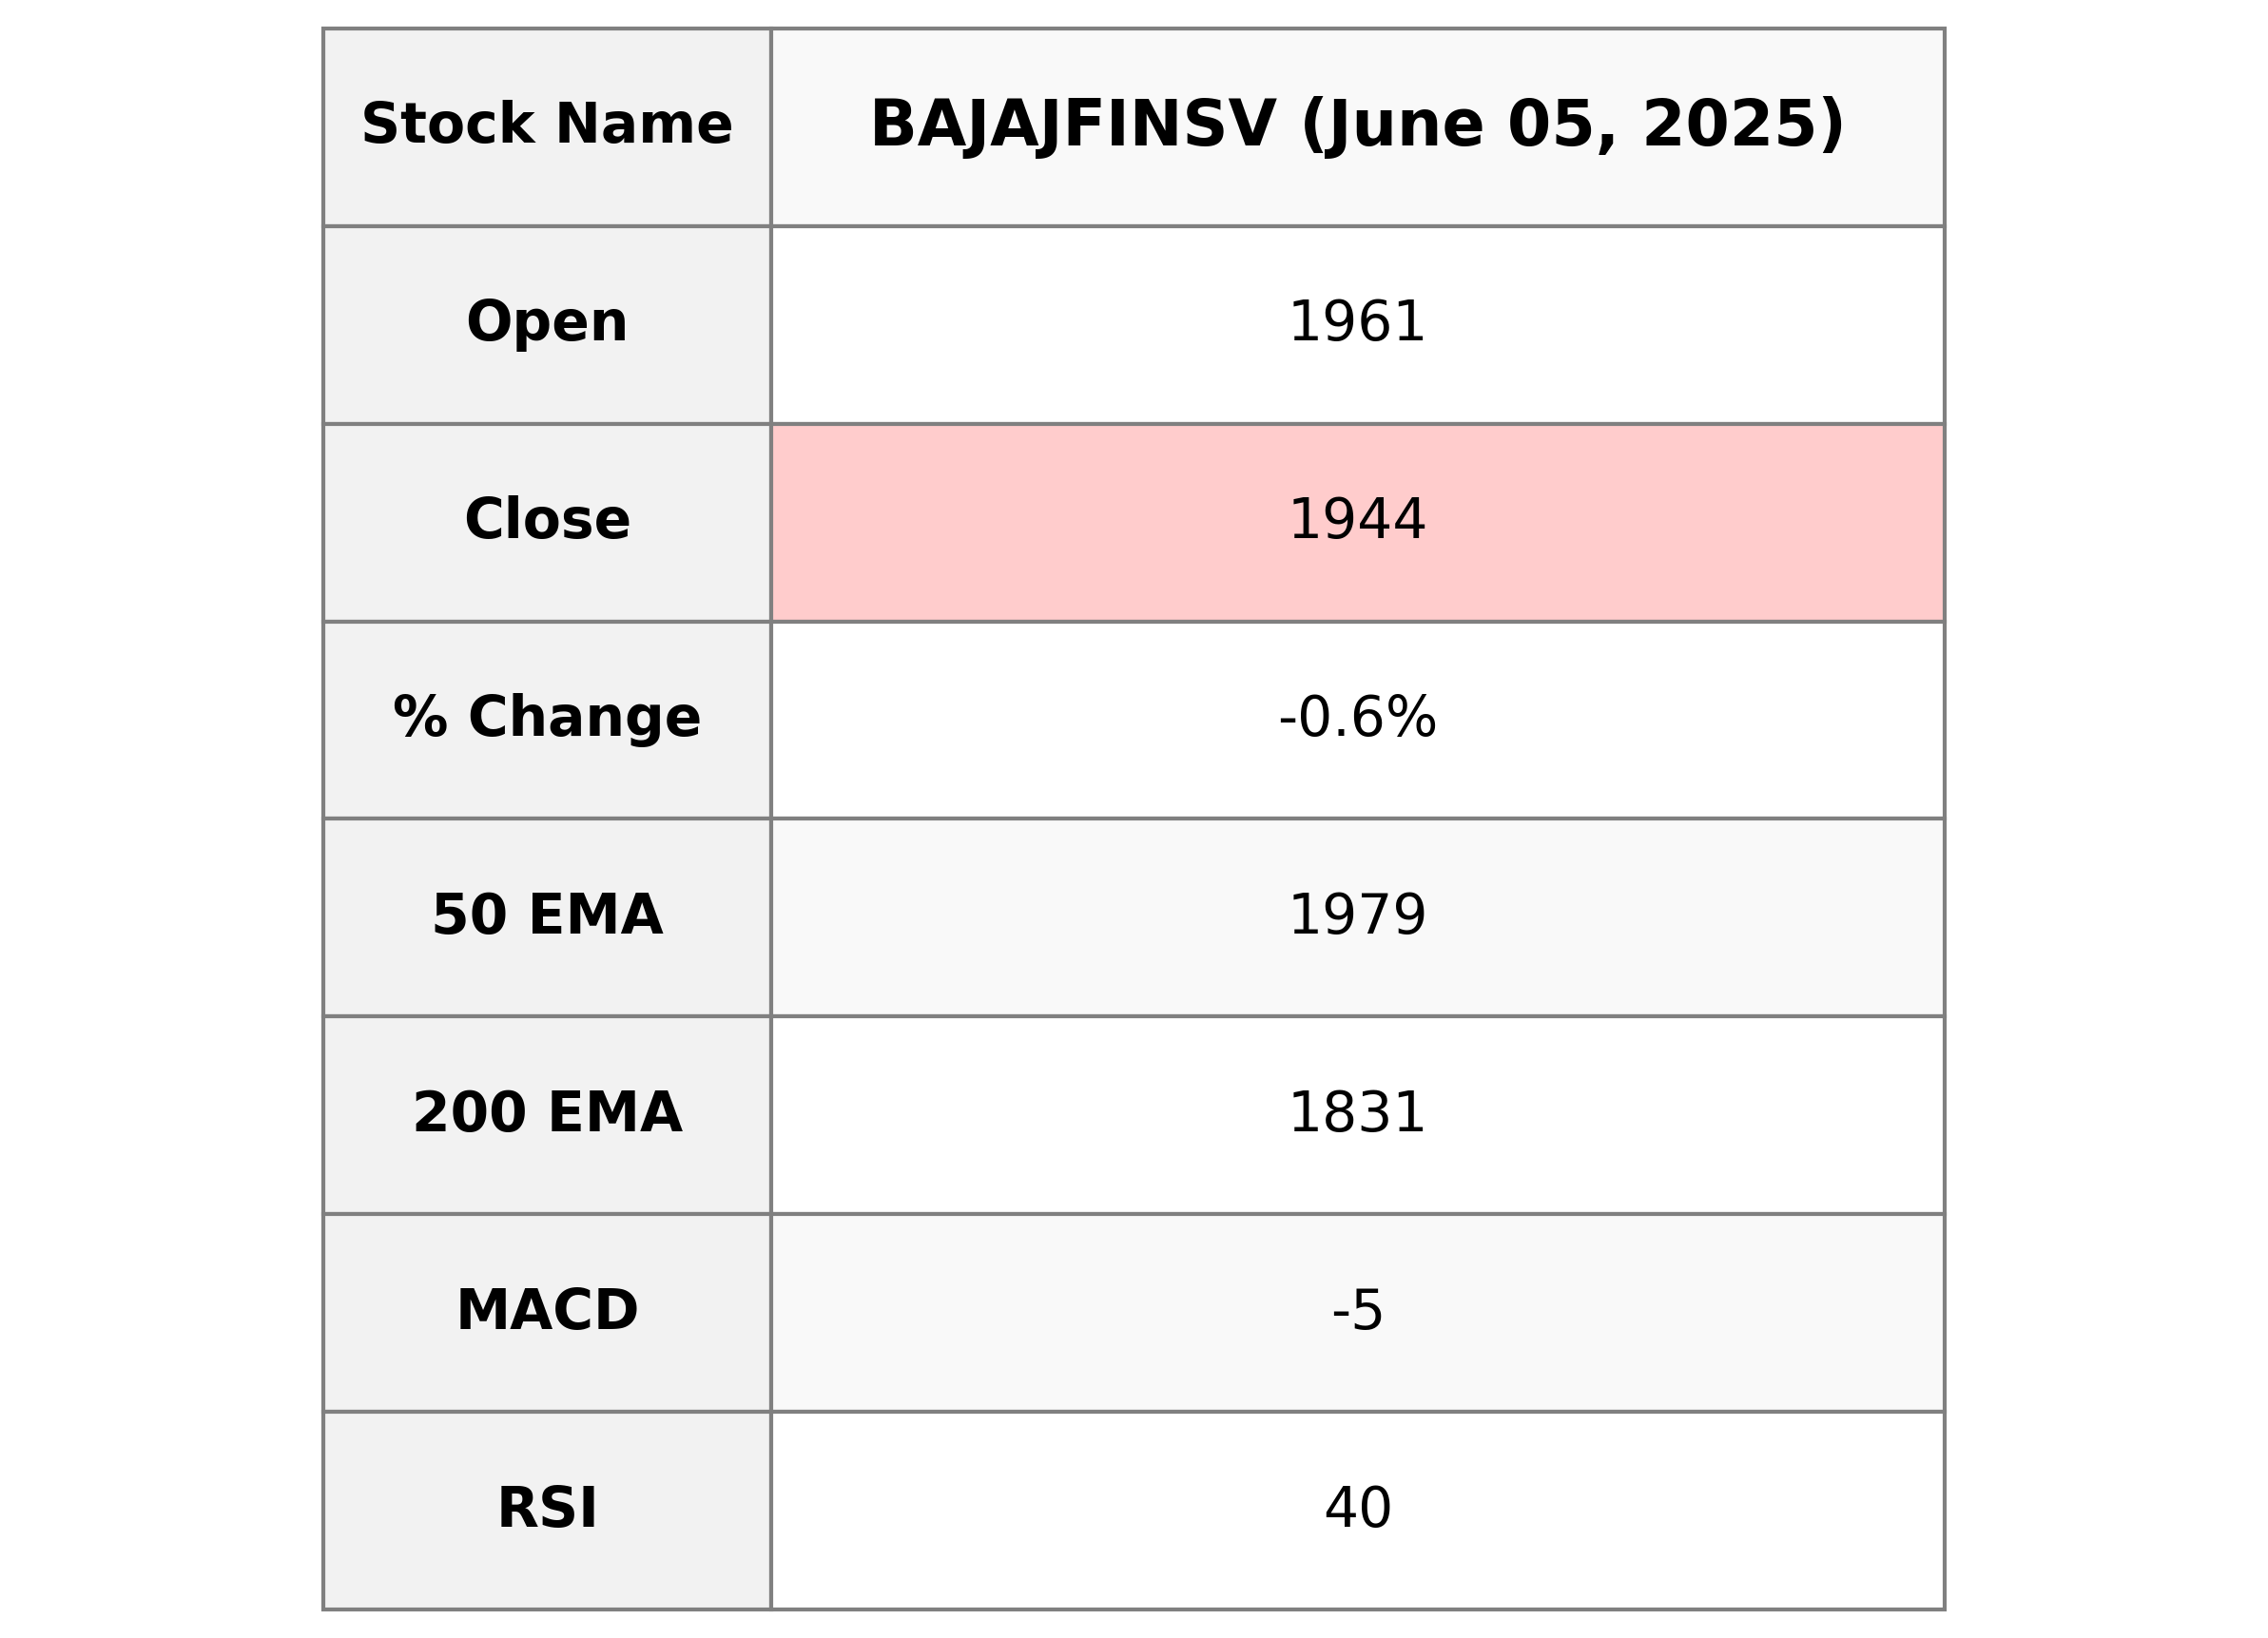
### Bajaj Finserv Performance Bajaj Finserv, operating in the Financial Services sector, reported a slight decline in its stock price, closing at 1944.0, which is a 0.62% decrease from the previous close of 1956.1. The stock traded within a range of 1929.10 to 1965.90 with a moderate trading volume of 1,805,338 shares. The current PE Ratio stands at 35.36, with an EPS of 54.97, indicating ongoing profitability despite short-term market fluctuations. Key indicators such as the RSI at 40.48 suggest neutrality, while the MACD suggests potential downward momentum.
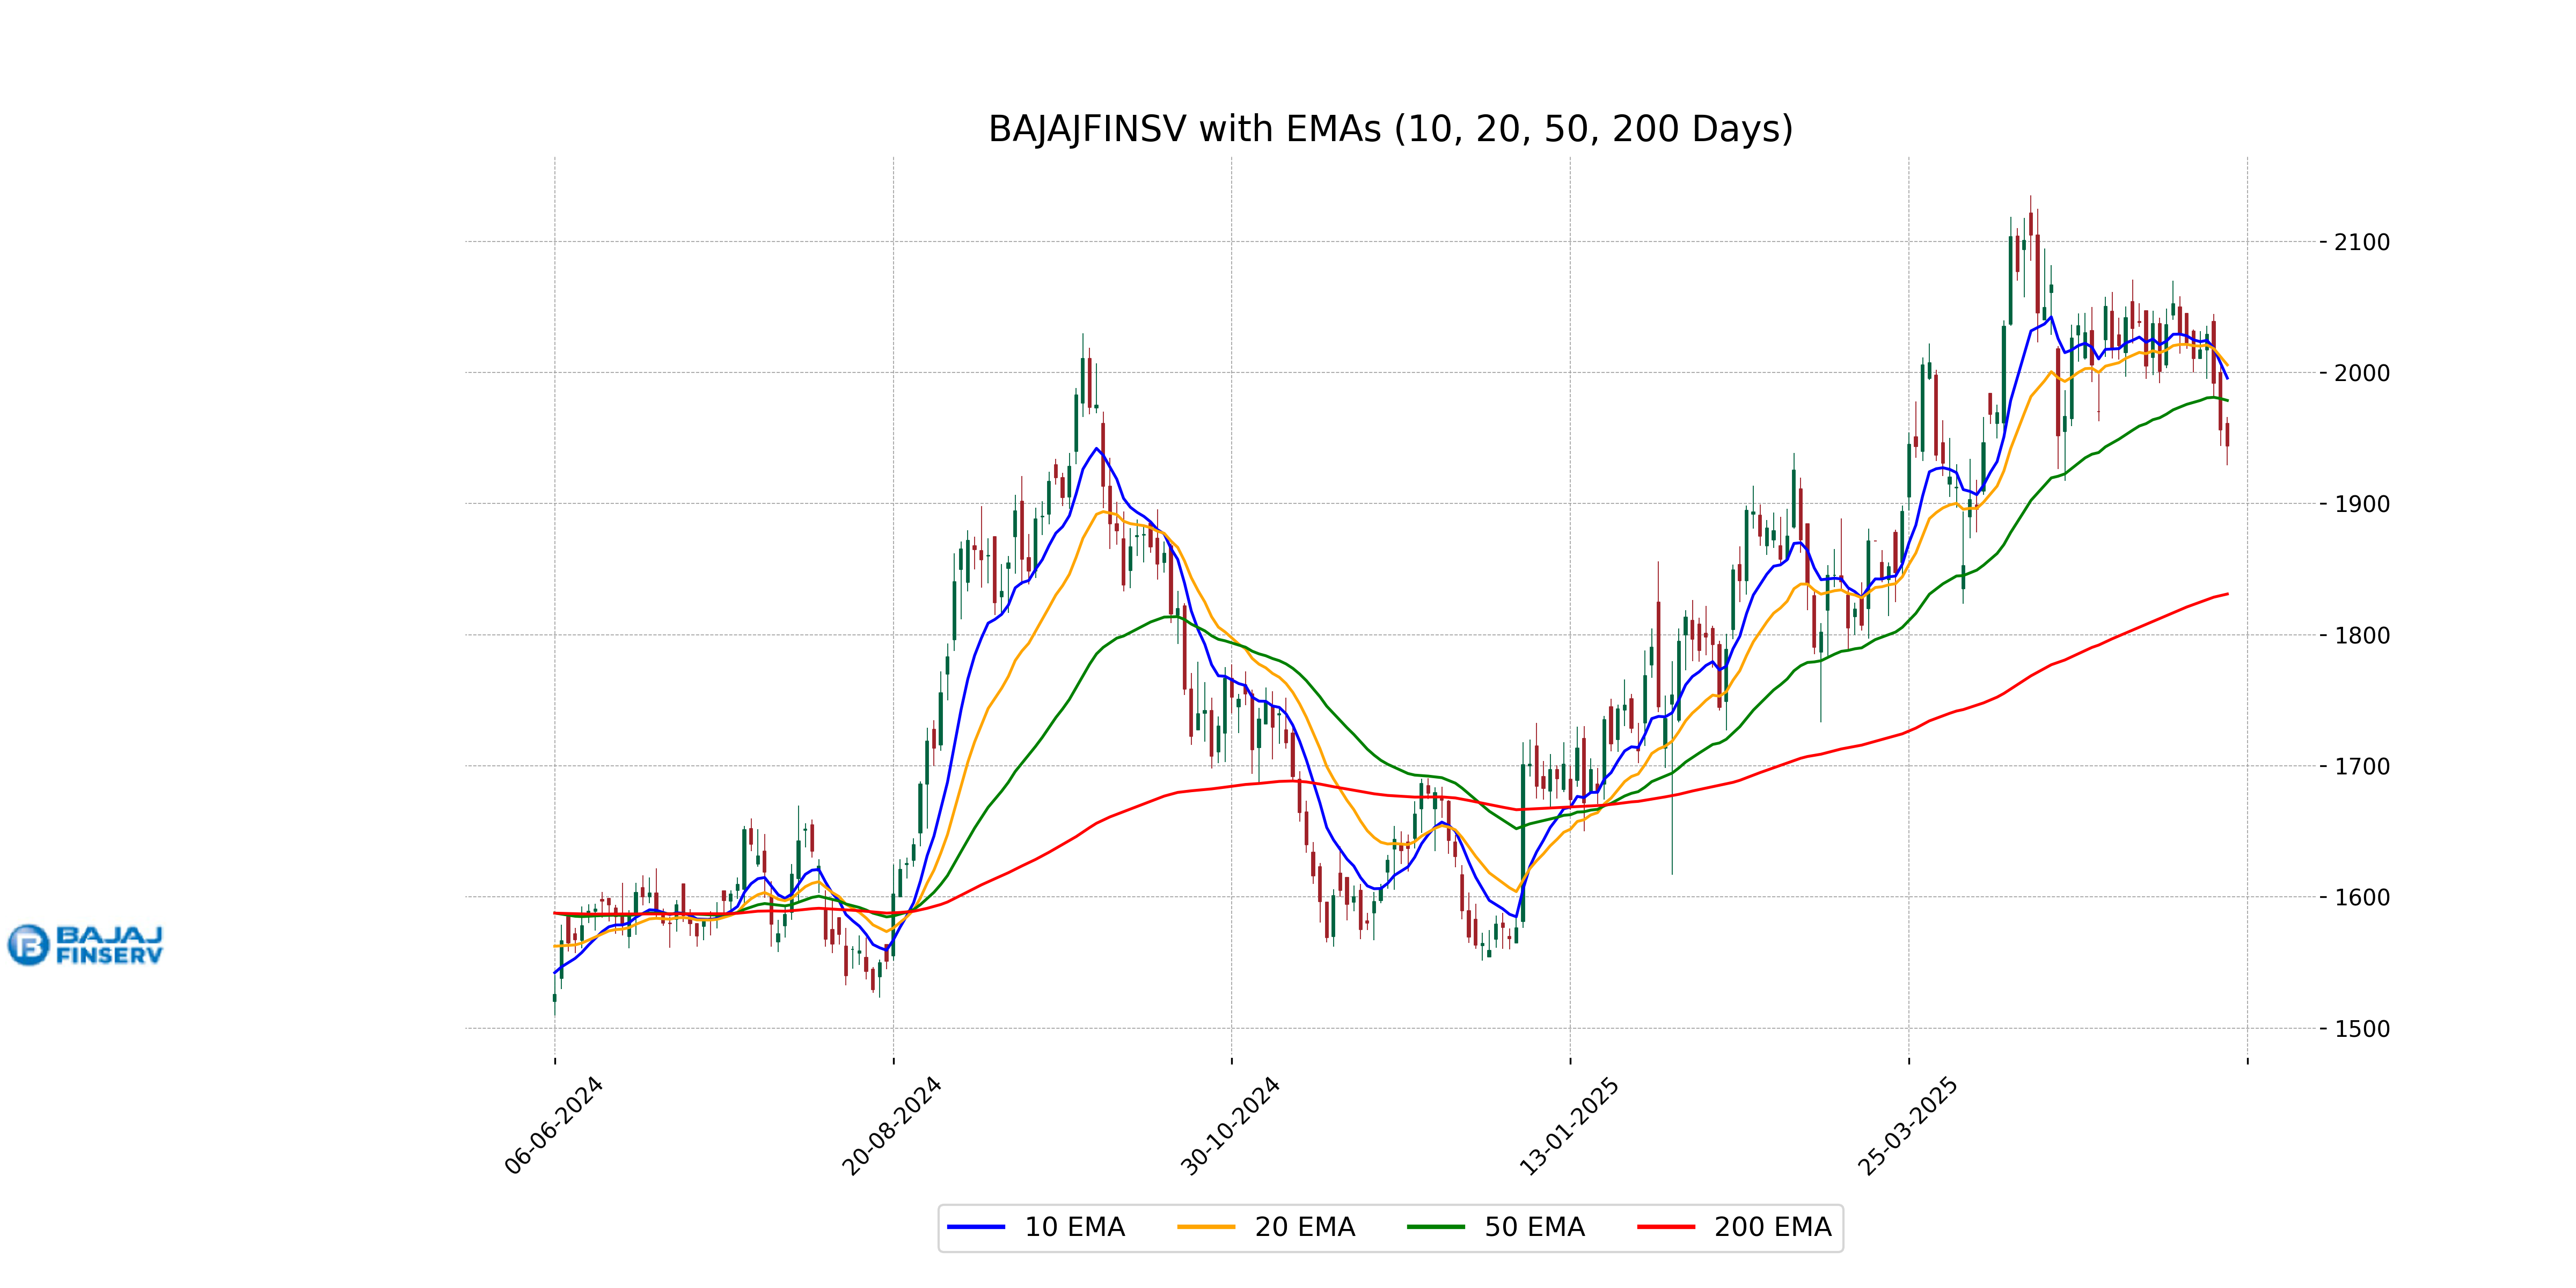
Relationship with Key Moving Averages
Bajaj Finserv is trading below its significant moving averages, with the current price of 1944.0 being under its 50 EMA of 1978.72 and 10 EMA of 1995.75, suggesting a short-term bearish trend. Additionally, the 20 EMA at 2005.83 indicates further downward pressure relative to these averages.
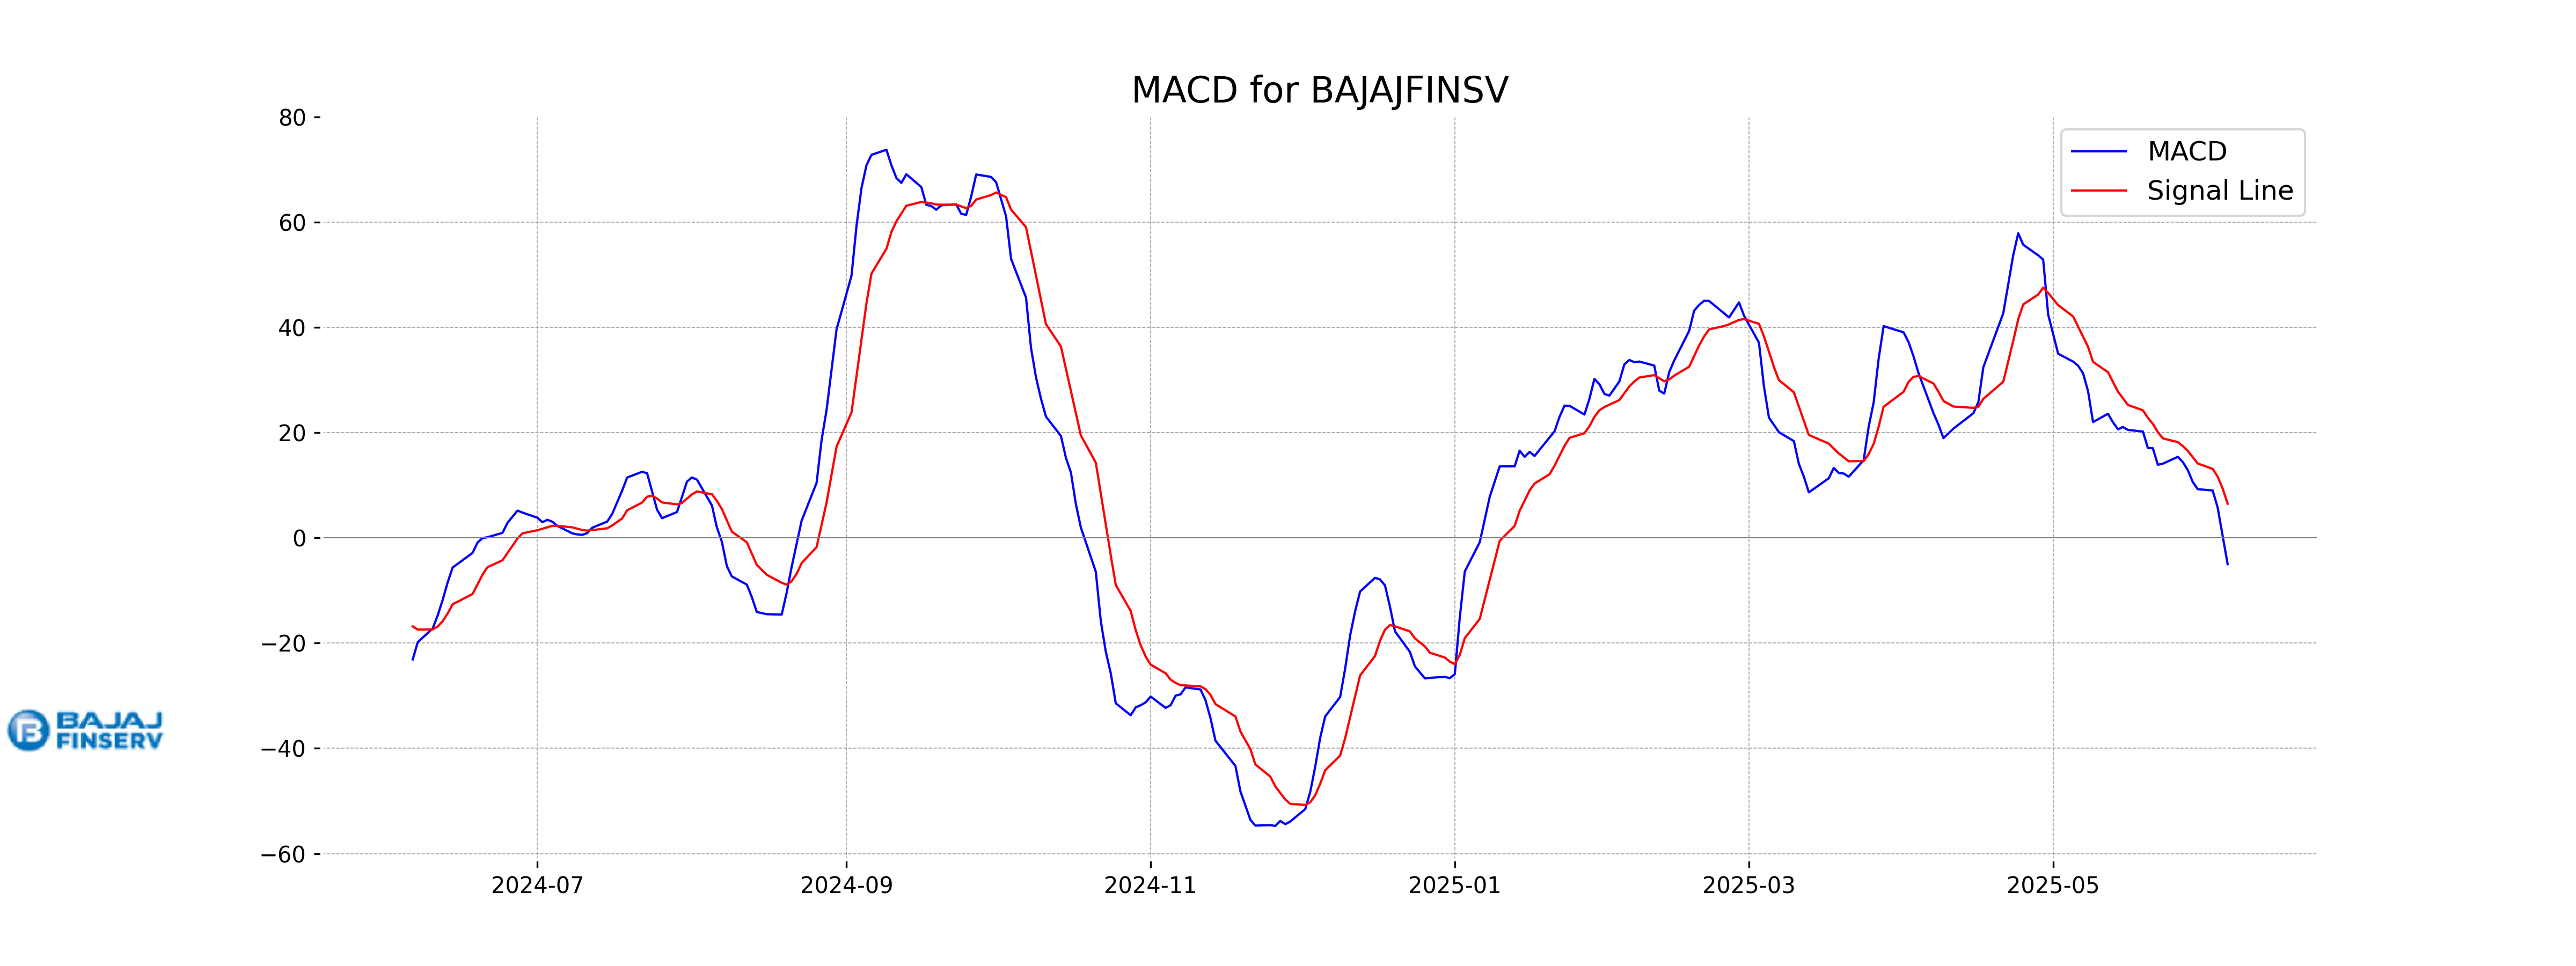
Moving Averages Trend (MACD)
### MACD Analysis for Bajaj Finserv The MACD value for Bajaj Finserv is -5.00, which is below the MACD Signal line at 6.48. This suggests a bearish trend, indicating that the stock may be experiencing downward momentum. Investors should watch for any changes in these indicators to anticipate potential trend reversals.
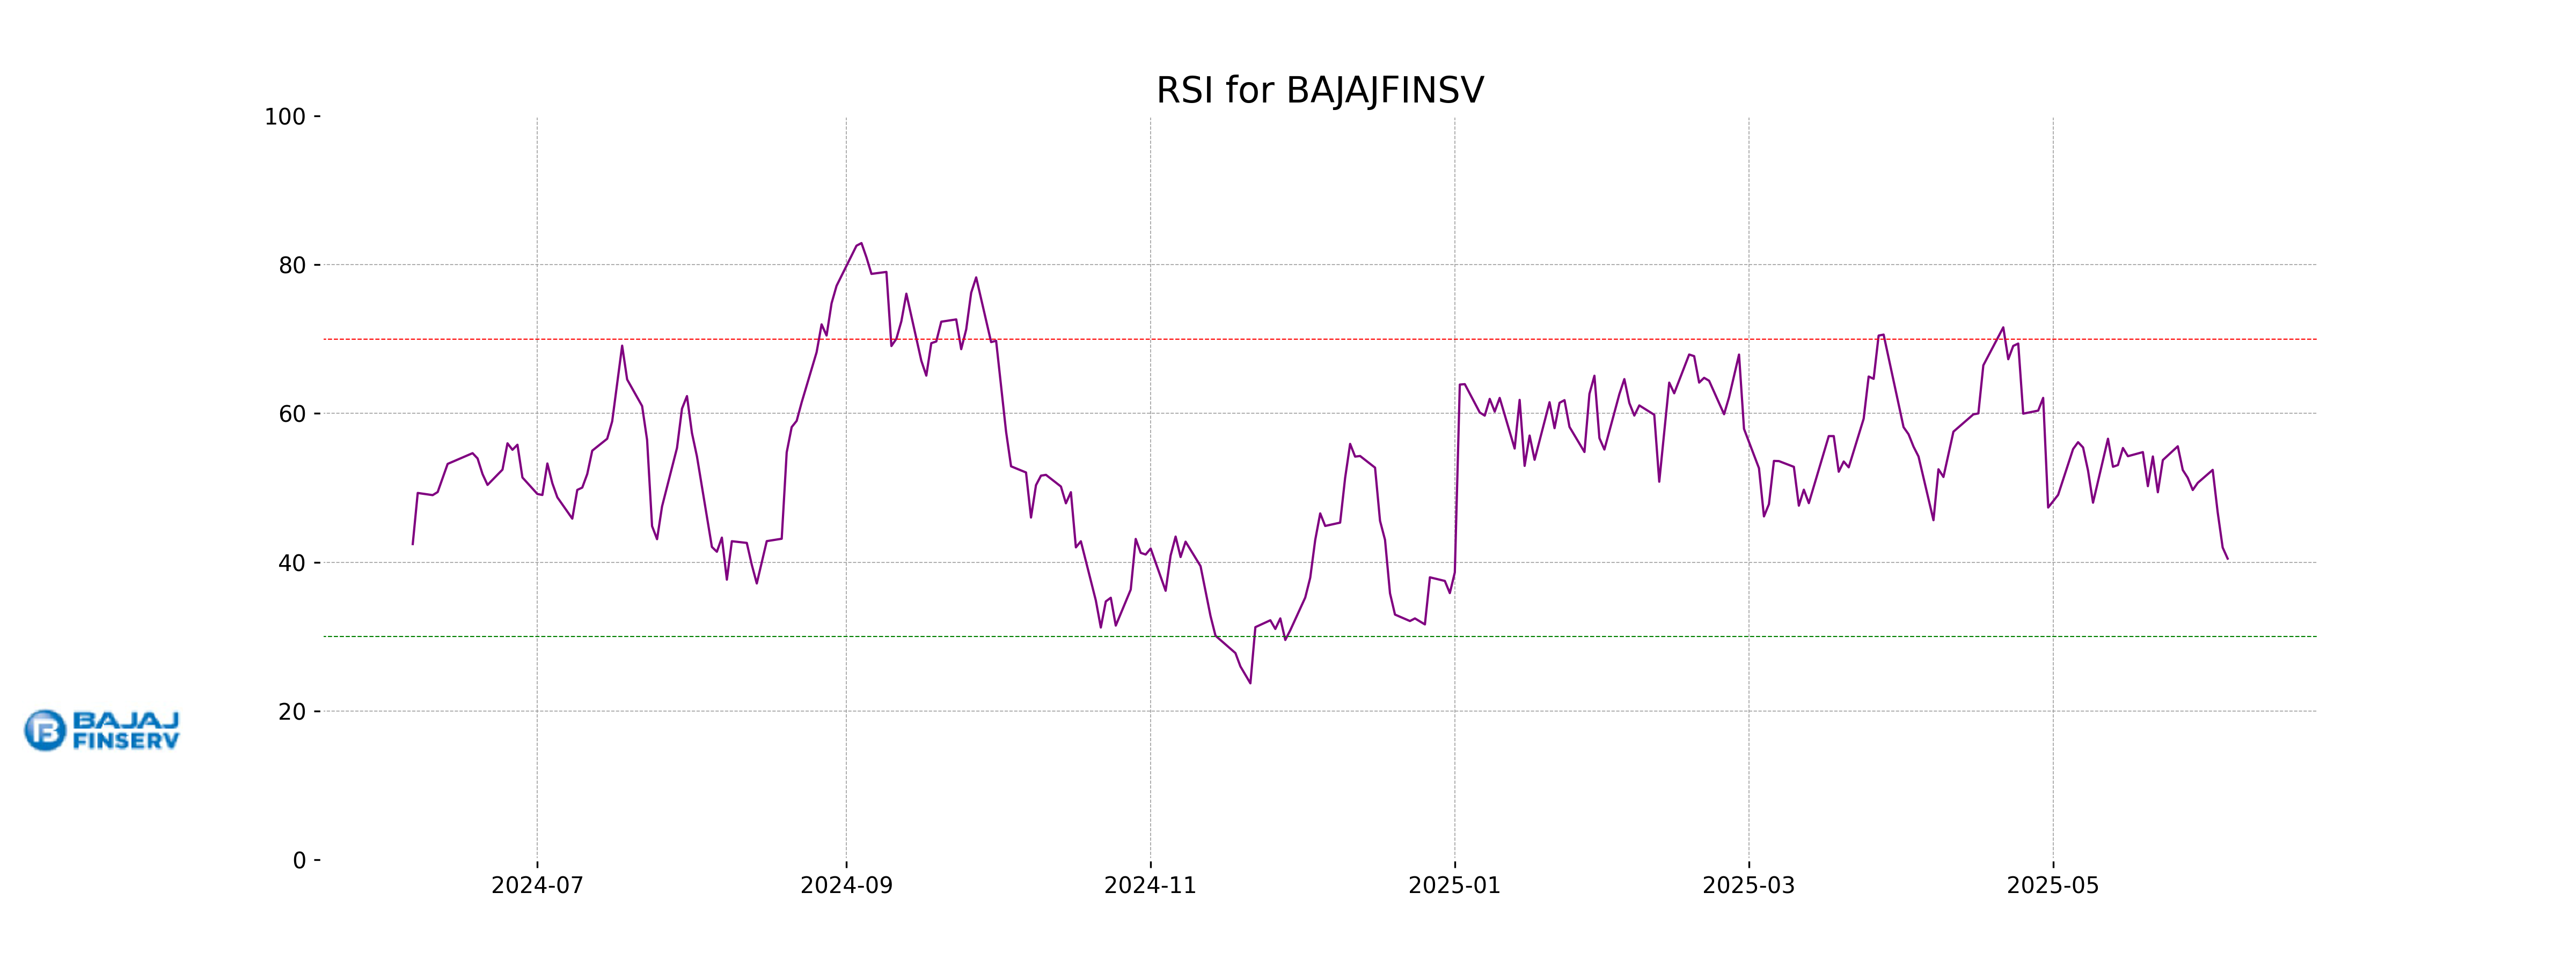
RSI Analysis
### RSI Analysis for Bajaj Finserv The Relative Strength Index (RSI) for Bajaj Finserv is 40.48, indicating that the stock is approaching the oversold territory. An RSI below 30 typically suggests oversold conditions, so investors might monitor it for potential buying opportunities if the RSI continues to decline.
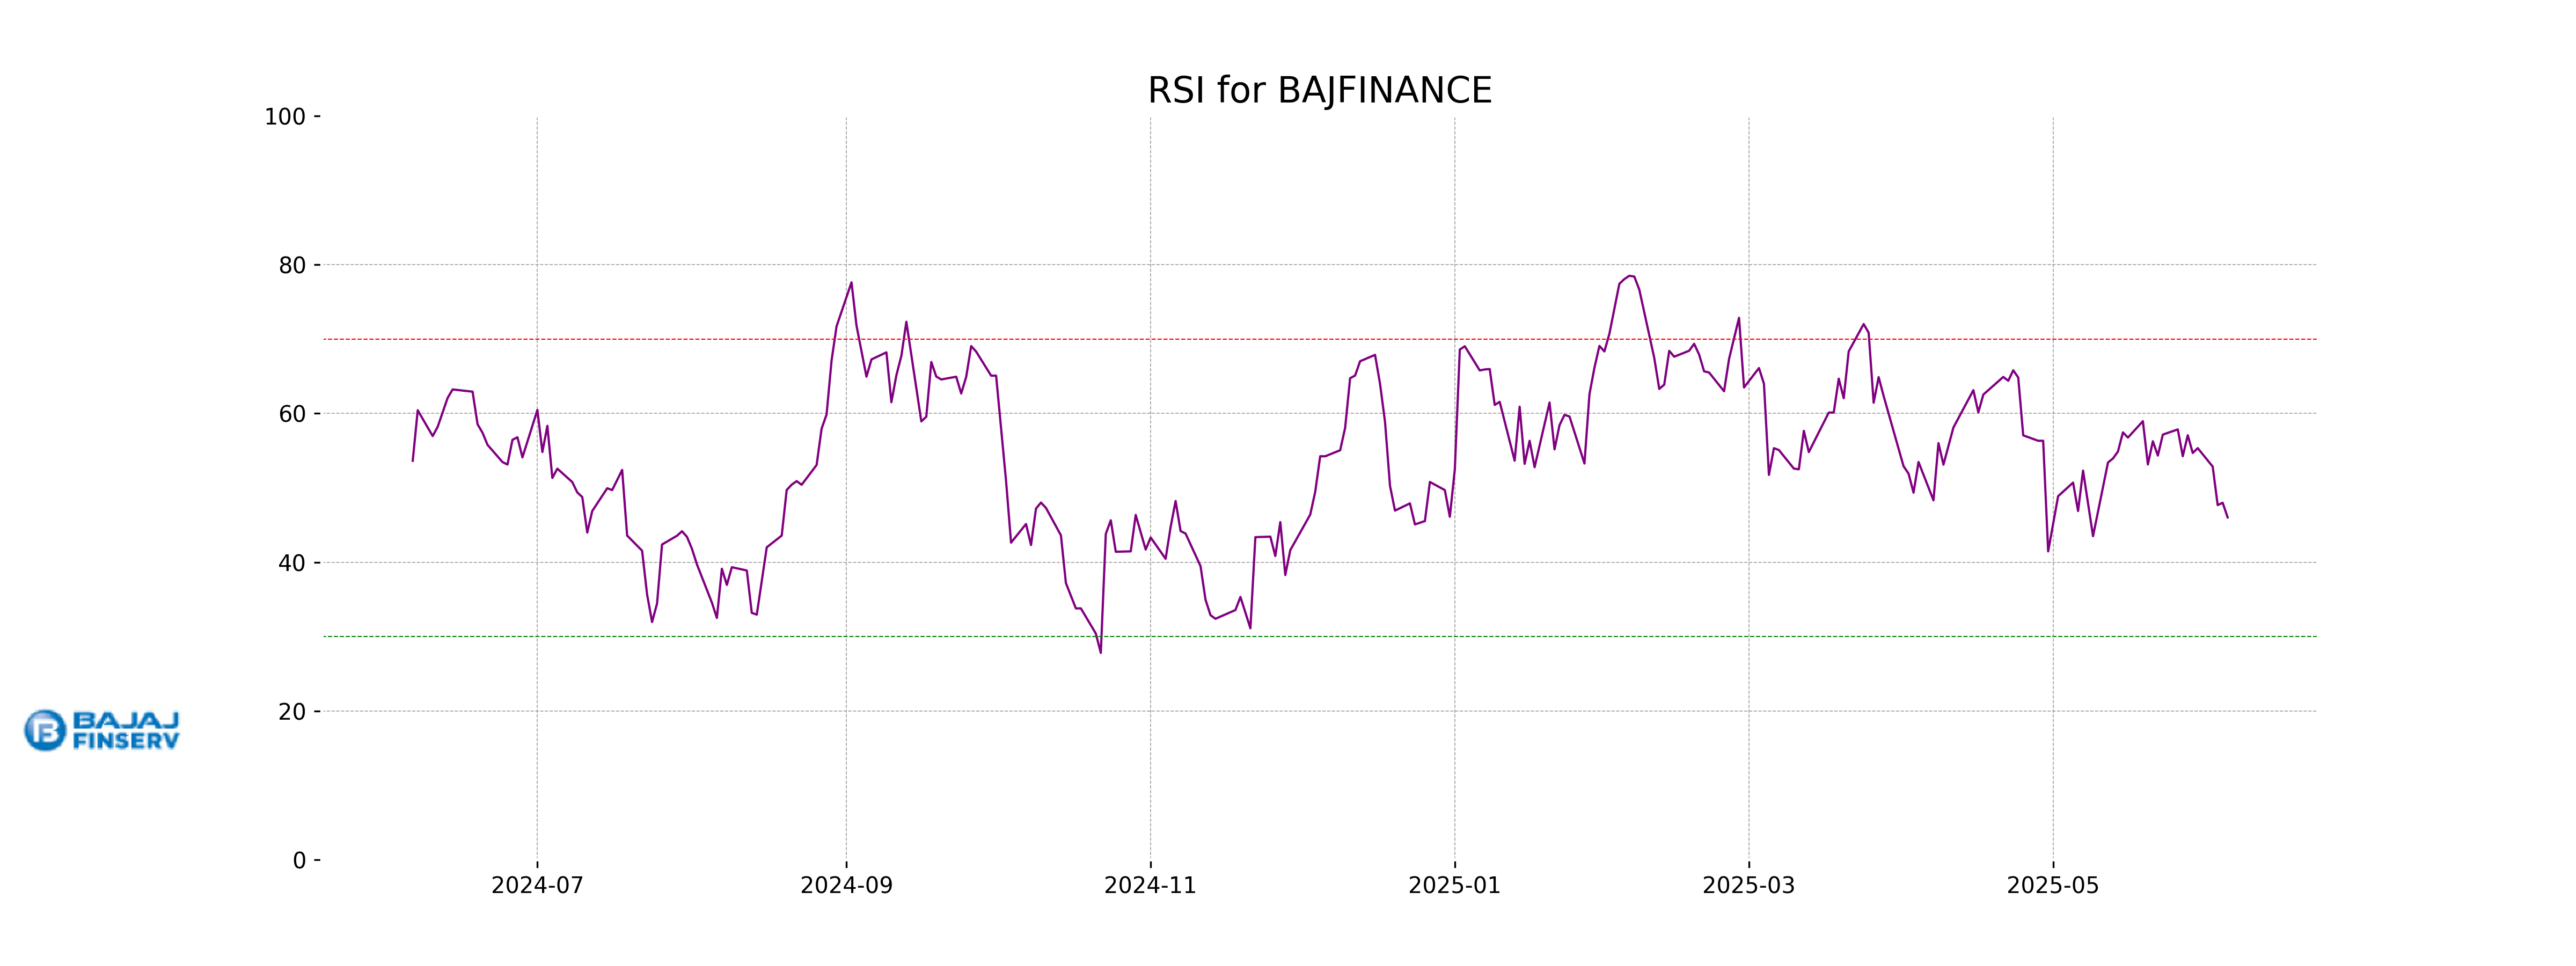
Analysis for Bajaj Finance - June 05, 2025
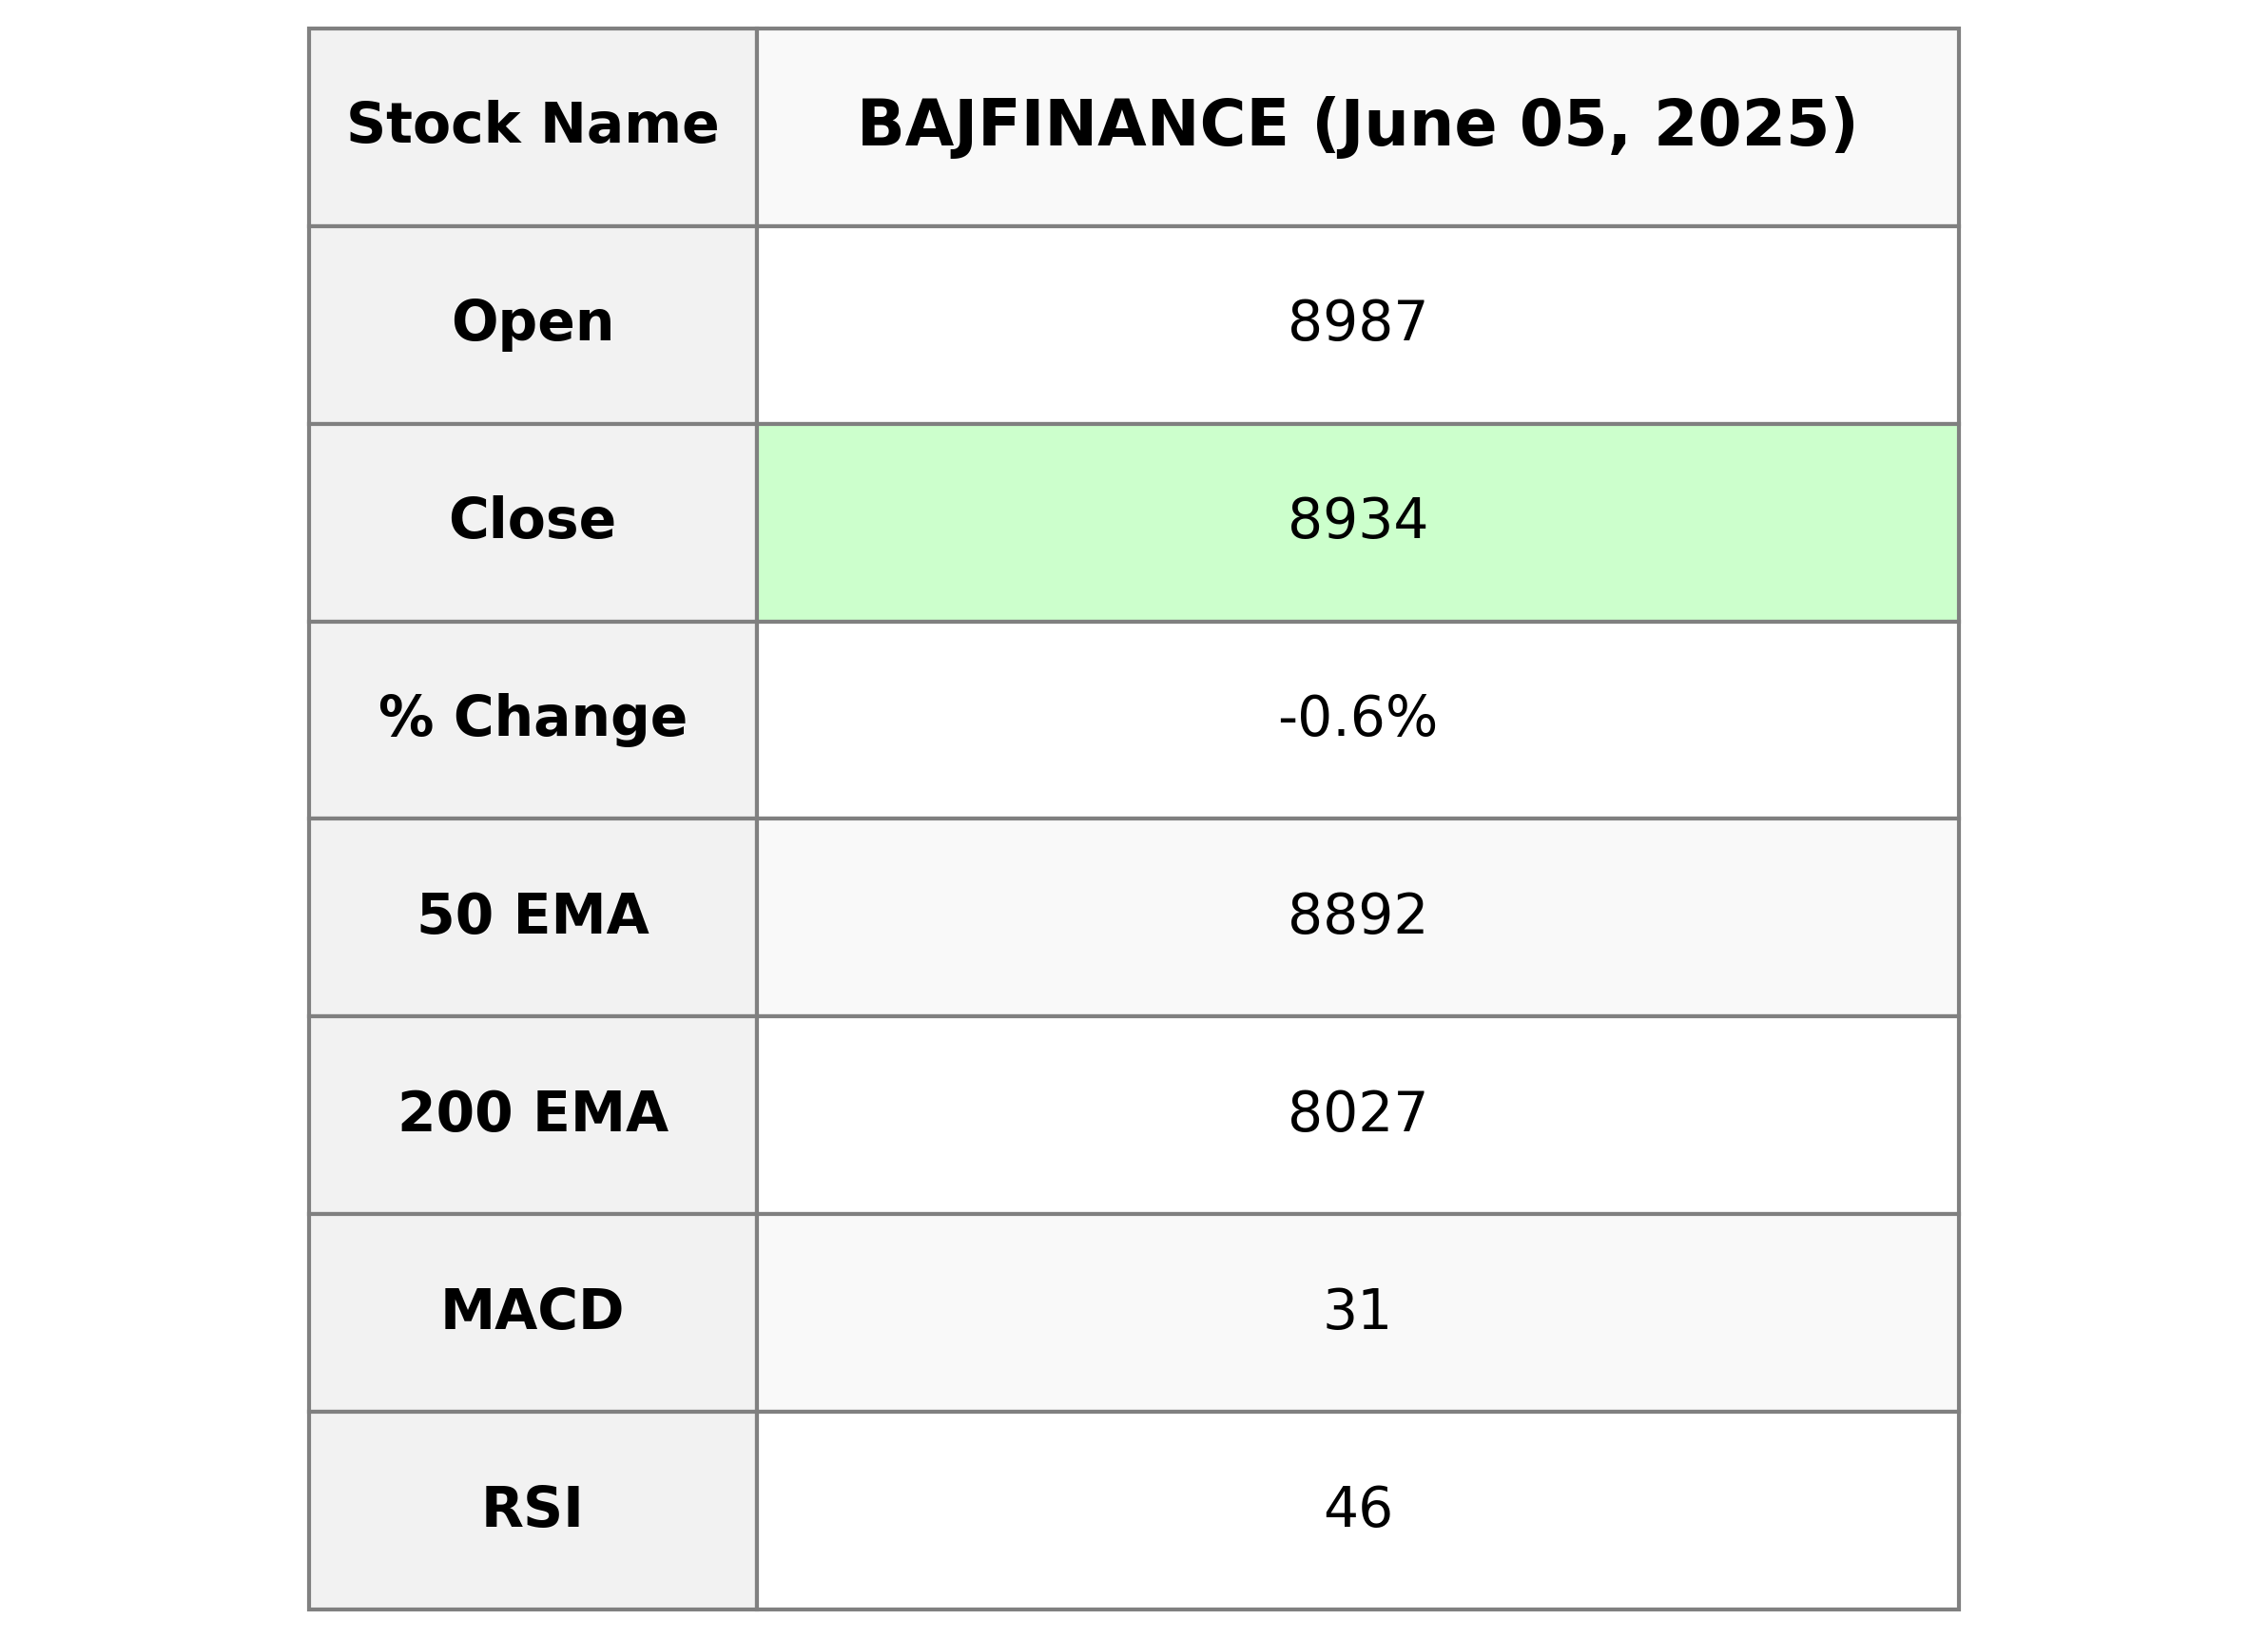
Bajaj Finance in the Credit Services industry under the Financial Services sector in India, closed at 8,934.0, experiencing a percentage change of -0.59%. The stock is slightly below its 10 and 20-day EMAs but above the 50-day EMA. The RSI at 46.02 indicates neither overbought nor oversold conditions. The MACD is below the signal line, suggesting a bearish trend. The company maintains a market cap of approximately 5.55 trillion INR, with a PE ratio of 33.36 and an EPS of 267.81.
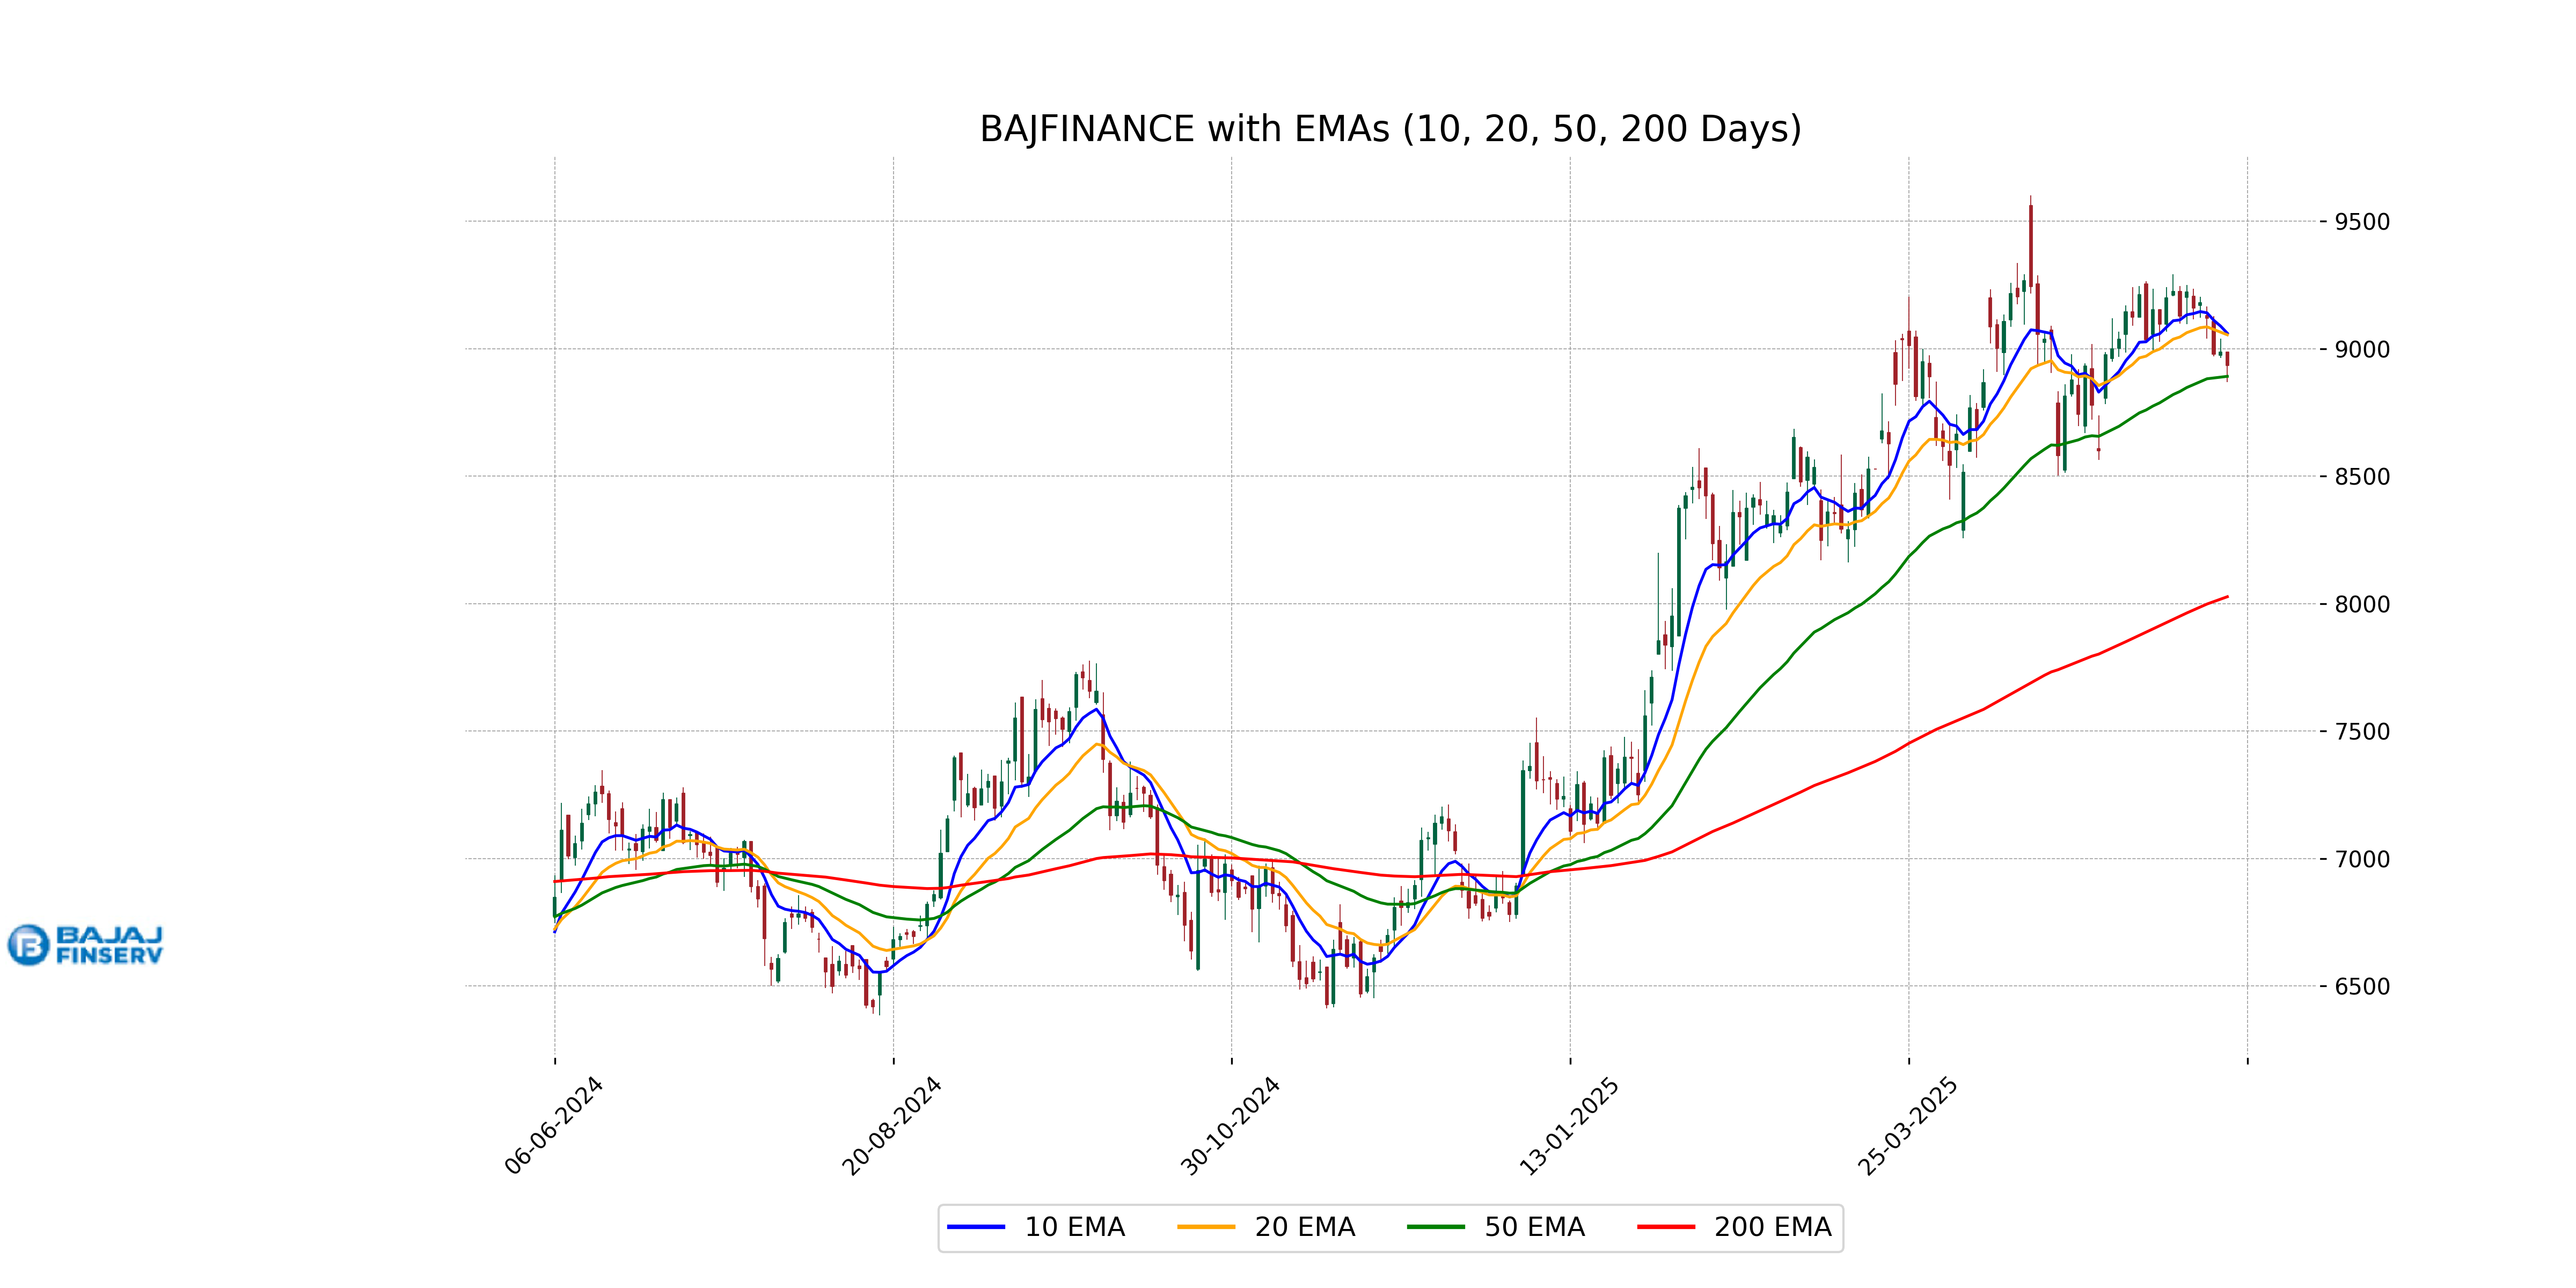
Relationship with Key Moving Averages
Bajaj Finance is trading slightly above its 50-day EMA, indicating recent support at this level, while it is significantly above the 200-day EMA, showing a strong longer-term uptrend. However, the stock is currently below both its 10-day and 20-day EMAs, suggesting short-term bearish momentum.
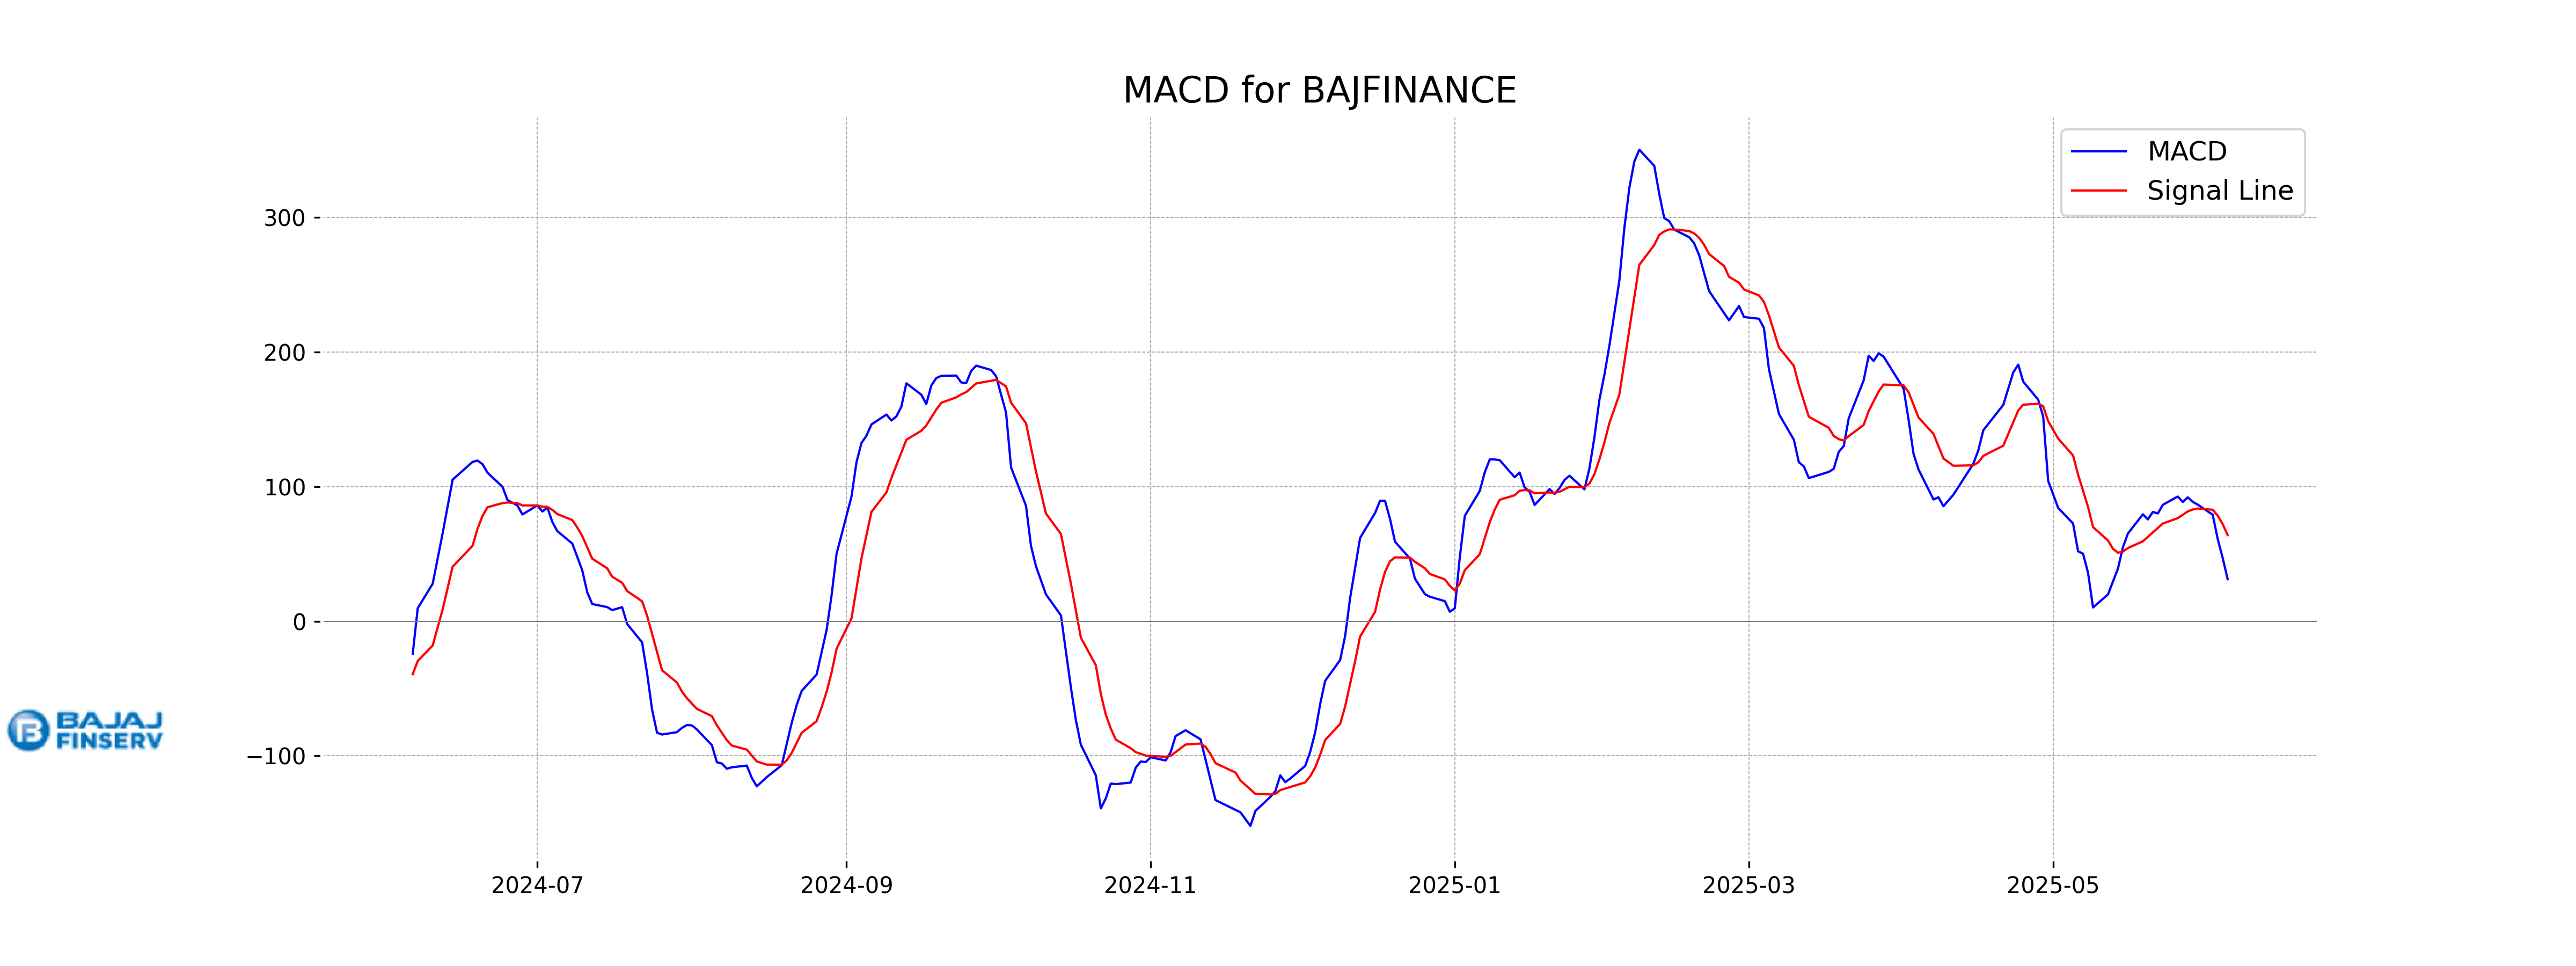
Moving Averages Trend (MACD)
Bajaj Finance MACD Analysis: The MACD value of 31.24, which is below the MACD Signal line of 63.97, suggests that the stock is currently in a bearish trend. This negative divergence indicates potential selling pressure and may signal further downside if the trend continues.
RSI Analysis
Bajaj Finance's RSI (Relative Strength Index) is 46.02, which suggests that the stock is currently in a neutral zone but leaning toward being oversold. Generally, an RSI below 30 is considered oversold, while an RSI above 70 is considered overbought. A value of 46.02 indicates that the stock might not be experiencing strong buying or selling pressure at the moment.
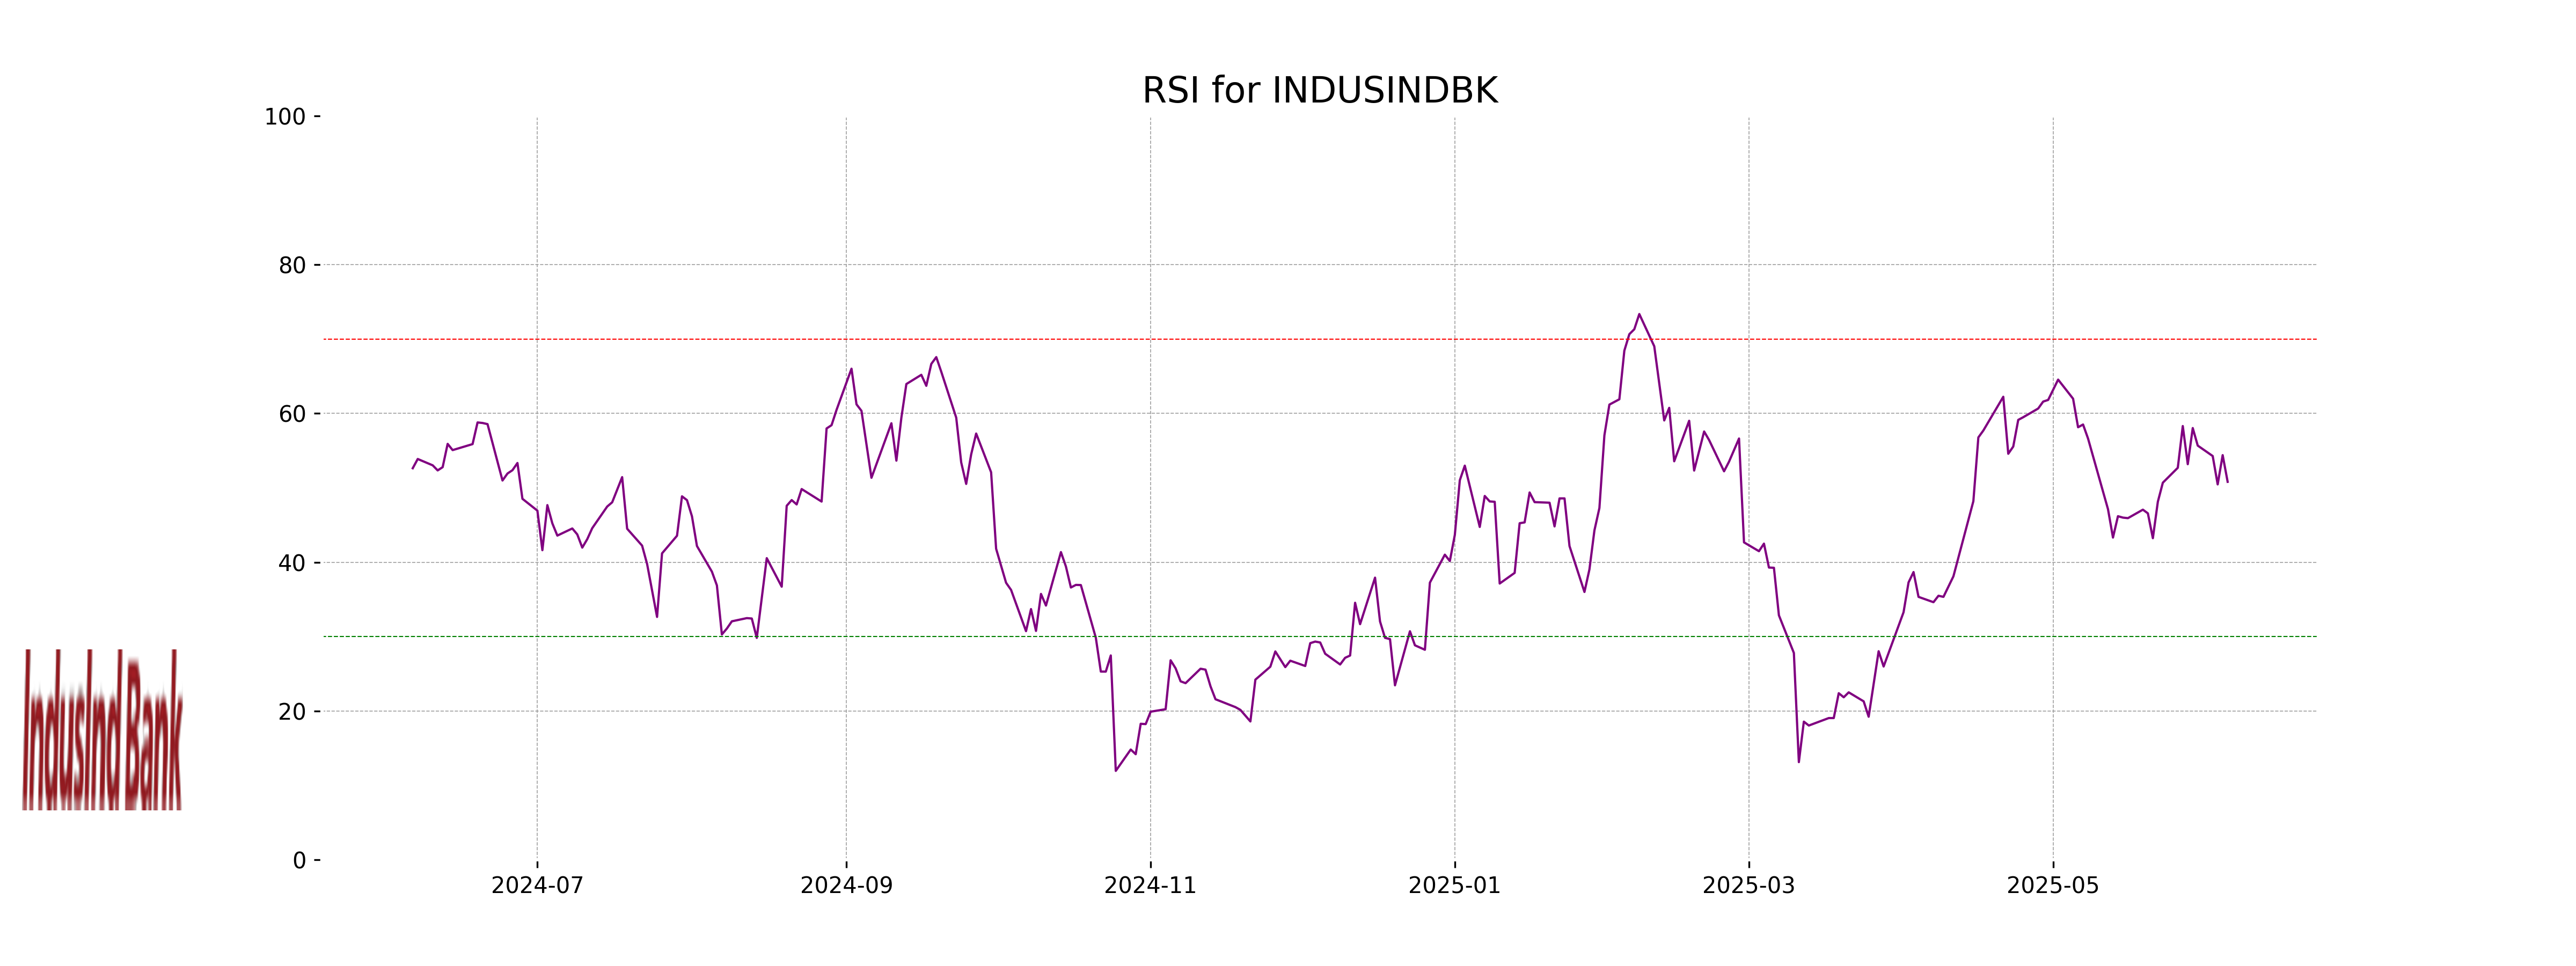
Analysis for IndusInd Bank - June 05, 2025
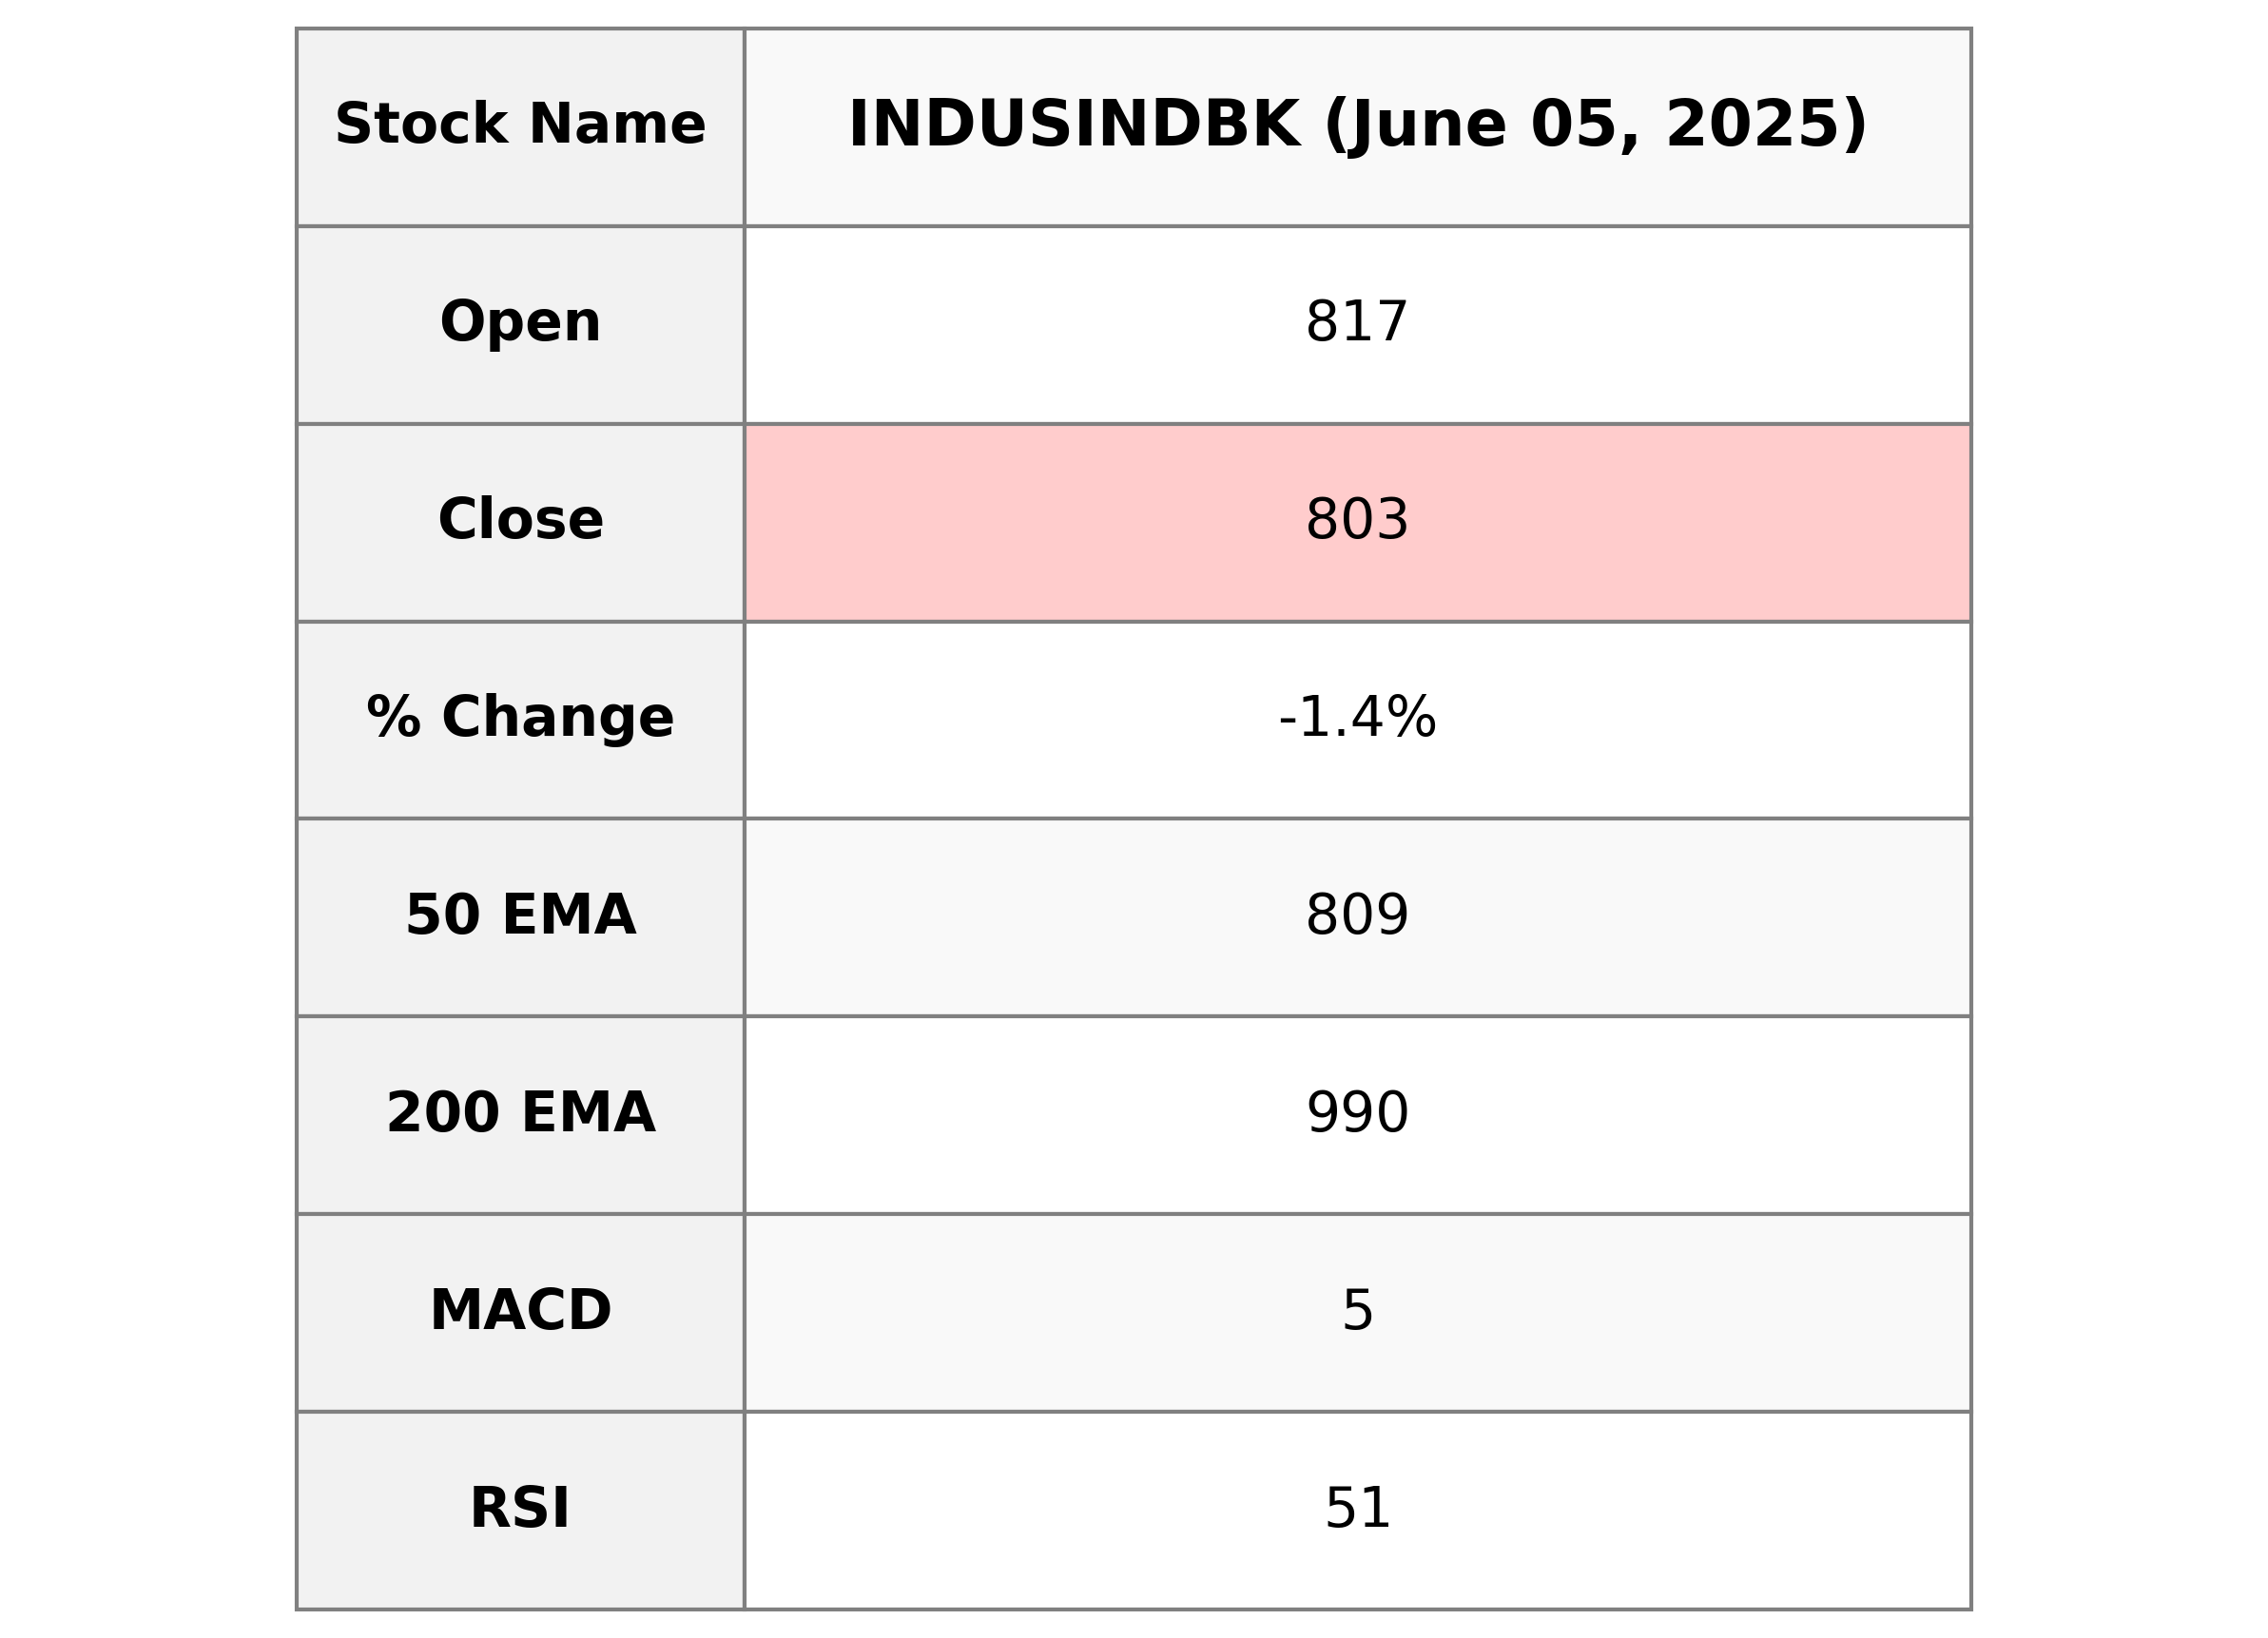
IndusInd Bank Performance Overview: IndusInd Bank, operating in the Financial Services sector within India's Banks - Regional industry, experienced a slight decline with its stock closing at 803.2, down by 1.37% from the previous close. The bank's market capitalization stands at ₹625.74 billion, and it holds a P/E ratio of 24.30. Despite the dip, technical indicators such as RSI at 50.81 suggest neutral momentum, with its MACD slightly above the signal line indicating possible bullishness on the horizon.
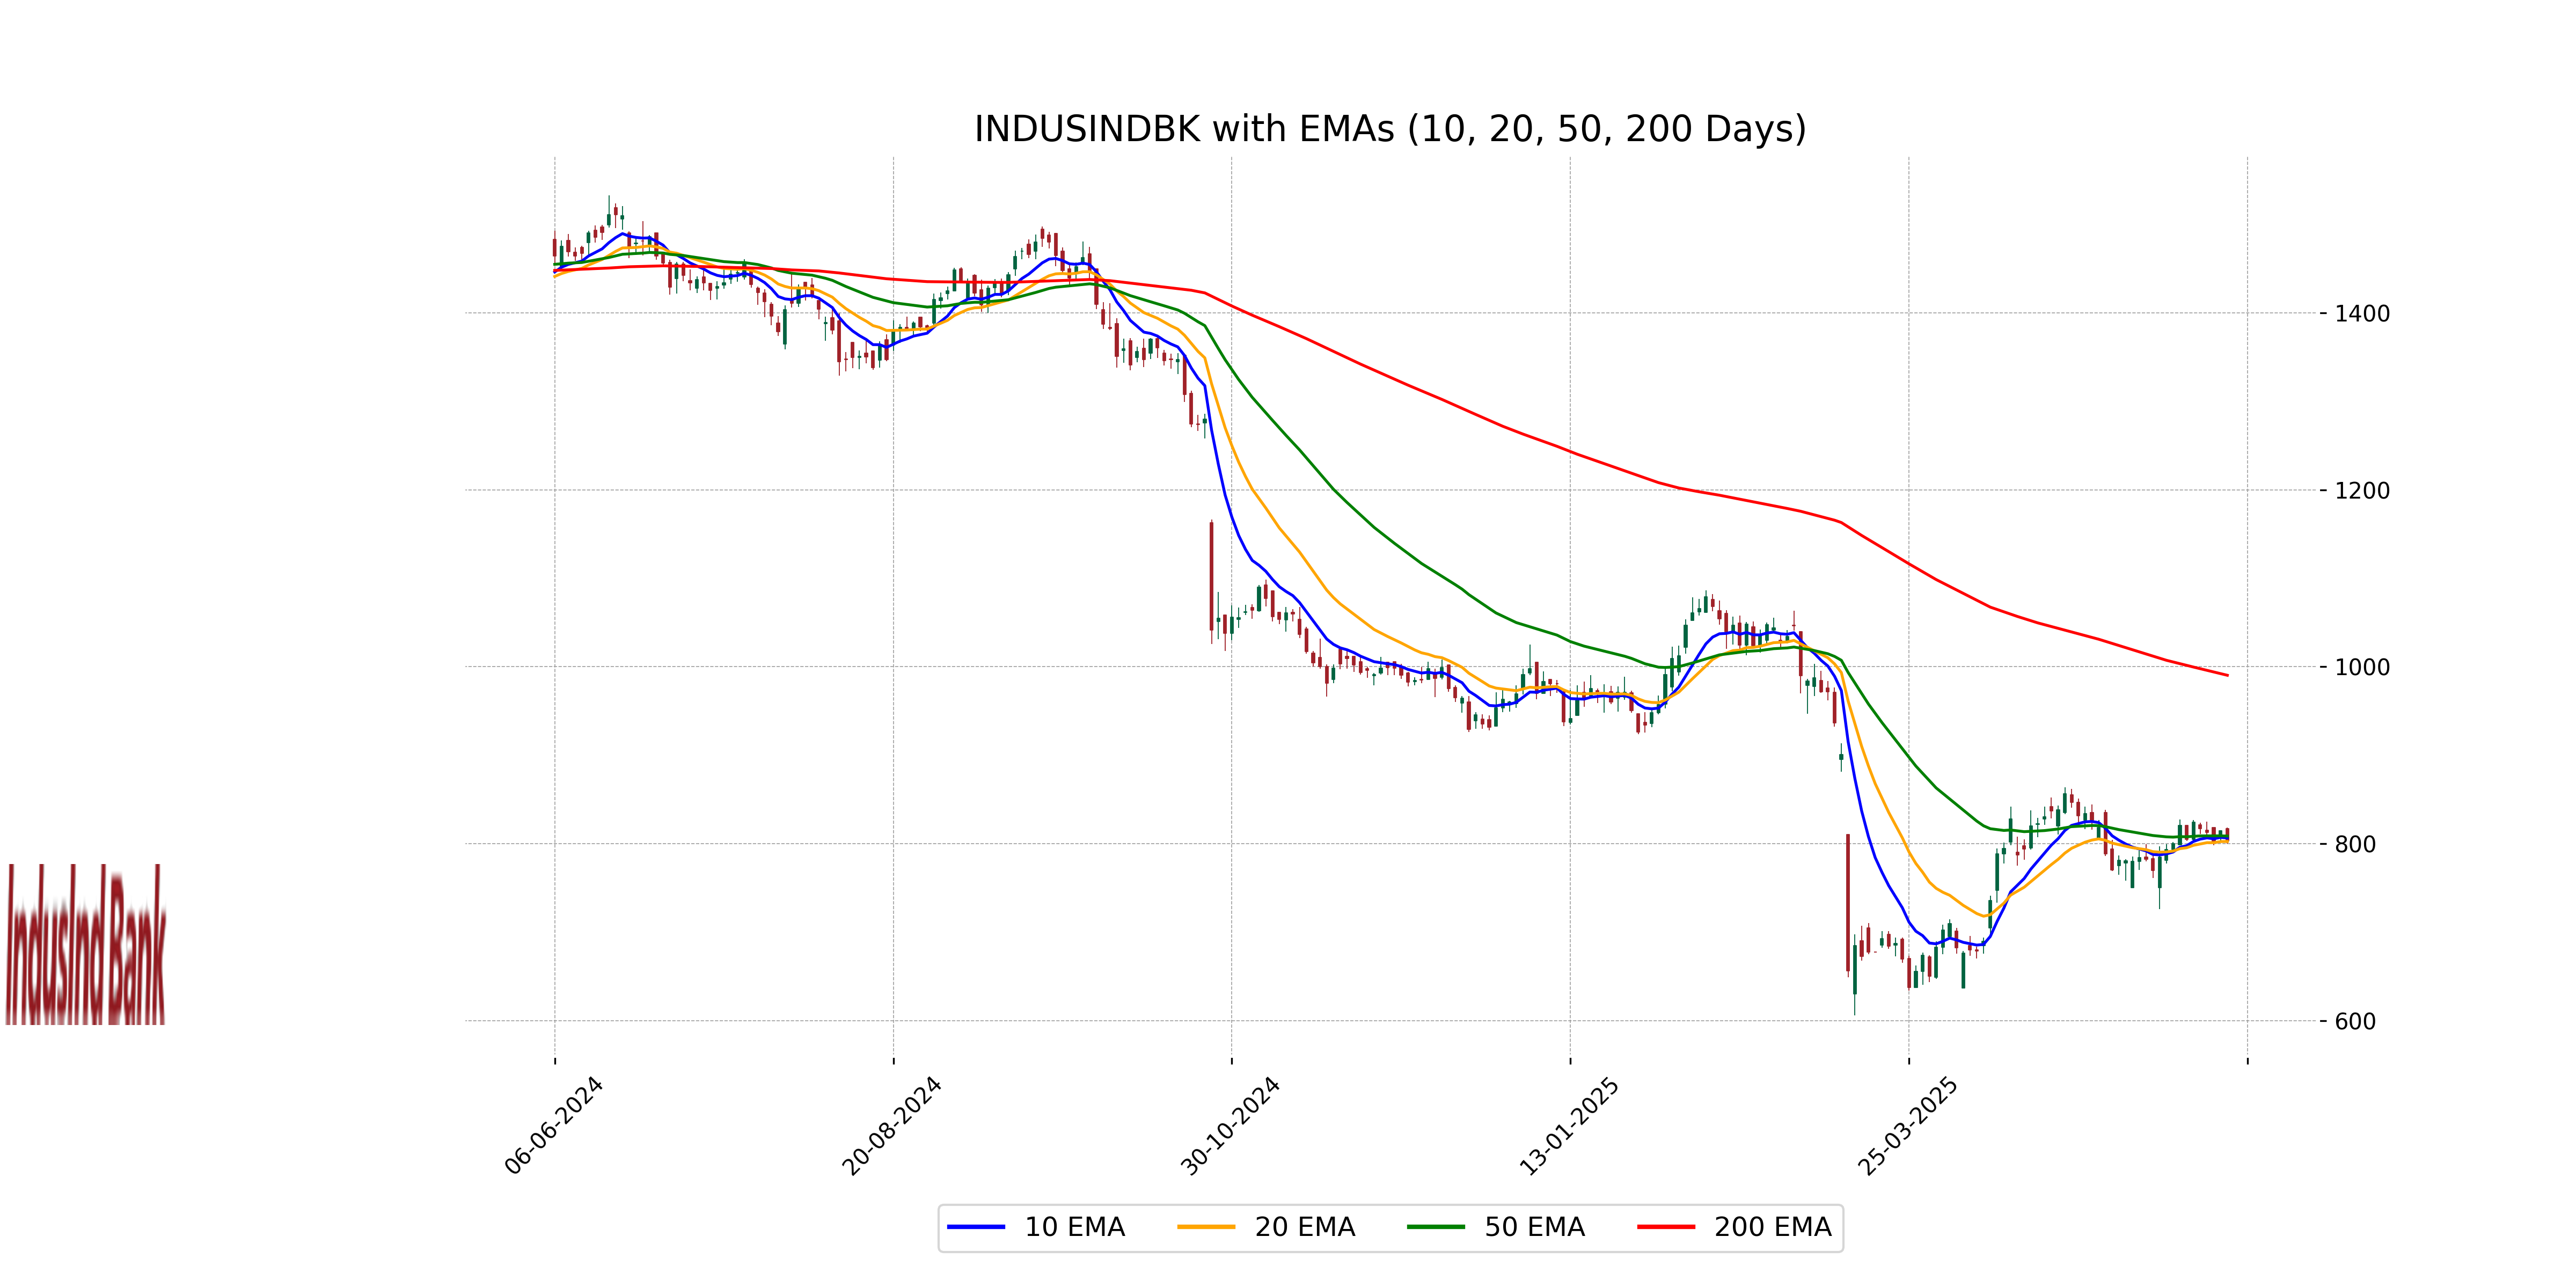
Relationship with Key Moving Averages
IndusInd Bank's stock currently trades below its 50-day EMA of 808.61, indicating a potential downtrend. The price is also significantly below the 200-day EMA of 990.42, which may suggest longer-term weakness in the stock. However, it is very close to the 10-day EMA of 806.38, reflecting short-term market alignment.
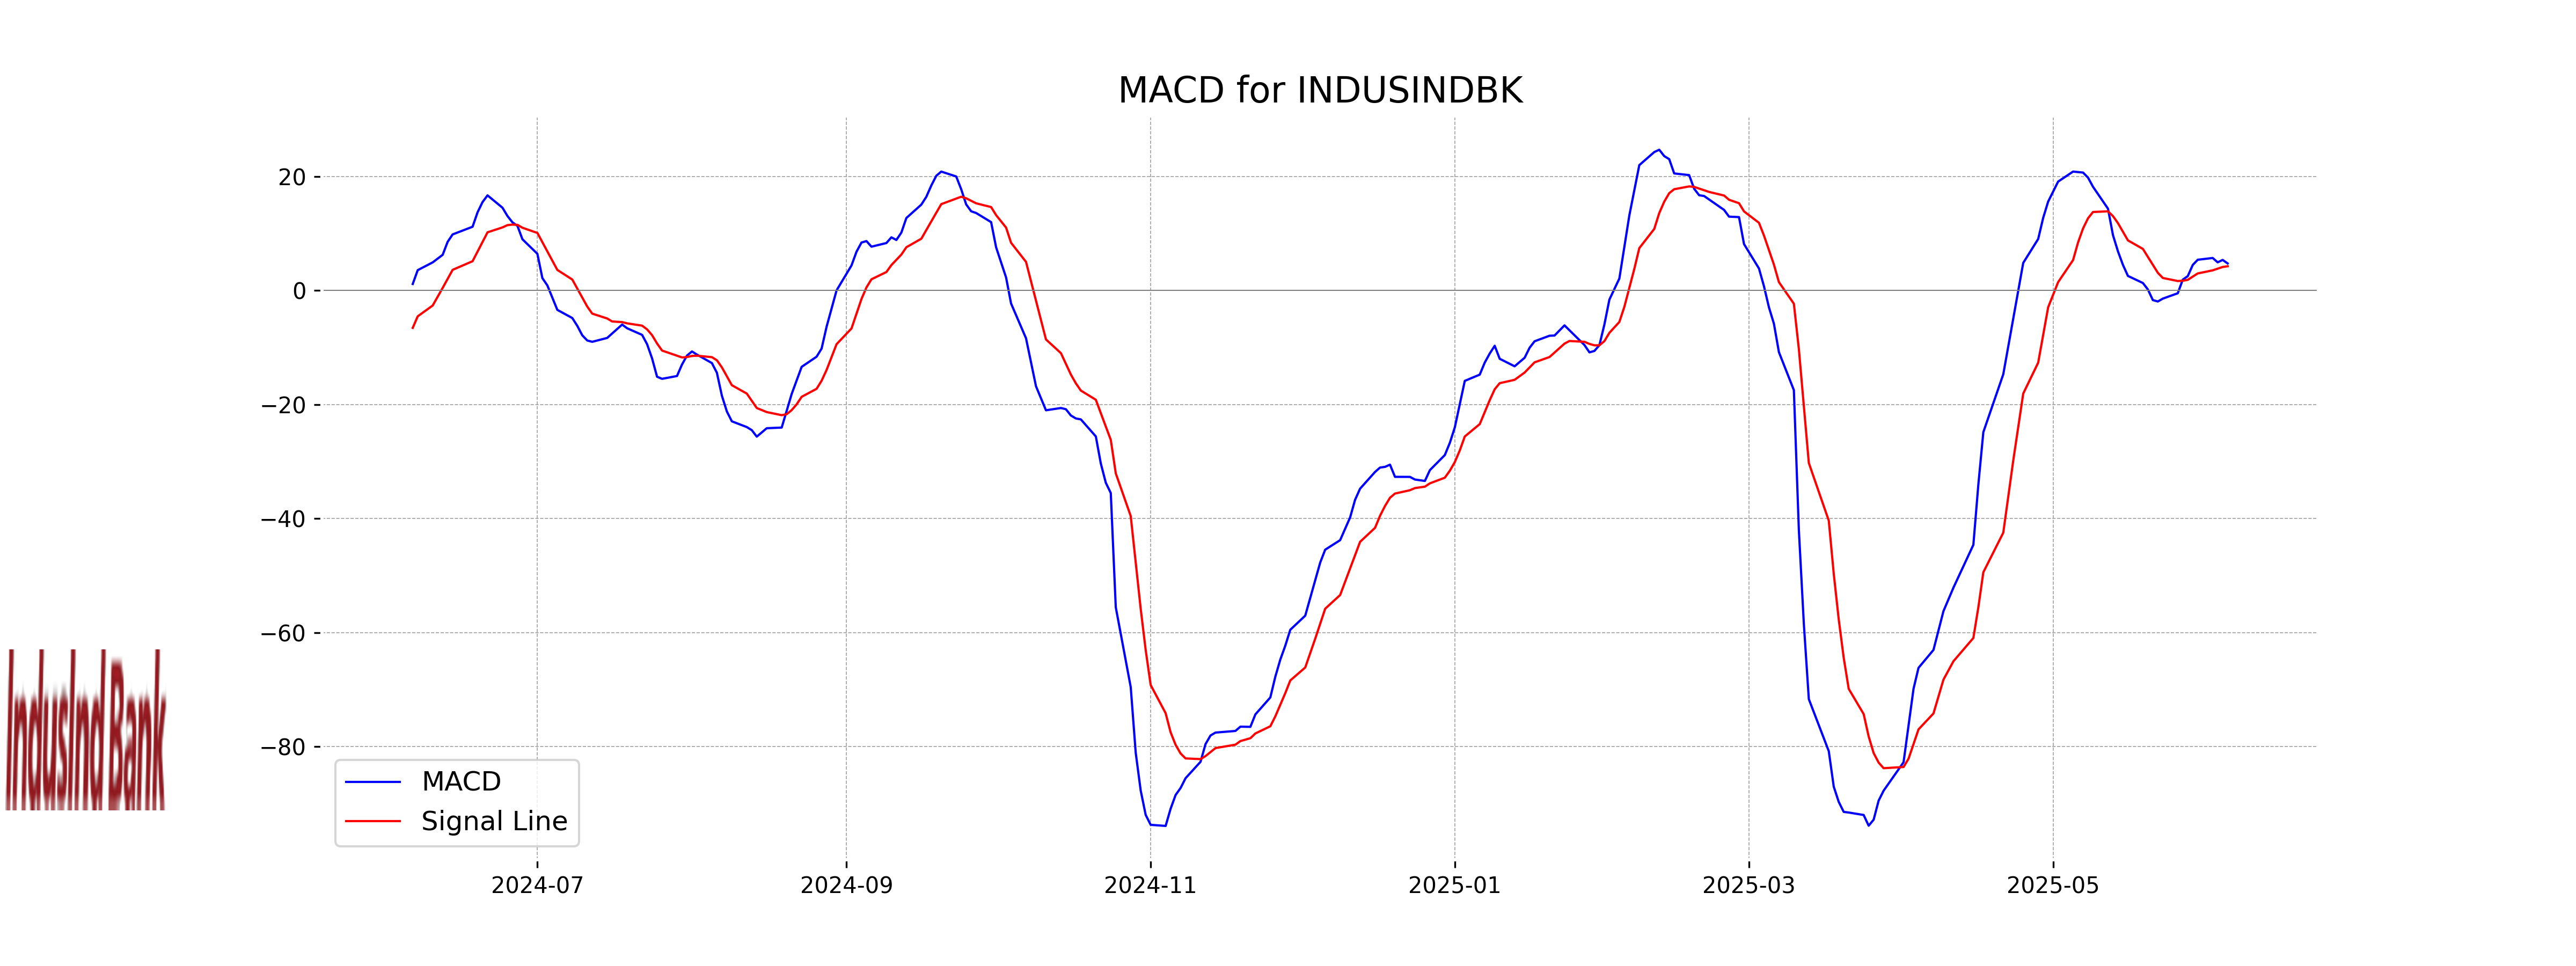
Moving Averages Trend (MACD)
The MACD value for IndusInd Bank is 4.75, which is above its signal line of 4.25. This indicates a bullish signal, suggesting potential upward momentum. However, it's important to consider other technical indicators and market factors before making investment decisions.
RSI Analysis
IndusInd Bank RSI Analysis: The Relative Strength Index (RSI) for IndusInd Bank is at 50.81, which indicates a neutral momentum. This suggests that the stock is neither in the overbought nor oversold territory, implying a balanced position in terms of buyer and seller interest at the current time.
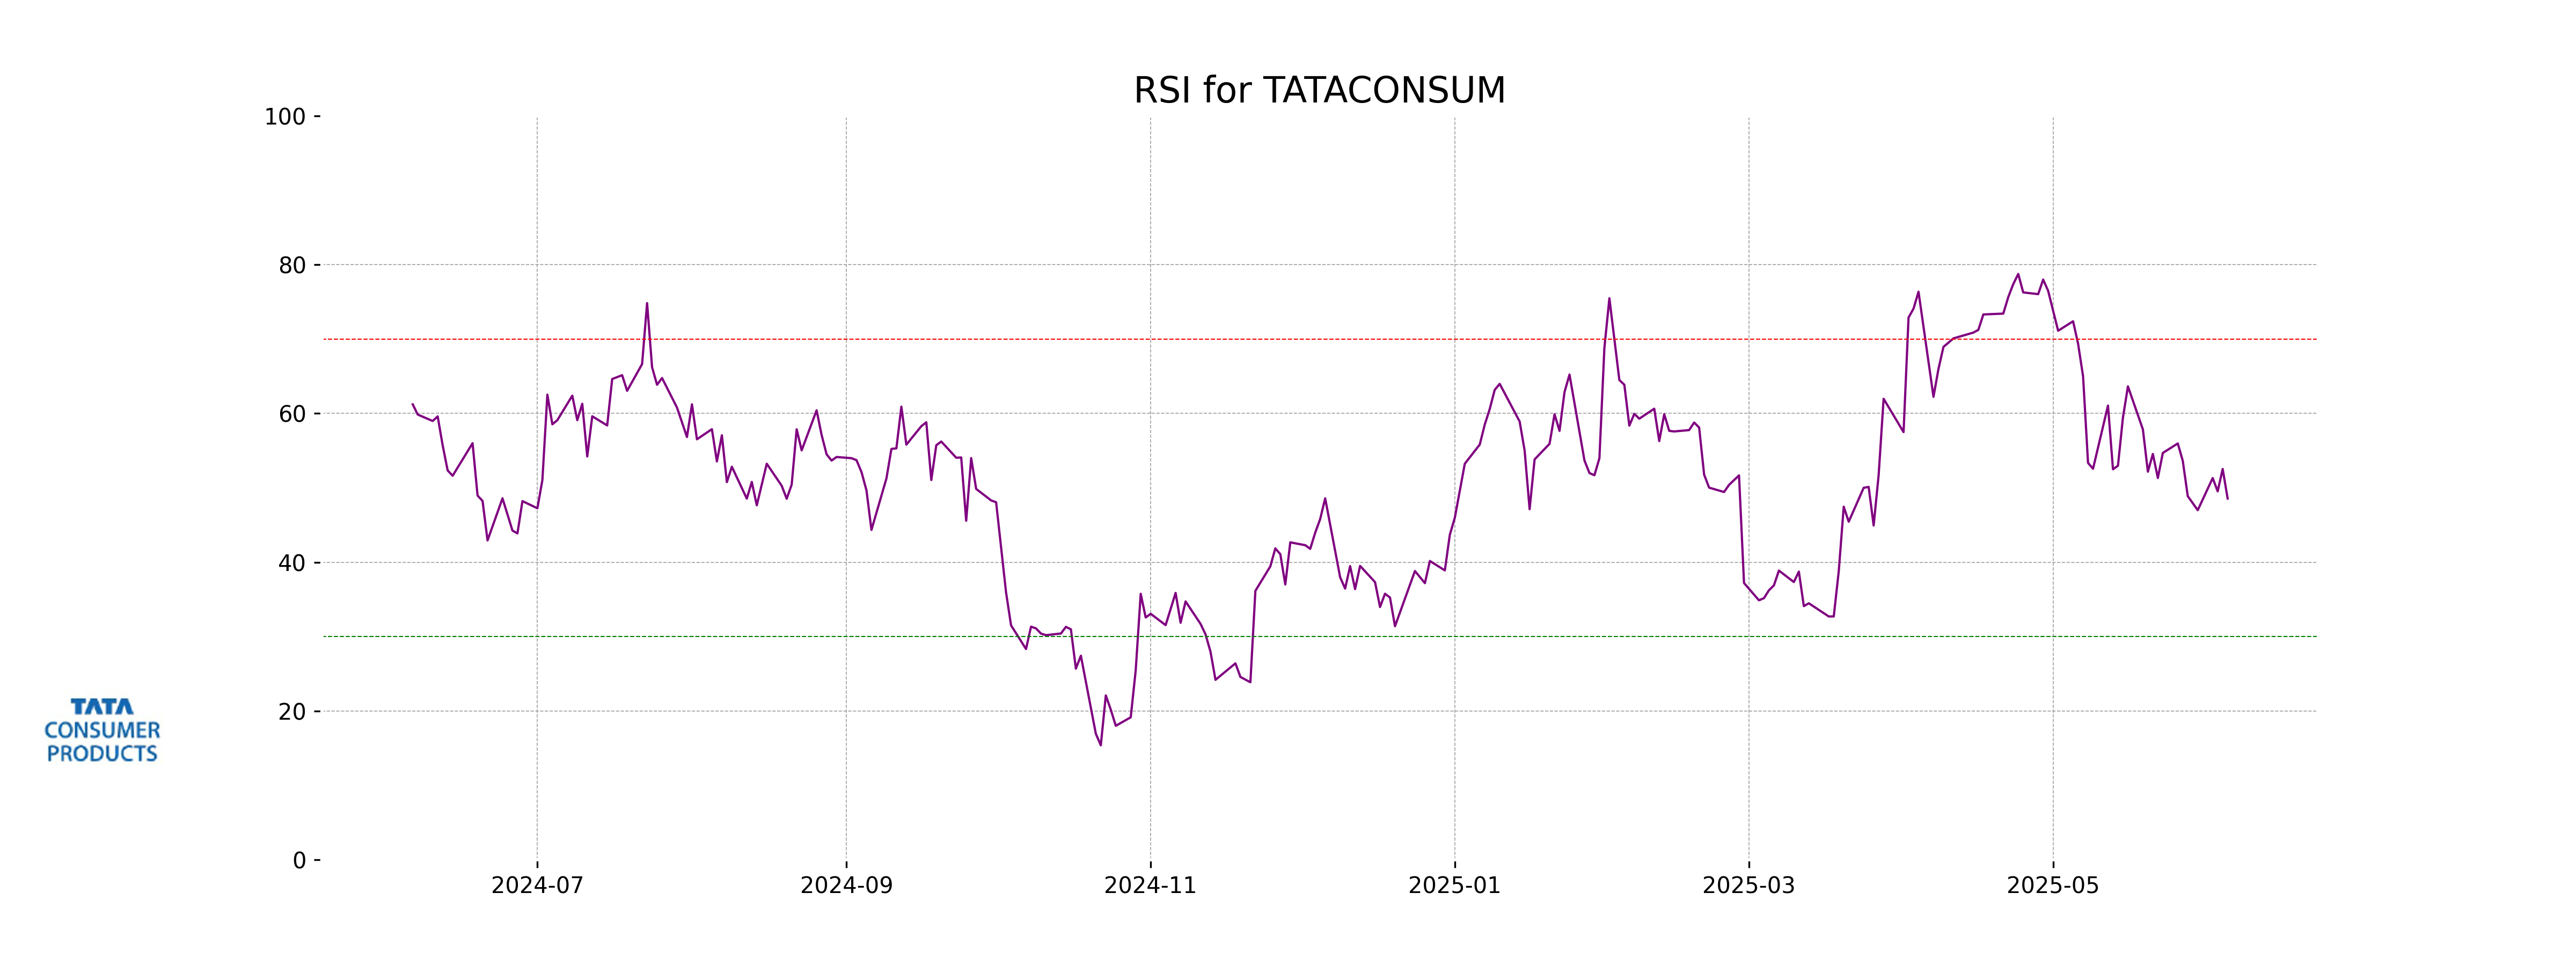
Analysis for Tata Consumer - June 05, 2025
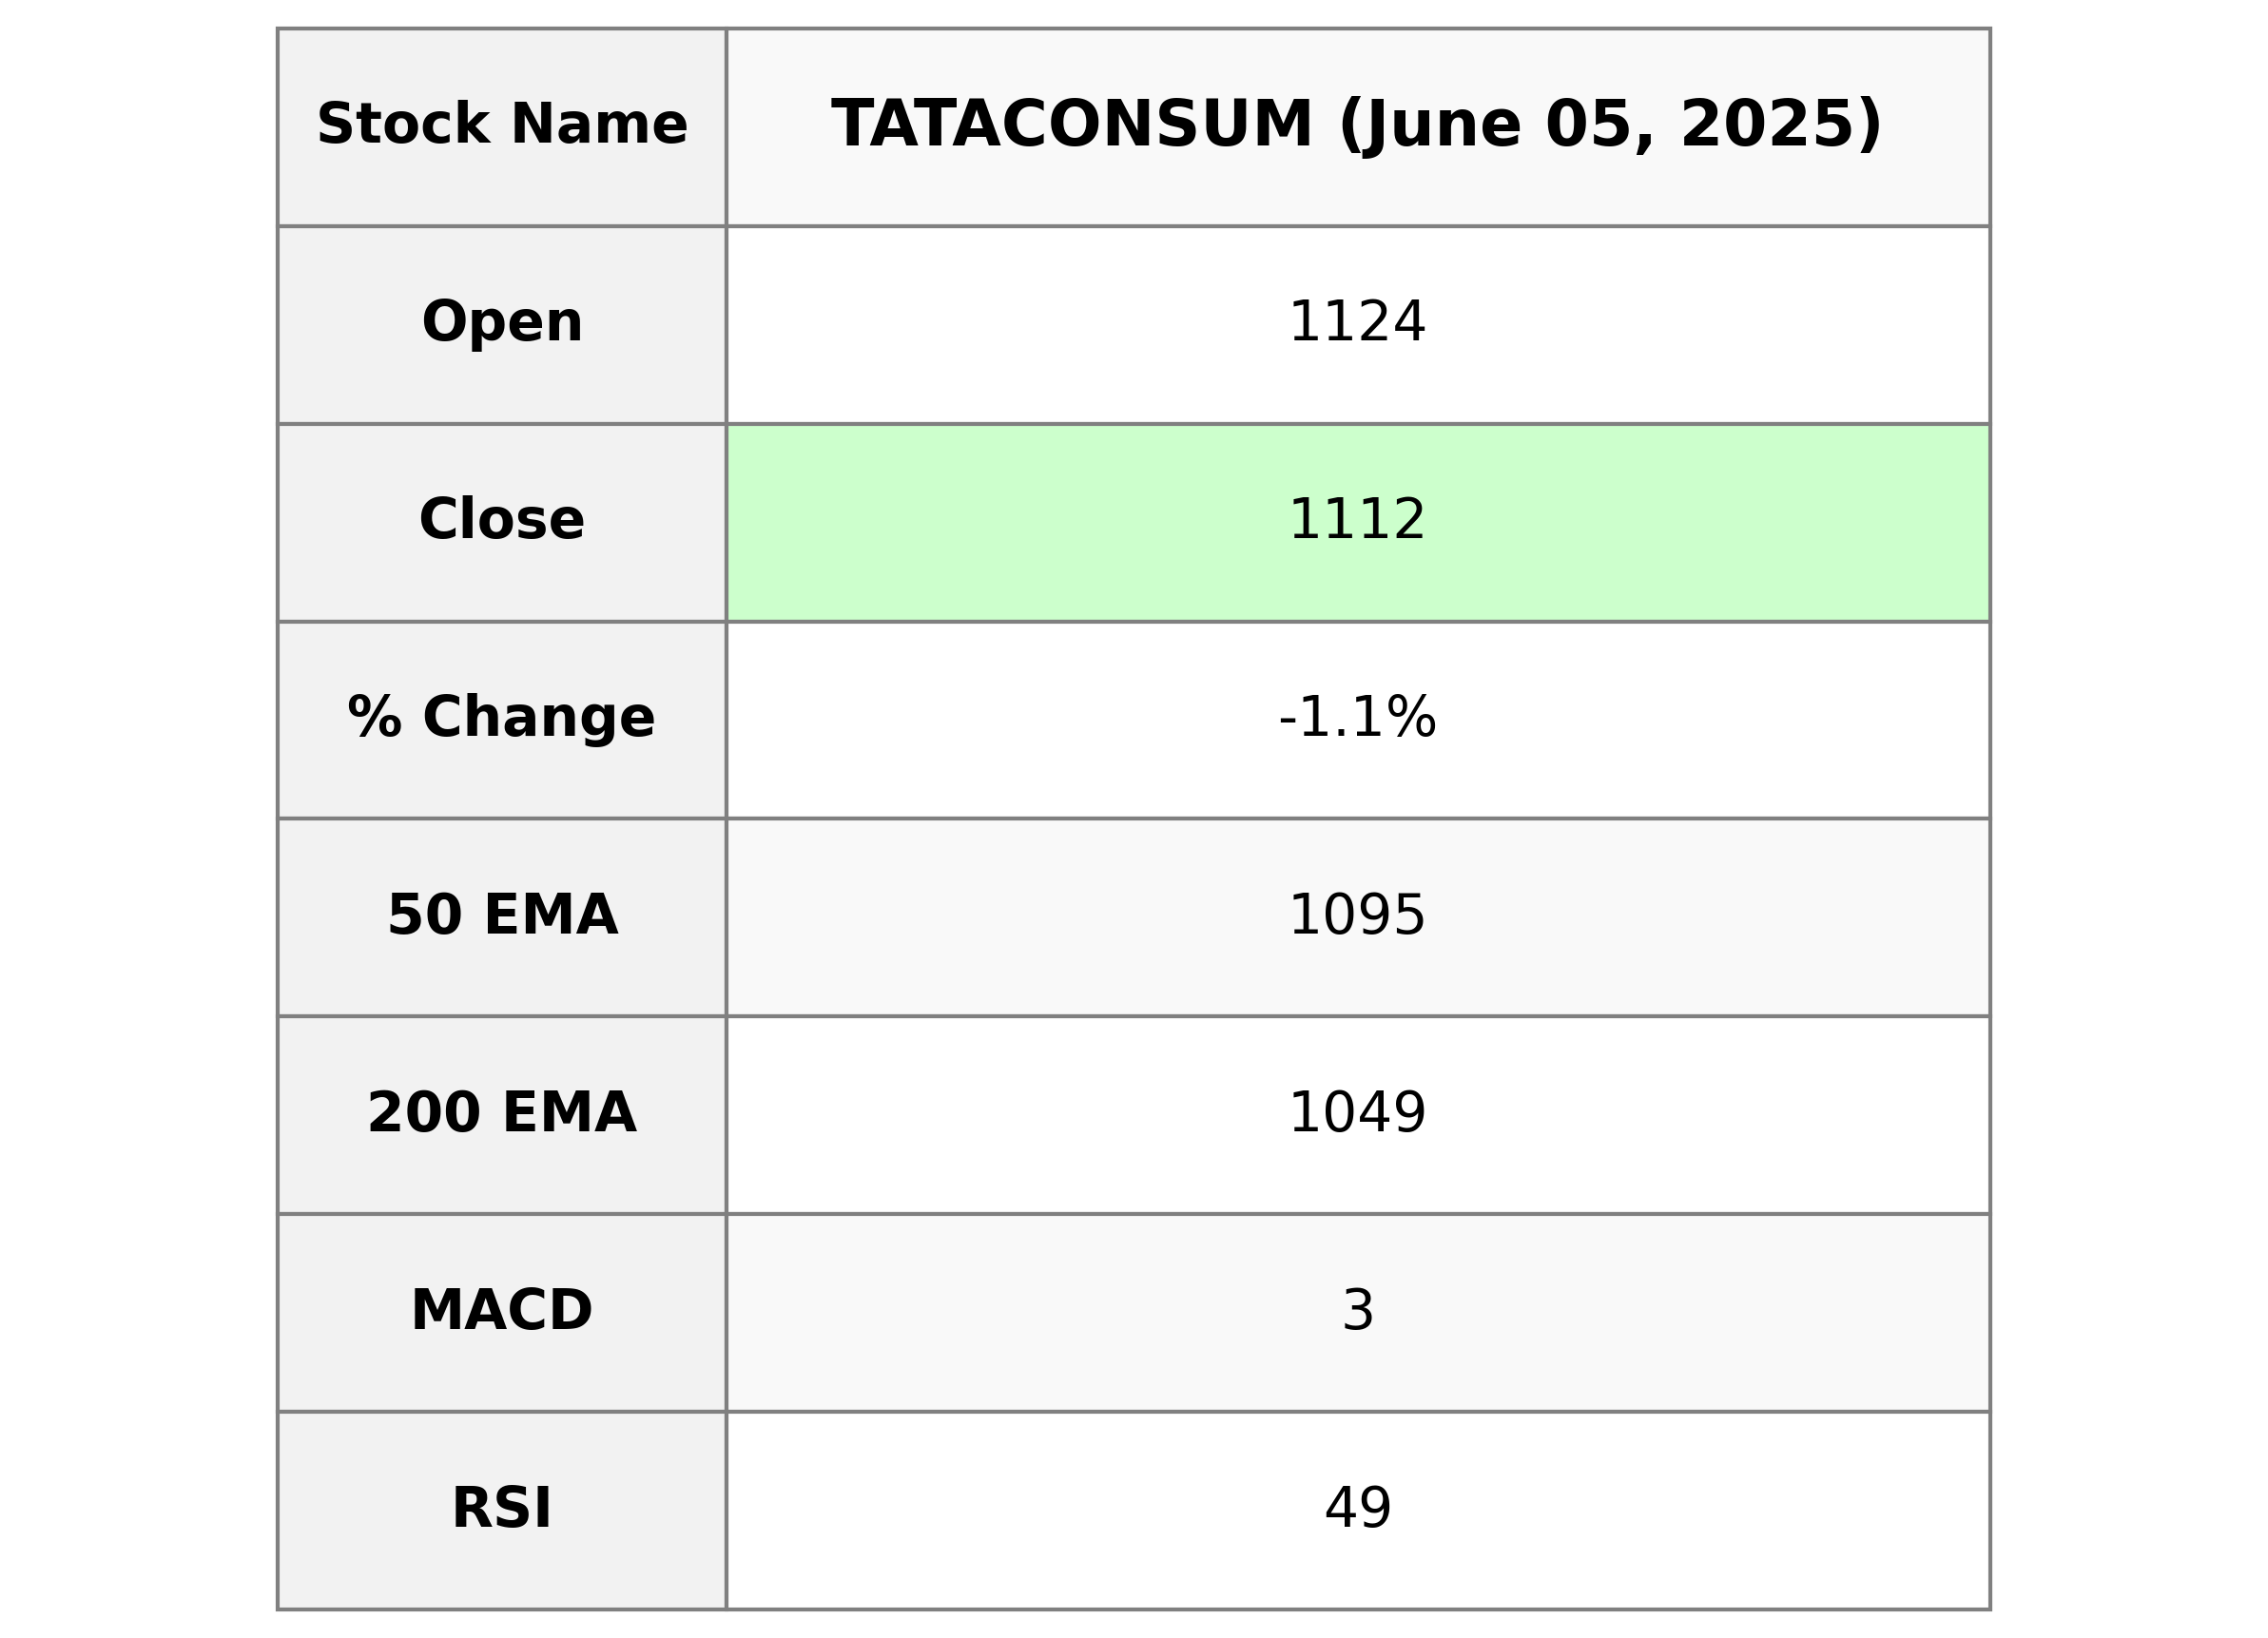
Tata Consumer Products demonstrated a moderate decline in stock performance, closing at ₹1111.90 compared to a previous close of ₹1124.40, reflecting a percentage change of -1.11%. The company's MACD and RSI indicators suggest cautious momentum, with a slight bearish signal. The market cap stands at ₹1.10 trillion, with a P/E ratio of 85.27, indicating high valuation regarding its earnings per share of ₹13.04. Tata Consumer operates in the Consumer Defensive sector, specifically in the Packaged Foods industry within India.
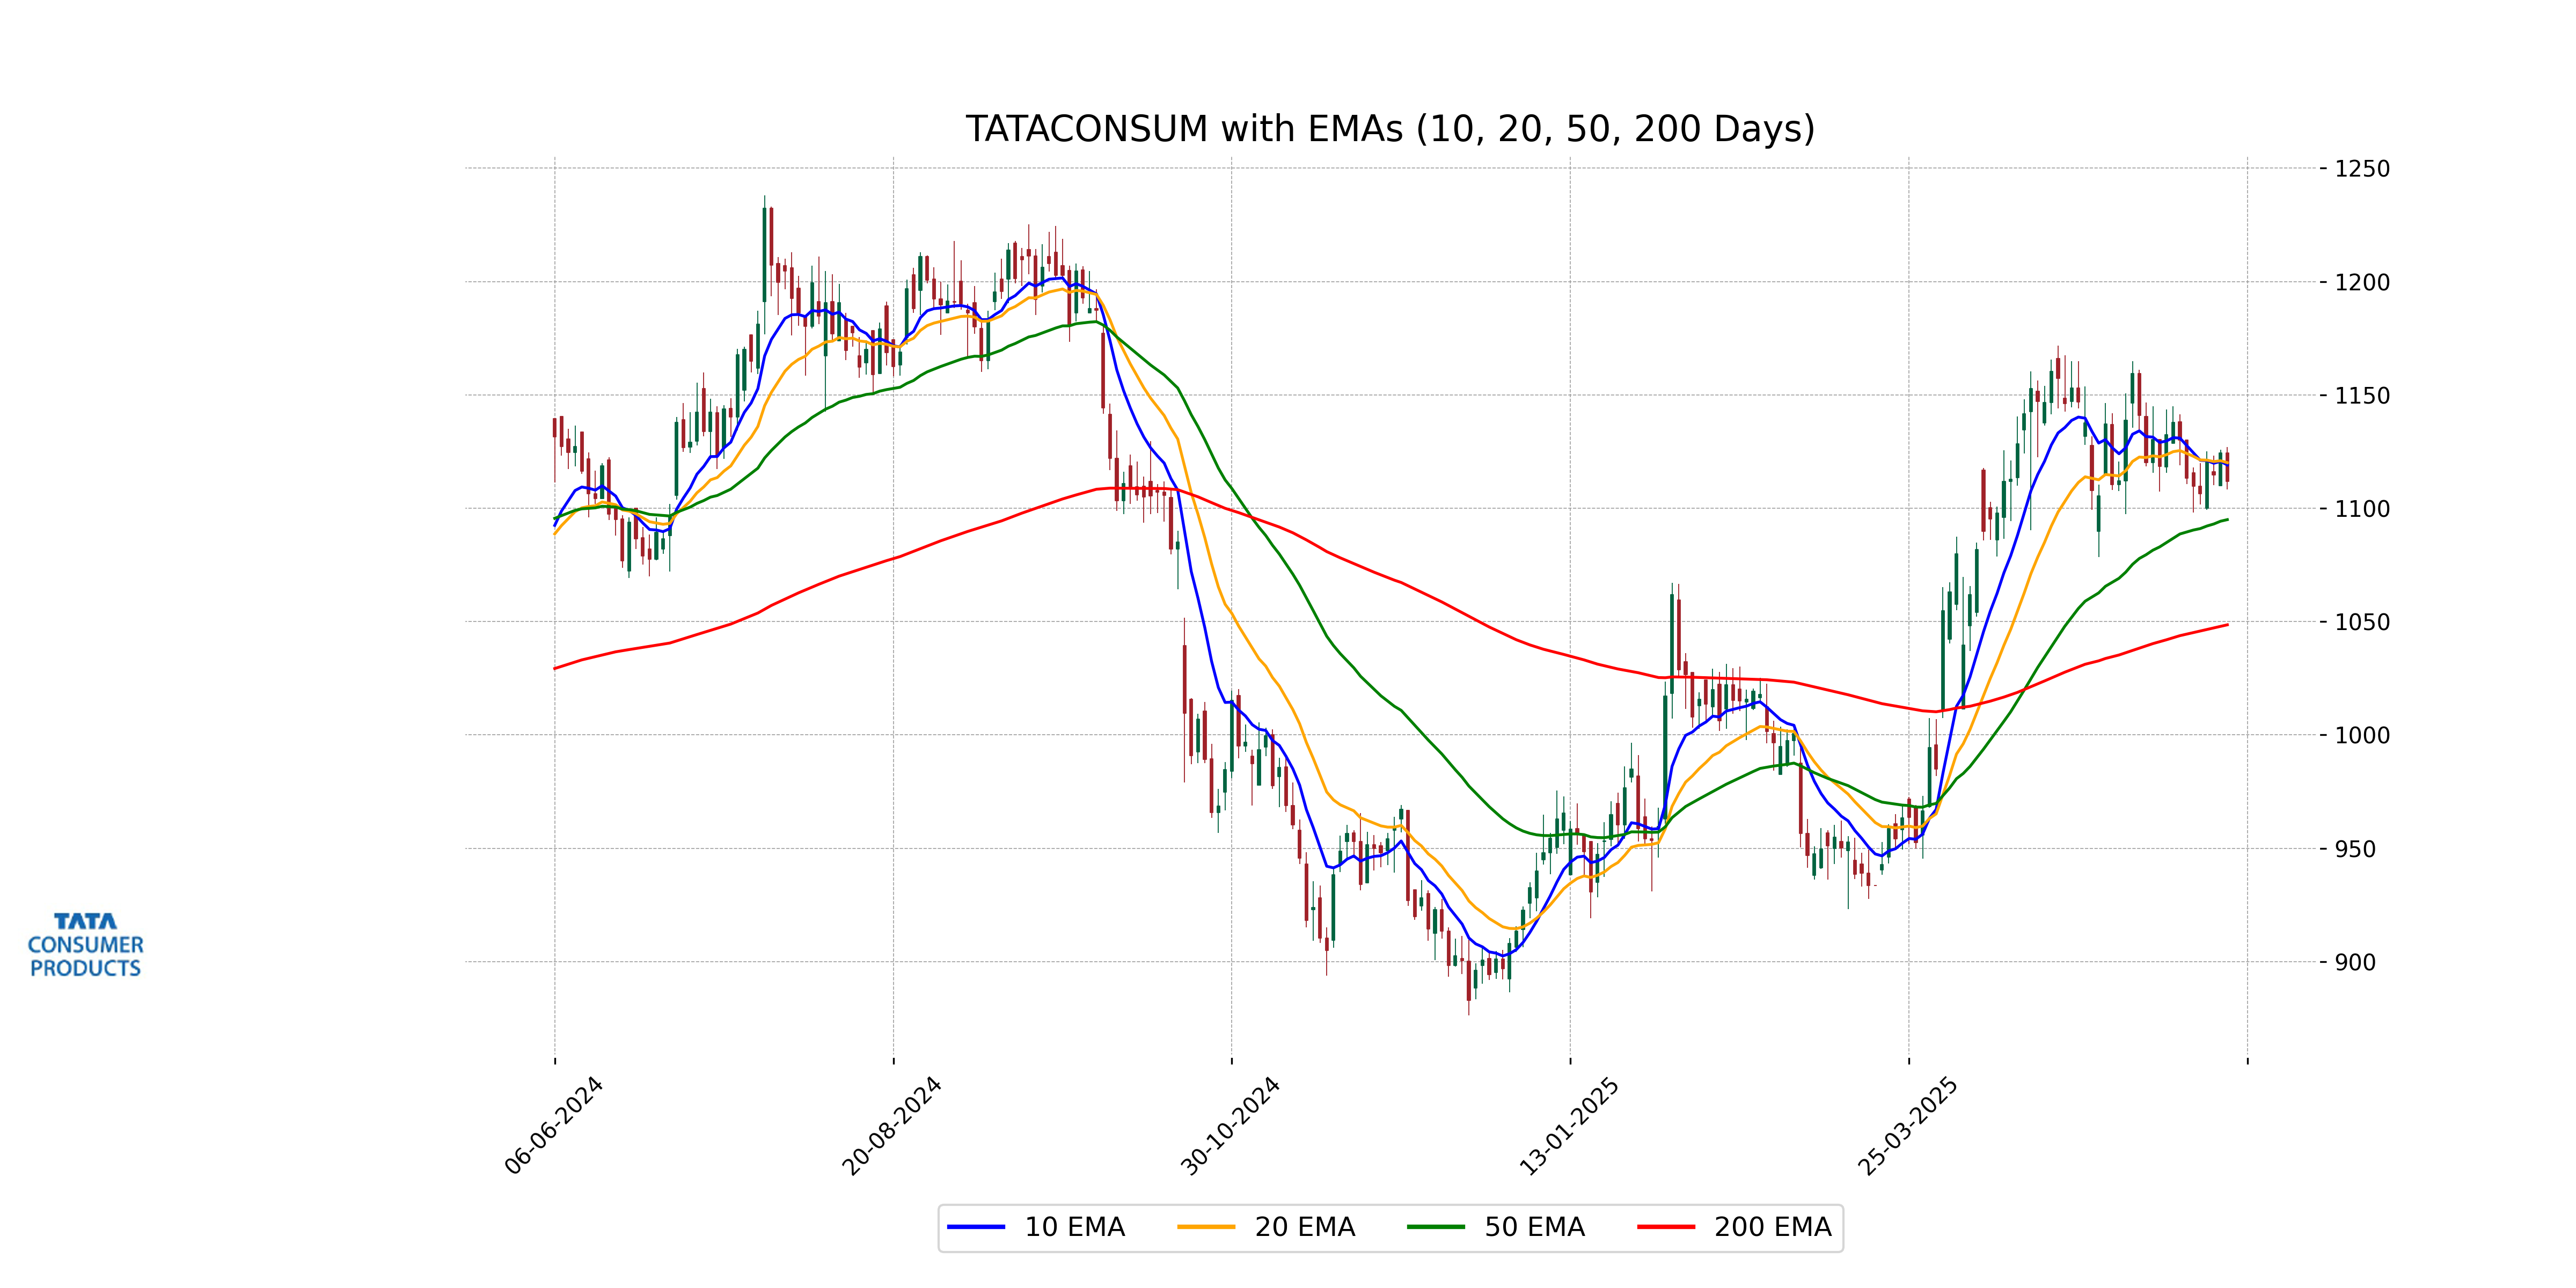
Relationship with Key Moving Averages
The closing price of Tata Consumer is 1111.90, which is slightly below the 10 EMA (1119.08) and the 20 EMA (1120.09), indicating a short-term bearish trend. However, it remains above the 50 EMA (1094.98) and the 200 EMA (1048.59), suggesting a long-term bullish trend despite the recent decline.
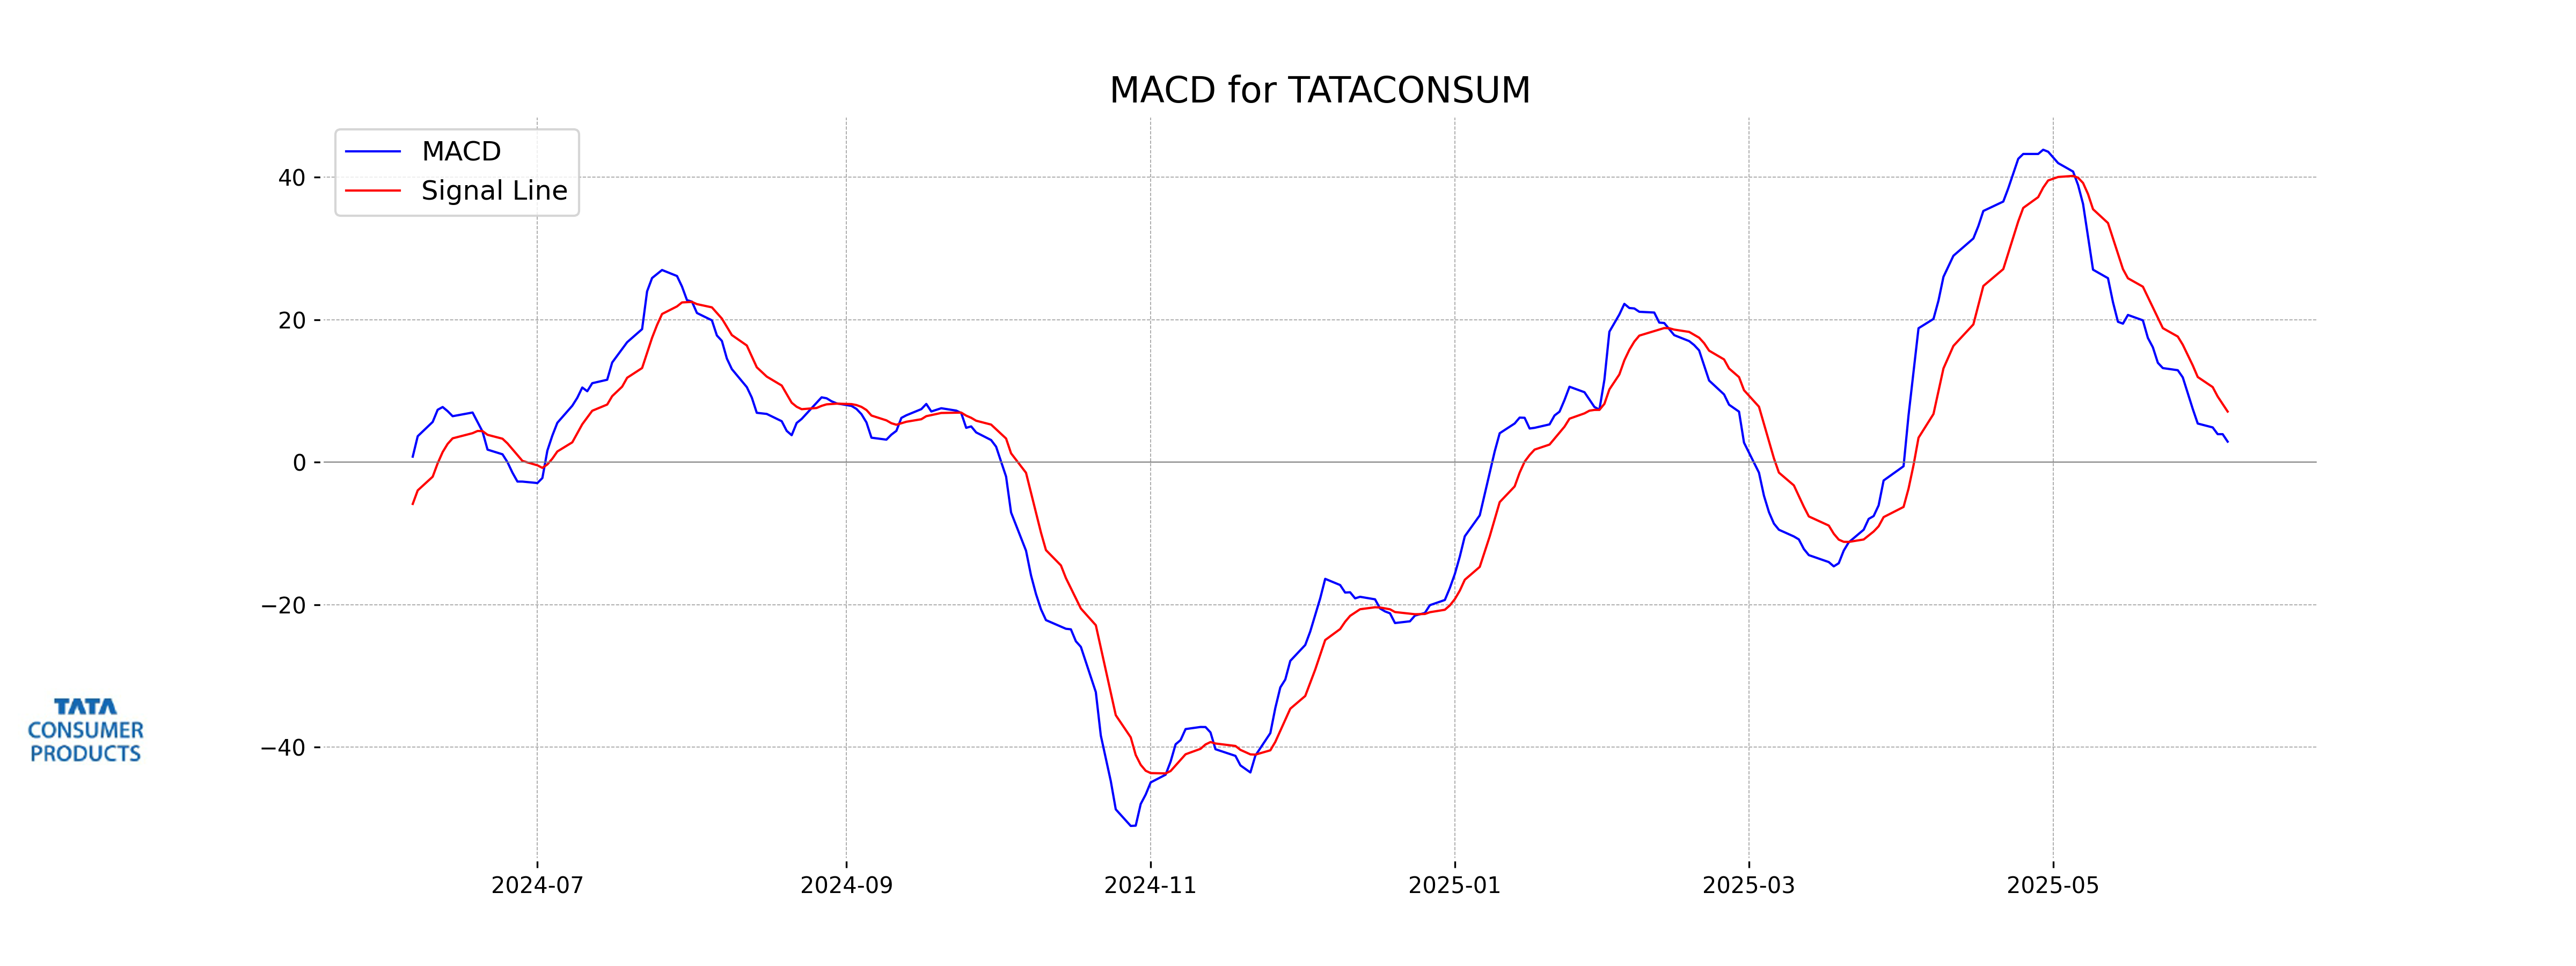
Moving Averages Trend (MACD)
Tata Consumer's MACD value is 2.88, which is below the MACD Signal line of 7.10. This indicates a bearish momentum in the stock's near-term price movement. Generally, when the MACD is below the Signal line, it suggests that the stock might continue to see downward pressure in the short term.
RSI Analysis
RSI Analysis for Tata Consumer: The Relative Strength Index (RSI) for Tata Consumer is 48.56, which suggests that the stock is currently in the neutral zone. This indicates that neither an overbought nor oversold condition is dominating the stock's momentum, and the price movement is relatively stable.
Up Next
NSE Nifty 50: Top 5 stock losers of June 05, 2025

Step-by-step guide to apply for a mortgage loan online with minimal documentation

Honda Activa 6G: Everything You Need to Know Before Buying

How much does a ULIP plan really cost? A break-down of all charges

Centre plans to borrow Rs 8.20 lakh cr from market in first half of FY27

Reliance denies buying Iranian oil amid US sanctions waiver

More videos

Premium petrol price up Rs 2, industrial diesel up Rs 22; no change in normal petrol, diesel rates

India's GDP expected to register over 8 pc growth in Sep-Dec: Report

Govt announces seven measures to help boost exports

RBI keeps interest rates on hold after US trade deal boosts outlook

RBI proposes to compensate customers up to Rs 25,000 loss due to fraud

RBI raises GDP growth projection of Q1, Q2 of FY27

RBI pauses rate cuts, retains interest rate at 5.25 pc

Rupee jumps 122 paise to close at 90.27 against US dollar on India-US trade deal

Stock markets cheer India-US trade deal: Sensex, Nifty surge 2.5 pc

UPI transactions hit record high of Rs 230 lakh crore in 2025-26 till Dec: Govt