


Highlights
Latest news

Oppo Enco Buds3 Pro+ Review: ANC That Actually Works Under ₹2,500

Permission denied for Vijay Hazare trophy match at Chinnaswamy Stadium on December 24

Protesters march to Bangladesh Deputy High Commission in Kolkata to protest violence on Hindus

BJP’s national working president Nitin Nabin leads roadshow in Patna

Bangladesh summons Indian envoy over security concerns for missions

Passenger beaten by off-duty Air India Express pilot suffers nasal fracture, seeks justice

Over 270 flights delayed, 10 cancelled at Delhi airport

Fresh snowfall, rain hit parts of Kashmir as temperatures stay above freezing point
NSE Nifty 50 Top losers: What are the 5 Biggest Stock losers Today February 14, 2025


In this article, we will explore the technical indicators of some of the low-performing stocks on the Indian stock market, including ADANIENT, ADANIPORTS, BEL, SUNPHARMA, and TRENT.
By looking at these stocks through the lens of key technical factors, we aim to better understand their price movements, trends, and potential future performance.

Analysis for Adani Enterprises - February 14, 2025
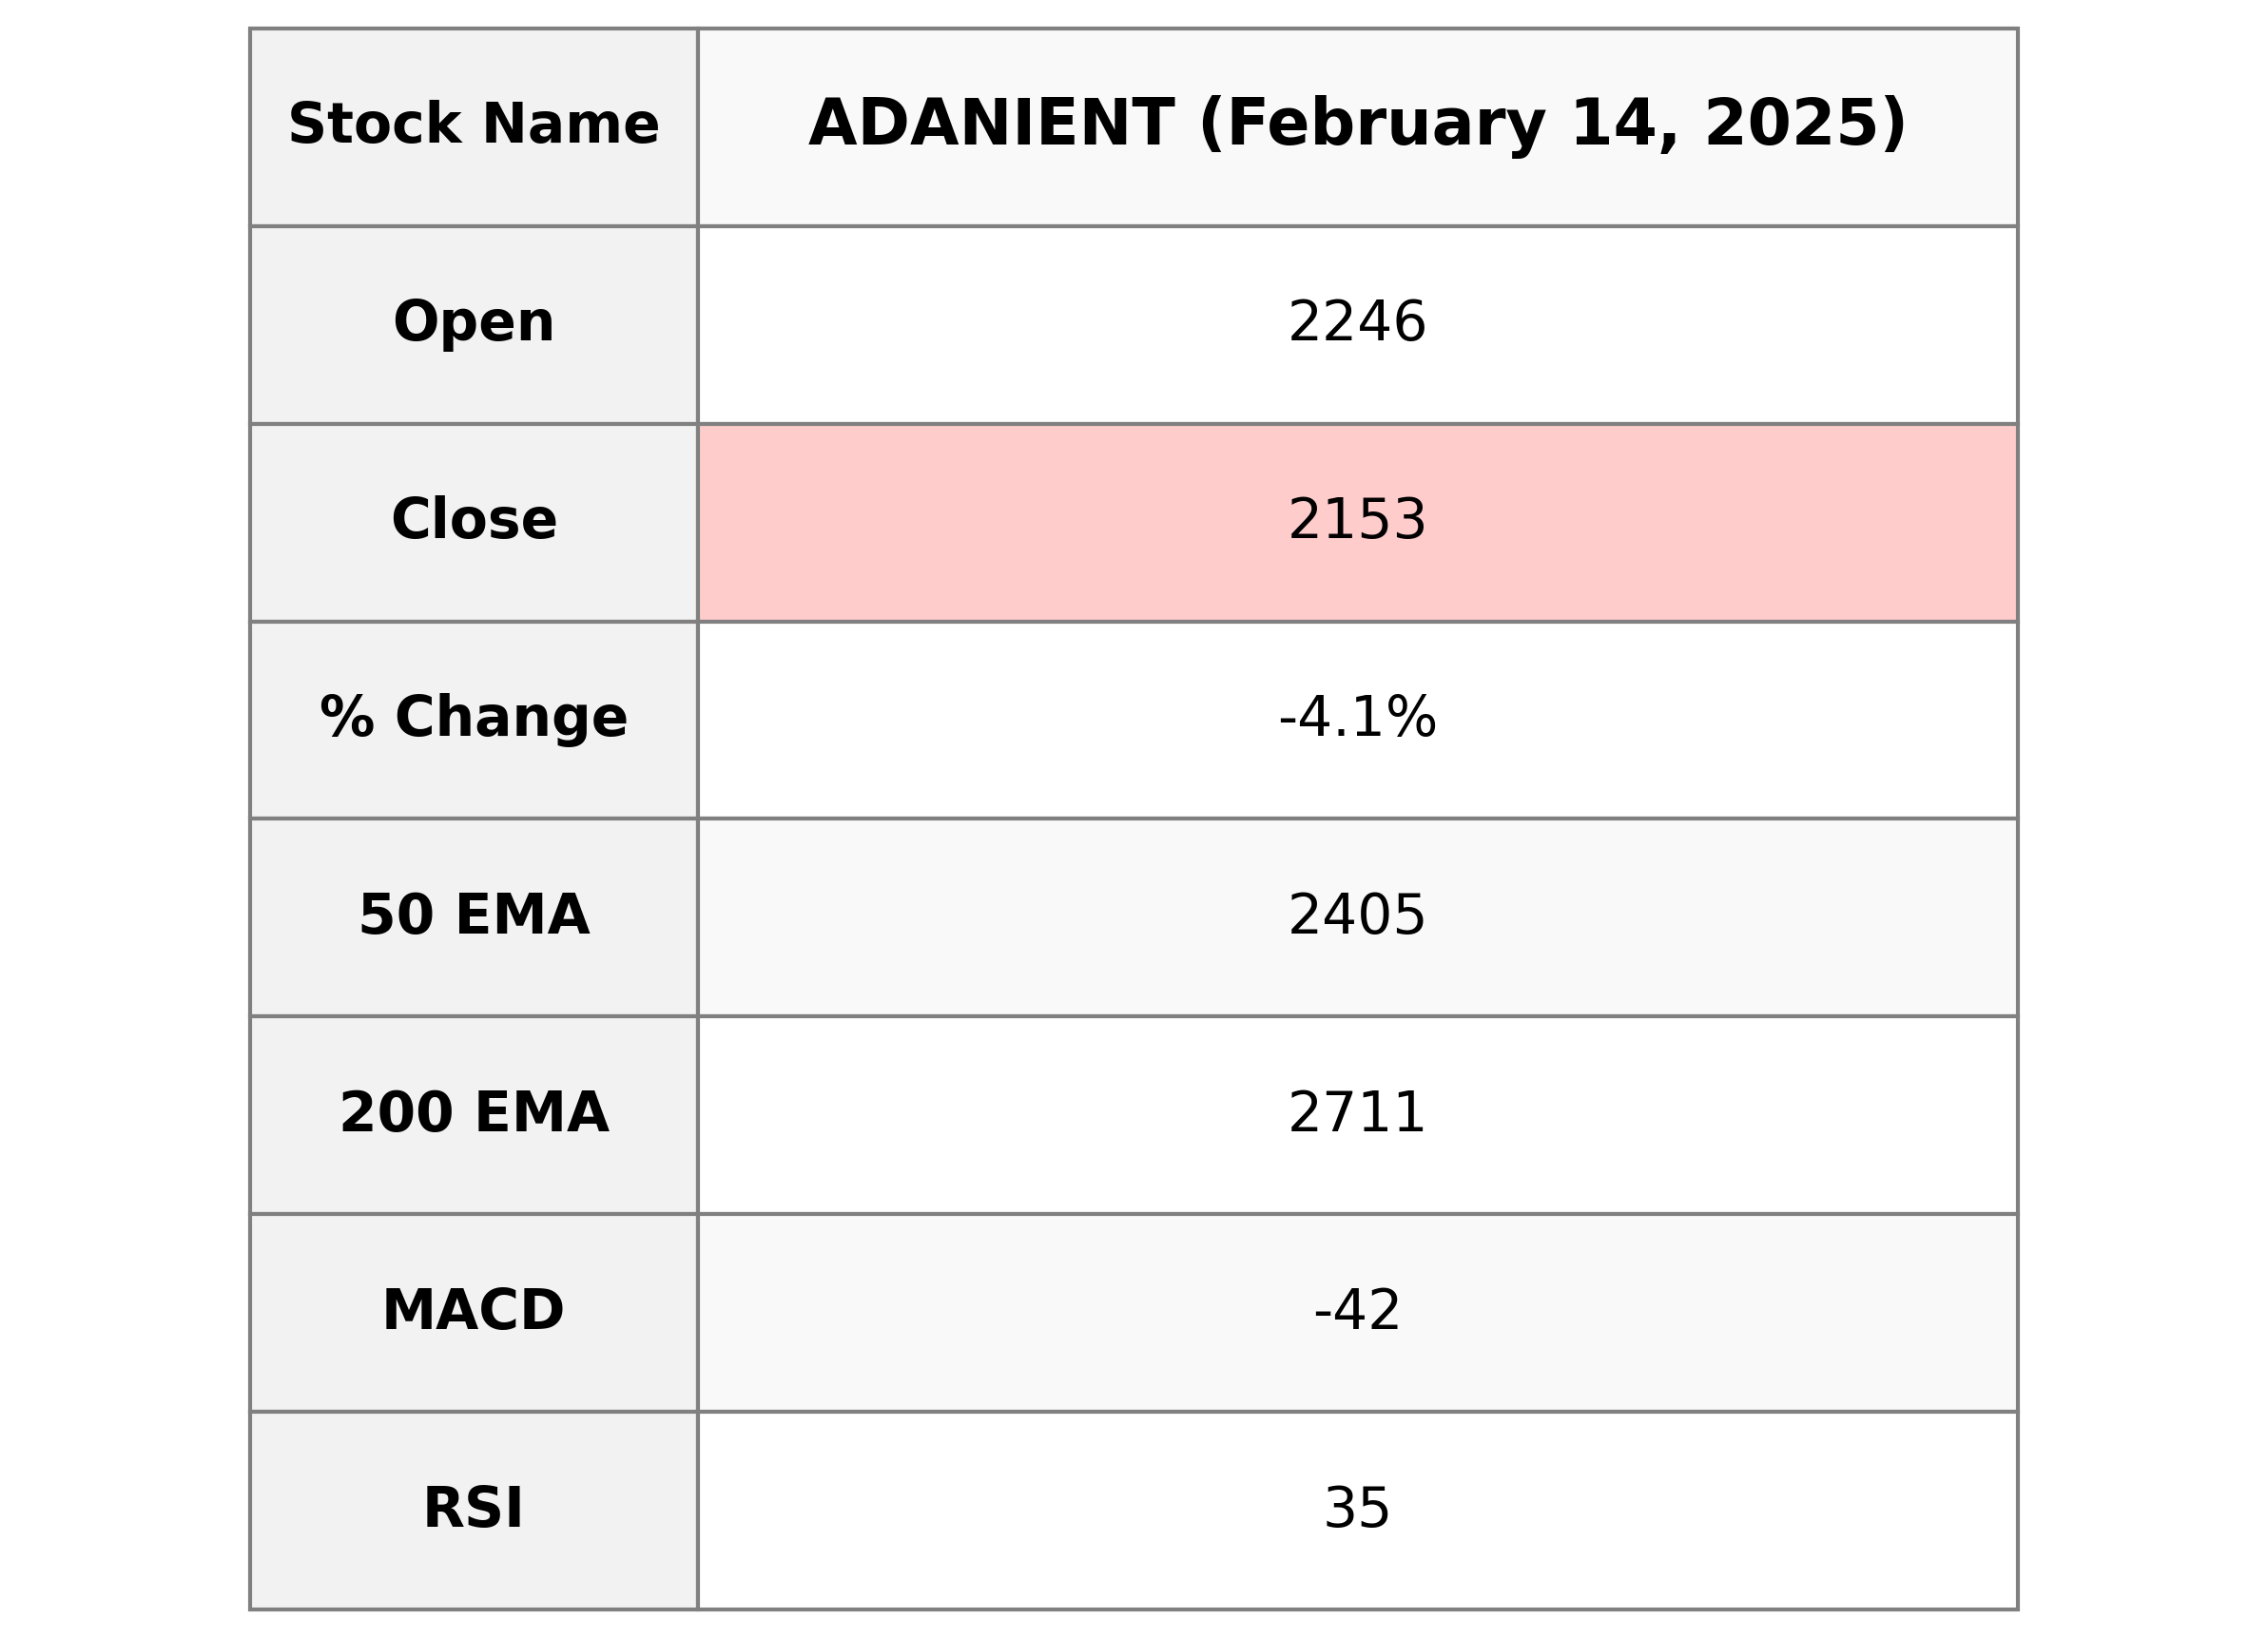
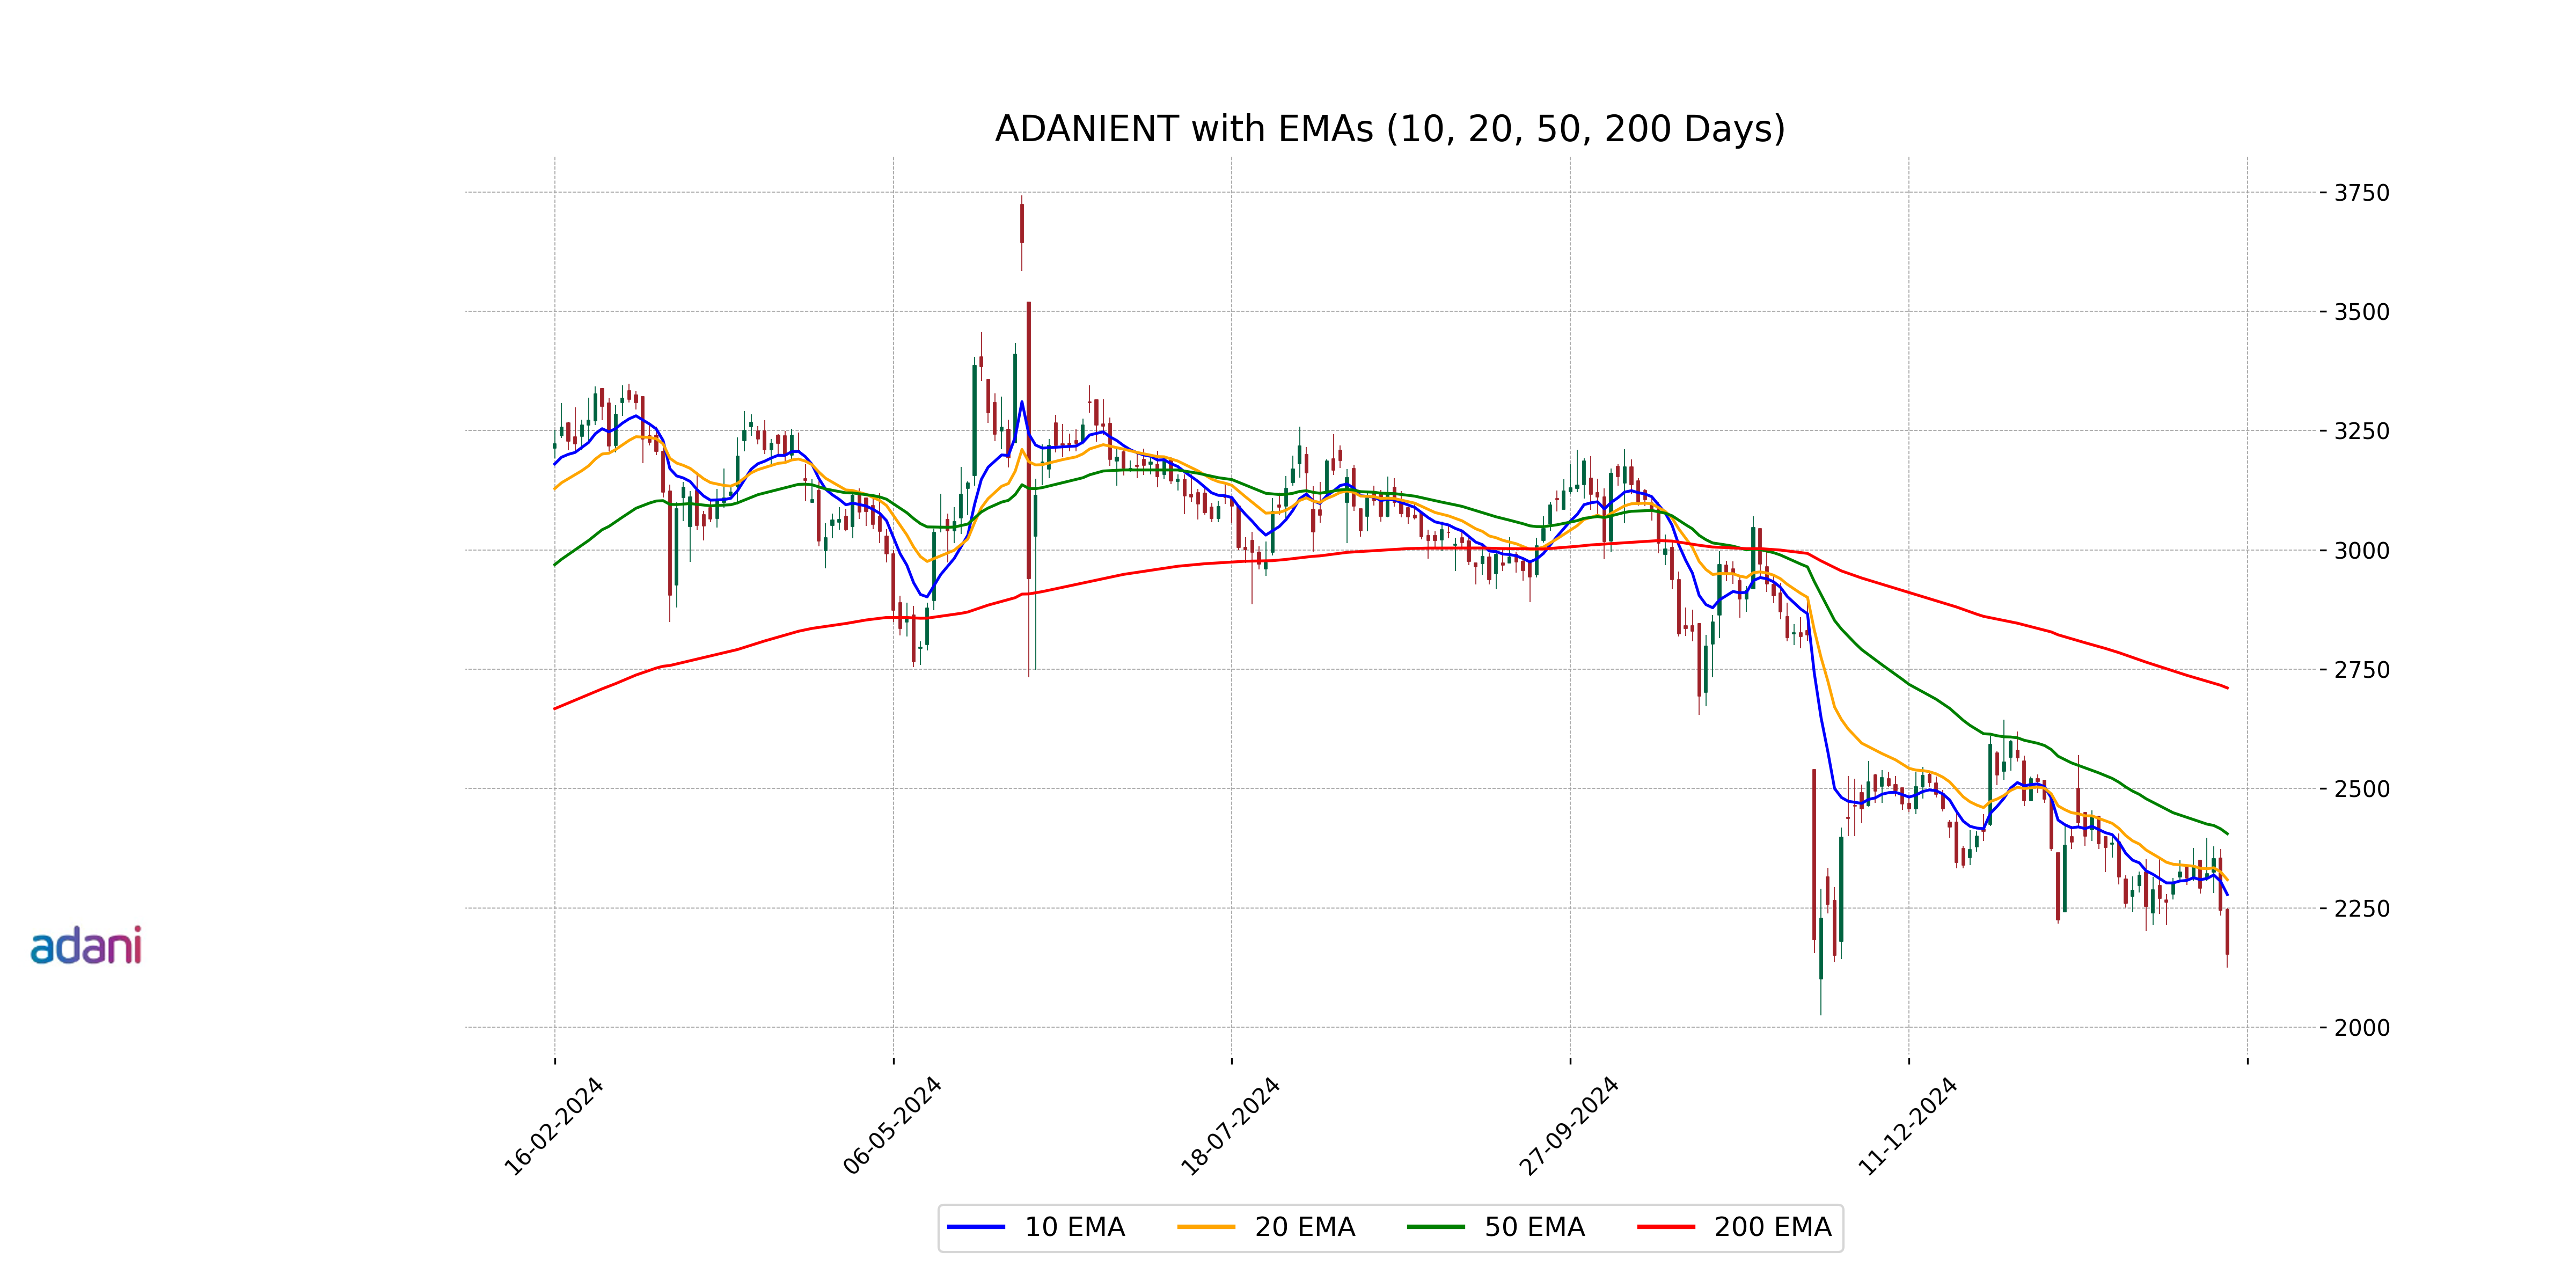
**Adani Enterprises** saw a decline in its stock price, closing at 2152.65 after opening at 2245.70, marking a percentage change of -4.10%. The company's RSI is 35.46, indicating potential oversold conditions, while its MACD reflects a bearish trend. With a market cap of over 2.48 trillion INR, Adani Enterprises operates within the Energy sector, specifically in Thermal Coal in India.
Relationship with Key Moving Averages
Adani Enterprises' stock is trading below its key moving averages, as indicated by its close price of 2152.65, which is under its 10-day EMA (2277.68), 50-day EMA (2405.21), and 200-day EMA (2710.67). This suggests a bearish trend in the short, medium, and long-term moving averages.
Moving Averages Trend (MACD)
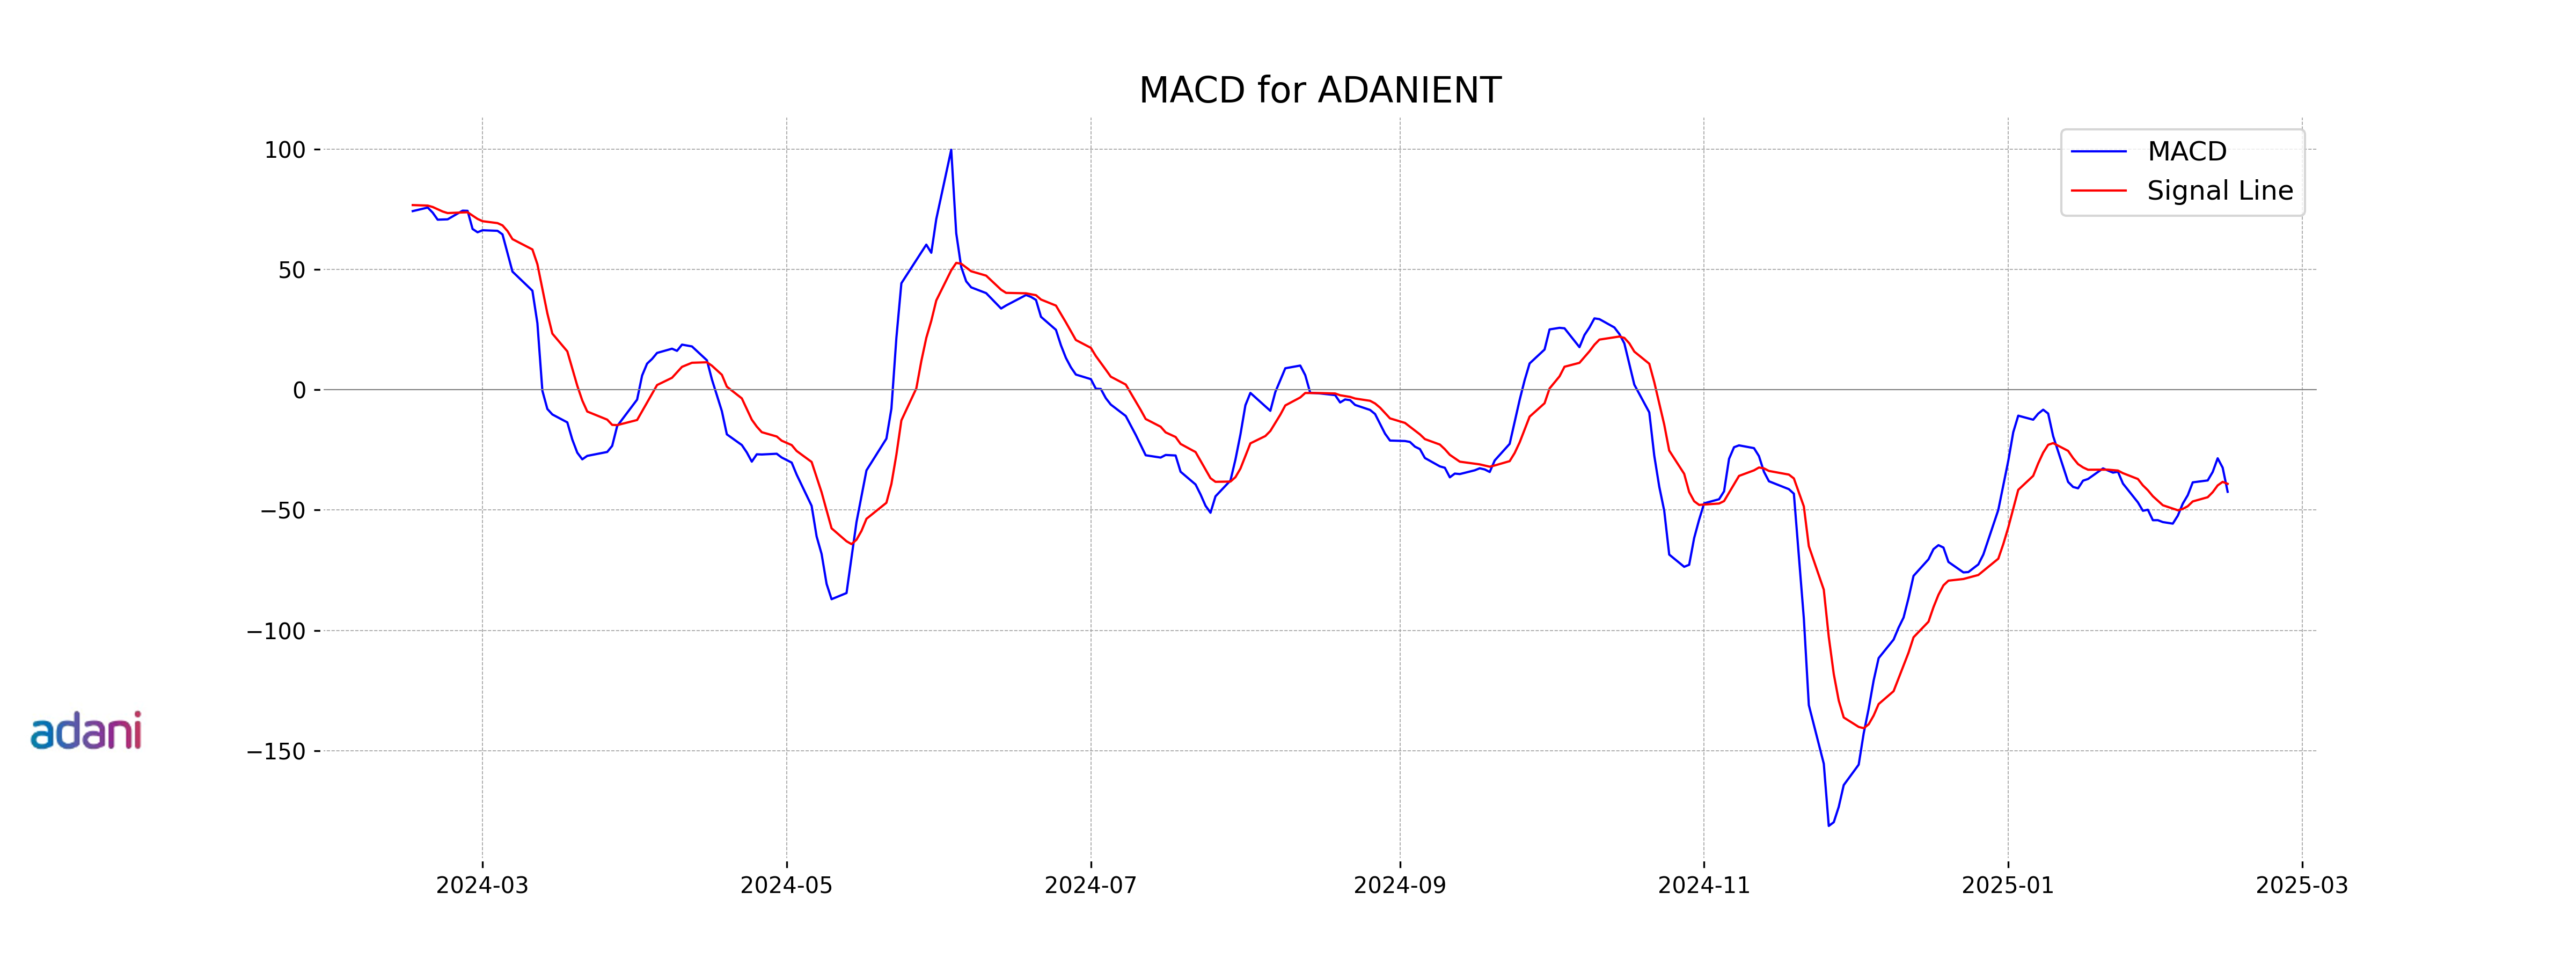
**MACD Analysis for Adani Enterprises** The MACD of -42.42 compared to the MACD Signal of -39.11 indicates a bearish momentum in Adani Enterprises, suggesting a possible downward trend. Additionally, with an RSI of 35.46, the stock might be approaching oversold territory, potentially signaling a reversal or consolidation in the near term.
RSI Analysis
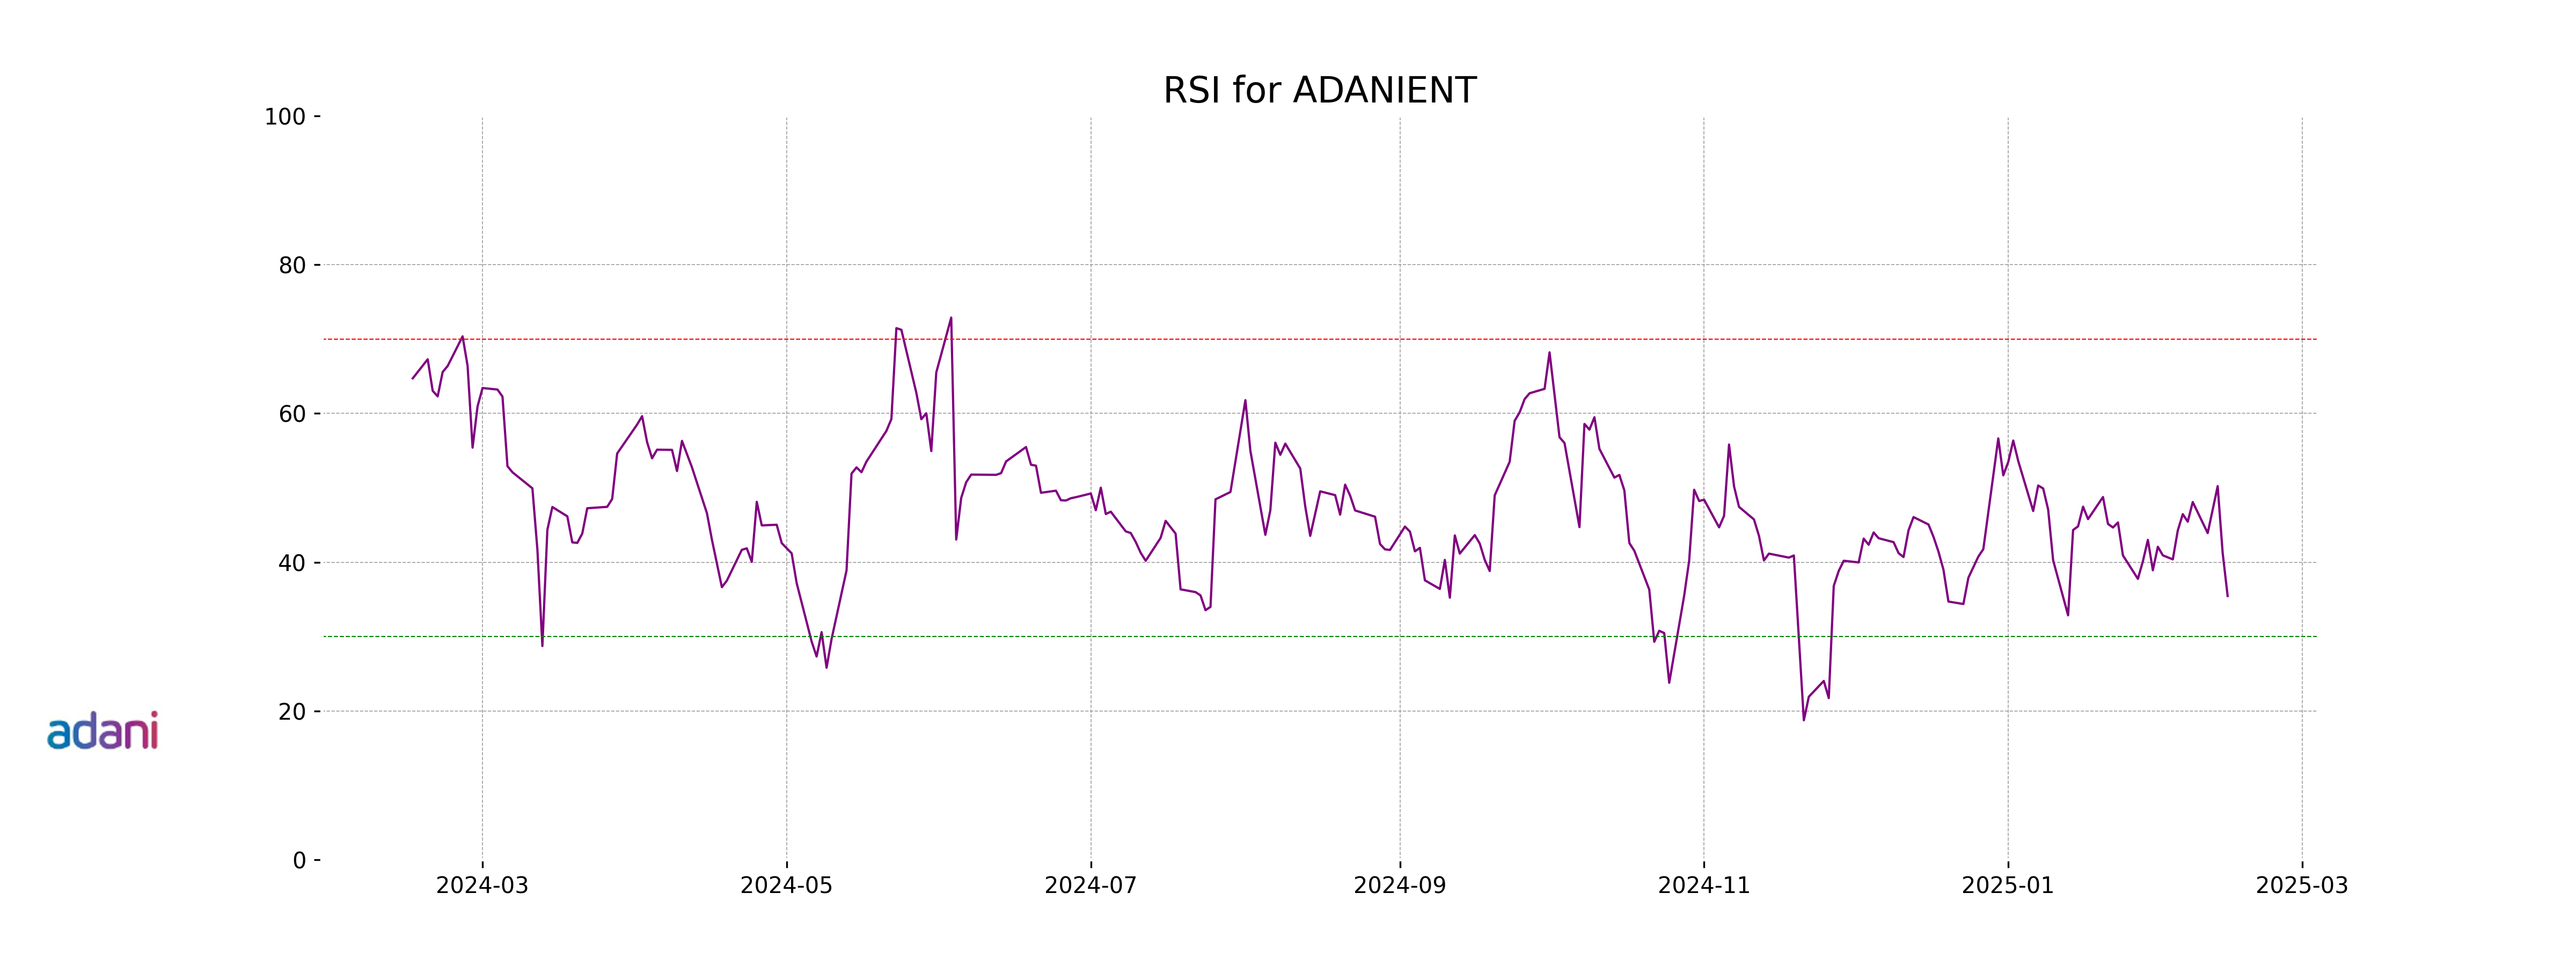
The RSI (Relative Strength Index) for Adani Enterprises is 35.46, which falls within the oversold range. An RSI below 30 typically suggests that a stock may be undervalued, indicating potential for a reversal or upward movement; however, at 35.46, it is close to this threshold, suggesting the stock may be experiencing bearish sentiment.
Analysis for Adani Ports - February 14, 2025
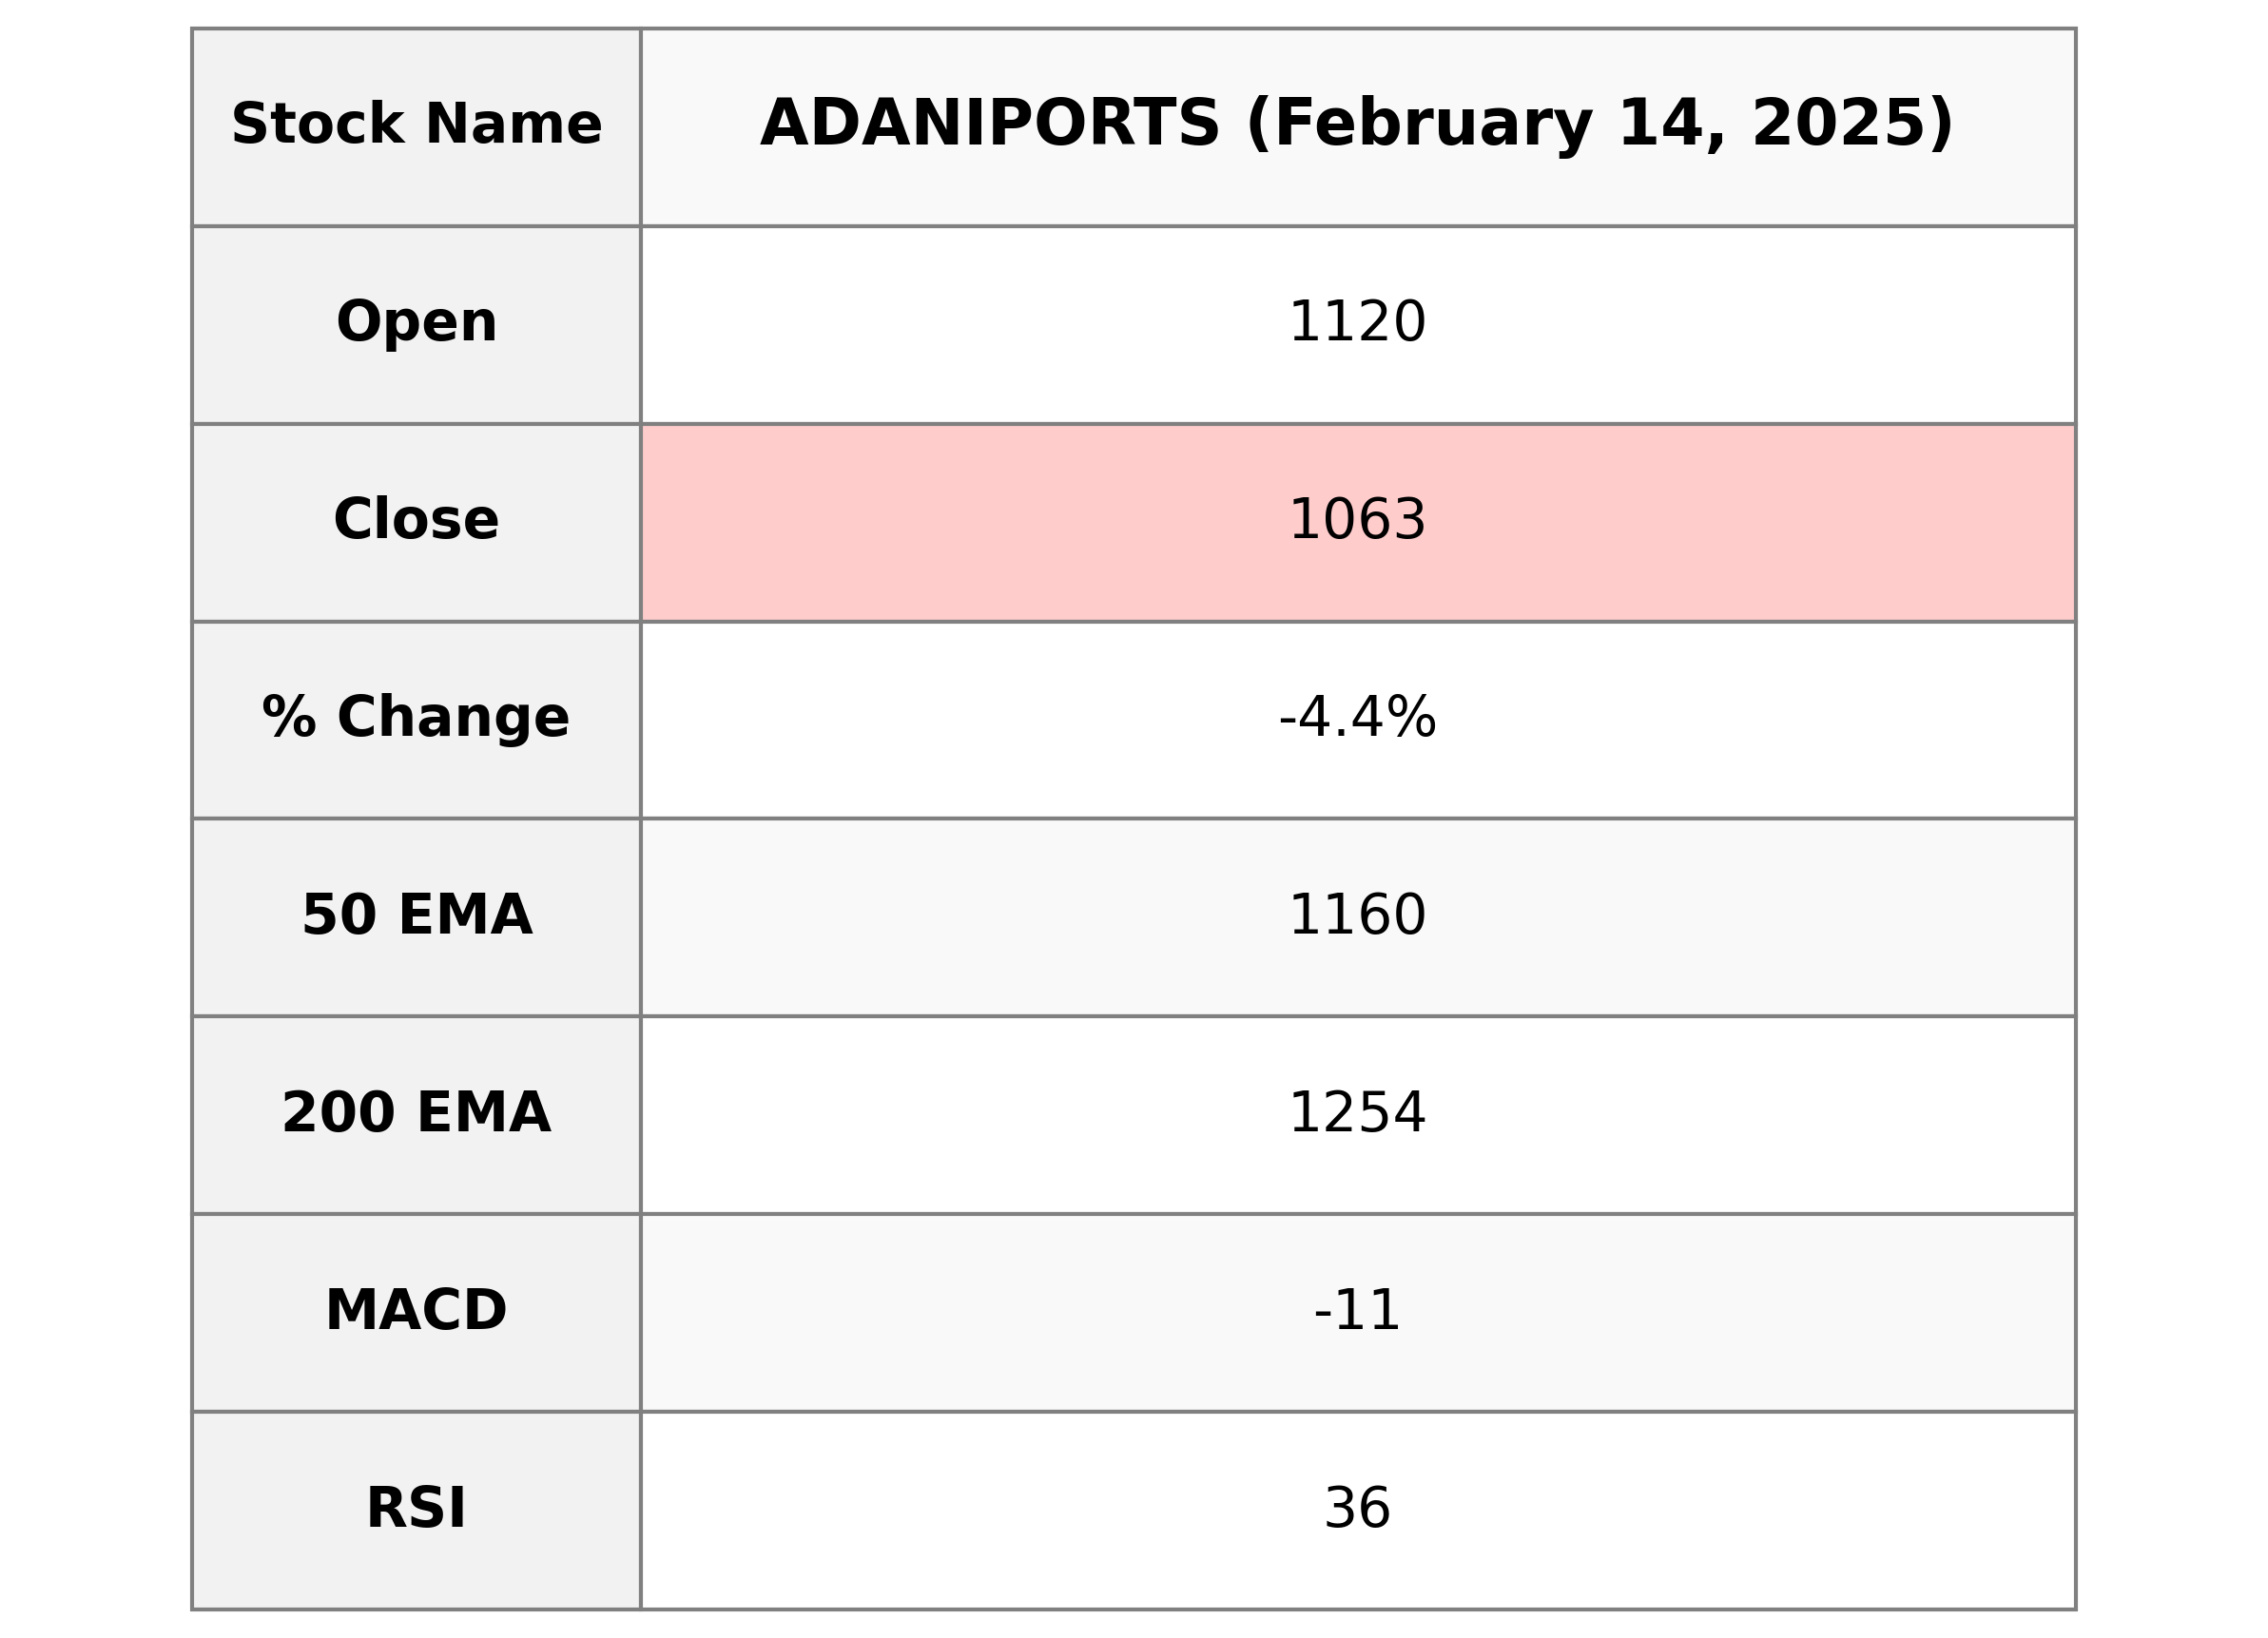
**Adani Ports** had a significant decline in its recent trading session, with the stock closing at 1062.70, a 4.39% decrease from its previous close. Despite robust trading volume, the market sentiment appears bearish with an RSI of 36.48, indicating a downtrend. The stock is currently below key EMAs and MACD suggests a negative momentum, reflecting underperformance in the marine shipping sector within India.
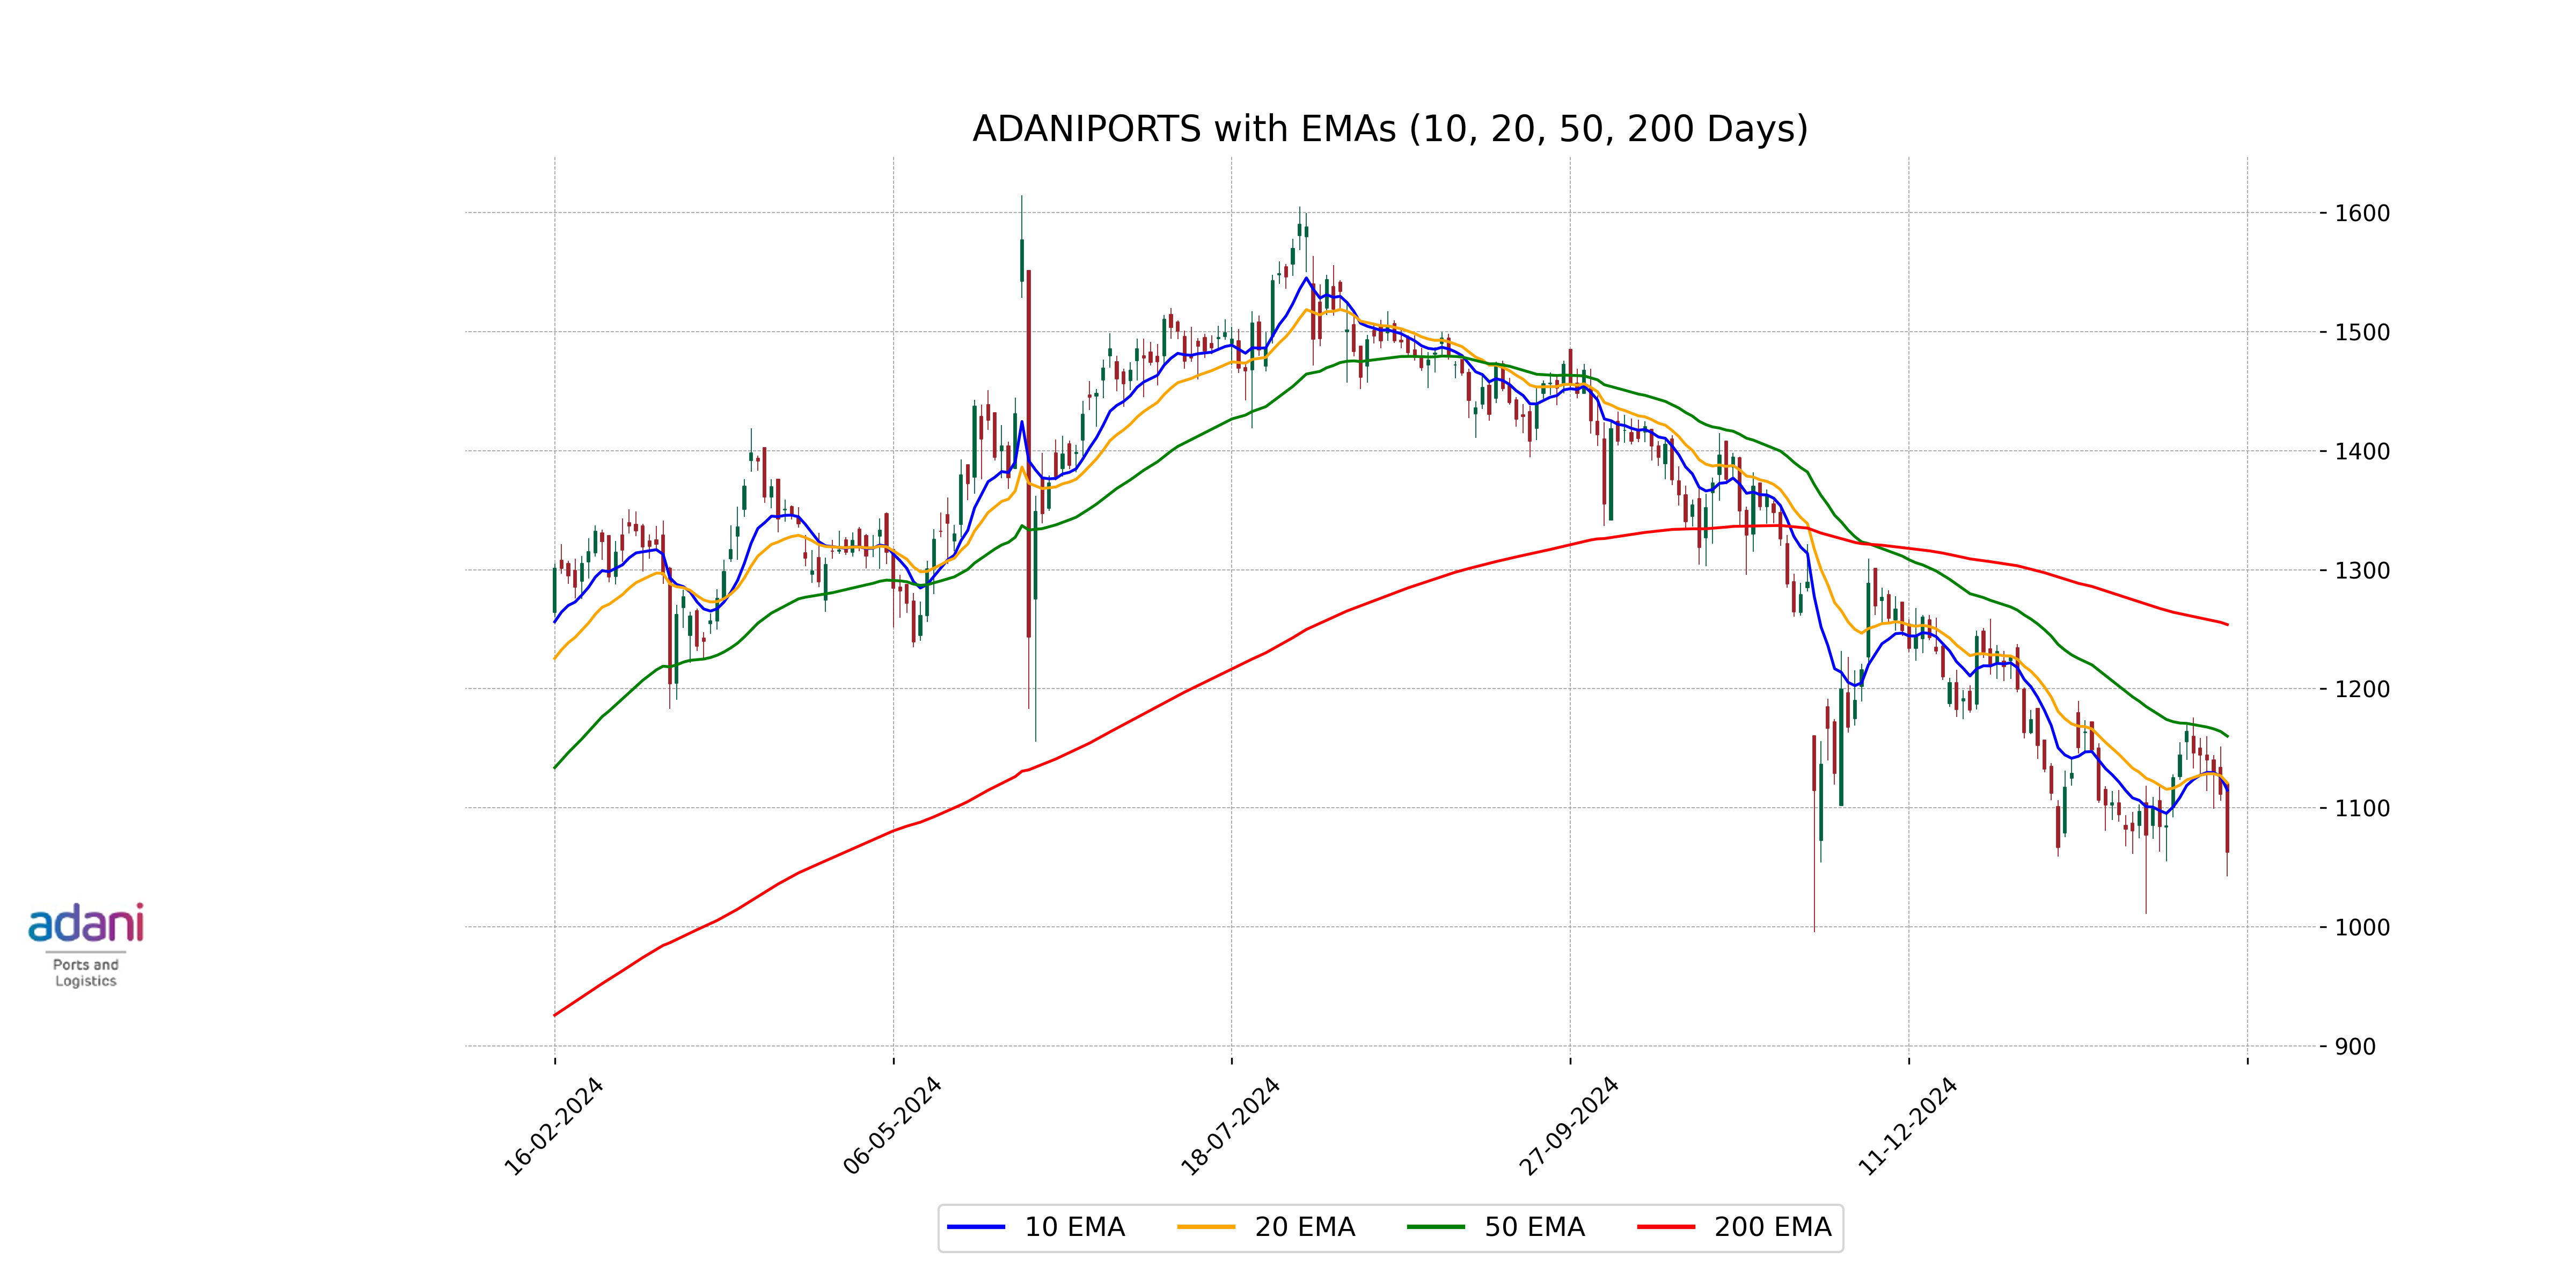
Relationship with Key Moving Averages
Adani Ports is currently trading below its 50-day EMA (1160.15) and 200-day EMA (1253.93), indicating a bearish trend. Additionally, the current price of 1062.70 is also below the 10-day EMA (1114.74) and 20-day EMA (1120.83), suggesting short-term weakness.
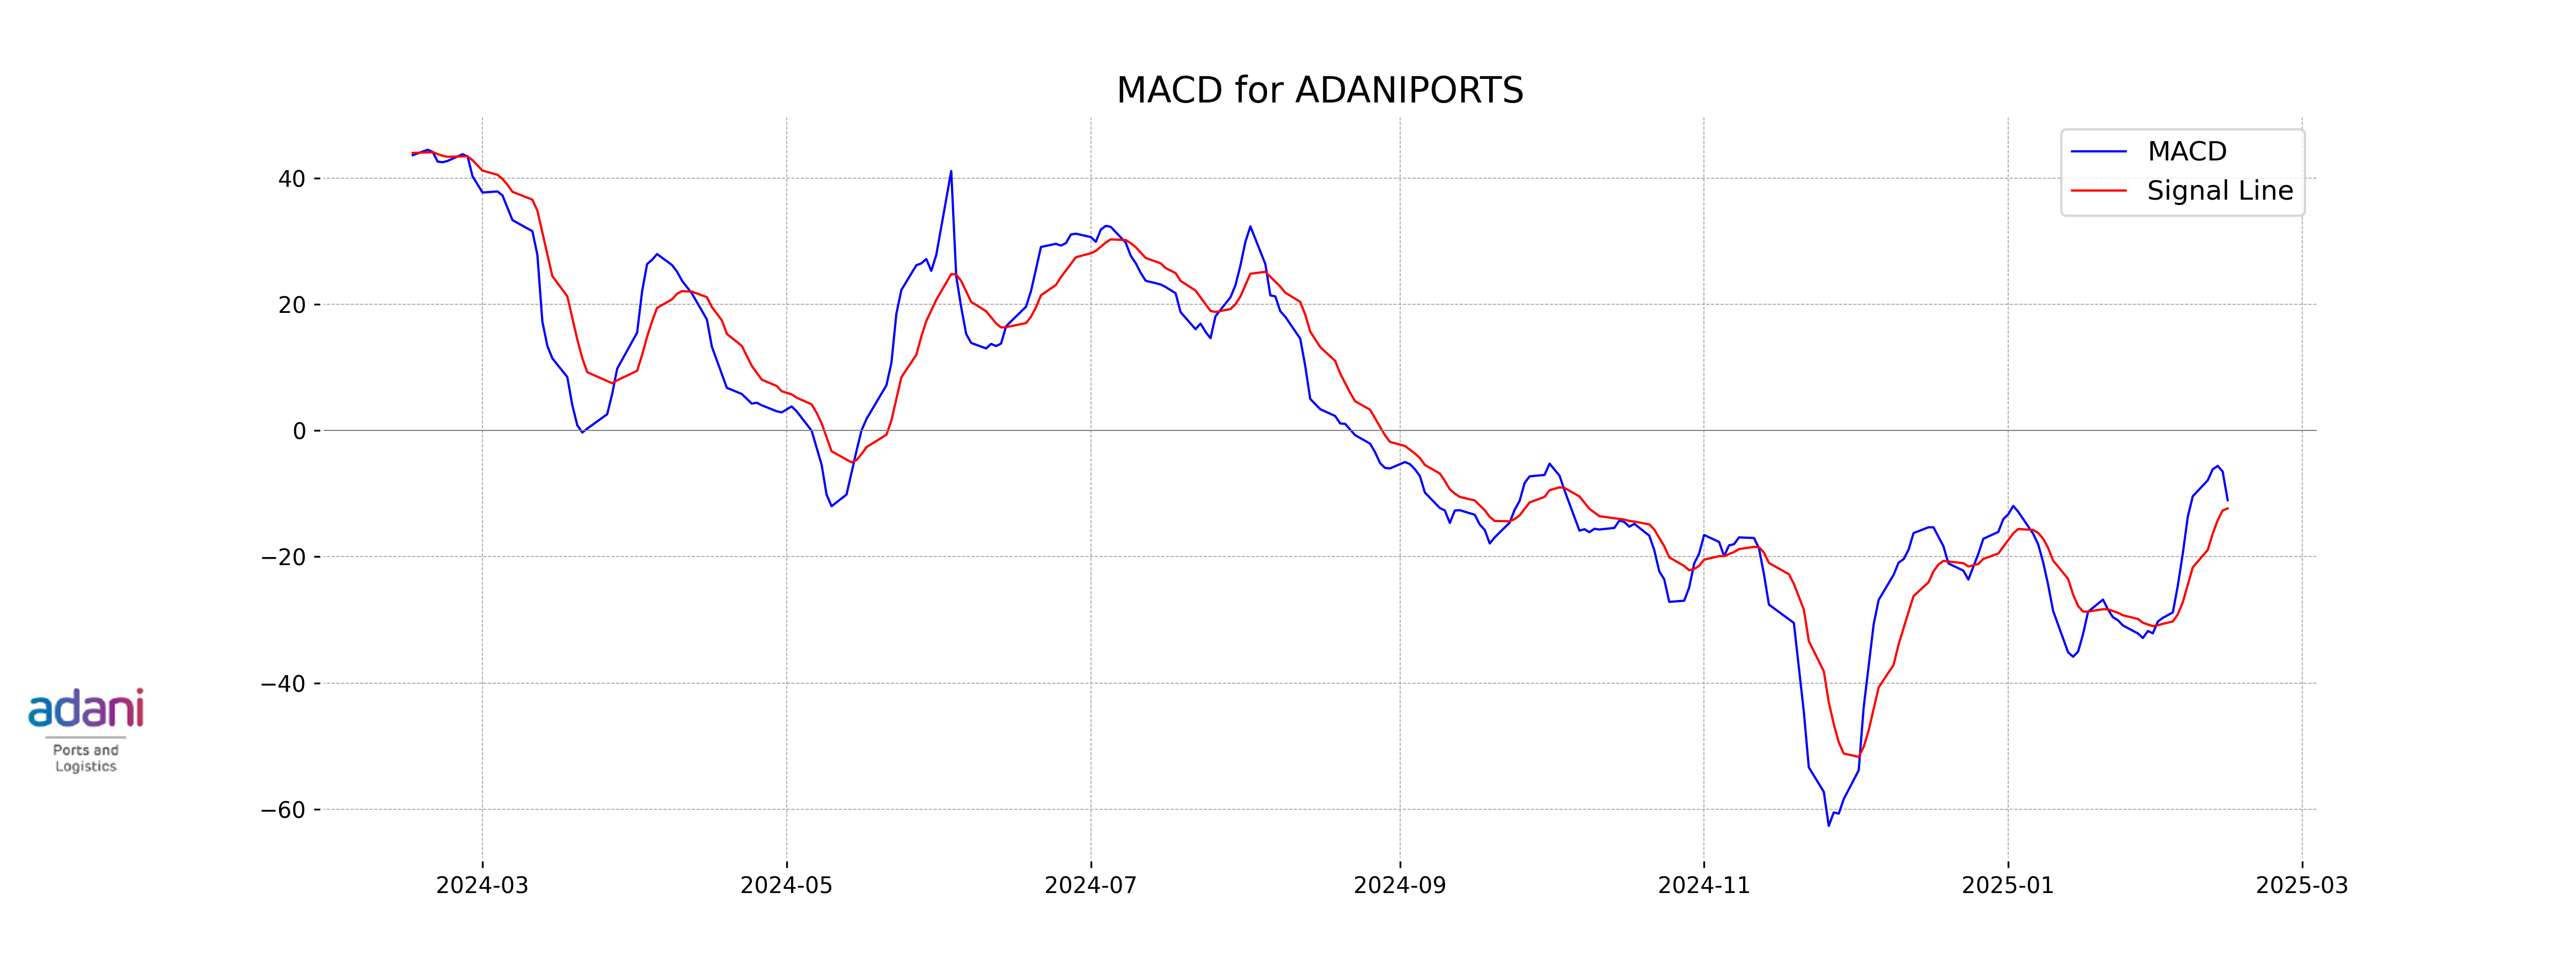
Moving Averages Trend (MACD)
Adani Ports' MACD is currently at -11.02, which is above its MACD Signal line at -12.34. This suggests a potential bullish signal, indicating that the stock might be experiencing a reversal or upward momentum. However, further confirmation from other indicators should be considered before making any investment decisions.
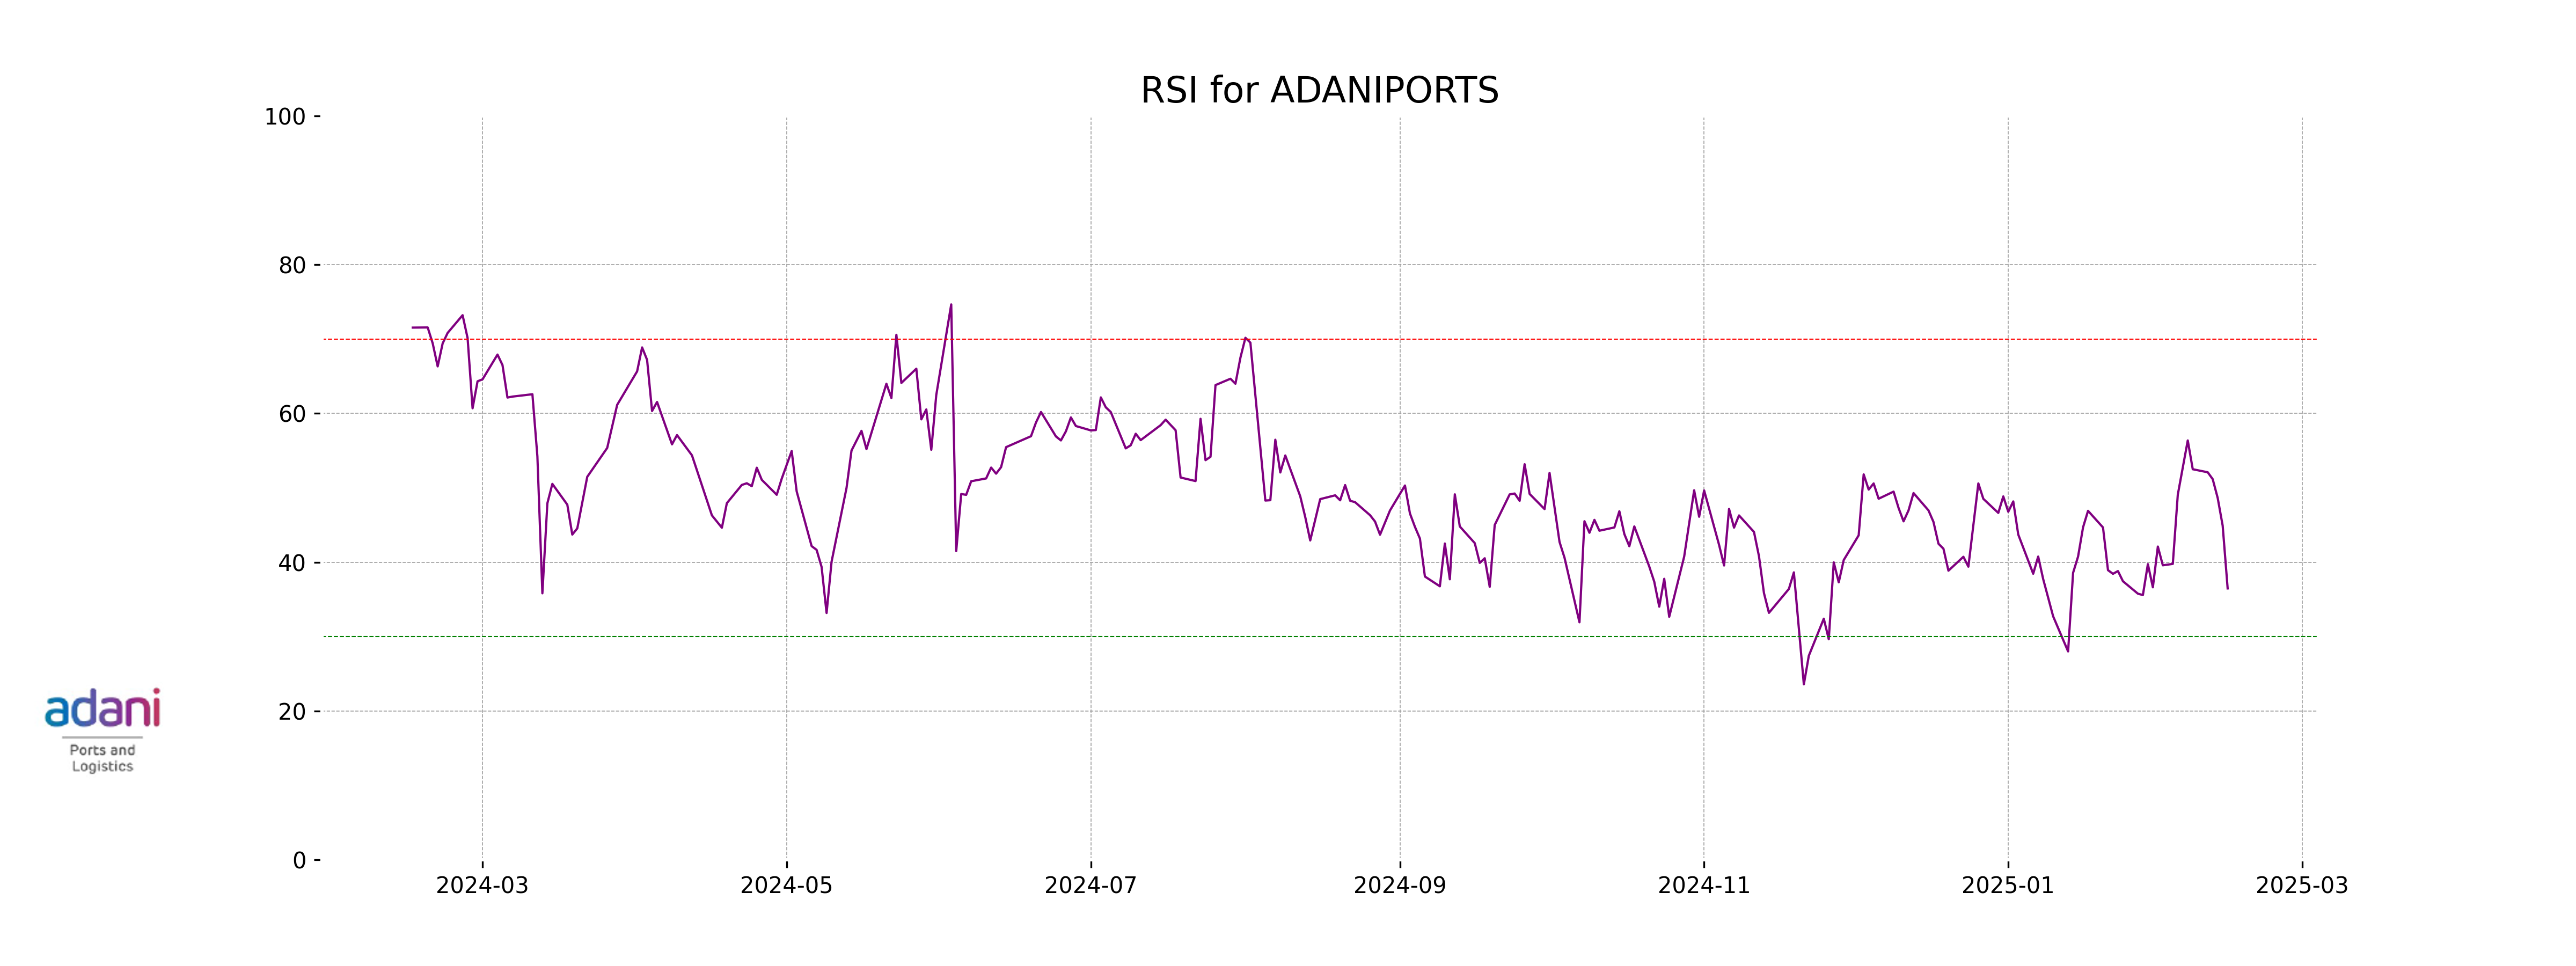
RSI Analysis
The RSI (Relative Strength Index) for Adani Ports is 36.48, indicating that the stock is in the lower range of the RSI scale, which suggests it is nearing oversold conditions. This may imply a potential buying opportunity if such conditions persist, as the stock appears to be under significant selling pressure.
Analysis for Bharat Electronics - February 14, 2025
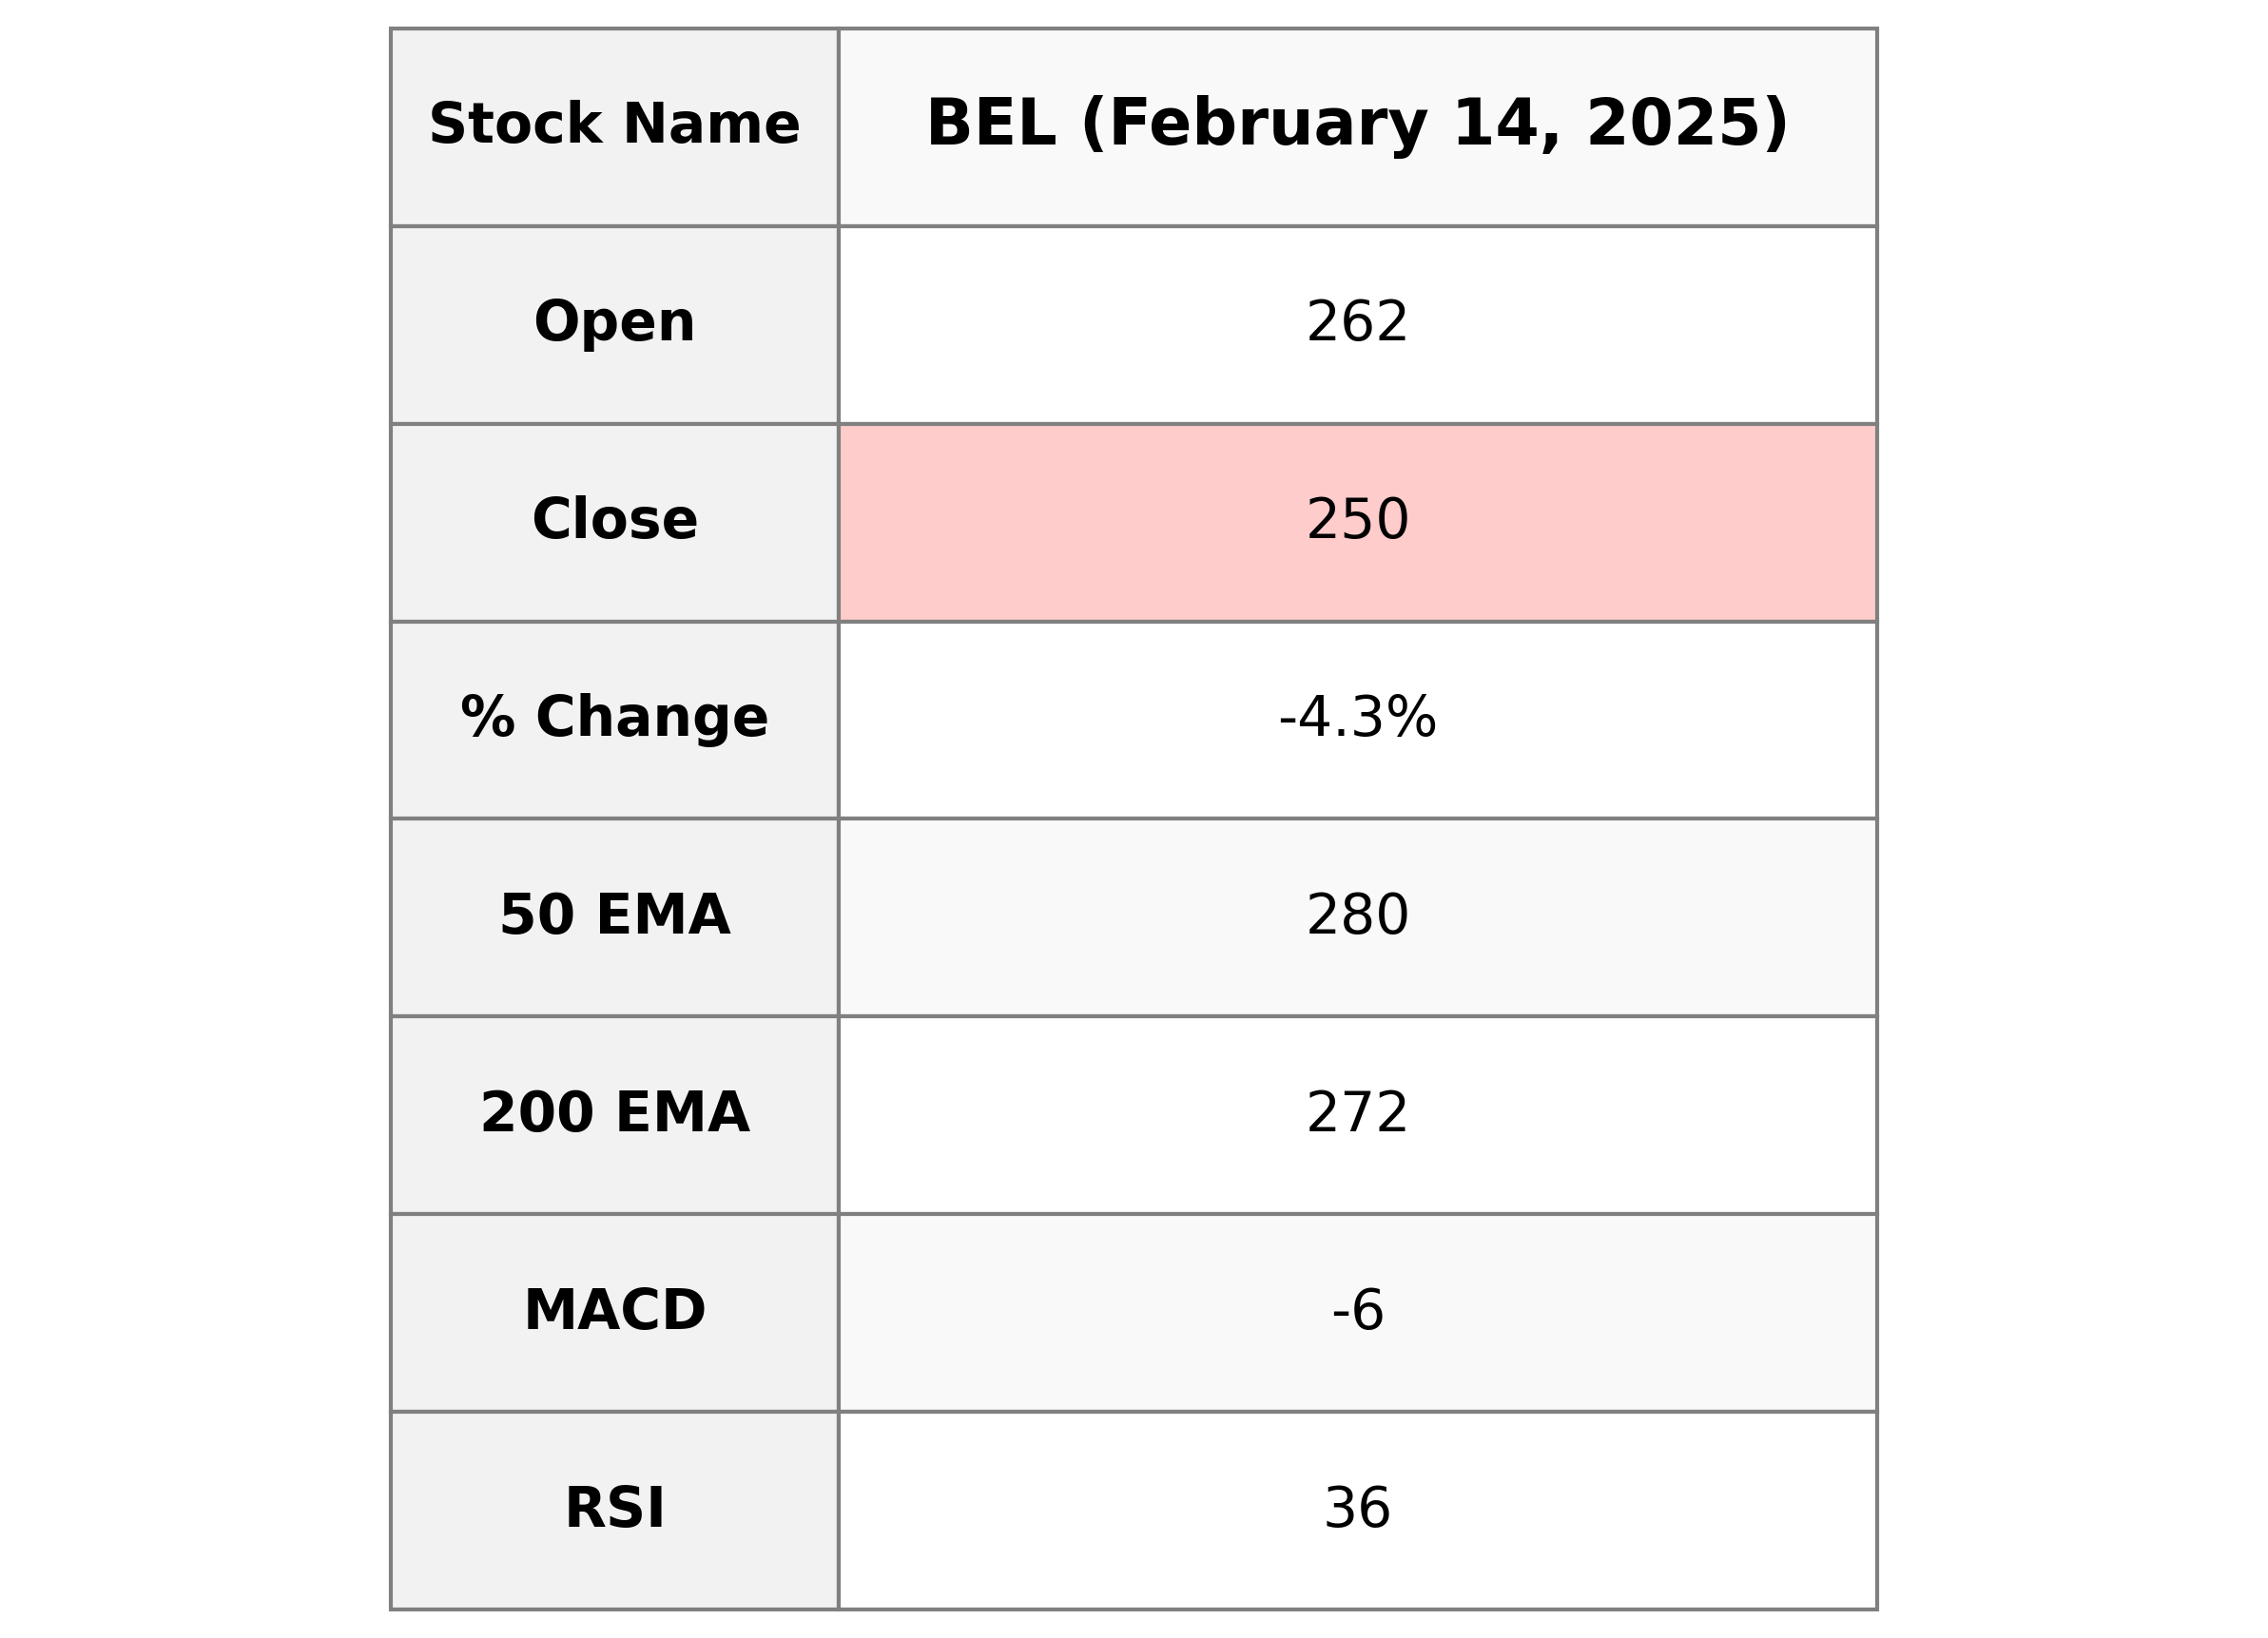
Bharat Electronics experienced a negative market performance with a closing price of 250.35 after opening at 262.20, marking a -4.28% change from its previous close. The stock's RSI of 36.35 suggests it is approaching oversold territory, alongside a bearish MACD of -5.64. The company, within the Industrials sector under Aerospace & Defense in India, has a PE Ratio of 36.65, indicating market perception regarding its earnings relative to peers.
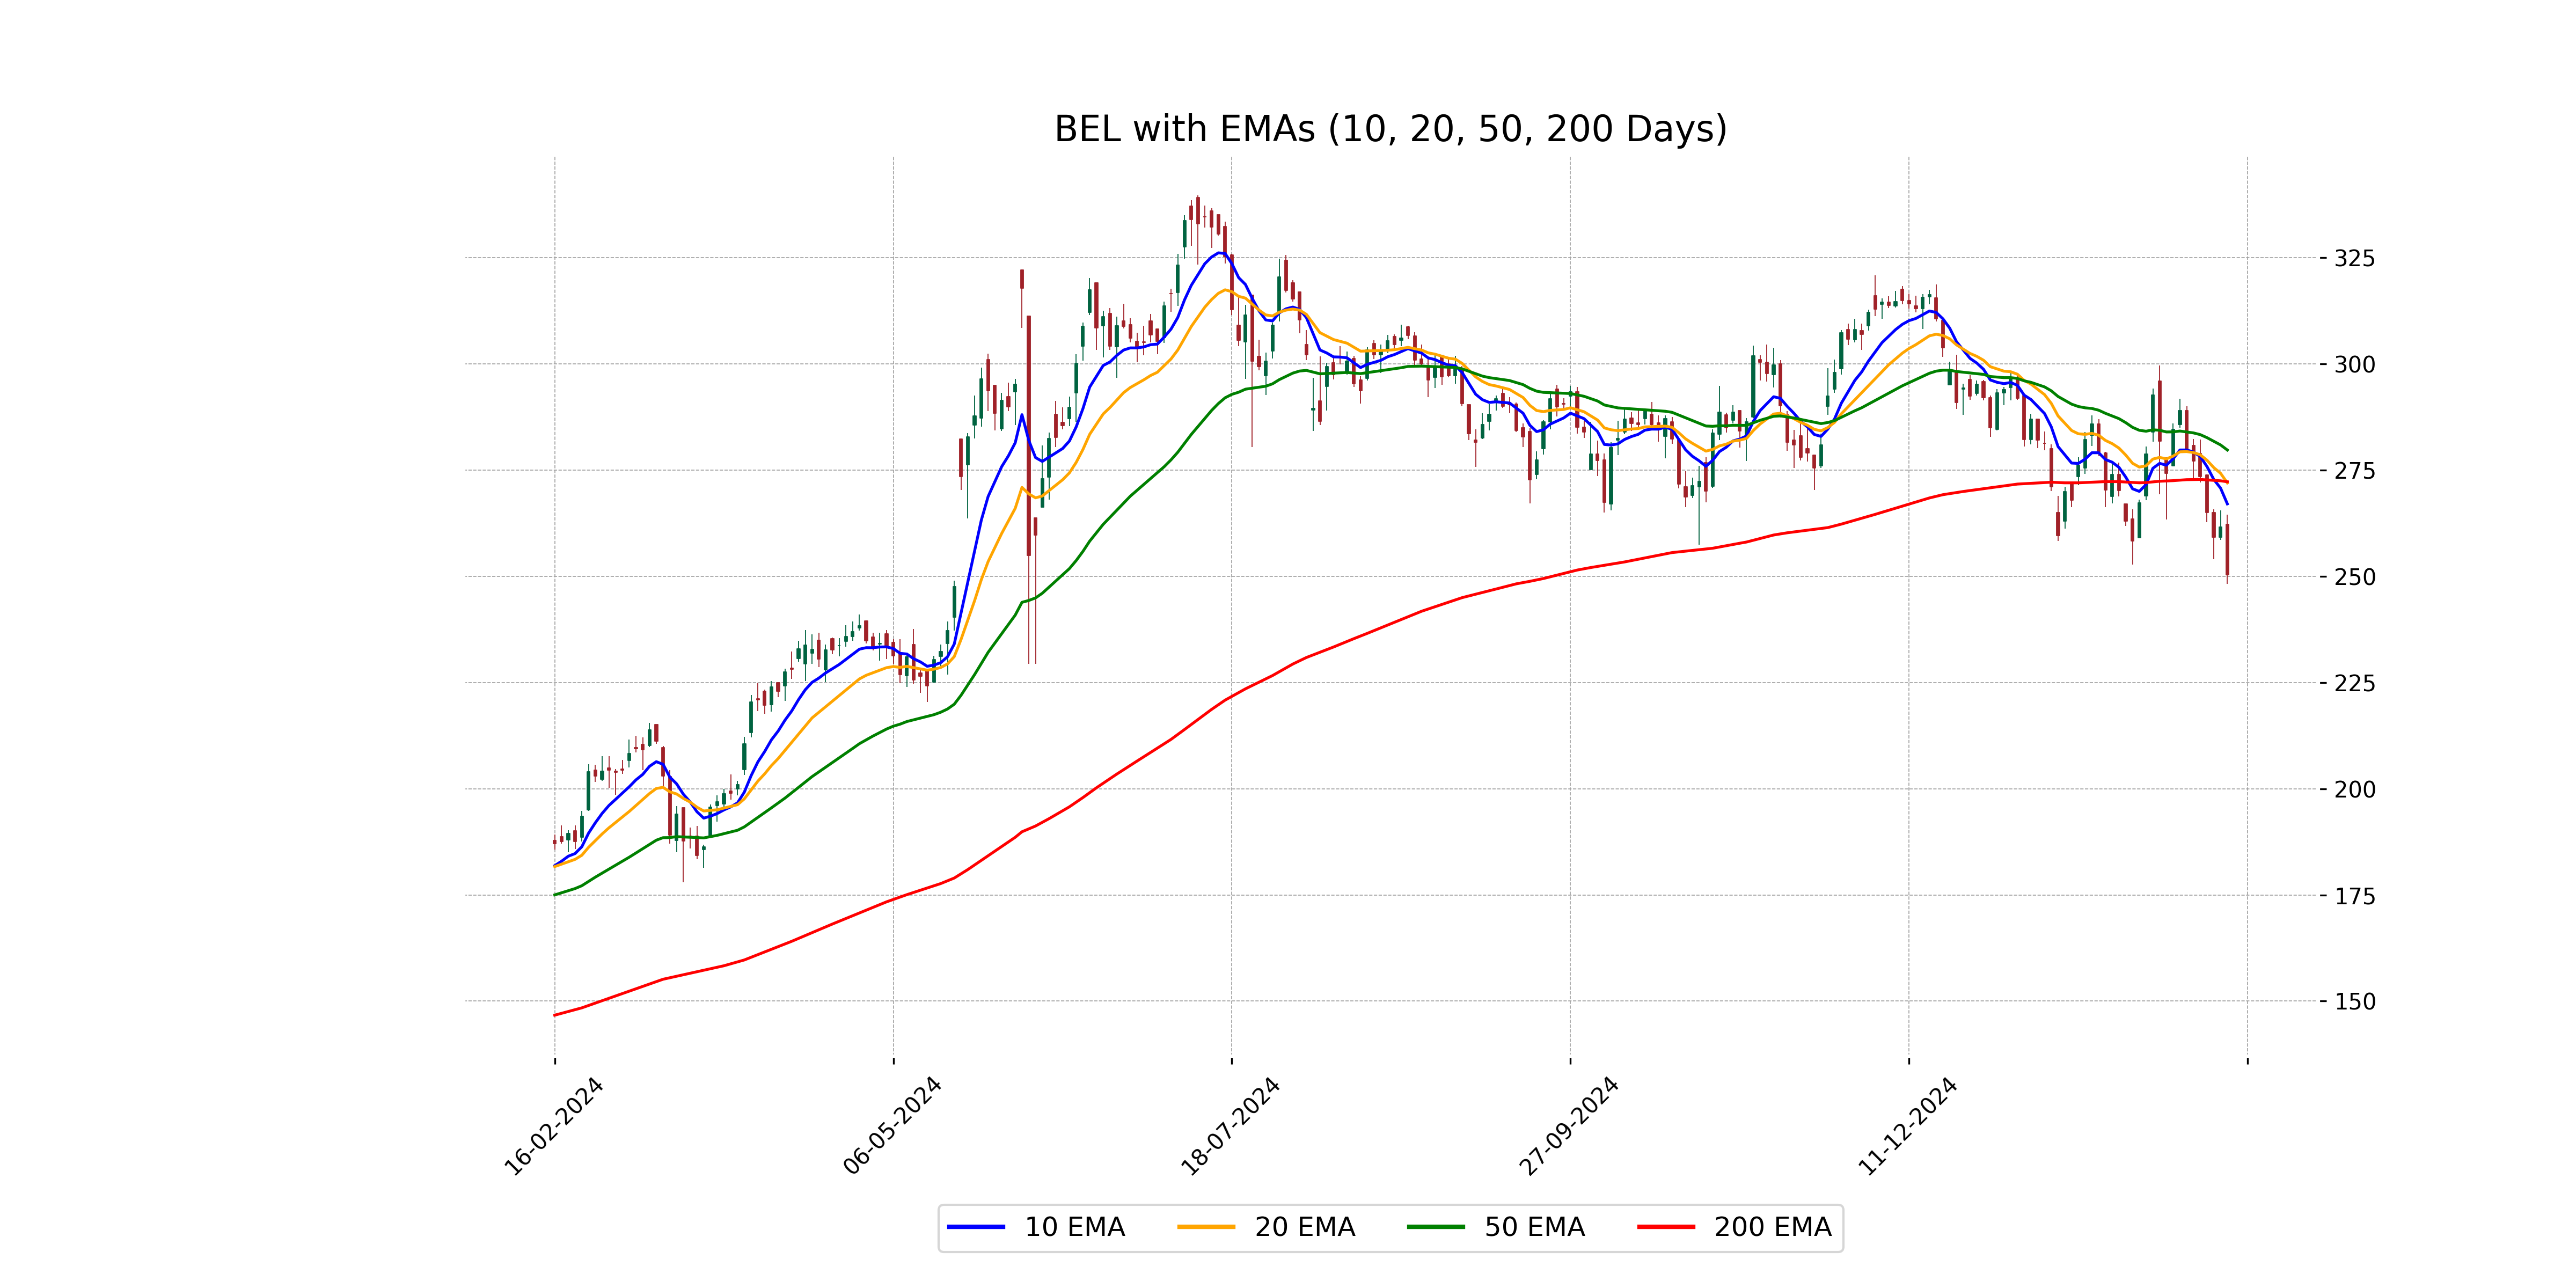
Relationship with Key Moving Averages
Bharat Electronics' current close price of 250.35 is below its key moving averages, including the 50 EMA at 279.69 and the 200 EMA at 272.23, suggesting a bearish trend. The 10 EMA at 267.02 and 20 EMA at 271.95 also indicate the stock is currently trading below shorter-term averages, reinforcing potential downward momentum.
Moving Averages Trend (MACD)
Bharat Electronics is experiencing bearish momentum as indicated by the MACD being negative and below the MACD Signal line. This suggests a possible continuation of the downtrend in the short term.

RSI Analysis
Bharat Electronics is currently showing an RSI value of 36.35. This indicates that the stock is in the oversold territory, which may suggest potential buying opportunities if the trend reverses. However, it's important to consider other indicators and market conditions.

Analysis for SUN Pharma - February 14, 2025
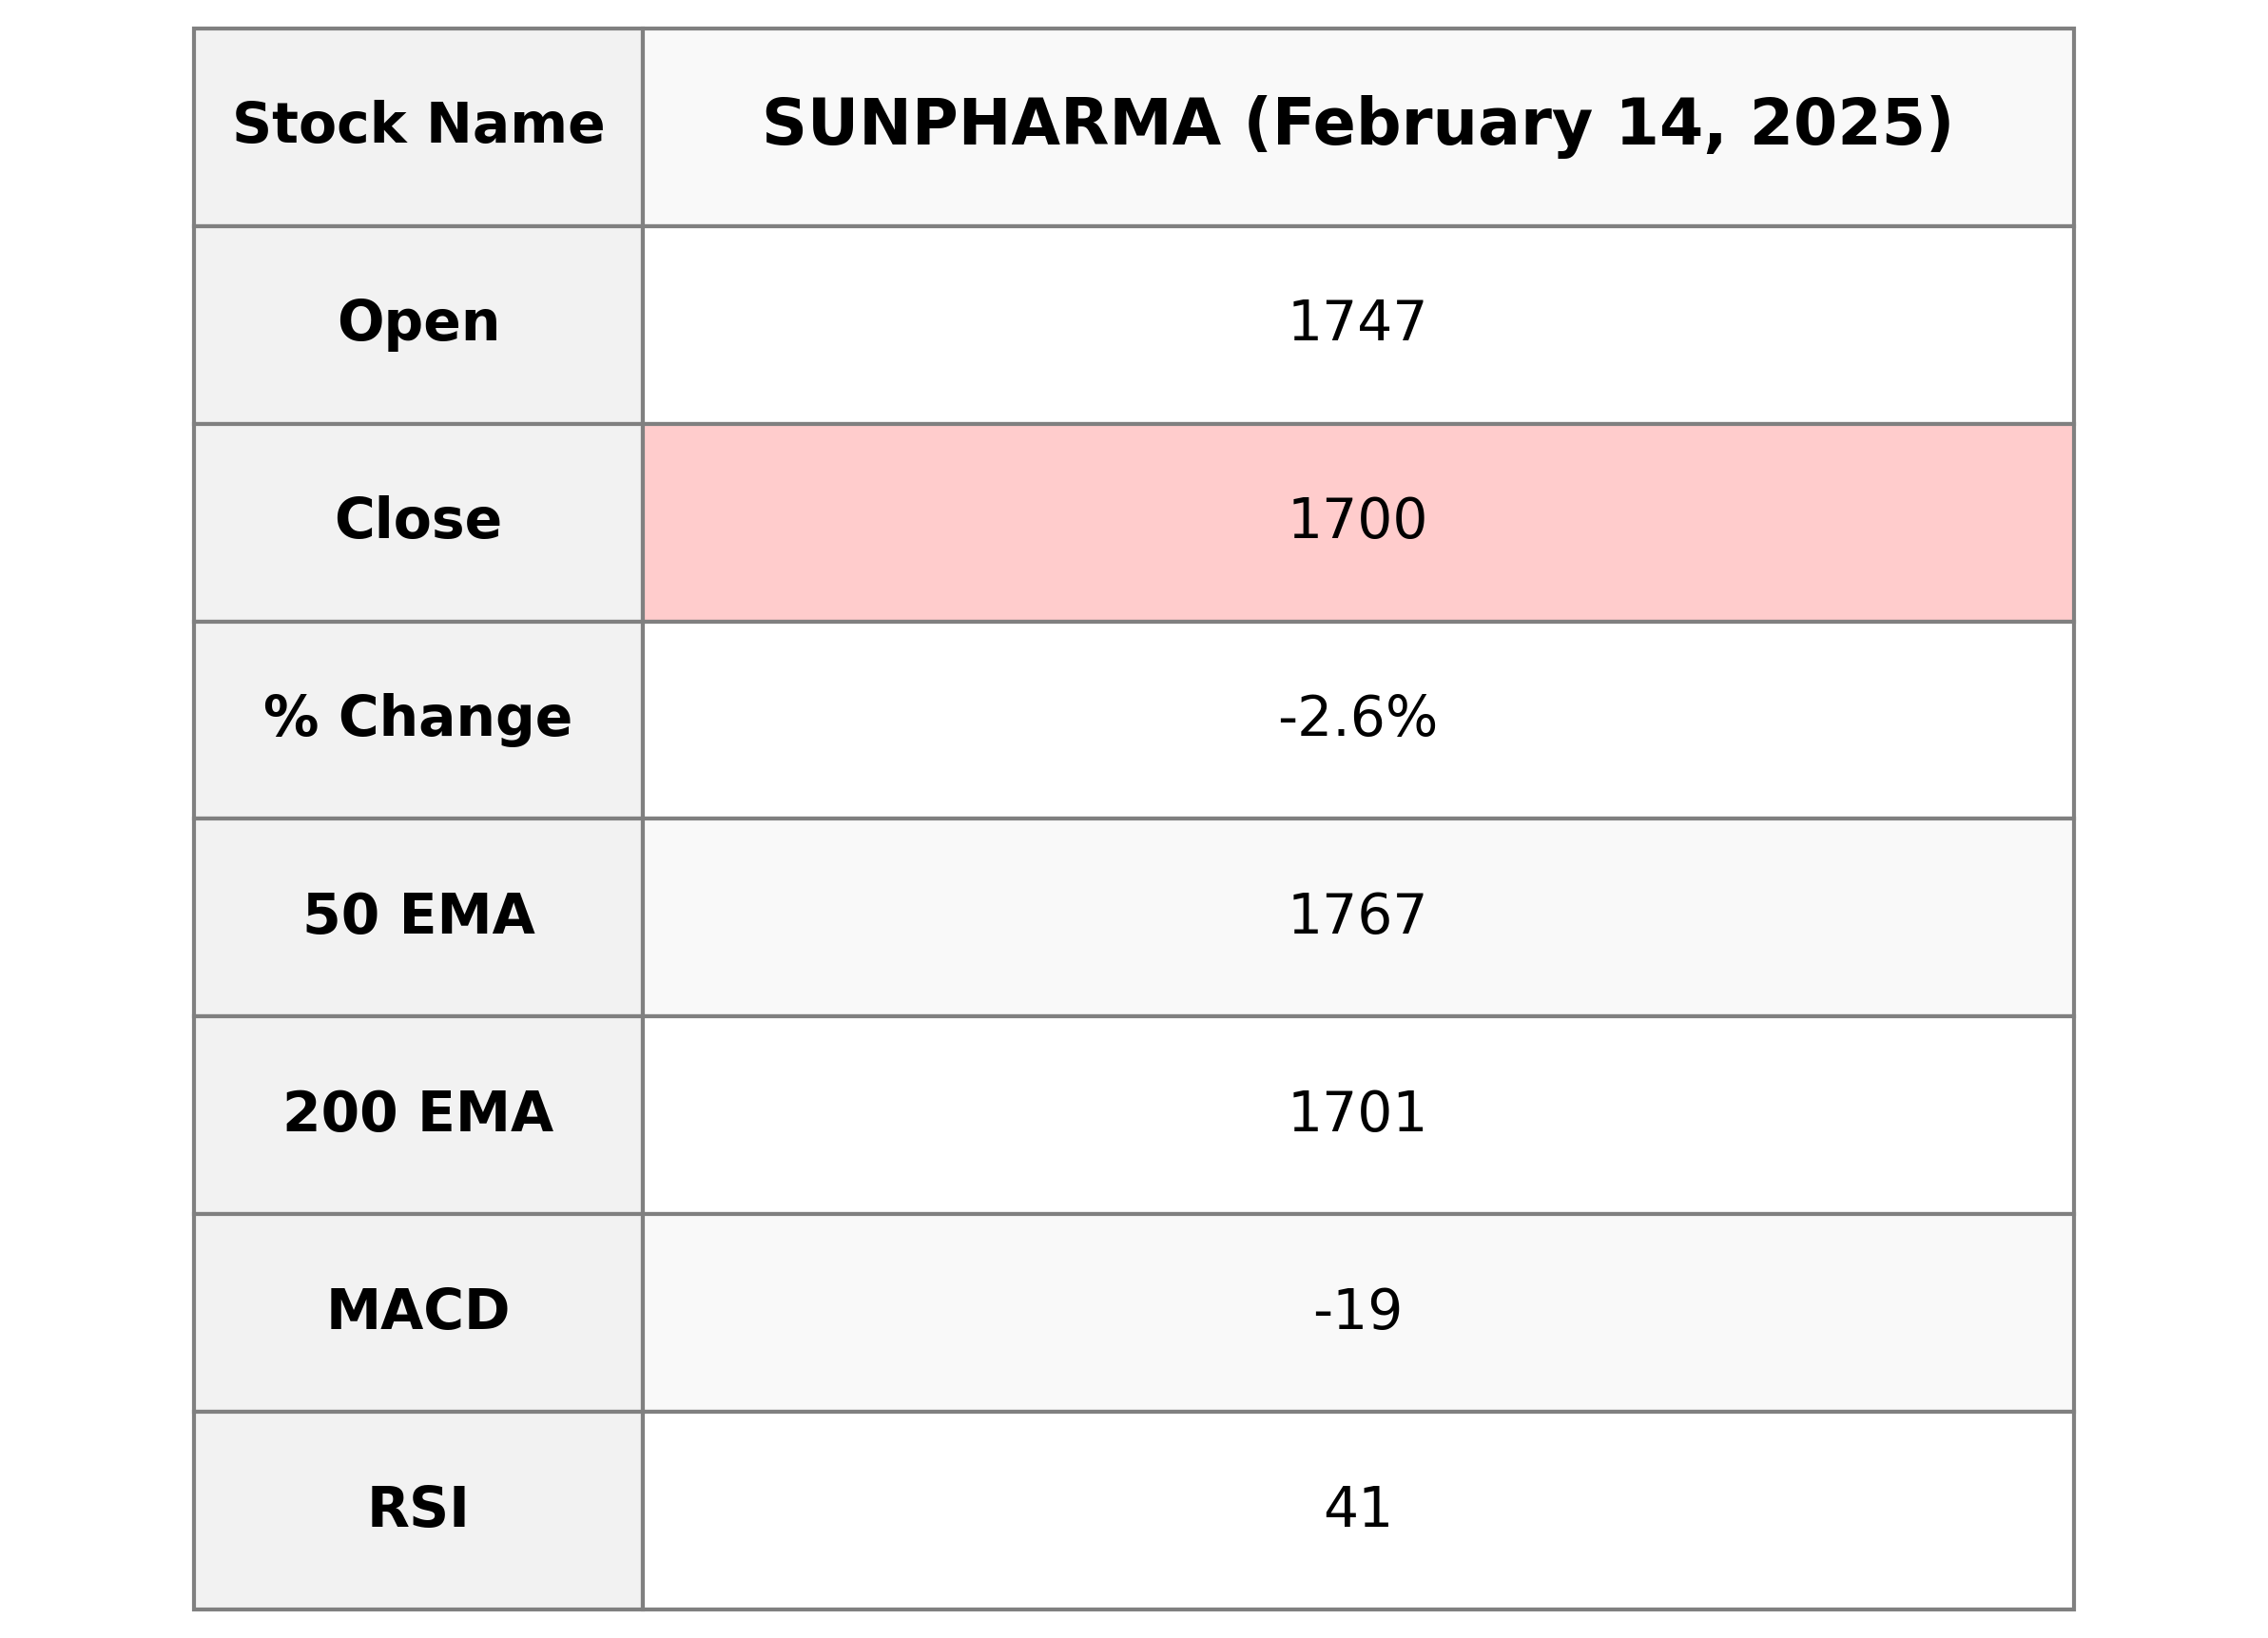
### SUN Pharma Performance SUN Pharma experienced a decline in performance, closing at 1700.5, down from the previous close of 1746.35, marking a percentage change of -2.63%. The stock saw a significant decrease with a points change of -45.85. With a relatively high trading volume of 2,123,731, the stock is currently under its 50-day EMA of 1766.99 but close to its 200-day EMA of 1700.92. The RSI indicates a bearish trend at 41.28, accompanied by a negative MACD, pointing to short-term weakness. SUN Pharma operates in the healthcare sector within India's Drug Manufacturers - Specialty & Generic industry.
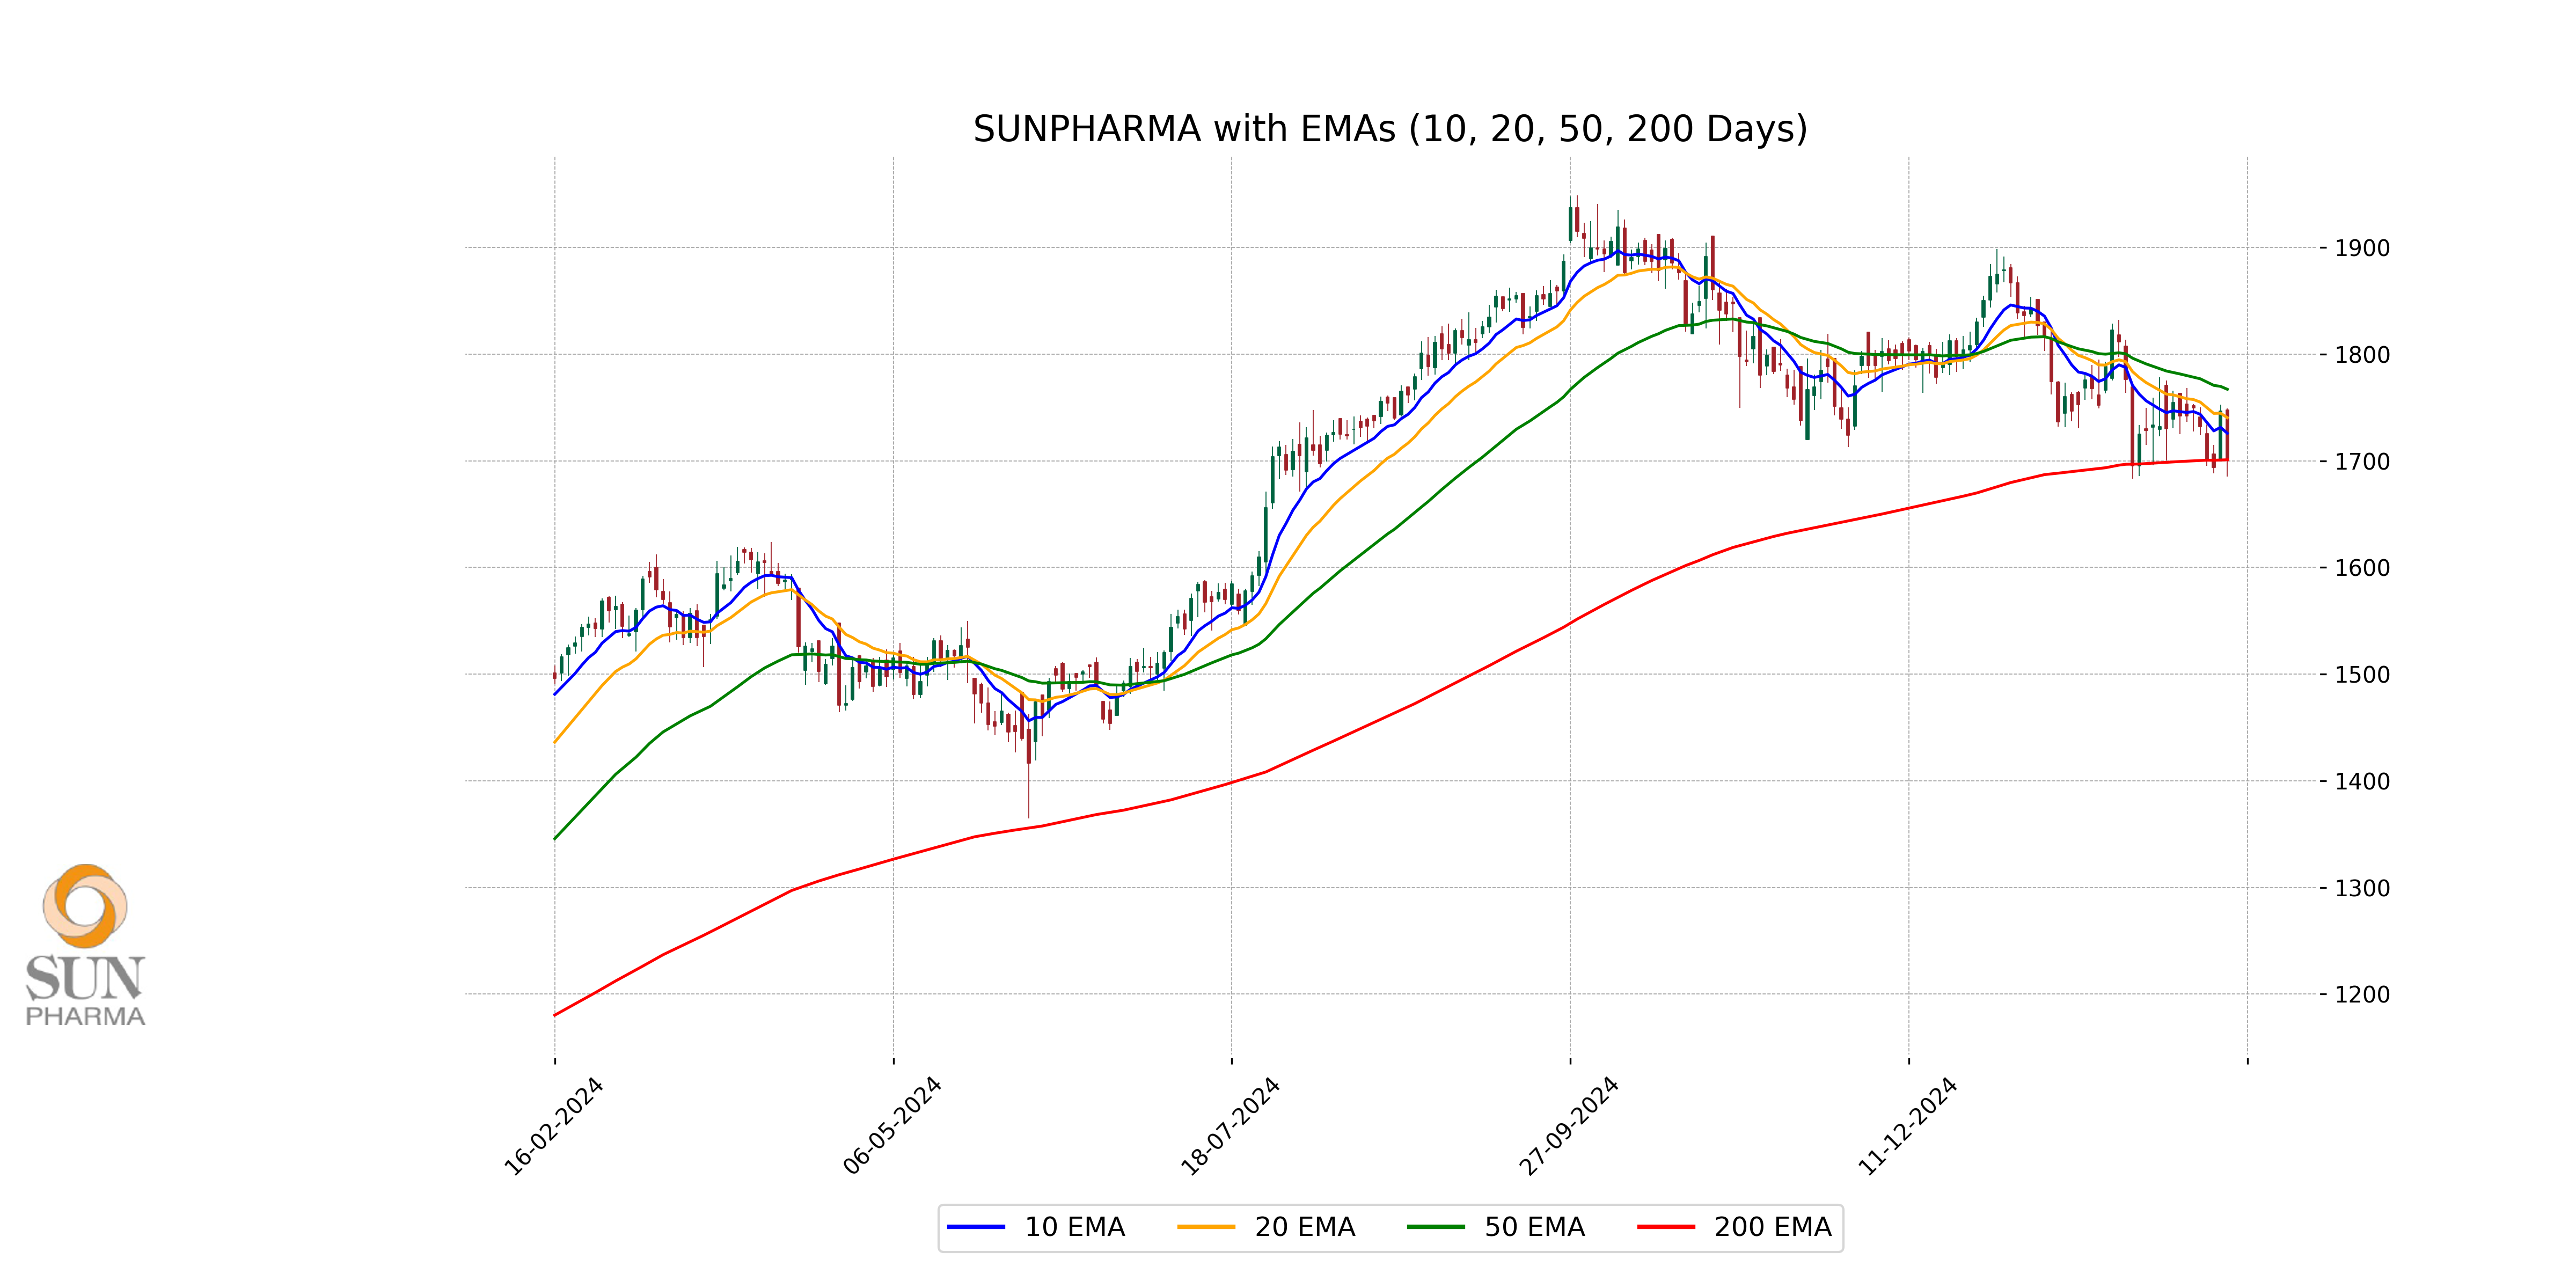
Relationship with Key Moving Averages
**Relationship with Key Moving Averages for SUN Pharma:** The closing price of SUN Pharma at 1700.5 is below its 50-day EMA of 1766.99 and just below its 200-day EMA of 1700.92, suggesting a potential weakness in the short to medium term. Additionally, it is also below the 10-day and 20-day EMAs, indicating potential short-term bearish momentum.
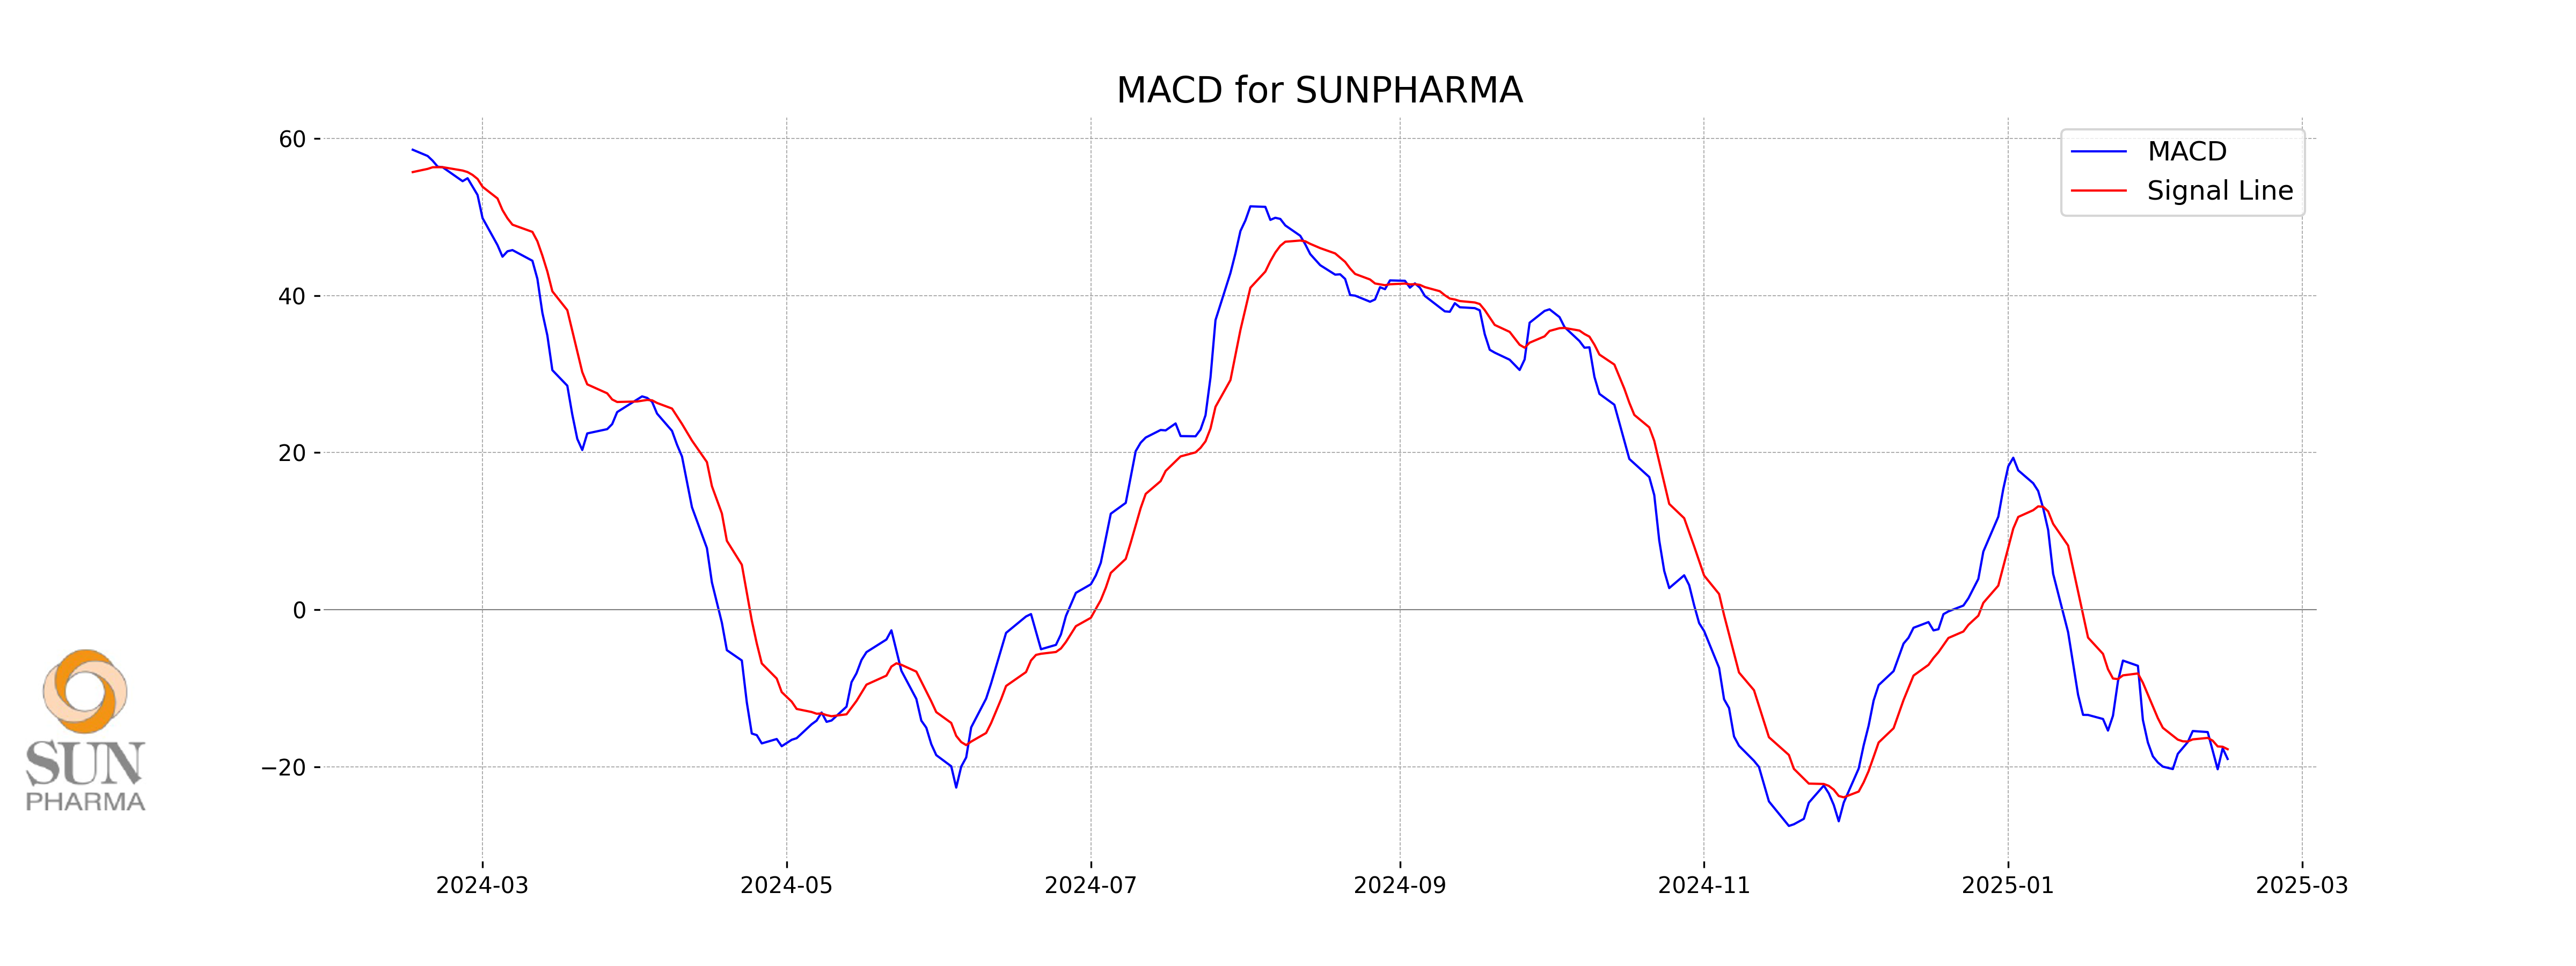
Moving Averages Trend (MACD)
**MACD Analysis for SUN Pharma:** The MACD value is -18.99, while the MACD Signal is -17.76, which indicates a bearish momentum as the MACD line is below the signal line. The negative divergence suggests that the stock may be experiencing downward pressure.
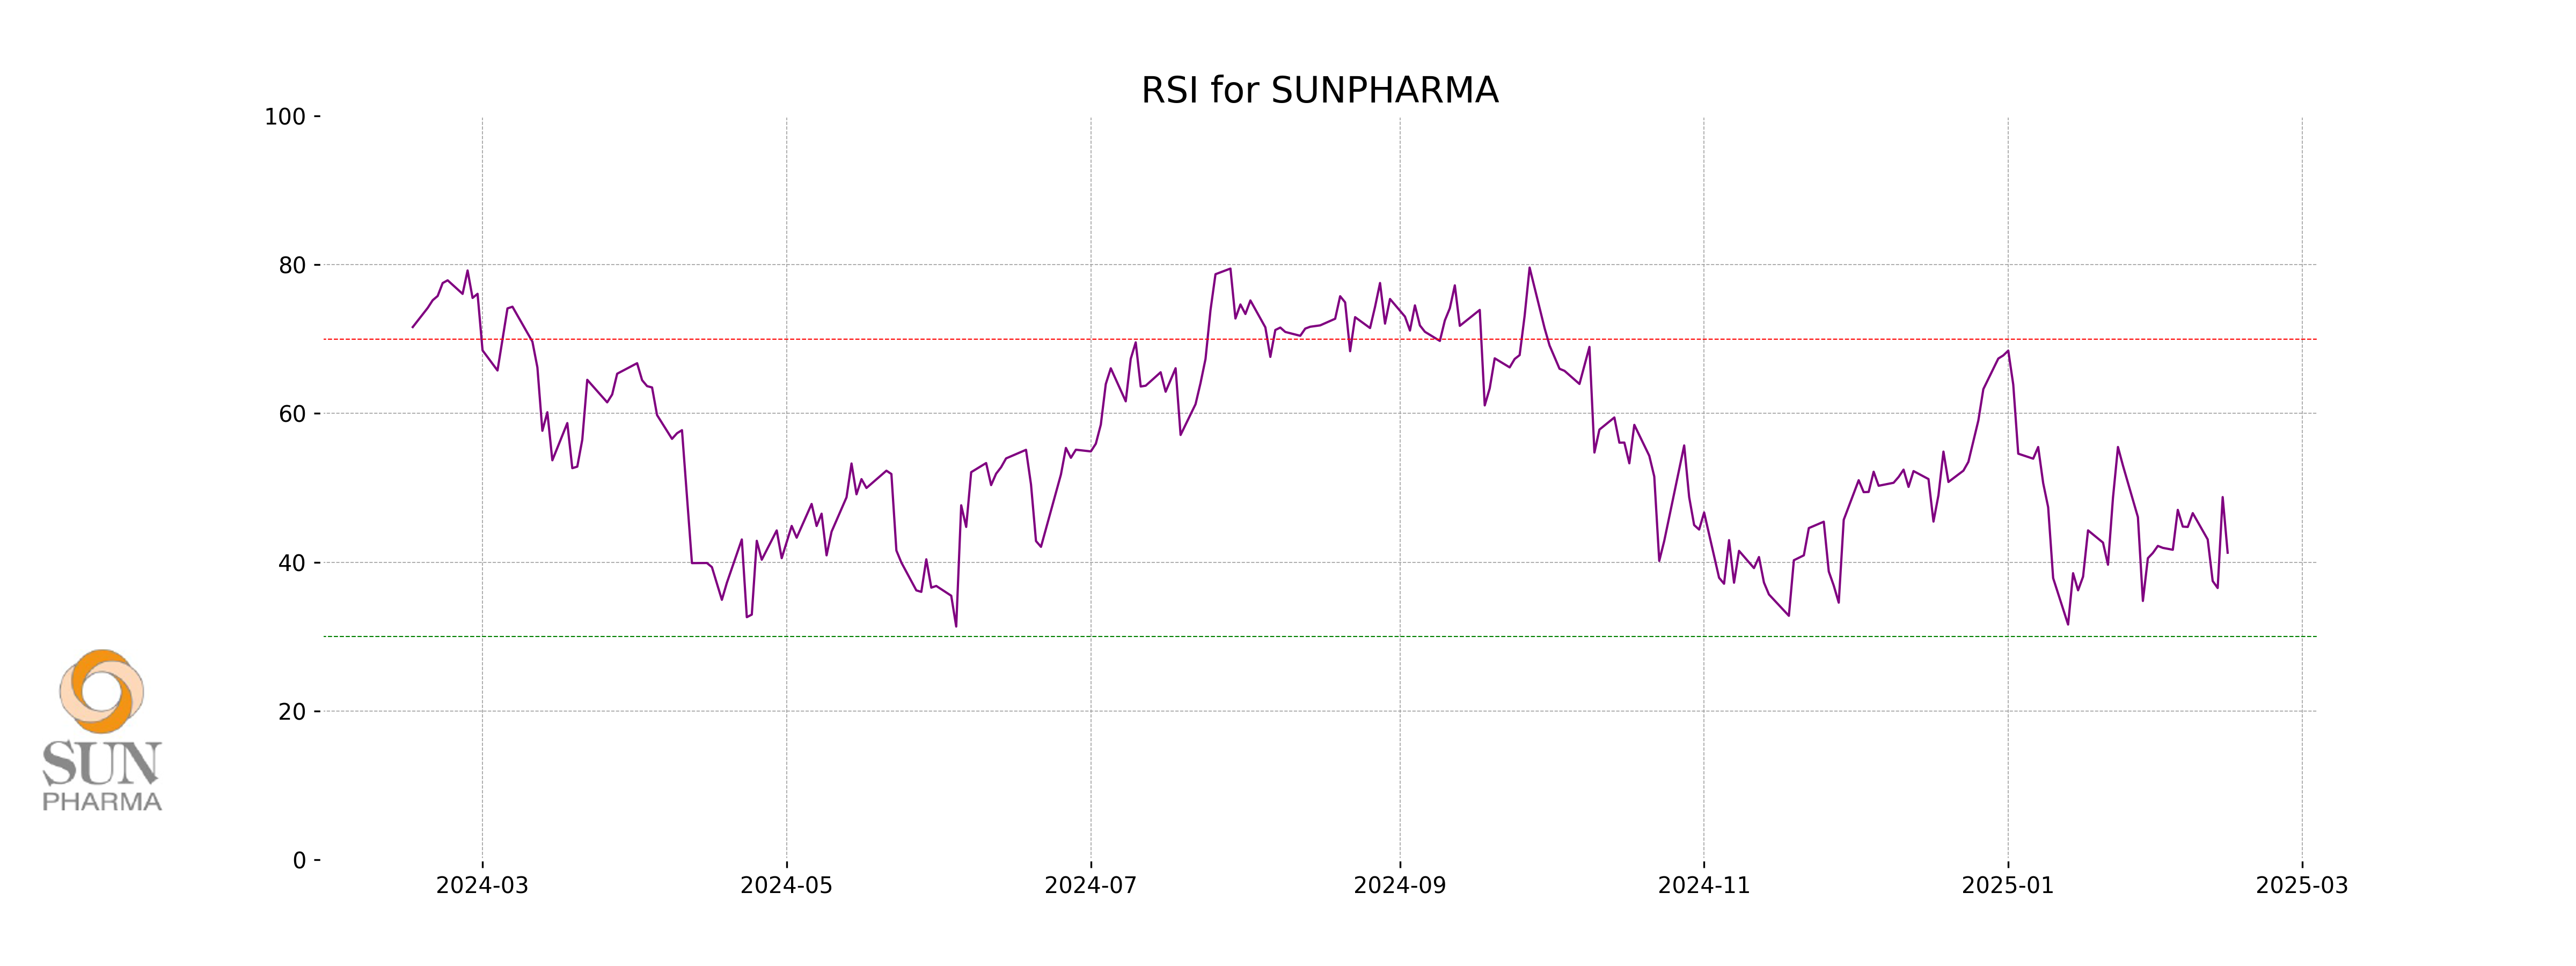
RSI Analysis
**RSI Analysis for SUN Pharma:** The RSI (Relative Strength Index) for Sun Pharma is 41.28, which suggests that the stock is approaching the oversold territory, as RSI values below 30 generally indicate oversold conditions. This level may indicate potential buying opportunities if the stock is perceived as undervalued compared to its historical performance.
Analysis for Trent - February 14, 2025
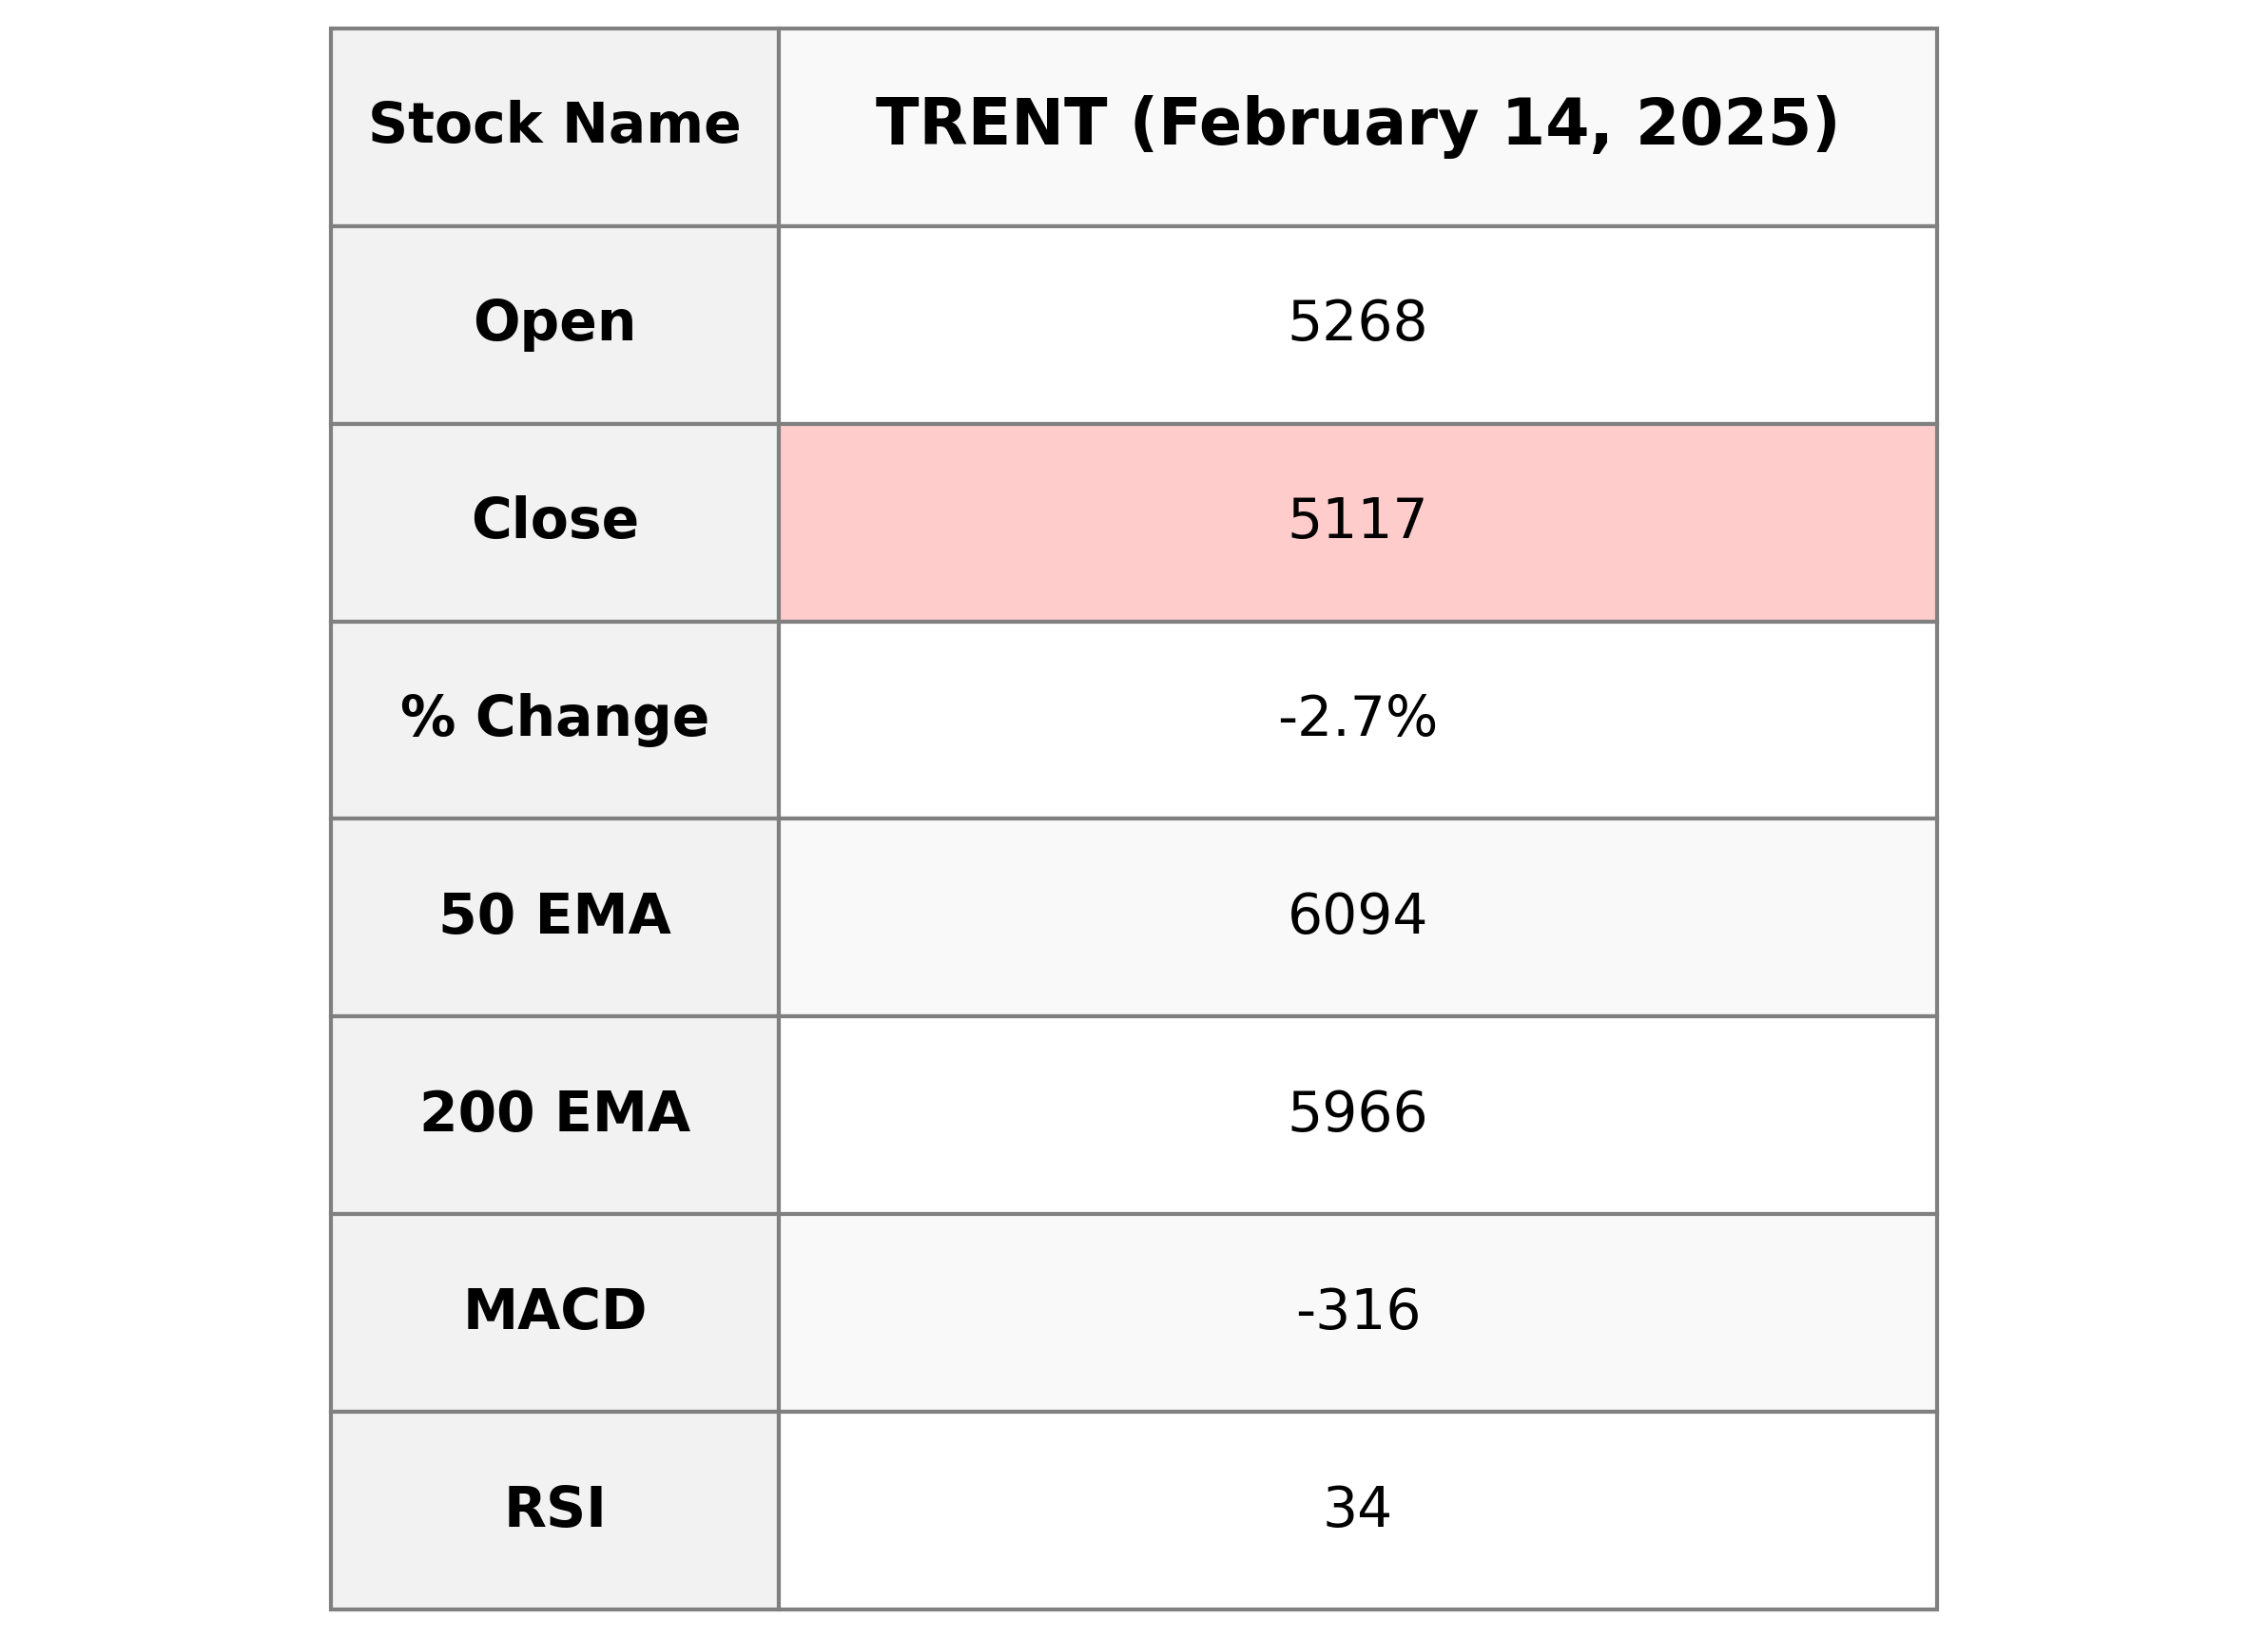
**Trent**: On the latest trading day, Trent opened at 5268.0 and closed lower at 5117.35, marking a decrease of approximately -2.65% from its previous close. The stock experienced a notable volume of 888,082, with an RSI of 34.14 suggesting potential oversold conditions. The company's market cap stands at approximately ₹1,819,878 crore, operating in the Consumer Cyclical sector, specifically in Apparel Retail in India.
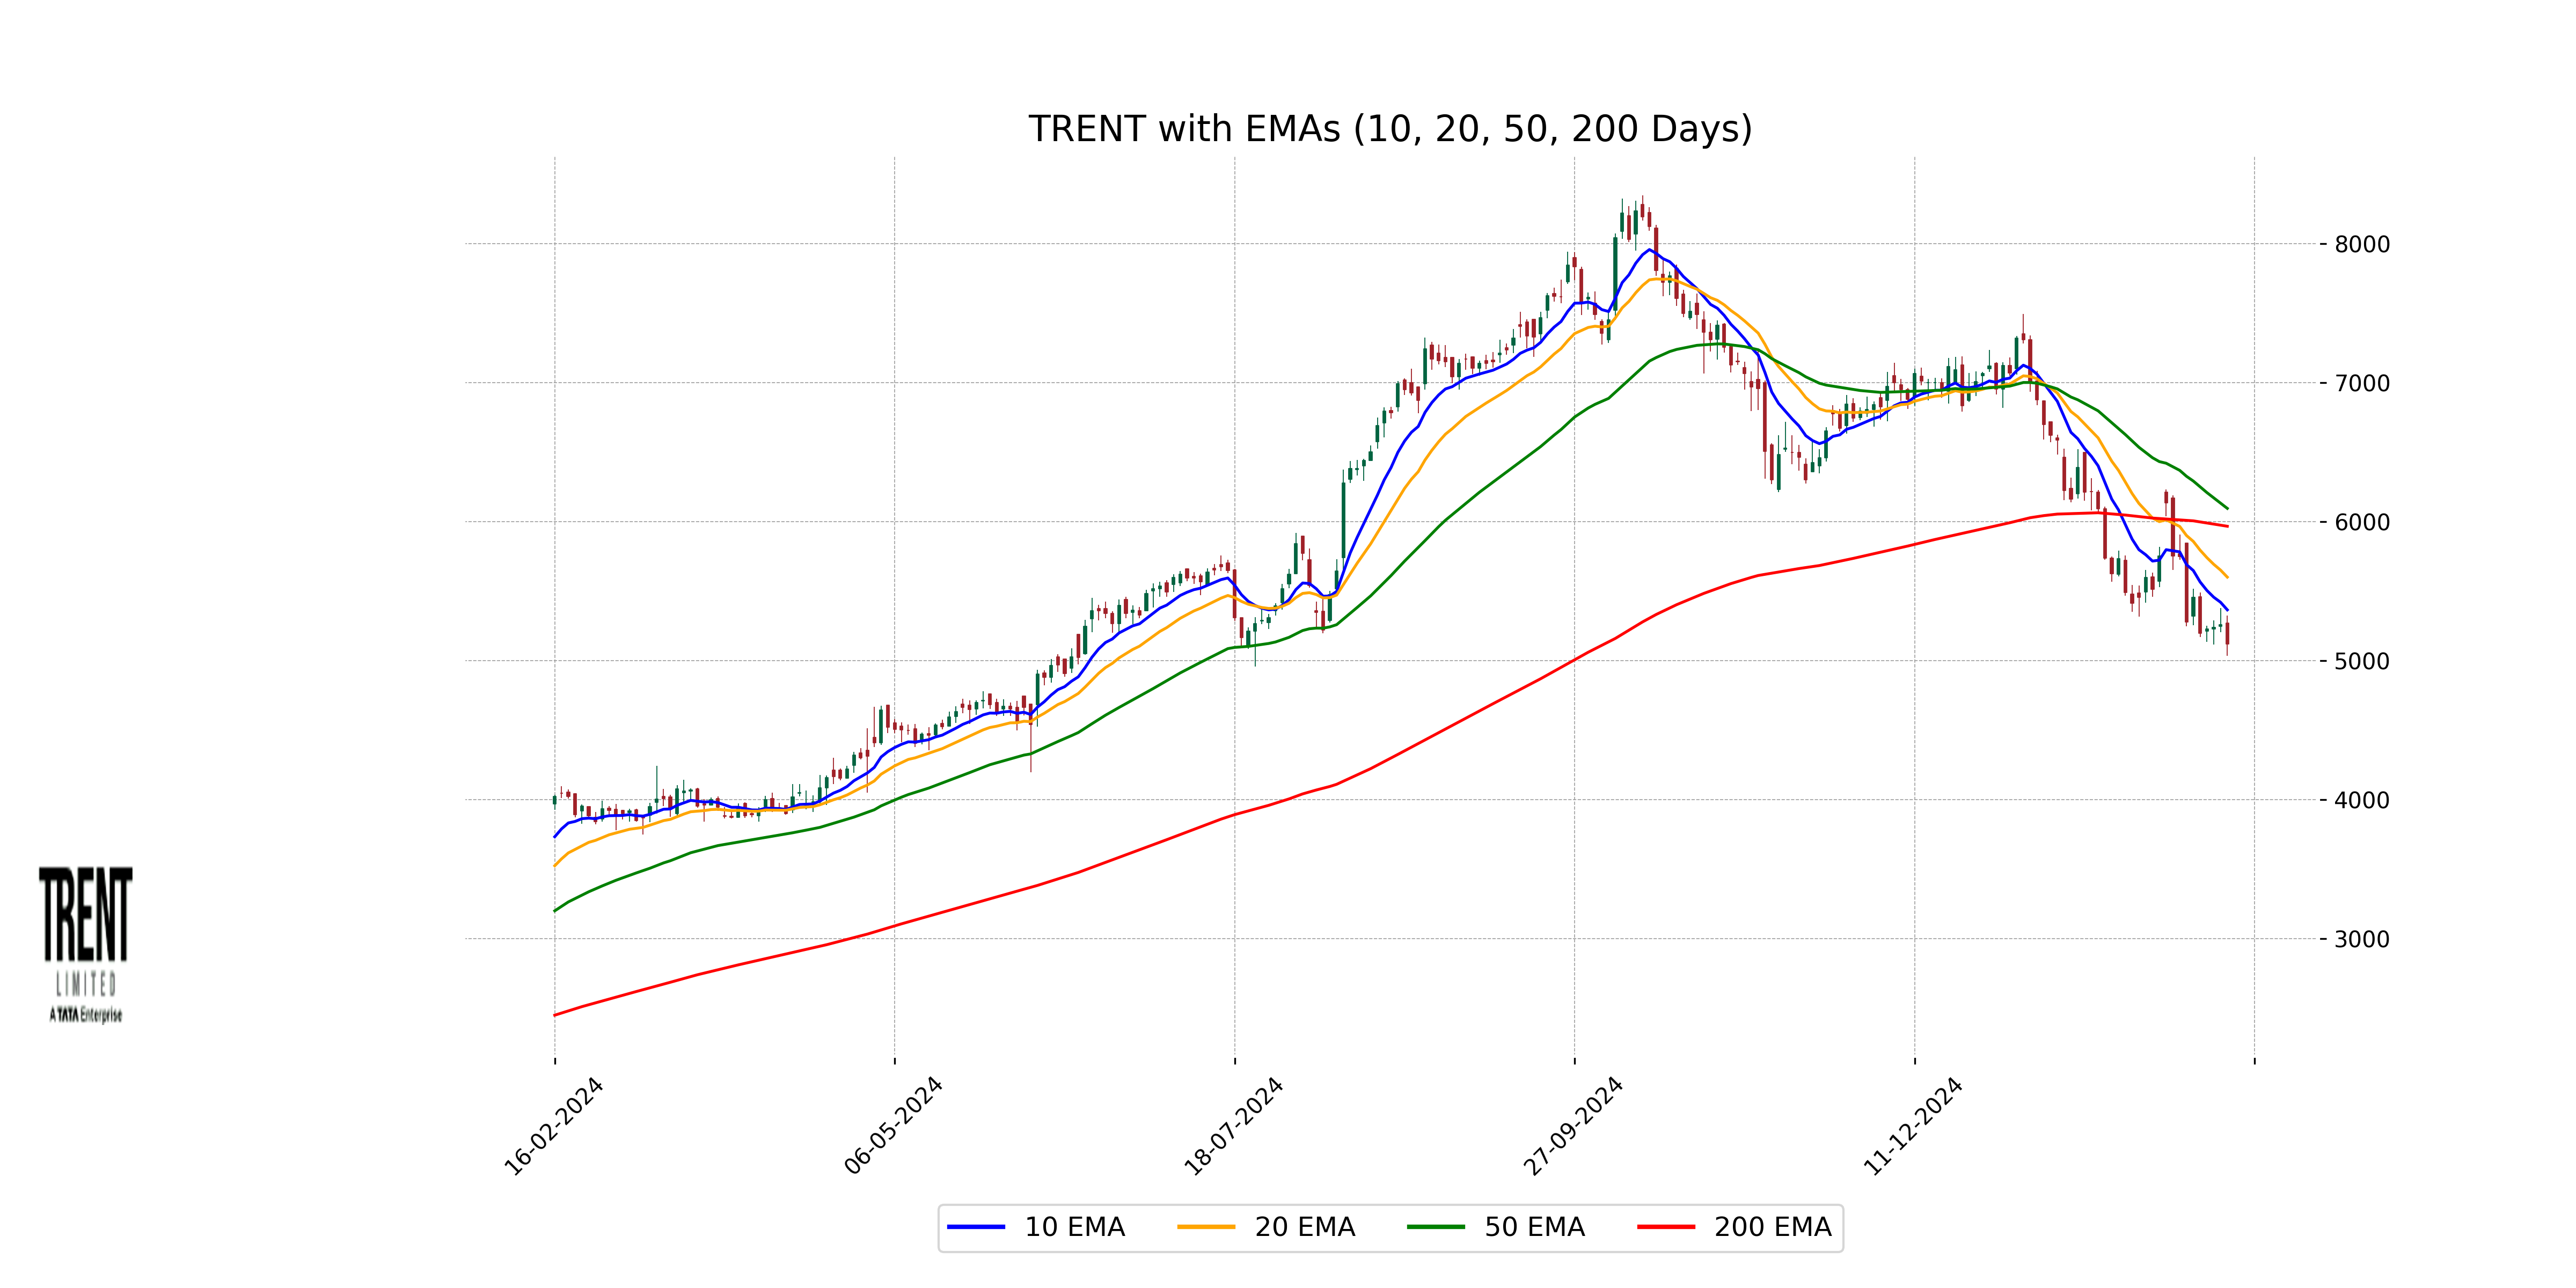
Relationship with Key Moving Averages
**Trent**'s current close price of 5117.35 is below its 50-day EMA of 6094.34 and 200-day EMA of 5965.88, indicating a bearish trend. Additionally, it is also below the 10-day EMA of 5364.47 and 20-day EMA of 5599.91, reinforcing short-term bearish momentum.
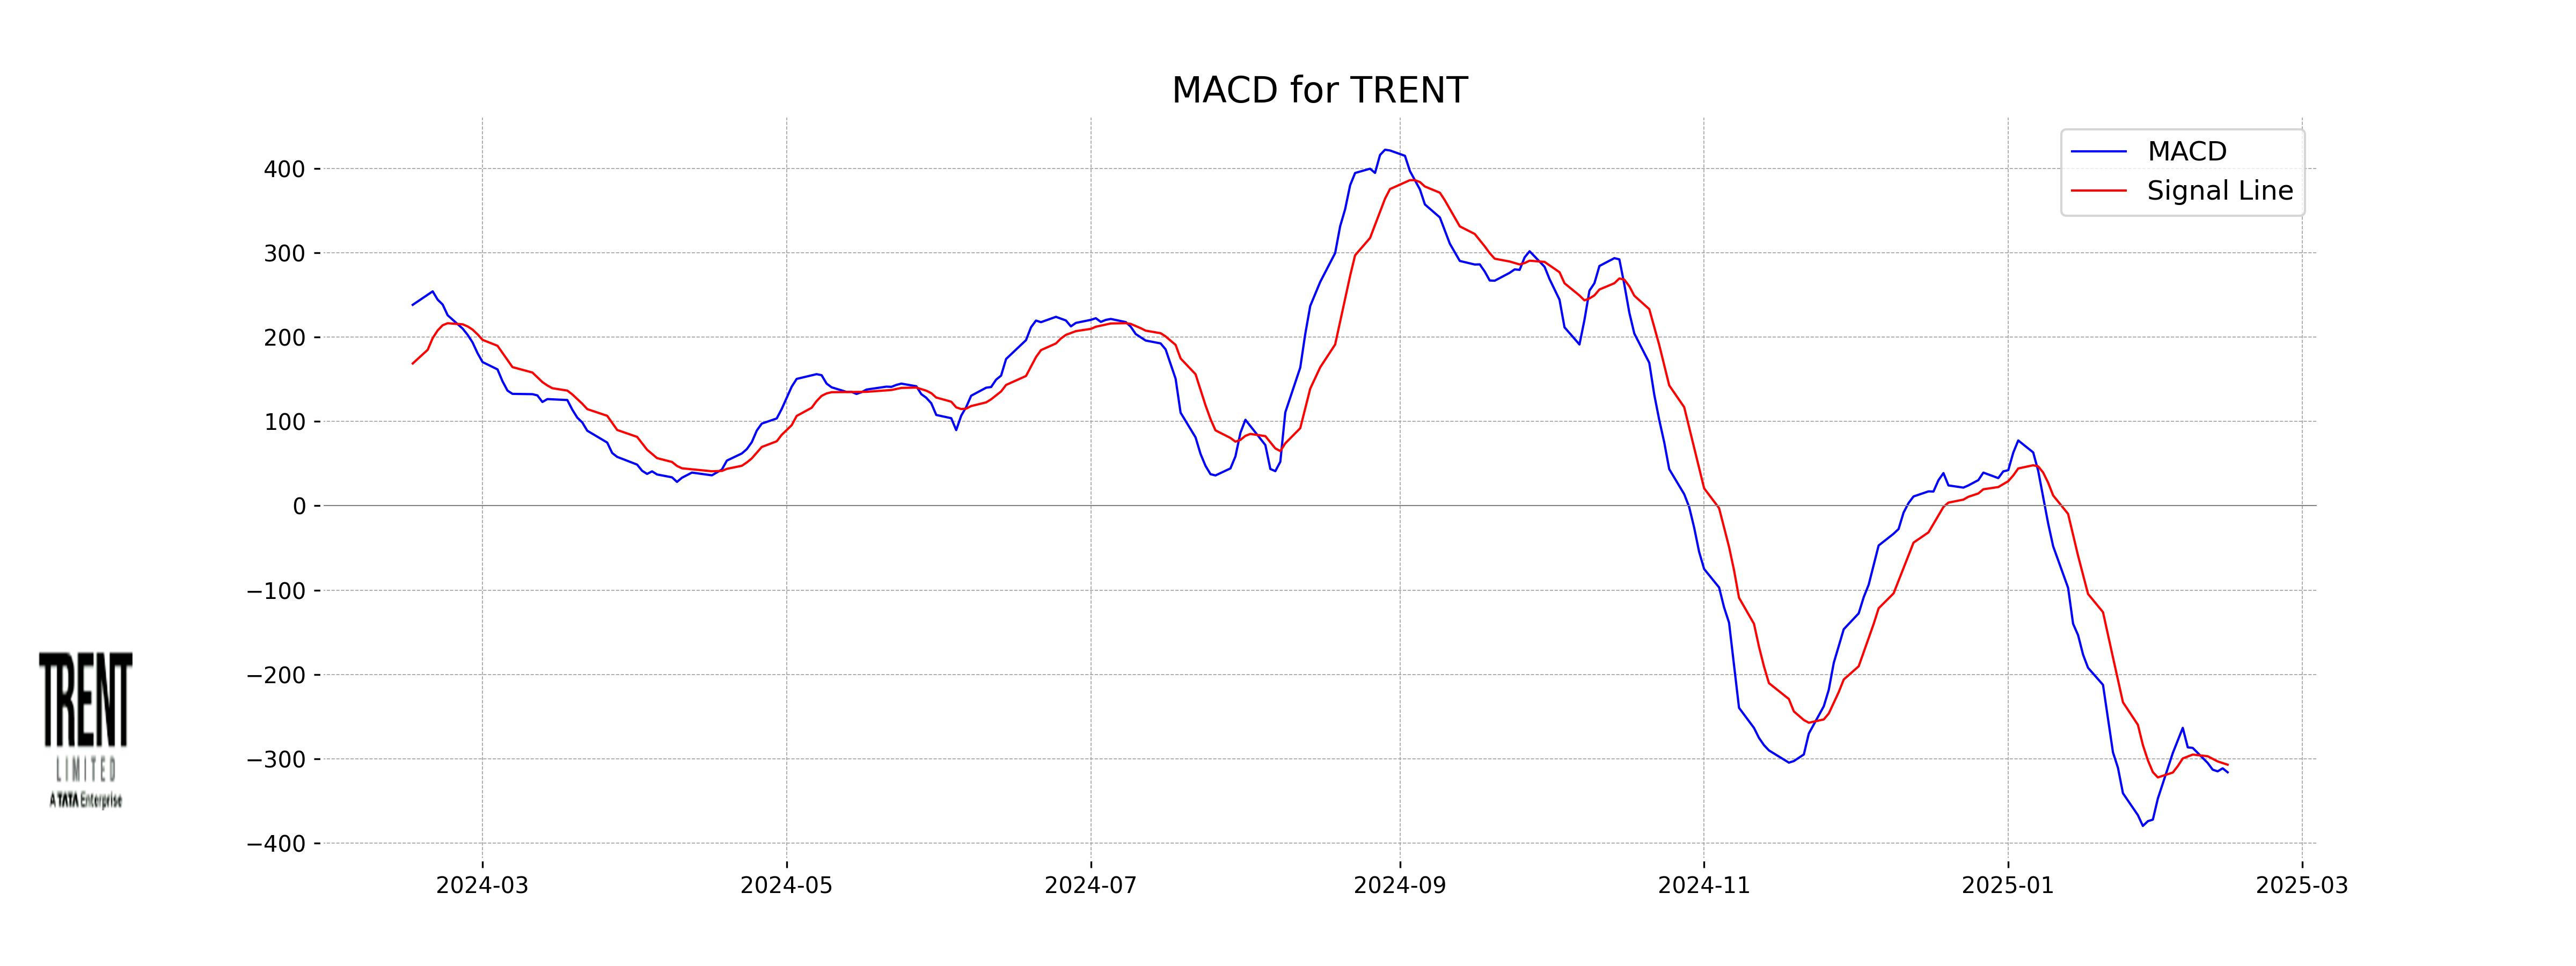
Moving Averages Trend (MACD)
The MACD for Trent is currently at -315.90, with a signal line at -306.88, indicating a bearish trend as it is below the signal line. The negative MACD value suggests that the stock's momentum is decreasing.
RSI Analysis
For Trent, the RSI (Relative Strength Index) is currently at 34.14, which indicates that the stock is nearing the oversold territory. This could suggest potential buying opportunities if the downward trend reverses.

Up Next

NSE Nifty 50 Top losers: What are the 5 Biggest Stock losers Today February 14, 2025

New Zealand commits USD 20 bn investment in India under FTA in 15 yrs; on lines of EFTA pact

India, New Zealand conclude FTA talks; pact to offer duty-free access, USD 20 bn FDI

FTA with New Zealand to significantly deepen bilateral economic engagement: Govt

Rupee breaches 91-mark against US dollar for first time in intra-day trade

Microsoft commits USD 17.5 billion investment in India: CEO Satya Nadella

More videos

CBI books Anil Ambani's son, Reliance Home Finance Ltd. in Rs 228 crore bank fraud case

RBI raises FY26 GDP growth projection to 7.3 pc

RBI trims policy interest rate by 25bps to 5.25pc, loans to get cheaper

Rupee slumps to all-time low of 90.25 against US dollar in intra-day trade

Reliance completes merger of Star Television Productions with Jiostar

India to lead emerging market growth with 7pc GDP rise in 2025: Moody’s

Nifty hits record high after 14 months; Sensex nears all-time peak

Reliance stops Russian oil use at its only-for-export refinery to comply with EU sanctions

ED attaches fresh assets worth over Rs 1,400 cr in case against Anil Ambani's Reliance Group

India signs one-year deal to import 2.2 million tonnes of LPG from US