


Highlights
- Technical analysis displays ITC.NS's downturn in the Nifty 50
- Bearish signs, like an RSI of 38.45, hint at overselling
- MACD trails the signal line, confirming negative momentum
Latest news

Krasha Plans To Launch USD 70Mn Category-II Multi-Asset Fund

Ekta Kapoor experiences cricket for the first time, enjoys T20 World Cup final with friends

India can sustain 8% growth over next two decades: Former CEA Krishnamurthy Subramanian

SCMS Bengaluru BBA Programme Strengthens Pathways for Corporate Careers and Premium MBA Opportunities

Puravankara Enters Joint Development Project on Hennur Road, Bengaluru GDV Over INR 1,300 Crore

International Women's Day 2026: Women Leaders Creating Impact and Driving Growth

Kisna Diamond and Gold Jewellery changes its name to 'Radha Diamond and Gold Jewellery' for a day to honour womanhood on Women's Day

Rakesh Sharma Launches book 'Dear Son, This Is Not Just a Business', A Wake-Up Call for Family Businesses
NSE Nifty 50: Top 5 stock losers of February 7, 2025


In this article, we will explore the technical indicators of some of the low-performing stocks on the Indian stock market, including ADANIPORTS, BRITANNIA, ITC, ONGC, and SBILIFE.
By looking at these stocks through the lens of key technical factors, we aim to better understand their price movements, trends, and potential future performance.

Analysis for Adani Ports - February 07, 2025

Adani Ports' recent stock performance shows a slight decline with a close of 1146.10, reflecting a -1.54% change from its previous close of 1164.05. The company's market capitalization stands at approximately 2.48 trillion INR. With an RSI value of 52.50, the stock is neither overbought nor oversold, and the negative MACD indicates a potential bearish trend. Adani Ports, operating in the Industrials sector and Marine Shipping industry, has a PE Ratio of 24.49.

Relationship with Key Moving Averages
Adani Ports is currently trading below its 50-day EMA of 1169.94 and significantly below its 200-day EMA of 1260.92, indicating a potential bearish trend. However, the stock is trading above its 10-day and 20-day EMAs, suggesting a short-term upward movement.
Moving Averages Trend (MACD)
Adani Ports currently shows a MACD of -10.42, which is below the MACD Signal of -21.68, indicating a potential bullish signal as the MACD may be crossing above the signal line. However, this should be considered alongside other indicators, as the RSI is neutral at 52.50, suggesting a balanced momentum.

RSI Analysis
Adani Ports has a Relative Strength Index (RSI) of 52.50, which suggests that the stock is in a neutral zone, neither overbought nor oversold. An RSI level around 50 often indicates a balance between buying and selling pressures.

Analysis for Britannia - February 07, 2025

**Britannia** Performance: Britannia saw a decrease in stock price, closing at ₹4870.5, a decline of 1.73% from the previous close. With a market cap of ₹1,173,834,301,440 and a current PE Ratio of 54.30, it operates within the Consumer Defensive sector and Packaged Foods industry in India. The stock's RSI of 42.71 indicates it is approaching oversold territory, while its MACD suggests a weakening bullish momentum.

Relationship with Key Moving Averages
Britannia's current close price of 4870.5 is below the 50-day EMA of 5007.33, 200-day EMA of 5217.65, and 10-day EMA of 4987.66. This indicates a bearish trend as the stock is trading below its key moving averages.
Moving Averages Trend (MACD)
Britannia's MACD value of 20.80 is currently below its MACD Signal line of 36.57, suggesting a bearish signal. This indicates recent downward momentum, which aligns with the RSI of 42.71, showing that the stock is somewhat approaching the oversold region.

RSI Analysis
**RSI Analysis for Britannia:** The Relative Strength Index (RSI) for Britannia stands at 42.71, indicating that the stock is neither overbought nor oversold. This suggests a neutral market sentiment, with potential for either upward or downward movement.

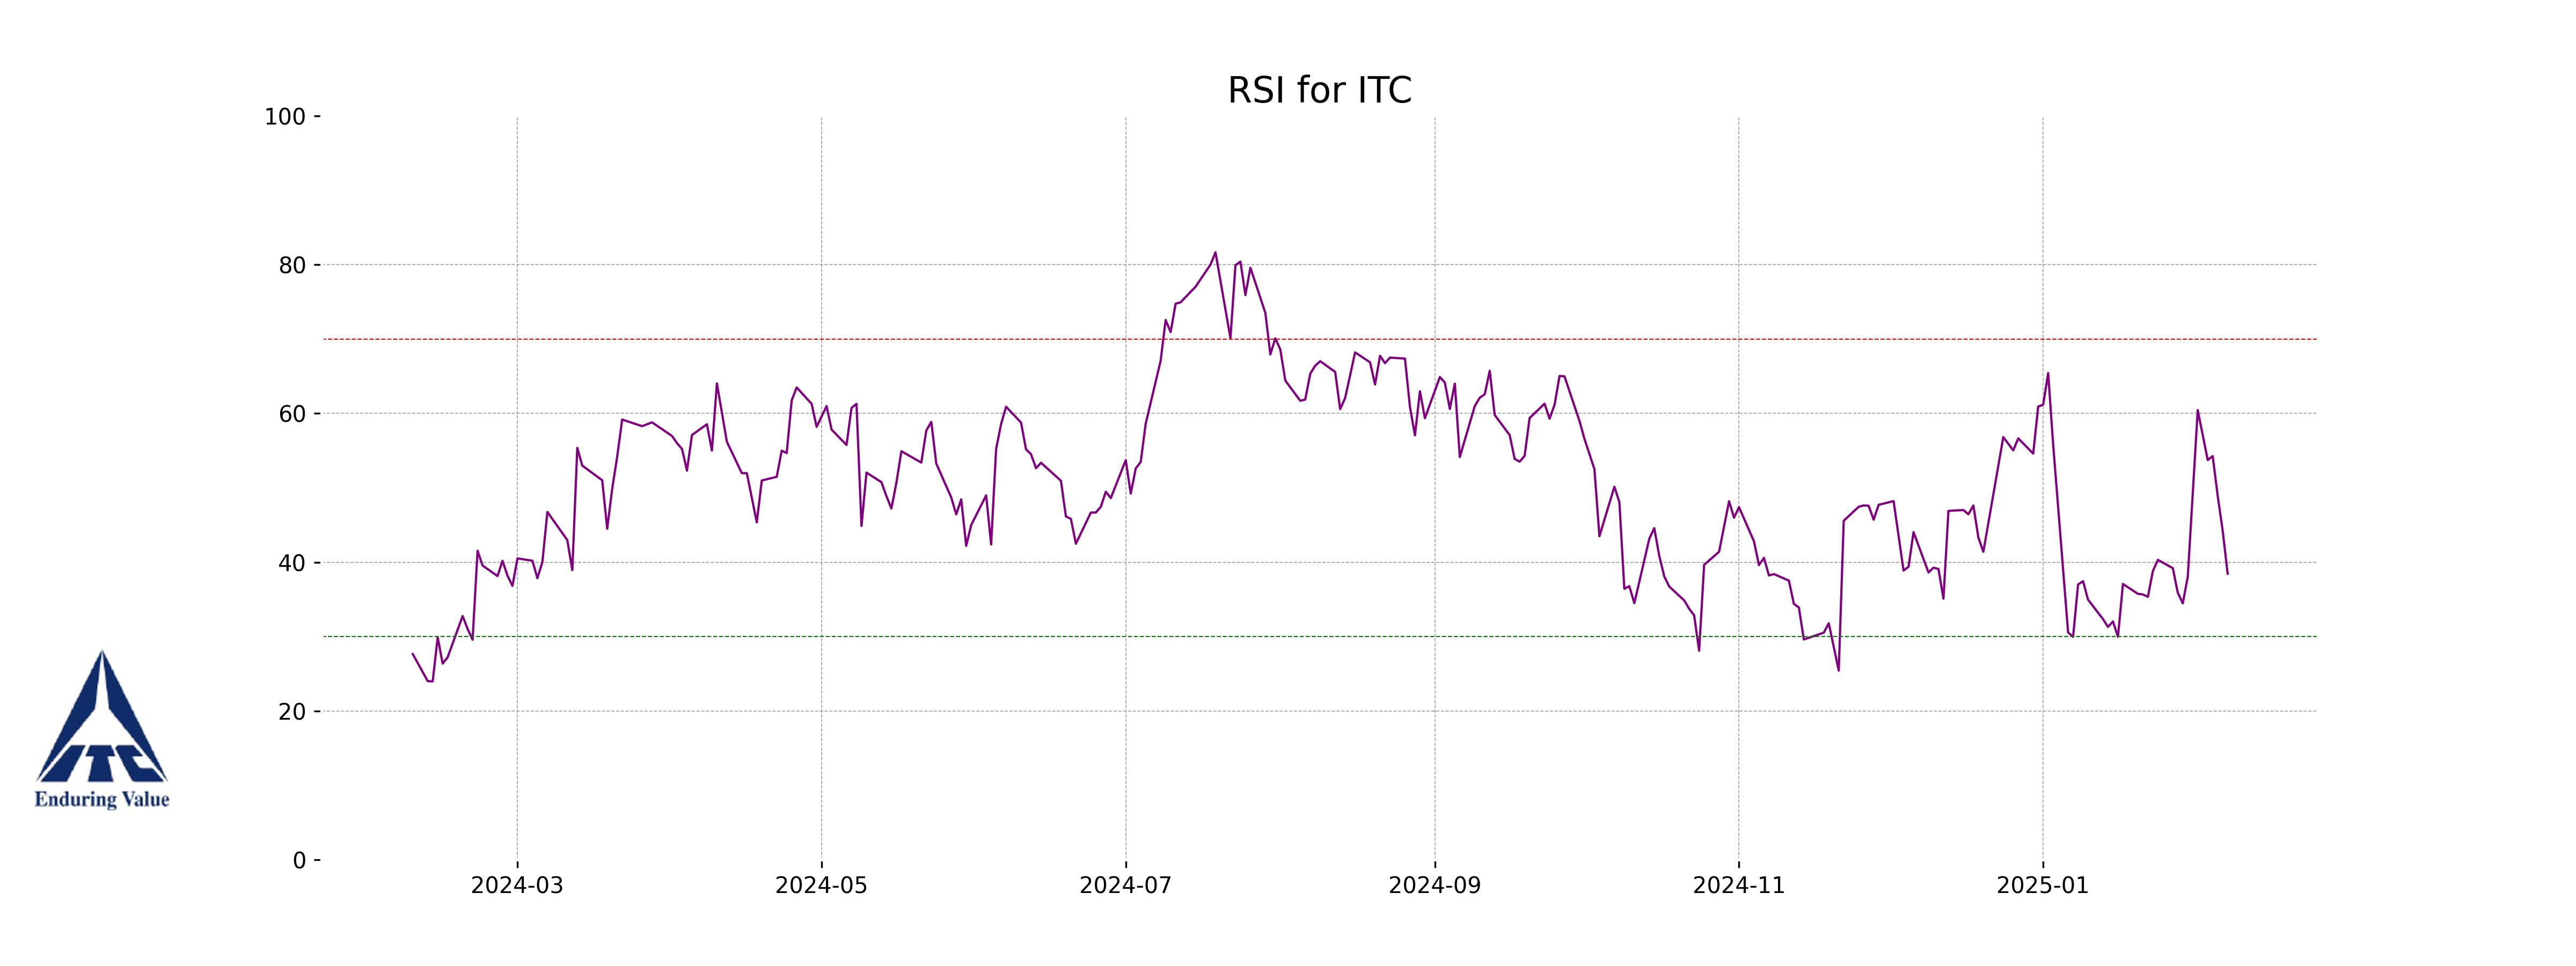
Analysis for ITC - February 07, 2025

**ITC Performance Summary** ITC's stock opened at 440.0 and closed at 430.85, indicating a decline of -2.32% from the previous close of 441.10. The stock experienced a high of 445.5 and a low of 428.40 during the trading session, with a significant trading volume of 18,866,657 shares. This performance is in the context of an RSI of 38.45, suggesting potential oversold conditions, and a MACD of -3.41, indicating bearish momentum.

Relationship with Key Moving Averages
The closing price of ITC at 430.85 is below its 50-day EMA of 454.93, 200-day EMA of 461.52, 10-day EMA of 443.69, and 20-day EMA of 445.54, indicating a bearish sentiment. The position relative to these key moving averages suggests downward momentum in the short to long term.
Moving Averages Trend (MACD)
ITC's MACD analysis indicates that the stock is currently in a bearish trend, as the MACD line is below the MACD Signal line with a negative value of -3.41. Additionally, the RSI is below 40, suggesting that the stock could be in an oversold territory.

RSI Analysis
The RSI for ITC is 38.45, indicating that the stock is approaching the oversold territory. A reading below 30 would typically suggest that the stock is oversold and could be due for a price reversal, but at 38.45, it signals potential weakness with bearish momentum.
Analysis for ONGC - February 07, 2025

**ONGC Performance Overview** ONGC experienced a slight decline in stock performance, closing at 248.90 INR, down by 0.90% from the previous close. The trading volume was robust at approximately 10.1 million shares. Technical indicators such as the RSI at 48 suggest a neutral momentum, while the MACD indicates a potential bearish signal. The stock holds a market cap of approximately 3.13 trillion INR, with a PE ratio of 8.02, underlining its position in the Energy sector, specifically within the Oil & Gas Integrated industry in India.

Relationship with Key Moving Averages
The closing price of ONGC is below the 50-day EMA of 251.98 and the 200-day EMA of 255.38, indicating potential bearish momentum. Additionally, ONGC's close is below the 10-day and 20-day EMAs, suggesting short-term weakness against these key moving averages.
Moving Averages Trend (MACD)
### MACD Analysis for ONGC The MACD for ONGC is 0.0024, with a MACD Signal of 0.5495. This suggests a potential bearish trend since the MACD line is below the MACD Signal line, indicating possible selling pressure.

RSI Analysis
Certainly! The current RSI for ONGC is 48.00, indicating a neutral position as it sits close to the mid-point of 50 in the RSI scale. This suggests that the stock is neither overbought nor oversold at this time.

Analysis for SBI Life - February 07, 2025

**SBI Life Performance:** SBI Life observed a modest price increase with a closing value of 1470.95 after an opening of 1472.45, showcasing a small gain of 0.40%. The 10-EMA and 20-EMA indicate a bullish sentiment compared to the previous close, while the RSI of 52.03 suggests balanced trading momentum. Despite the current price being below the 50 and 200 EMAs, the PE Ratio of 61.21 reflects robust market expectations in the insurance sector.

Relationship with Key Moving Averages
SBI Life's current closing price of 1470.95 is slightly below its 50-day EMA of 1478.26, indicating a short-term bearish sentiment. However, it remains significantly below the 200-day EMA of 1536.16, suggesting a longer-term bearish trend. The price is above its 10-day and 20-day EMAs, indicating some short-term positivity.
Moving Averages Trend (MACD)
SBI Life's MACD value is 2.0365, which is above its MACD Signal line of 1.2546. This suggests a bullish momentum as the MACD is positive and above the signal line, indicating potential upward price movement. However, it's important to consider other indicators such as RSI and EMAs for a comprehensive analysis.

RSI Analysis
**RSI Analysis for SBI Life:** The Relative Strength Index (RSI) for SBI Life is 52.03, which indicates a neutral market position. An RSI value around 50 suggests that the stock is neither overbought nor oversold, making it relatively stable in the current market conditions.

Up Next
NSE Nifty 50: Top 5 stock losers of February 7, 2025

India's GDP expected to register over 8 pc growth in Sep-Dec: Report

Govt announces seven measures to help boost exports

RBI keeps interest rates on hold after US trade deal boosts outlook

RBI proposes to compensate customers up to Rs 25,000 loss due to fraud

RBI raises GDP growth projection of Q1, Q2 of FY27

More videos

RBI pauses rate cuts, retains interest rate at 5.25 pc

Rupee jumps 122 paise to close at 90.27 against US dollar on India-US trade deal

Stock markets cheer India-US trade deal: Sensex, Nifty surge 2.5 pc

UPI transactions hit record high of Rs 230 lakh crore in 2025-26 till Dec: Govt

Explained: India-US trade deal, tariffs and trade benefits

Trade deal with US adds momentum to India's growth ambition: Industry leaders

Rupee jumps 119 paise to 90.30 against the US dollar on India-US trade deal

President Trump announces US-India trade deal, lowers tariffs from 25 pc to 18 pc

Stock markets cheer India-US trade deal: Sensex jumps over 5 pc; Nifty nears all-time high

Sustaining 7–8% growth top priority to create jobs: FM Nirmala Sitharaman