


Highlights
- Technical indicators point to a bearish sentiment for TRENT.NS
- Investors may want to watch for changes in RSI and MACD values
- Bharat Electronics experienced a slight downturn
Latest news

Oppo Enco Buds3 Pro+ Review: ANC That Actually Works Under ₹2,500

Permission denied for Vijay Hazare trophy match at Chinnaswamy Stadium on December 24

Protesters march to Bangladesh Deputy High Commission in Kolkata to protest violence on Hindus

BJP’s national working president Nitin Nabin leads roadshow in Patna

Bangladesh summons Indian envoy over security concerns for missions

Passenger beaten by off-duty Air India Express pilot suffers nasal fracture, seeks justice

Over 270 flights delayed, 10 cancelled at Delhi airport

Fresh snowfall, rain hit parts of Kashmir as temperatures stay above freezing point
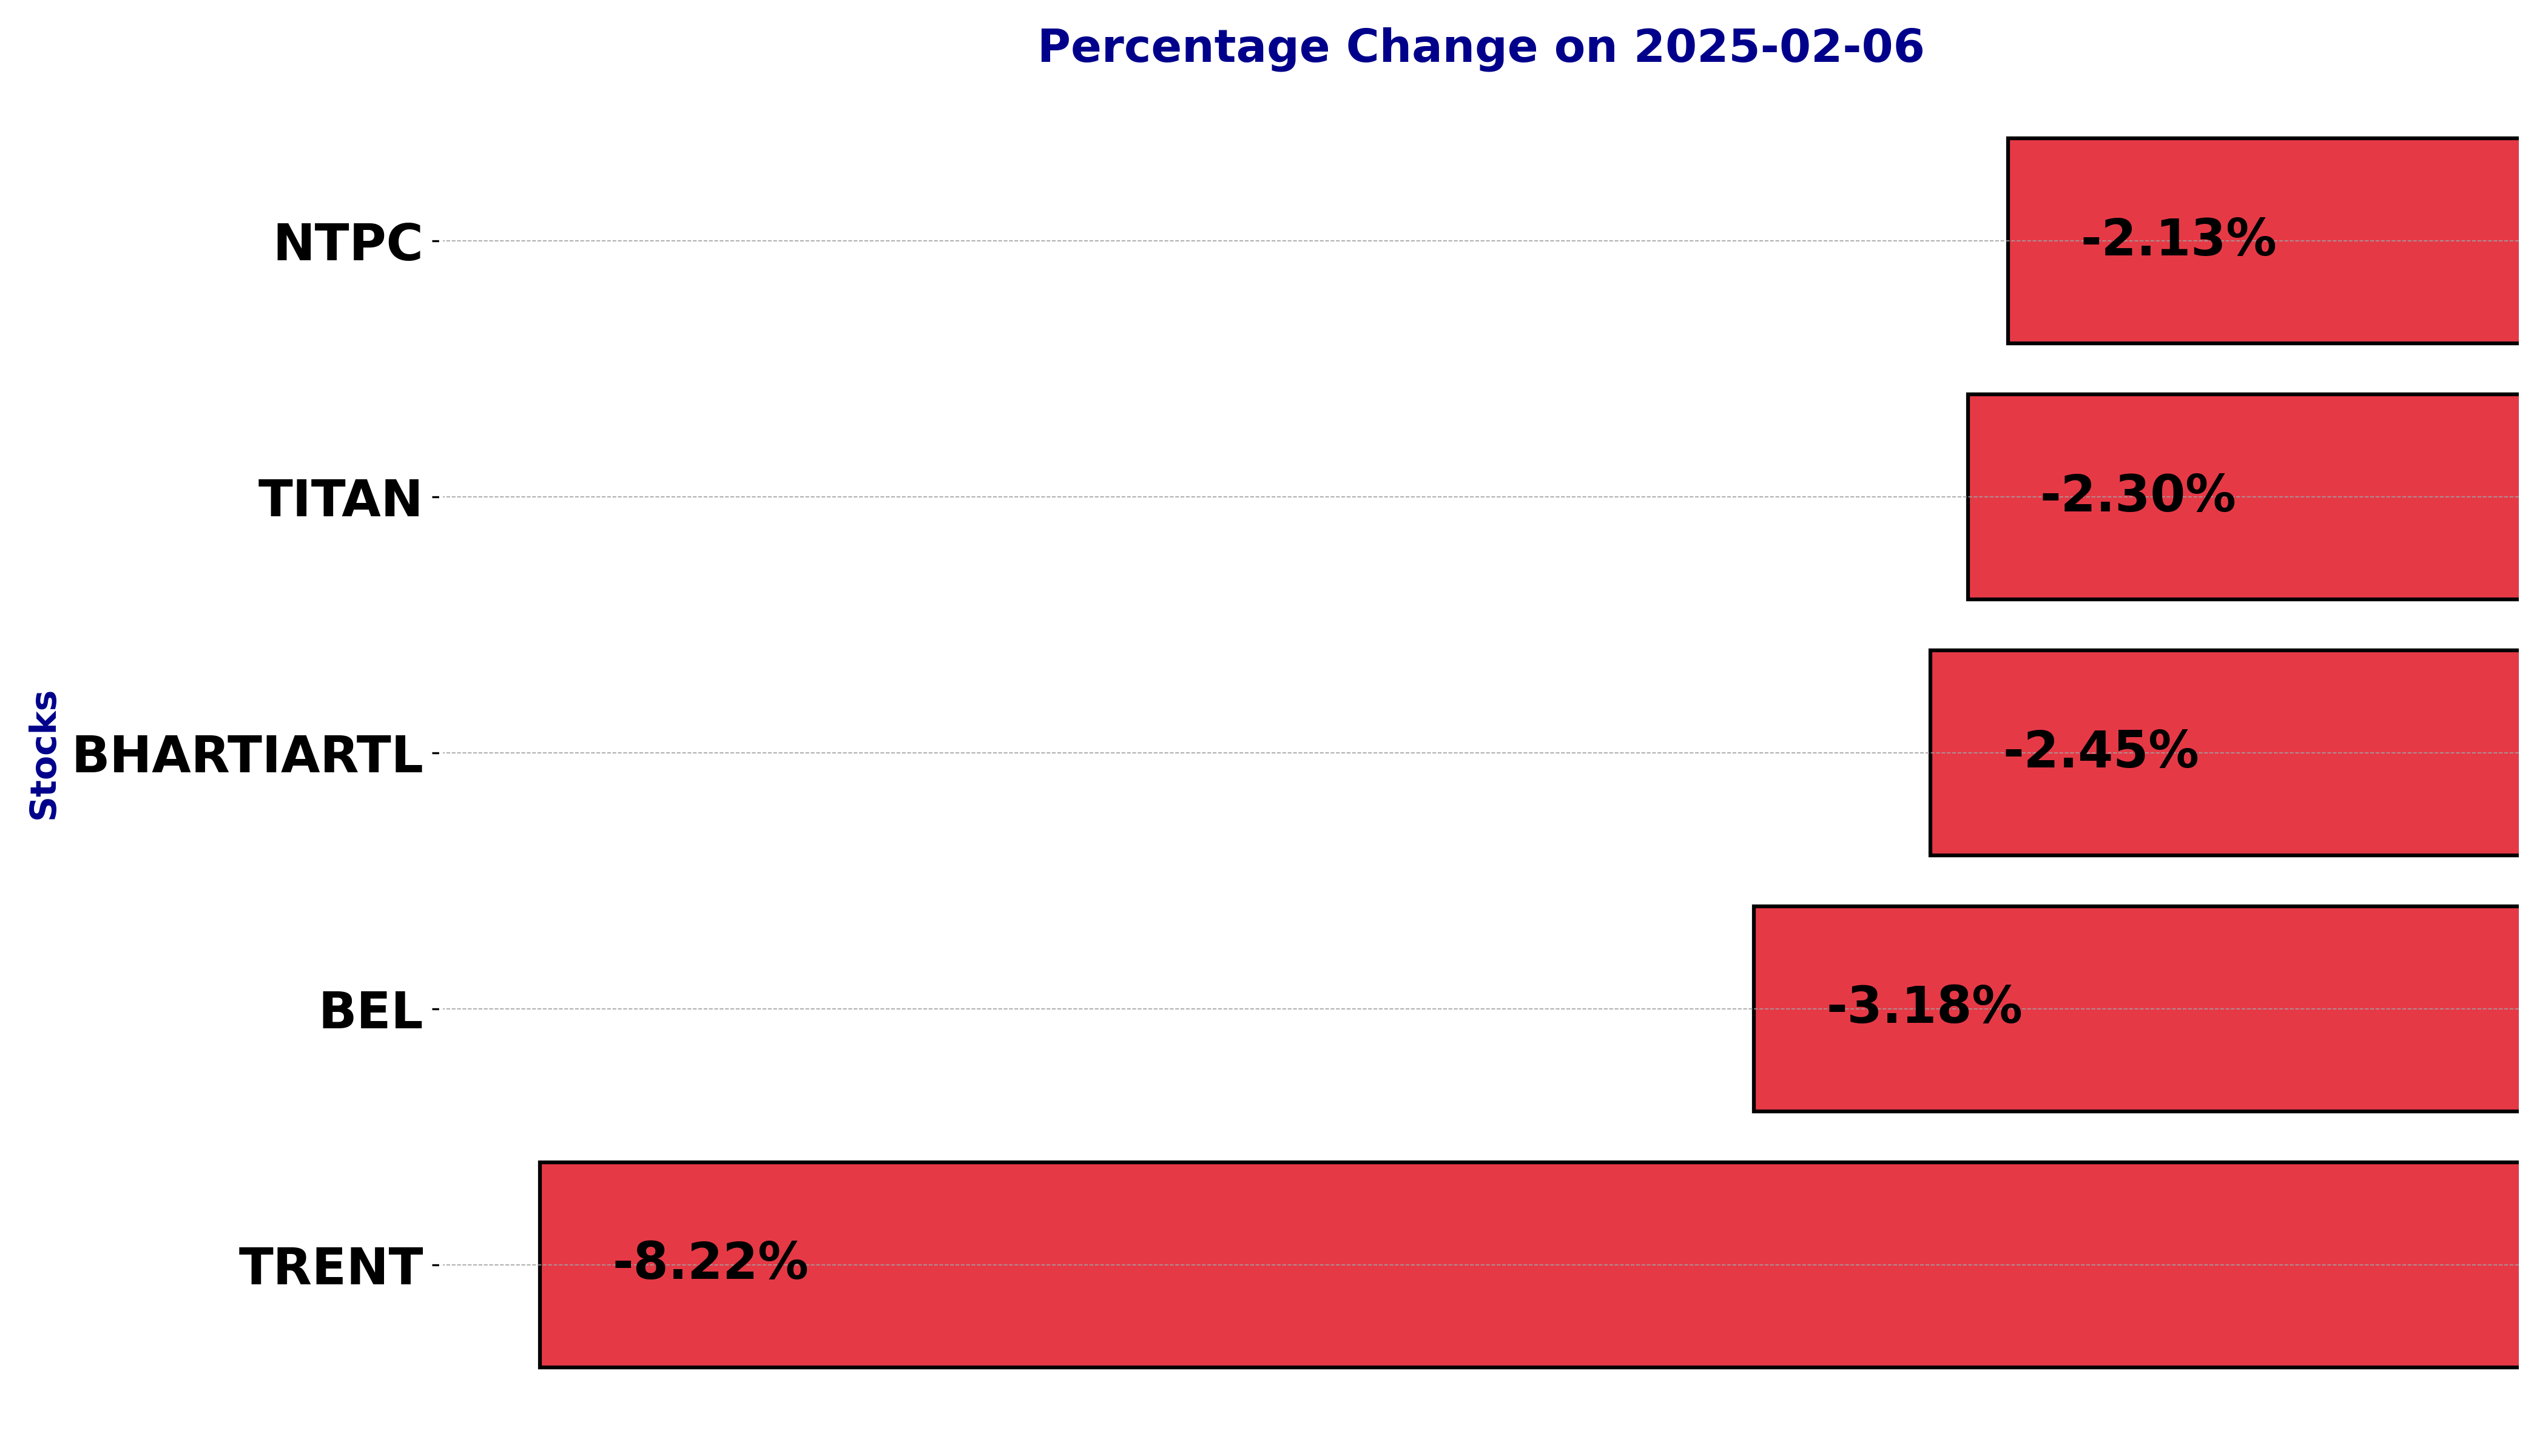
NSE Nifty 50: Top 5 stock losers of February 6, 2025


In this article, we will explore the technical indicators of some of the low-performing stocks on the Indian stock market, including BEL, BHARTIARTL, NTPC, TITAN, and TRENT.
By looking at these stocks through the lens of key technical factors, we aim to better understand their price movements, trends, and potential future performance.
Analysis for Bharat Electronics - February 06, 2025
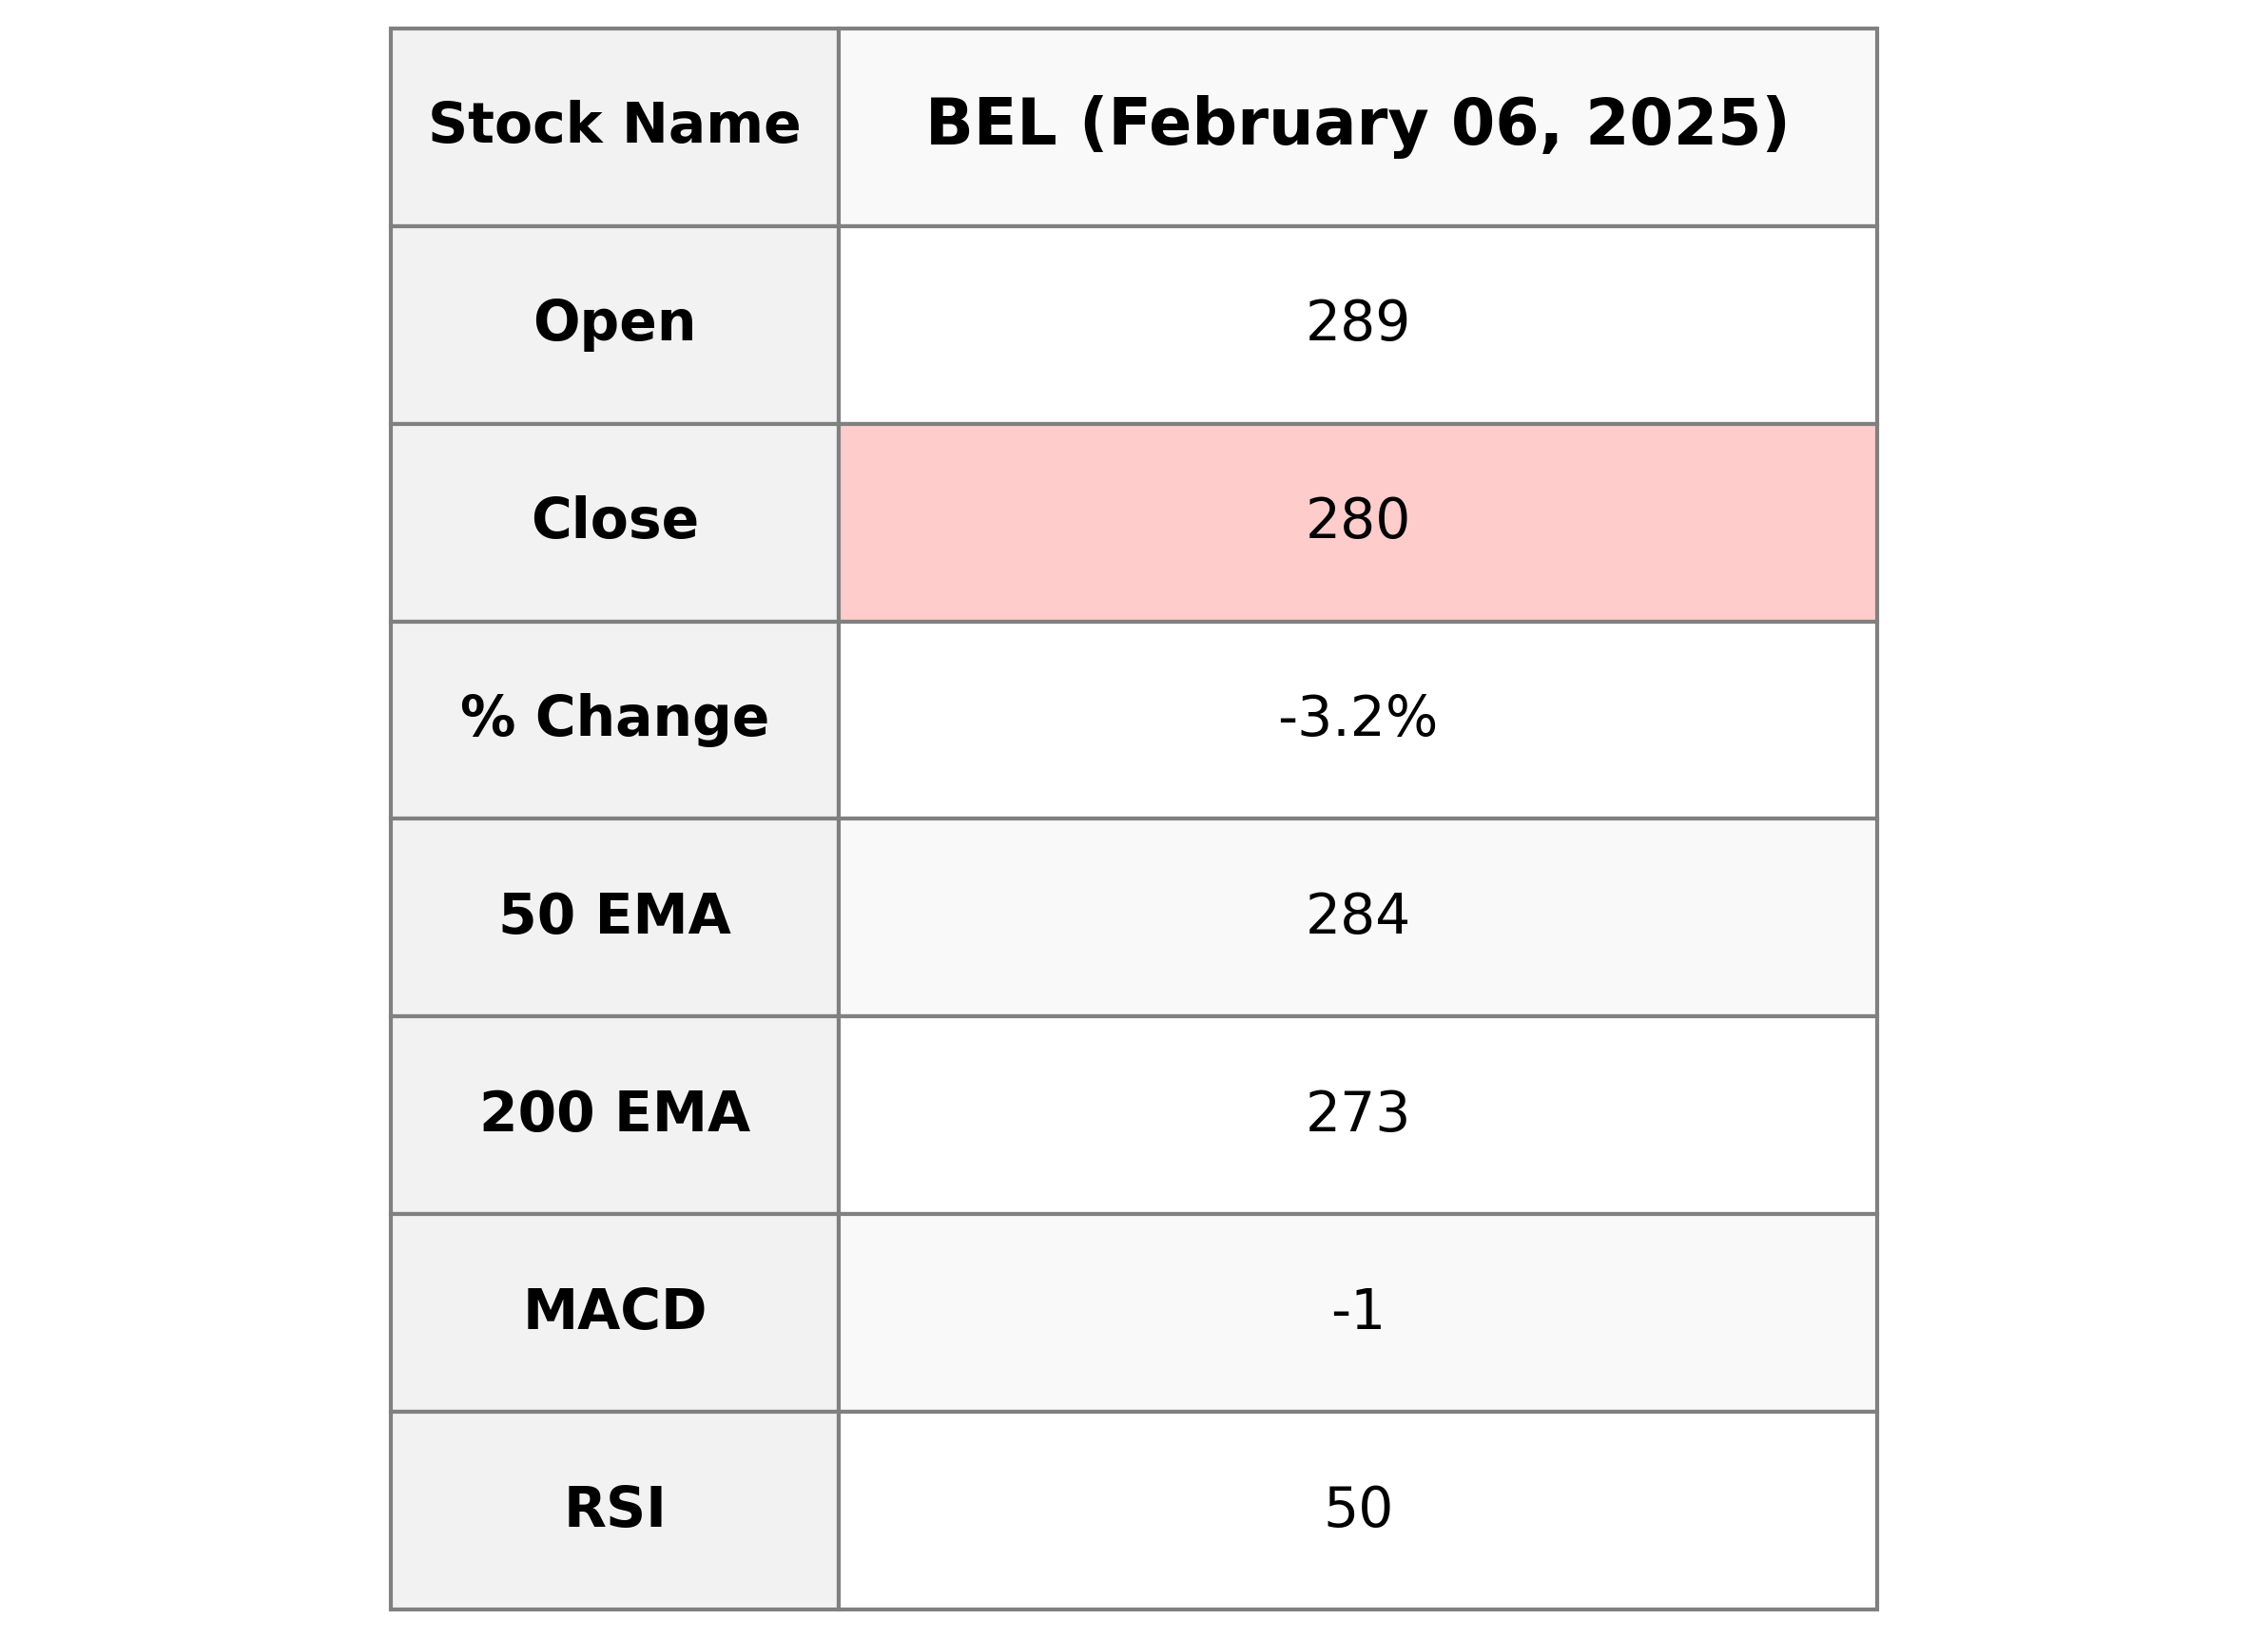
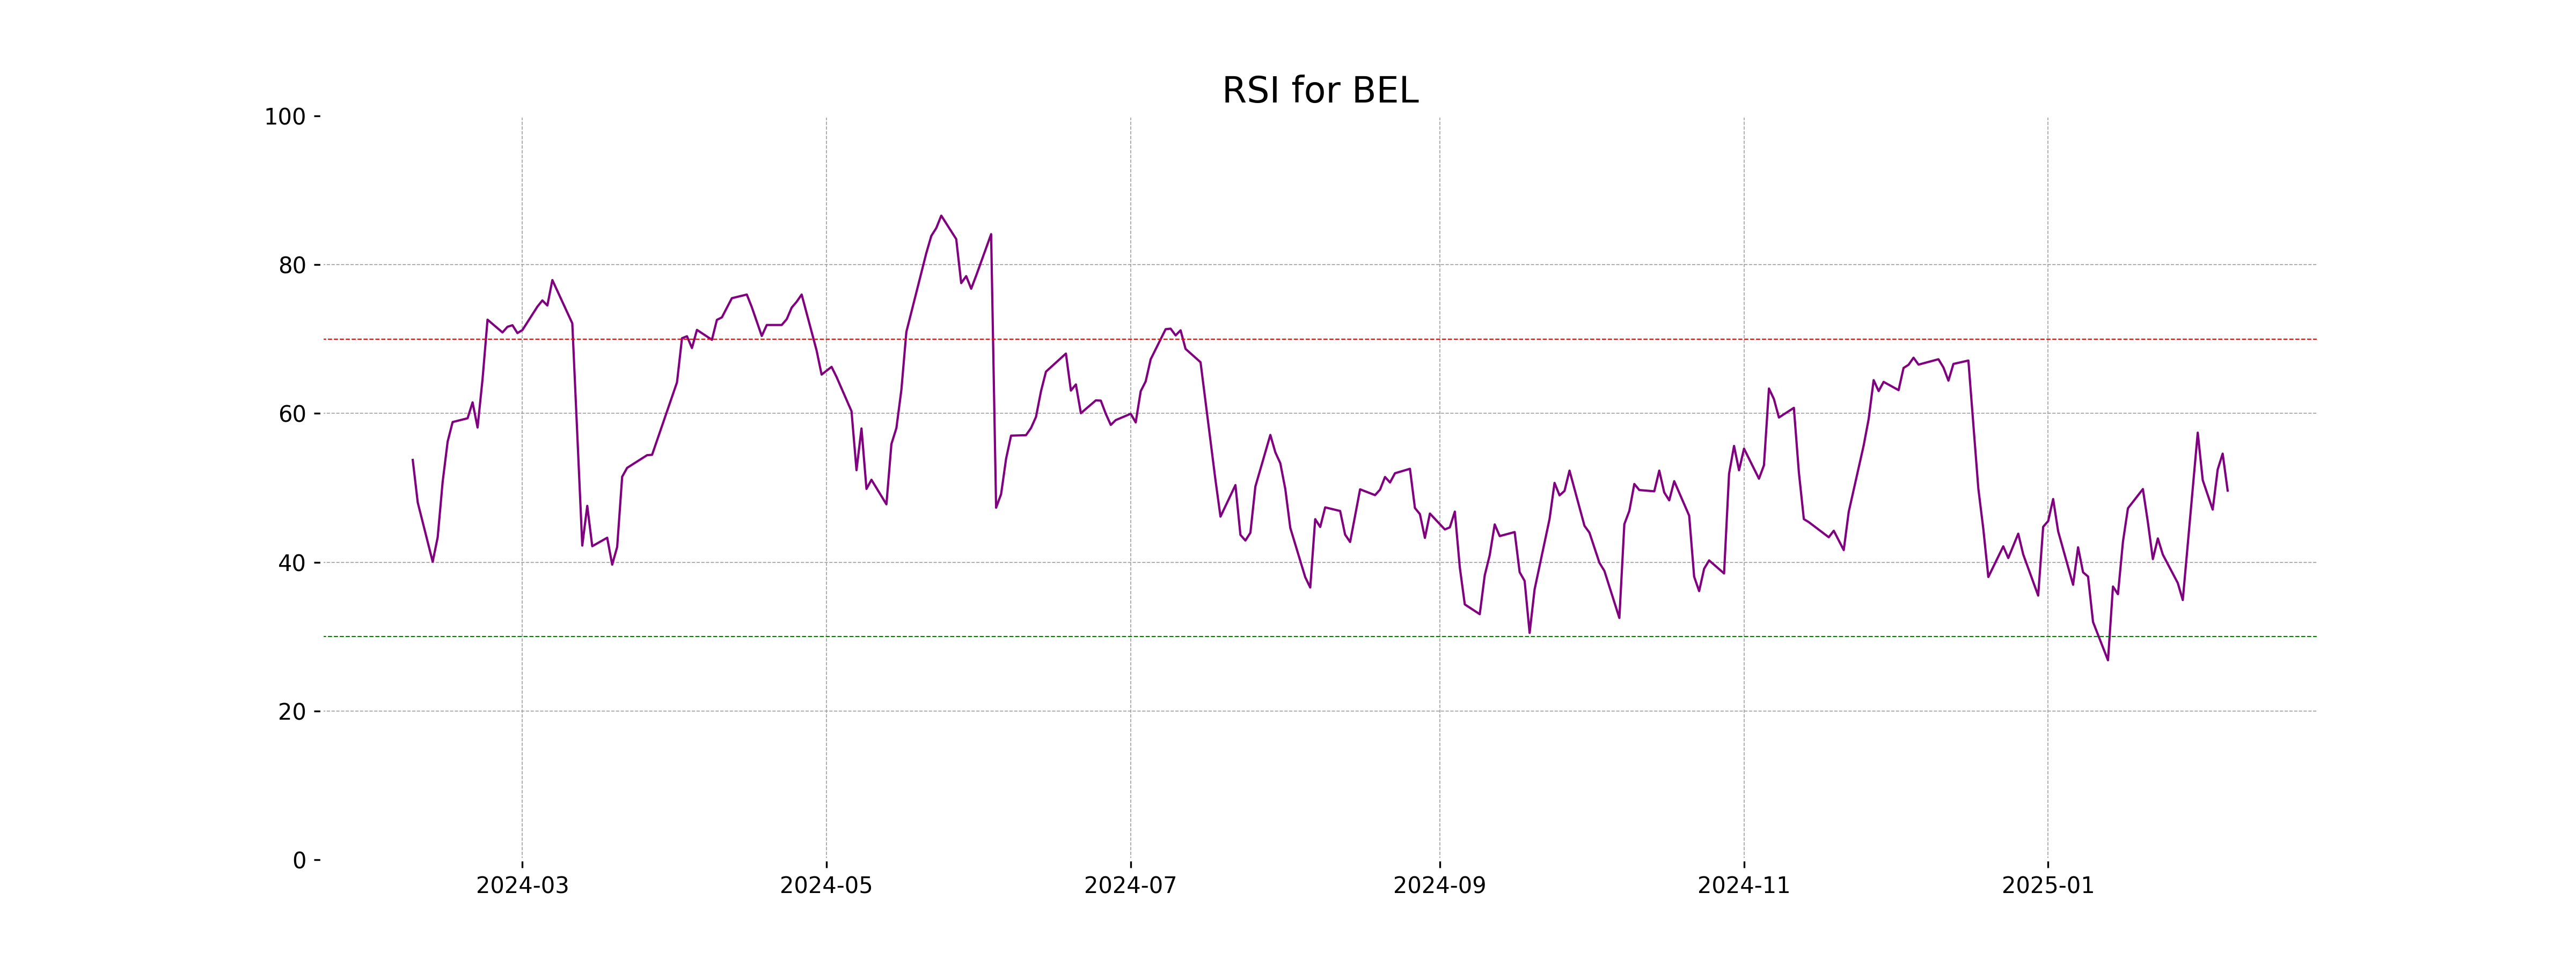
Bharat Electronics experienced a slight downturn with a closing price of 279.75, down by 3.18% from its previous close of 288.95. The stock's movement today saw a high of 289.95 and a low of 279. Despite the decline, its RSI is at 49.63, suggesting that it's nearing oversold territory. The stock is part of the Industrials sector, specifically in the Aerospace & Defense industry in India.
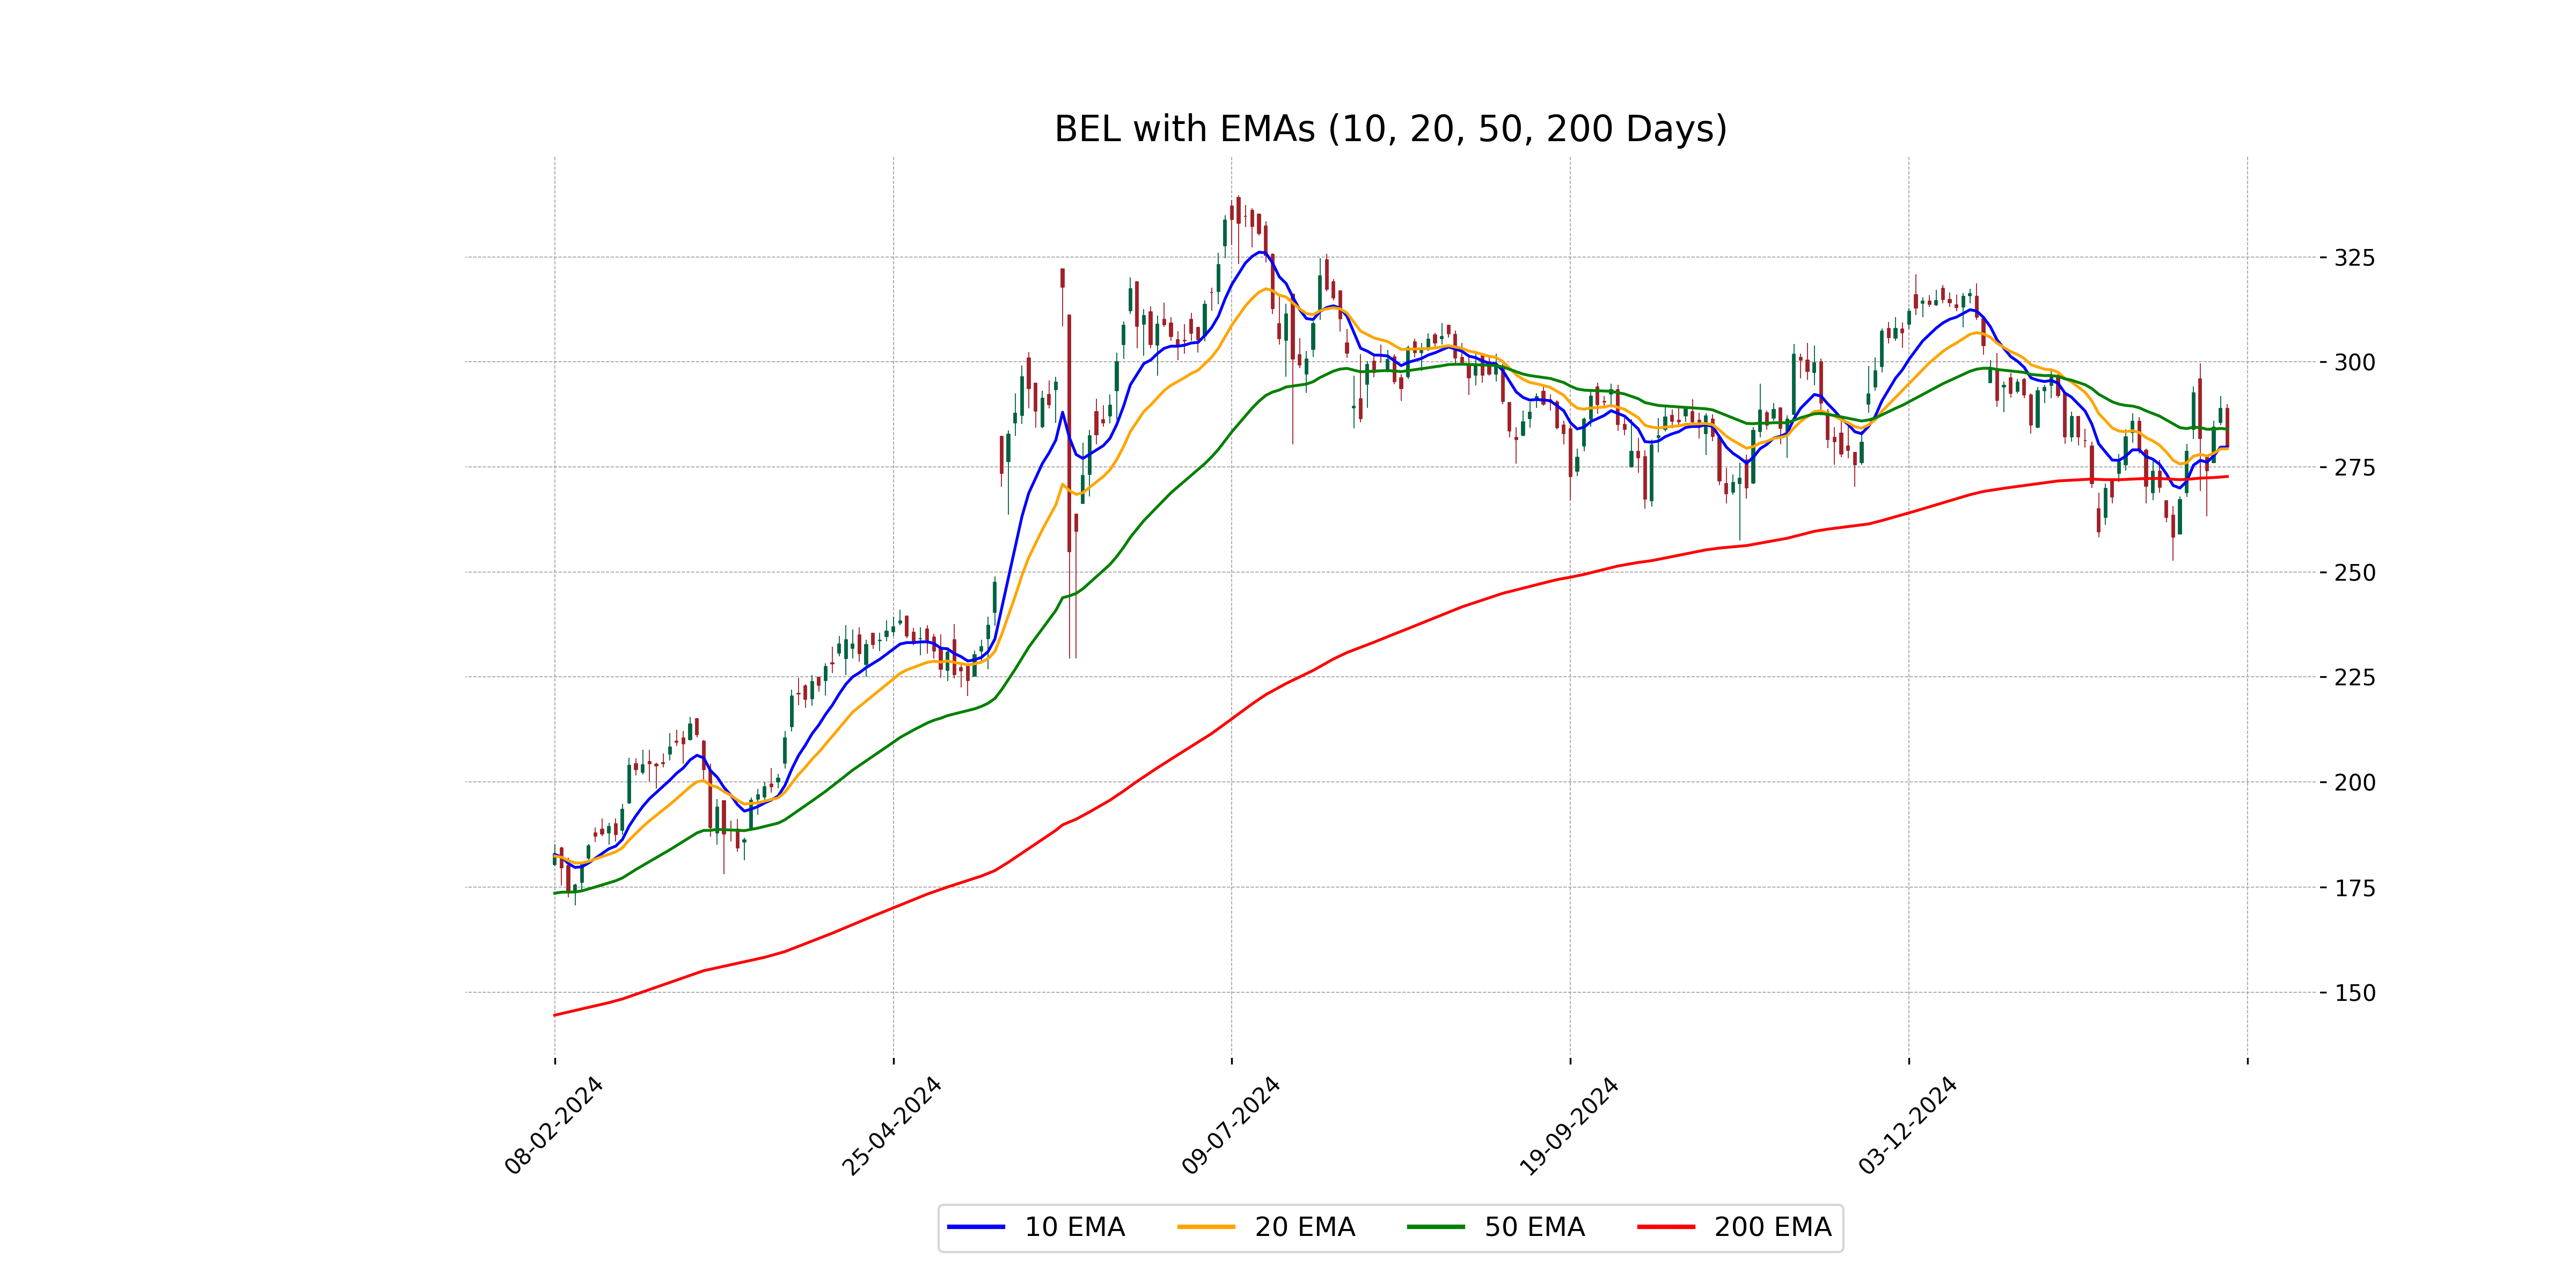
Relationship with Key Moving Averages
Bharat Electronics' closing price is slightly below its 10 EMA (279.71) and 20 EMA (279.32), indicating potential short-term bearishness. However, it remains above the 200 EMA (272.70), suggesting an overall longer-term positive trend. The current price is very close to the 50 EMA (283.99), indicating a balance between medium-term trends.
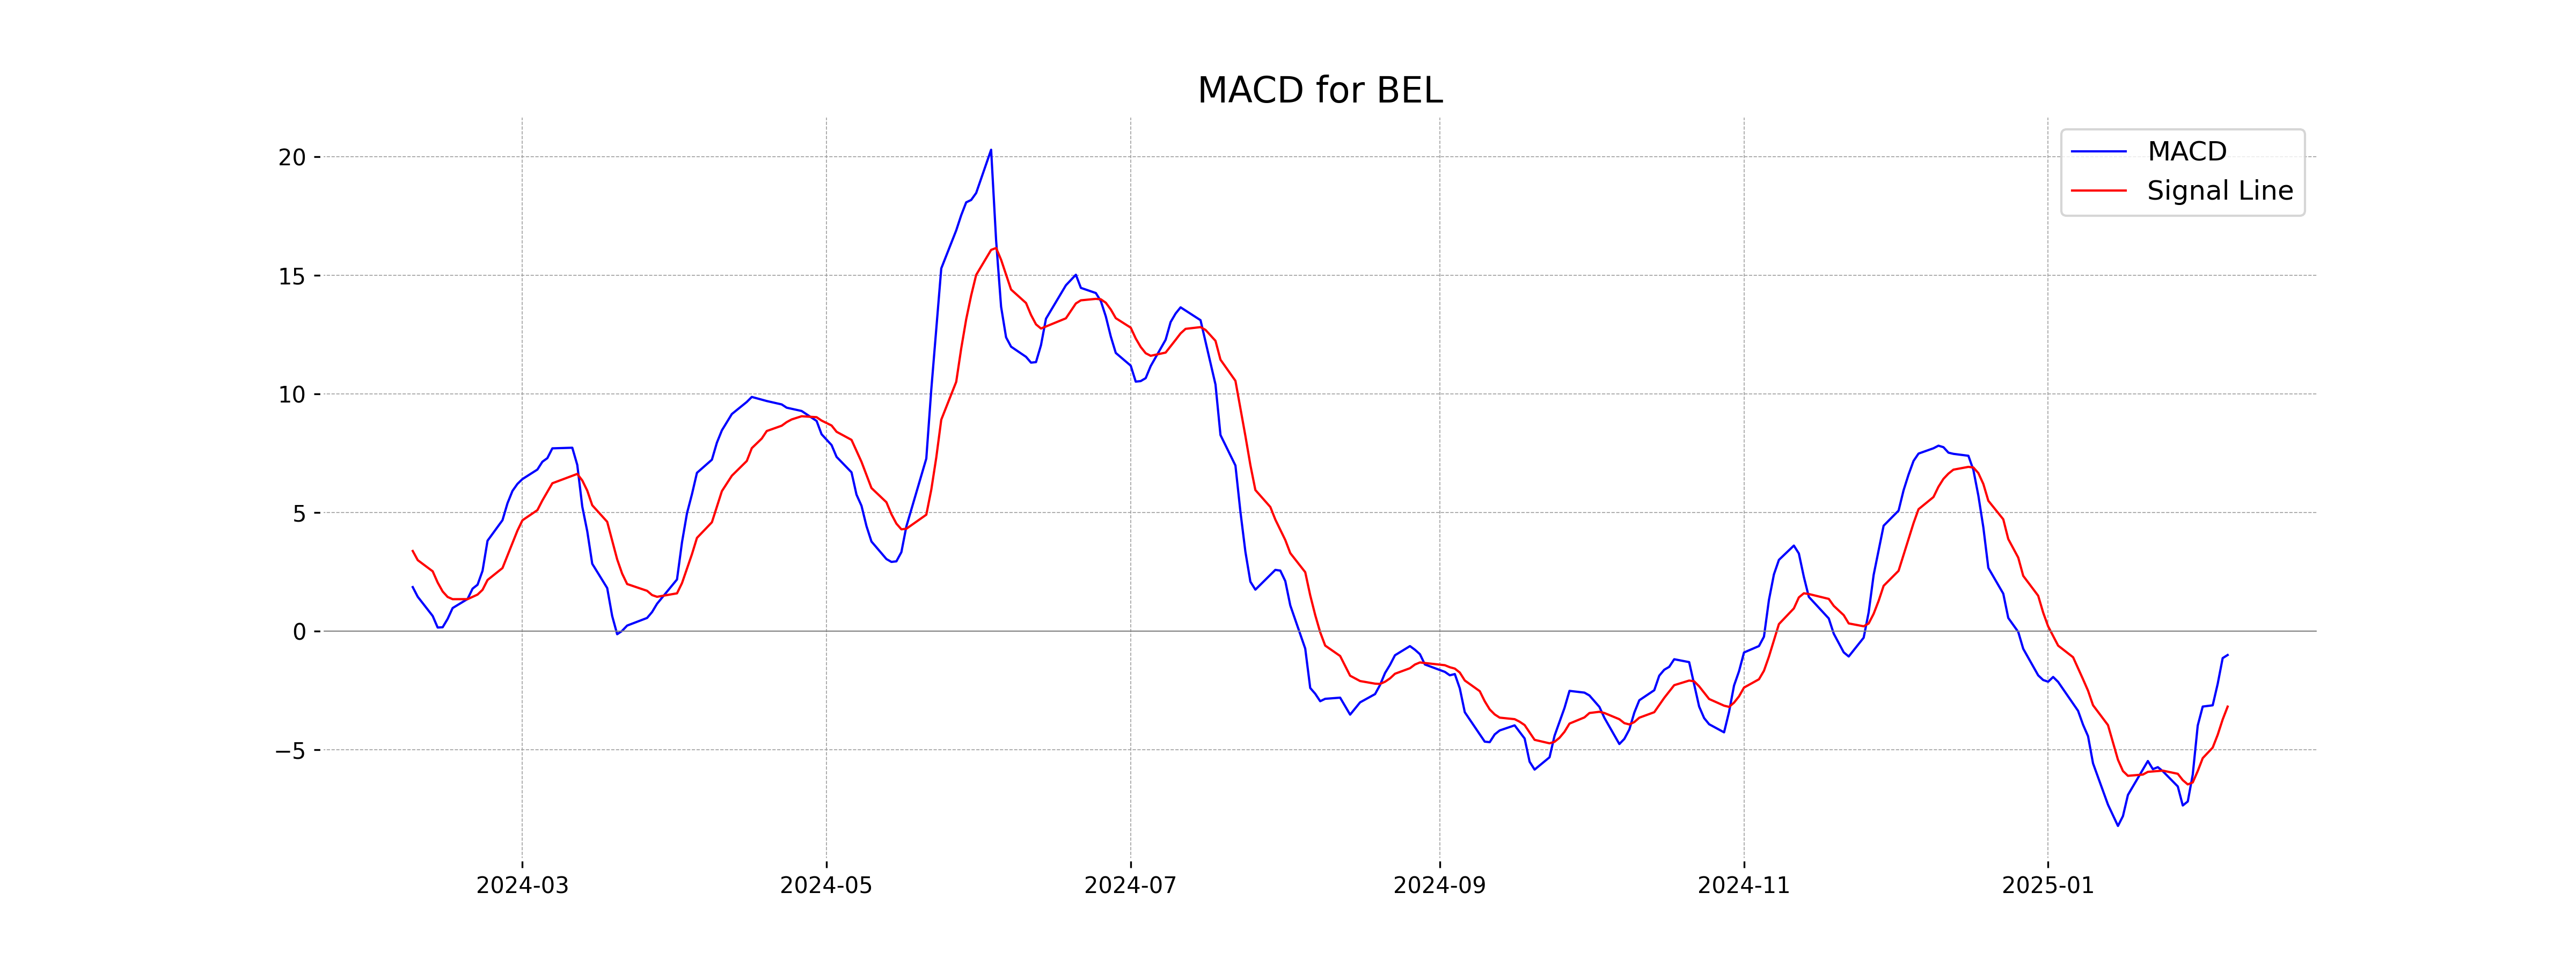
Moving Averages Trend (MACD)
Bharat Electronics is currently experiencing a bearish trend as indicated by the MACD value of -1.0146, which is below the MACD Signal of -3.1908. This suggests potential downward momentum in the stock's price movement.
RSI Analysis
The RSI (Relative Strength Index) for Bharat Electronics is currently at 49.63, indicating a neutral trend as it hovers around the midpoint of the 0-100 scale. This suggests that the stock is neither overbought nor oversold, reflecting balanced market sentiment.
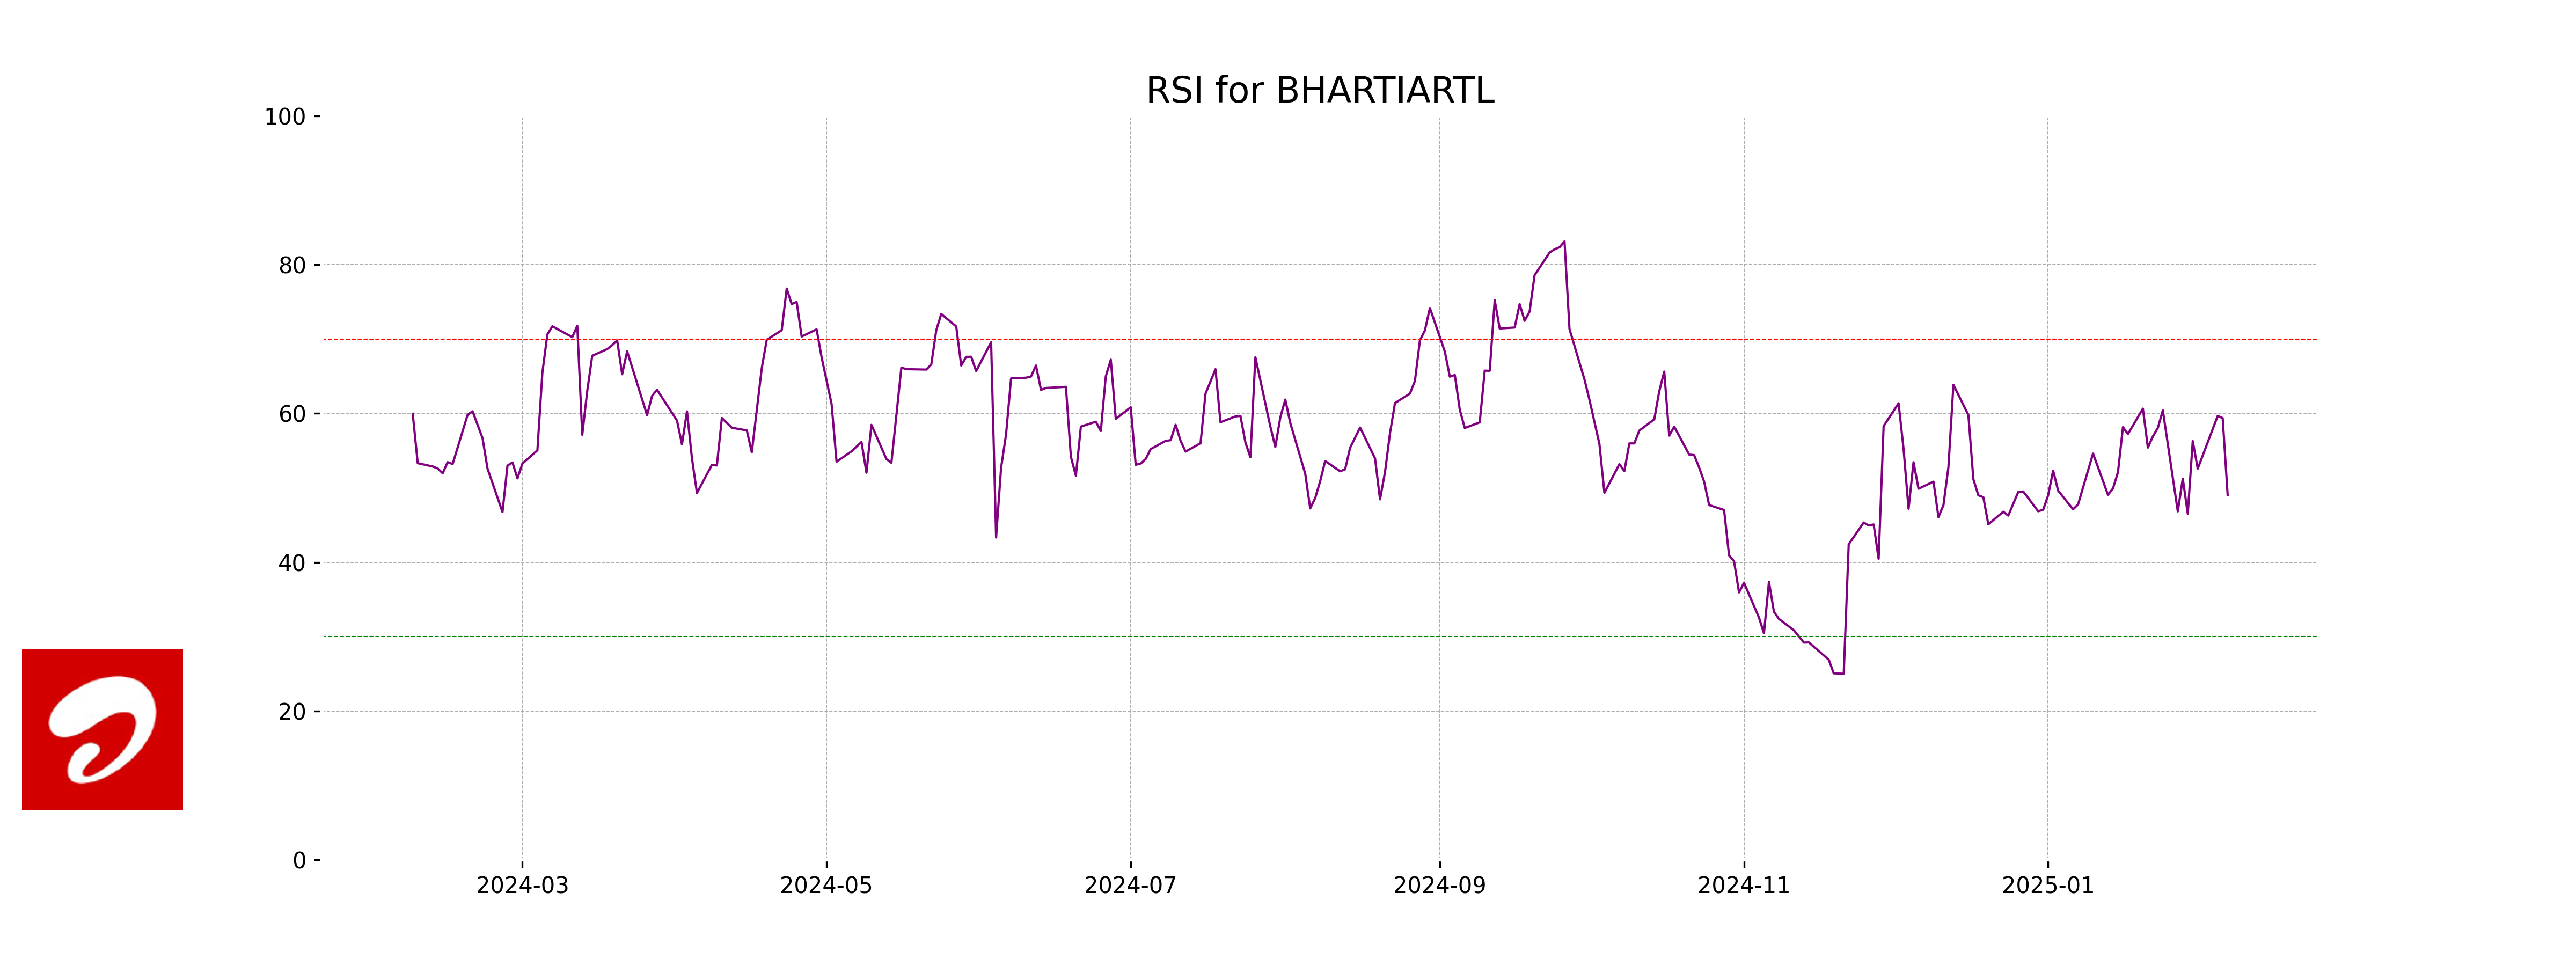
Analysis for Bharti Airtel - February 06, 2025
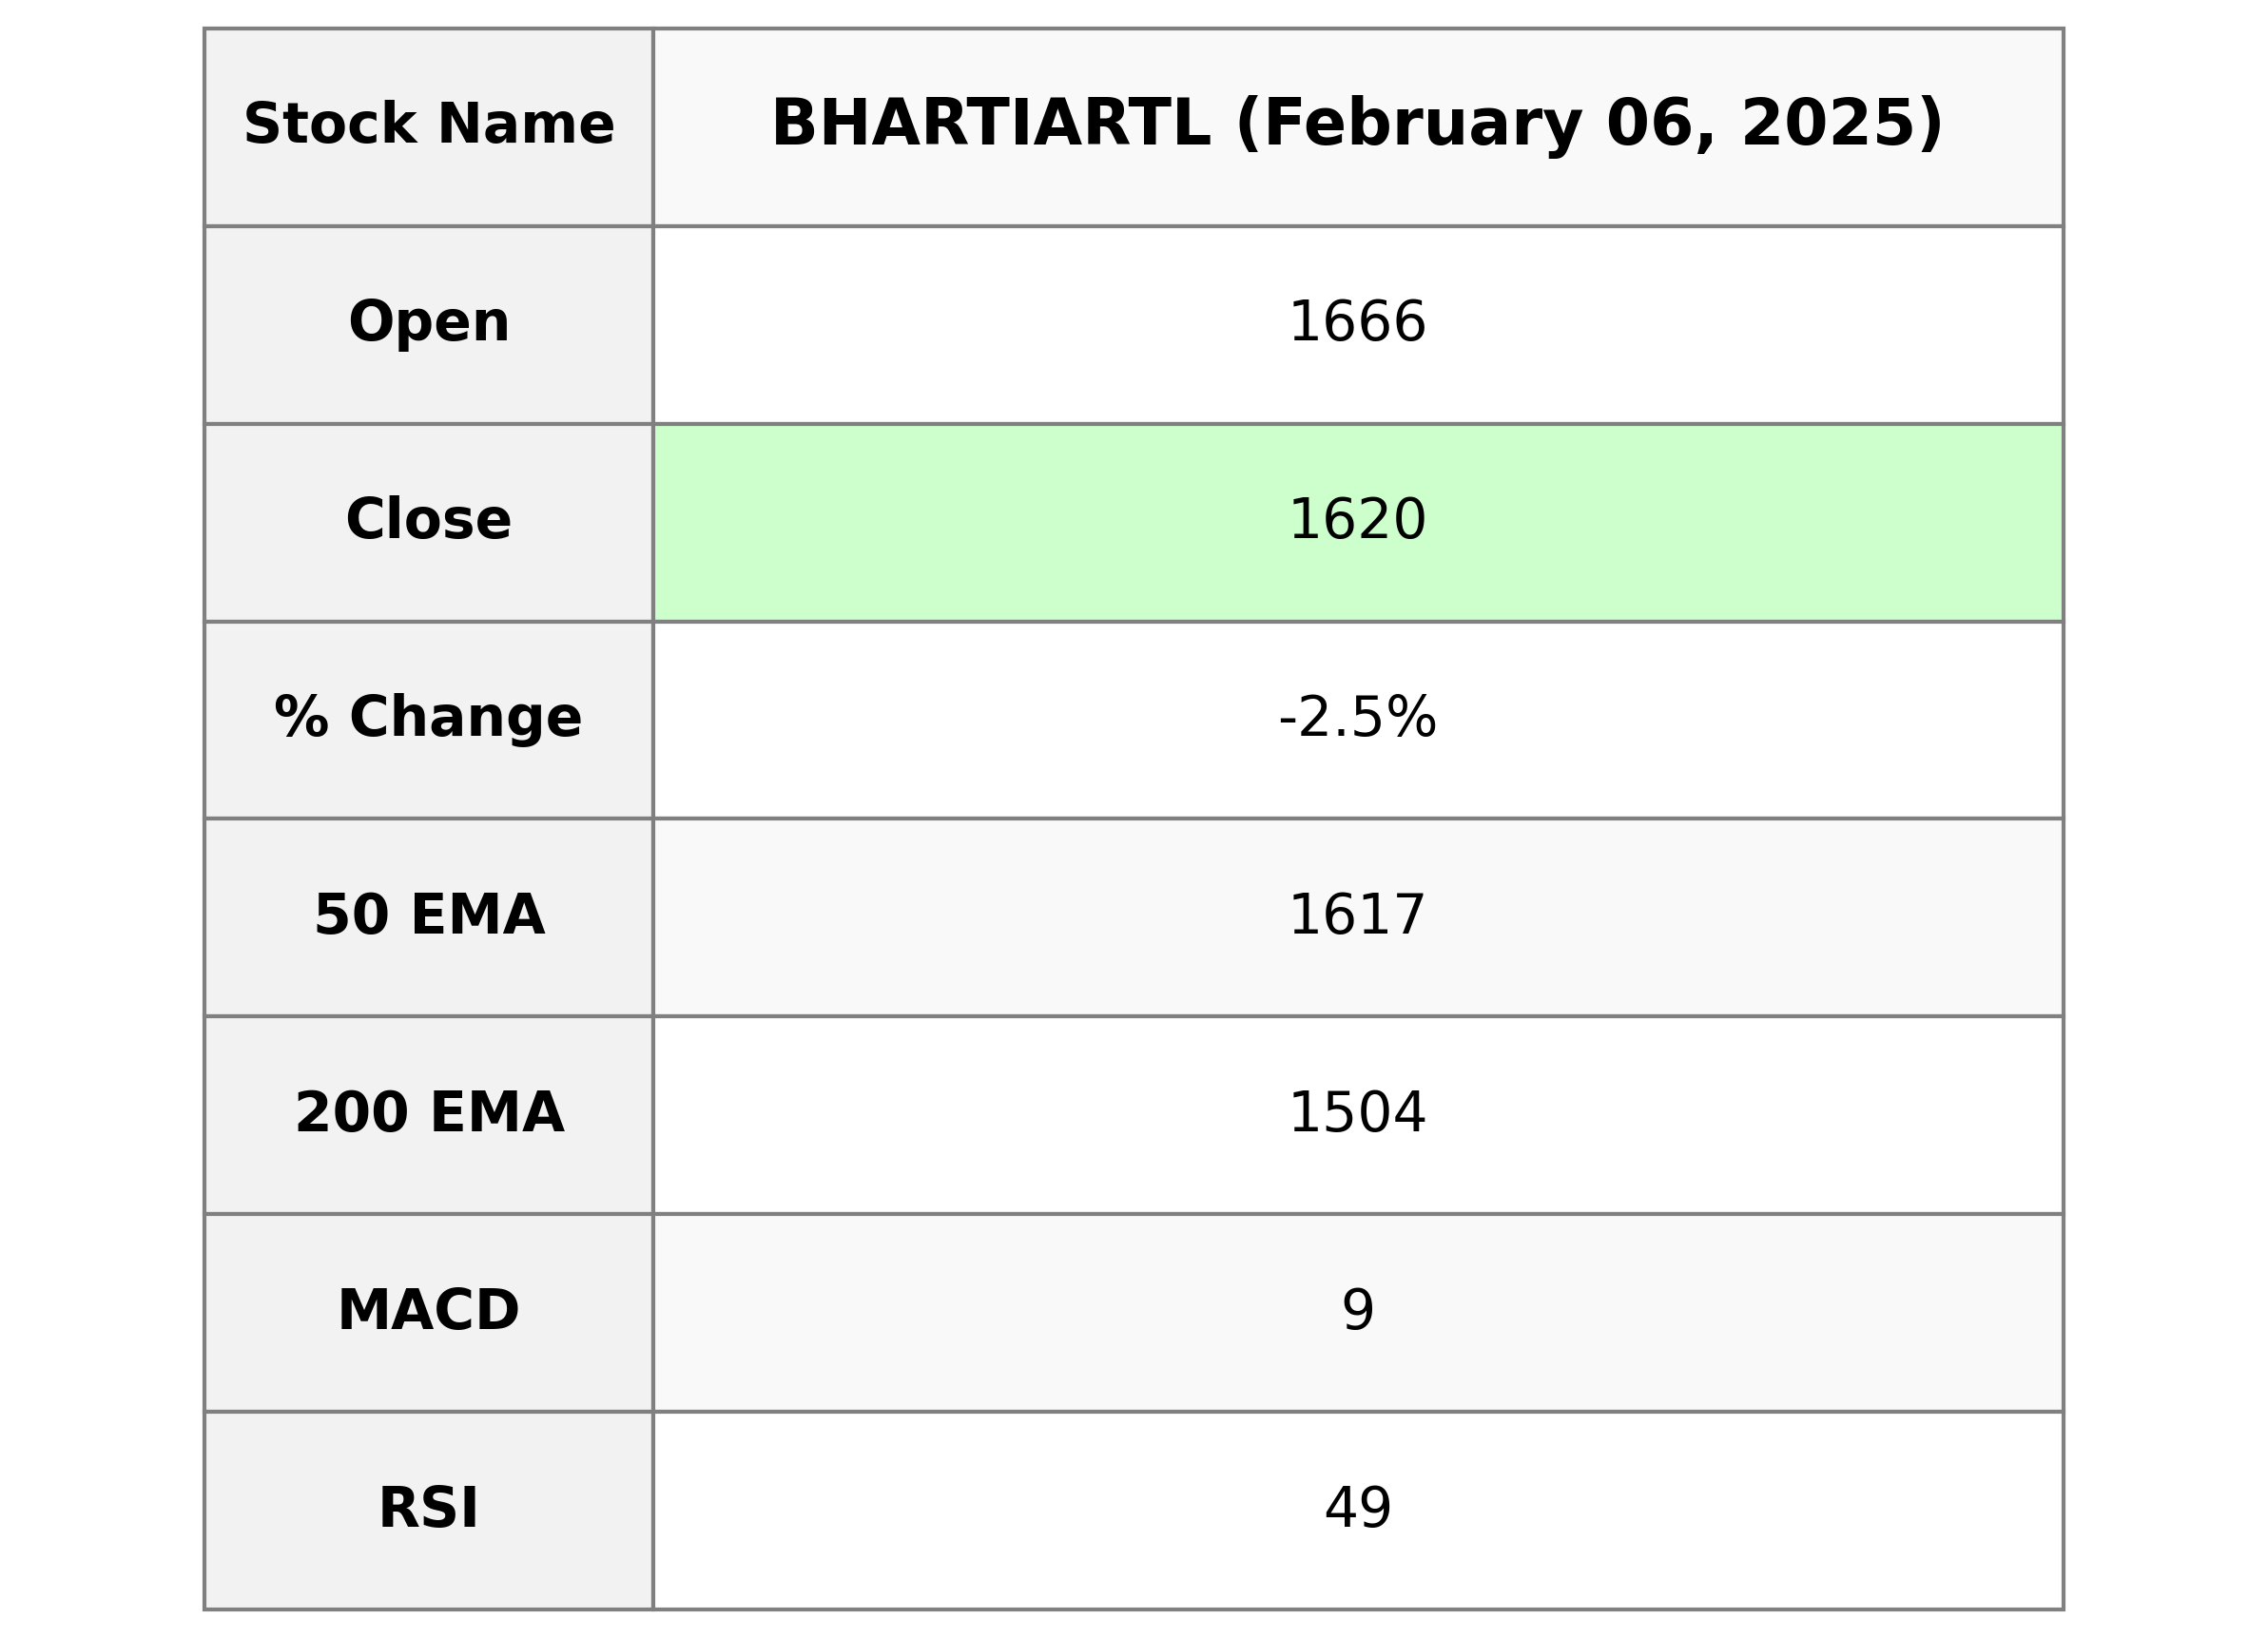
**Bharti Airtel** (Stock Symbol: BHARTIARTL.NS) experienced a decrease in its stock price as indicated by a -2.45% change from the previous close. The stock closed at 1619.75 with a significant trading volume of 5,228,702. Technical indicators such as the 10, 20, and 50 EMAs suggest the stock is close to its moving averages, and an RSI of 49.03 implies a neutral momentum.
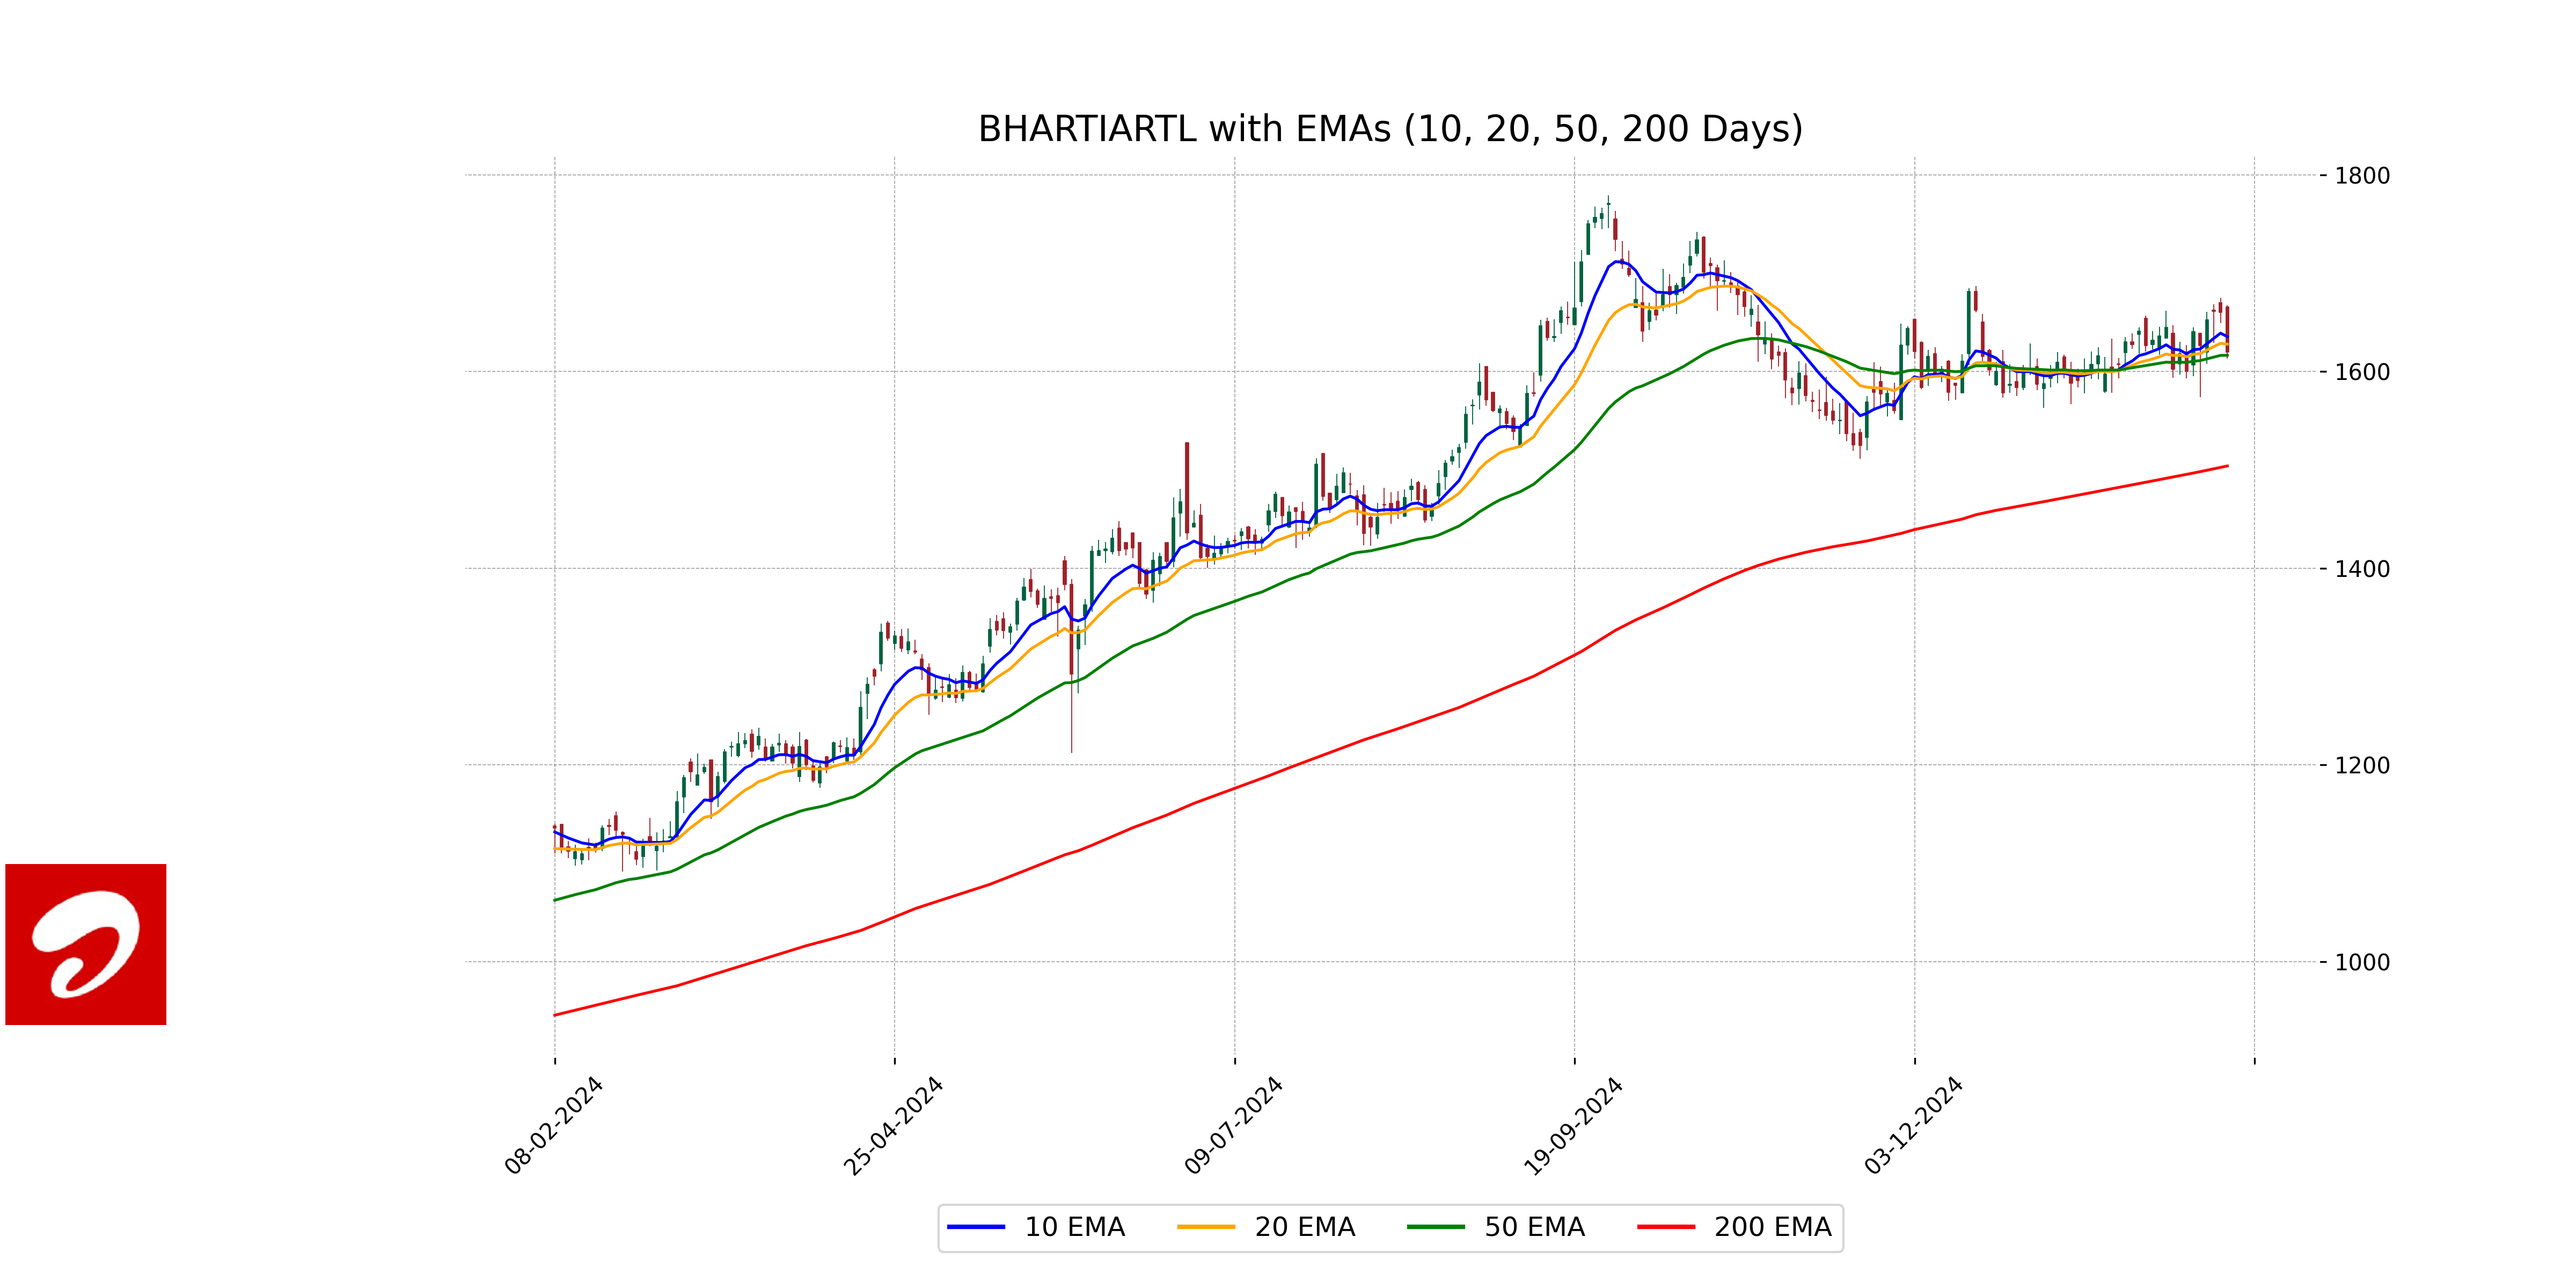
Relationship with Key Moving Averages
Bharti Airtel's current closing price of 1619.75 is slightly above its 50-day EMA of 1616.58, indicating a minor short-term bullish trend. However, it is below the 10-day EMA of 1635.55 and the 20-day EMA of 1627.86, suggesting recent short-term weakness despite maintaining strength over the longer term against the 200-day EMA of 1504.01.
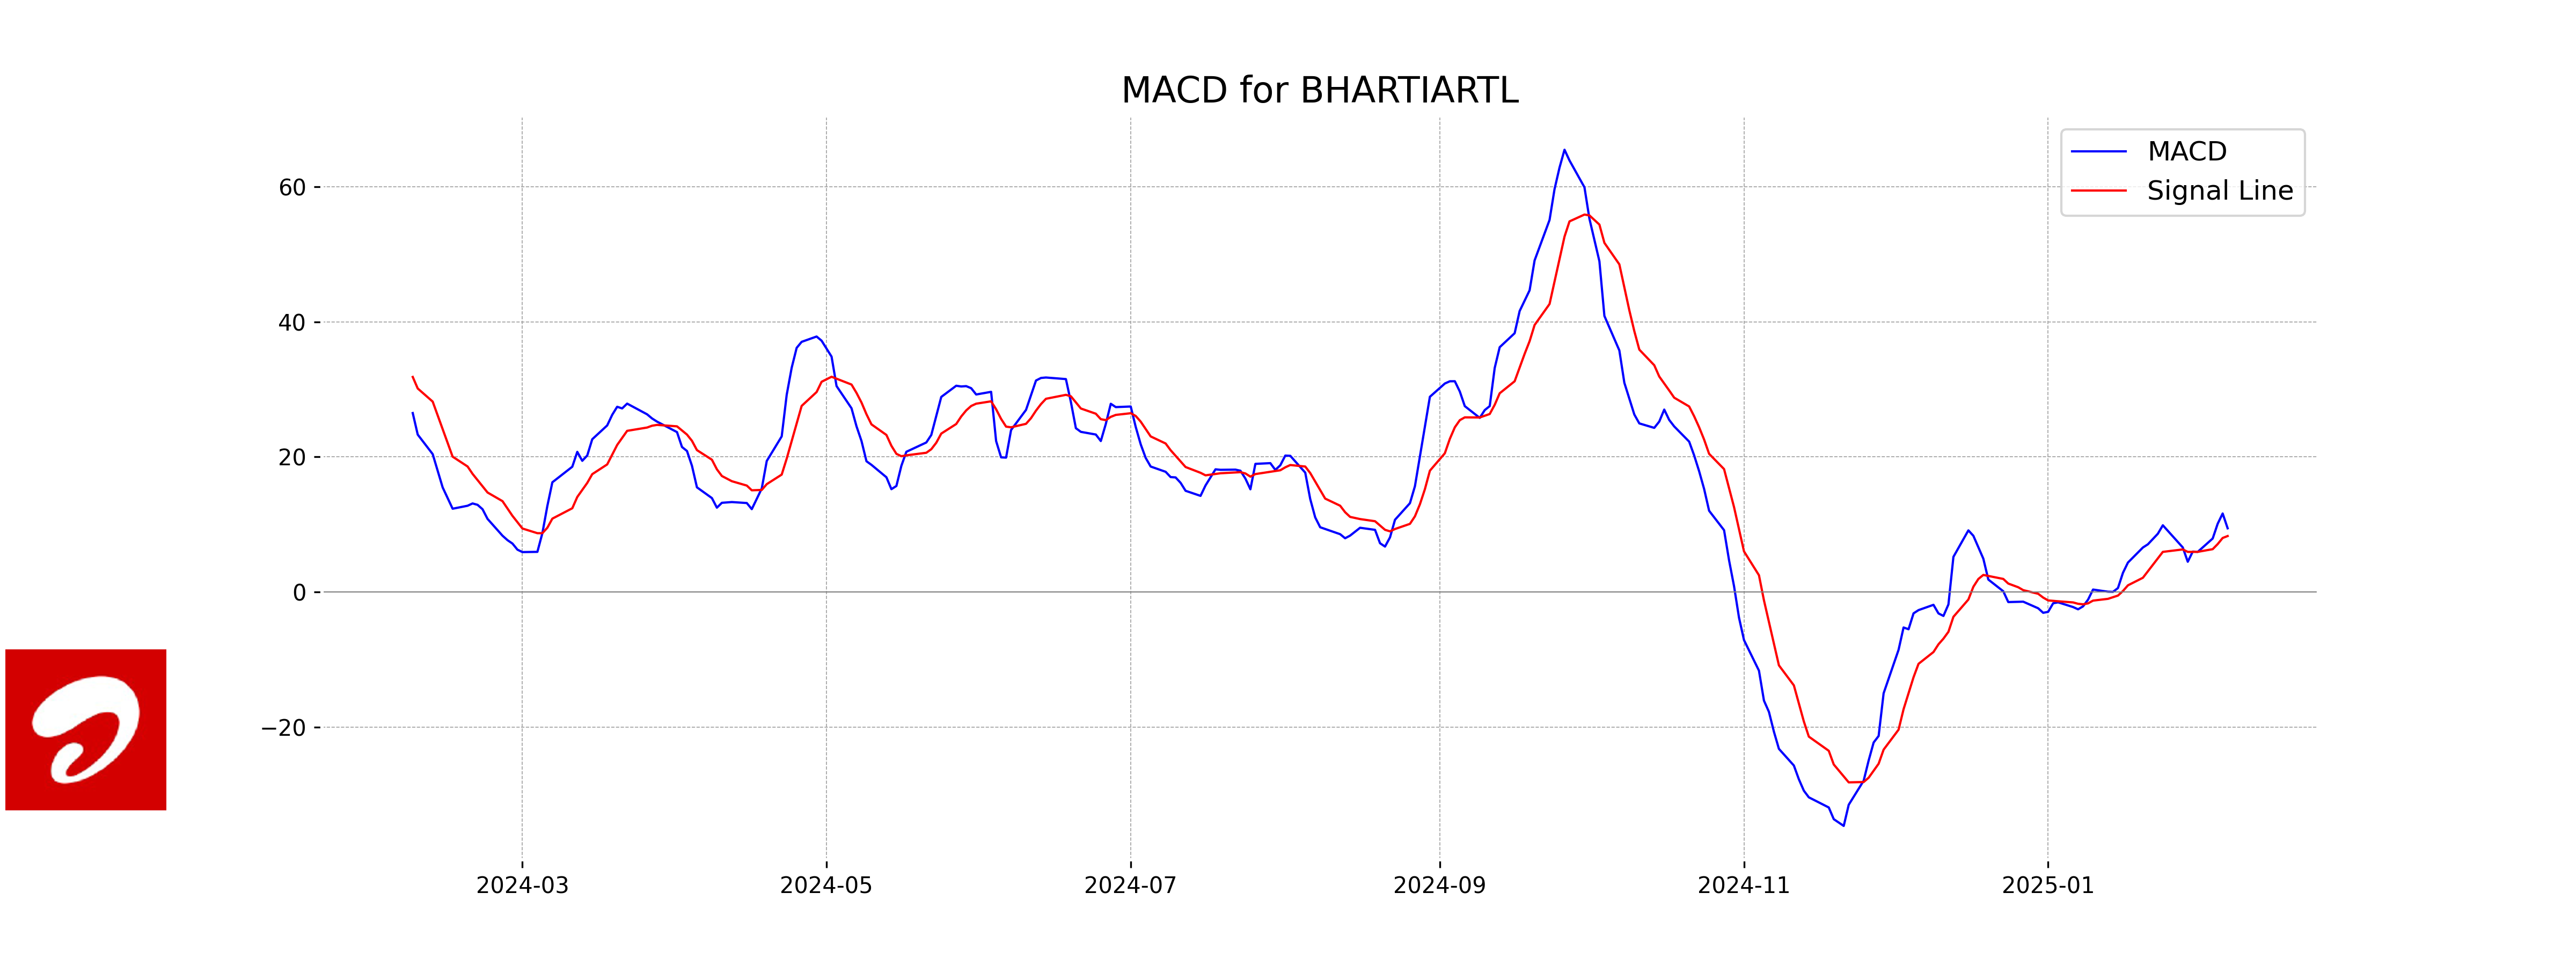
Moving Averages Trend (MACD)
The MACD for Bharti Airtel is 9.43, while the MACD Signal is 8.28. This indicates a positive trend, as the MACD line is above the Signal line, suggesting potential upward momentum.
RSI Analysis
The RSI for Bharti Airtel is currently at 49.03, which suggests that the stock is neither in the overbought nor the oversold territory. An RSI around 50 indicates a relatively neutral position, and the stock may not exhibit strong momentum in either direction at the moment.
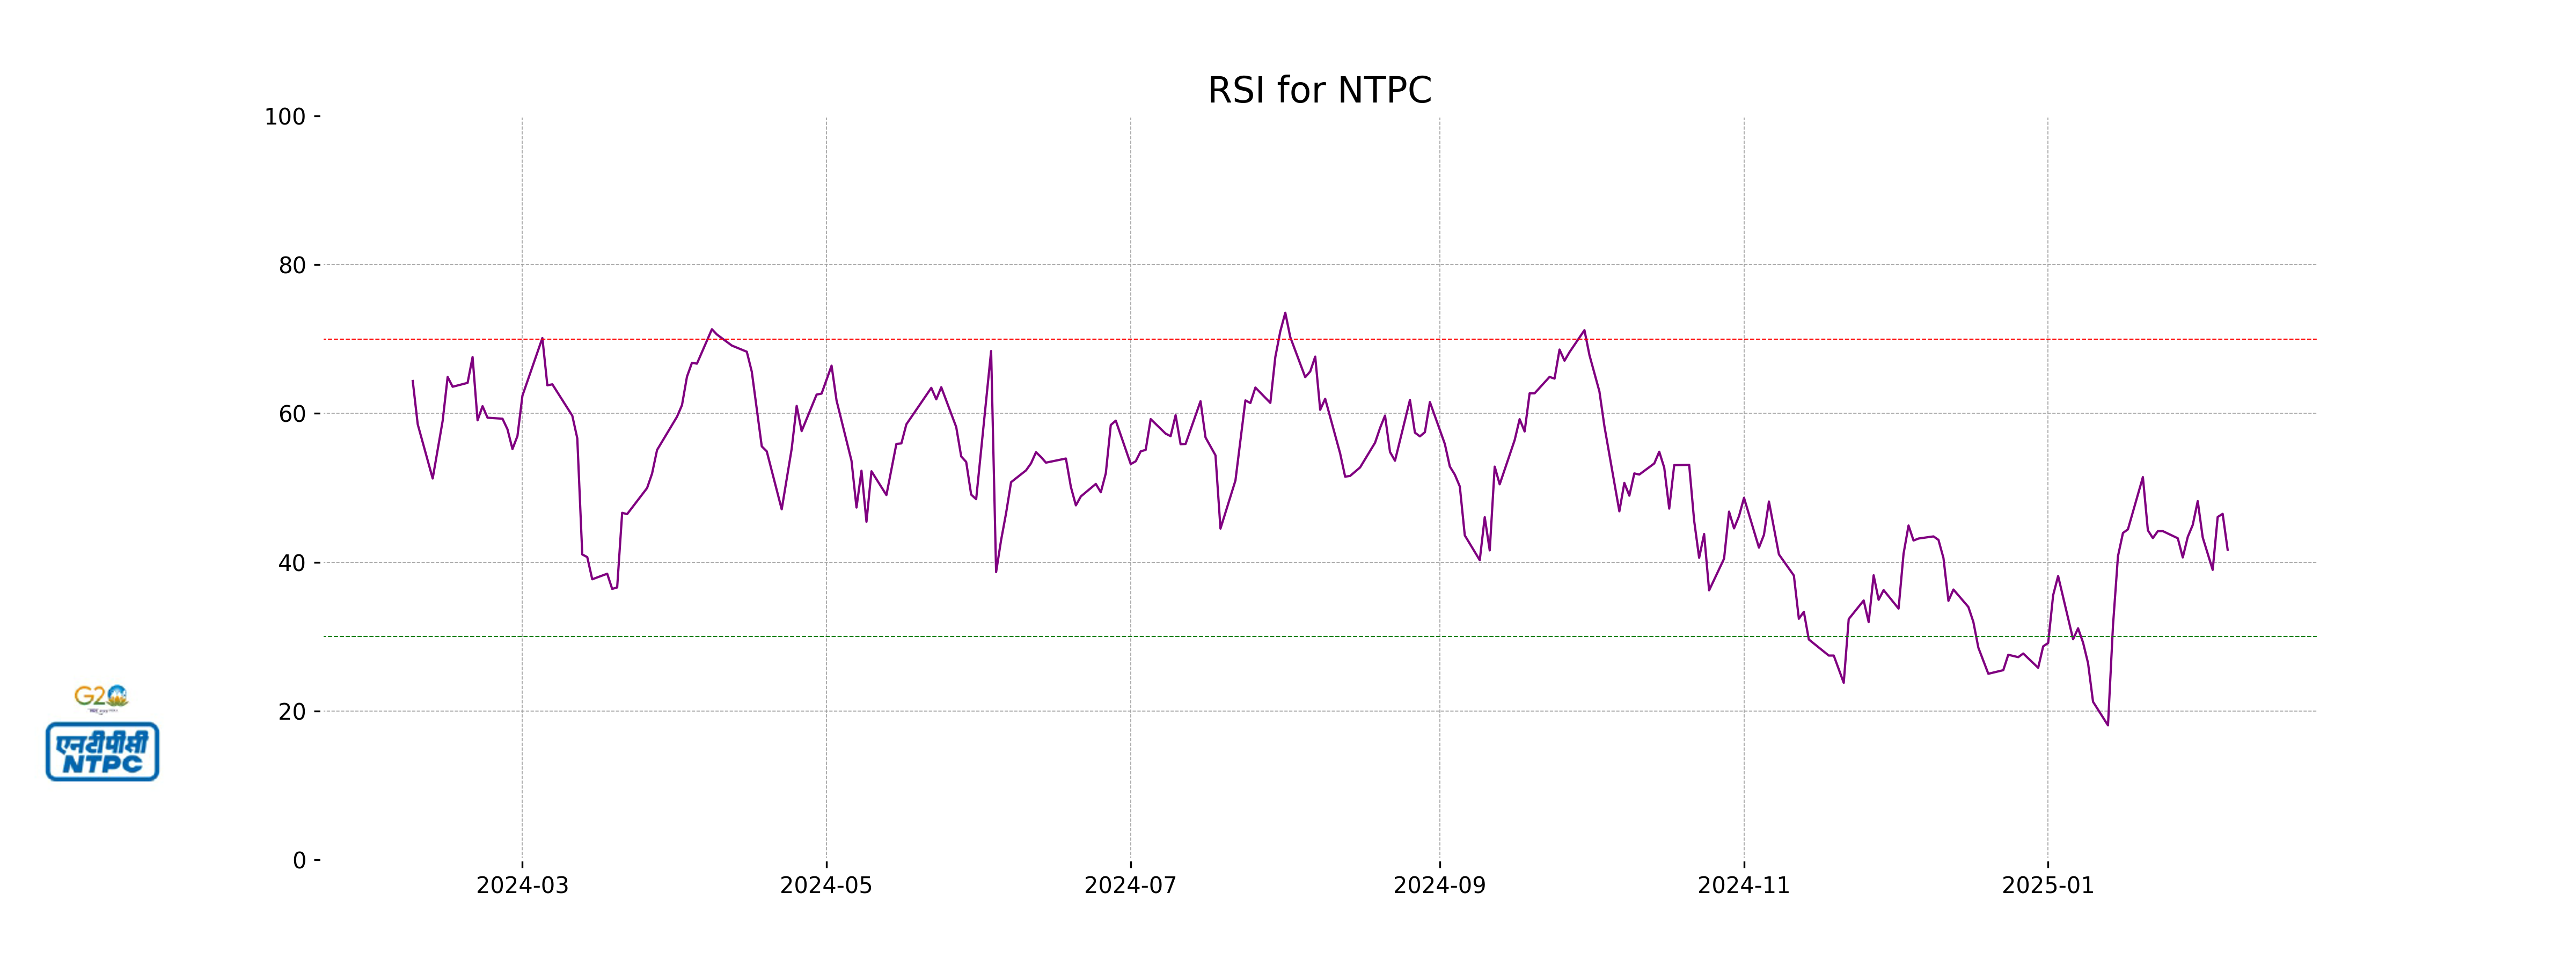
Analysis for NTPC - February 06, 2025
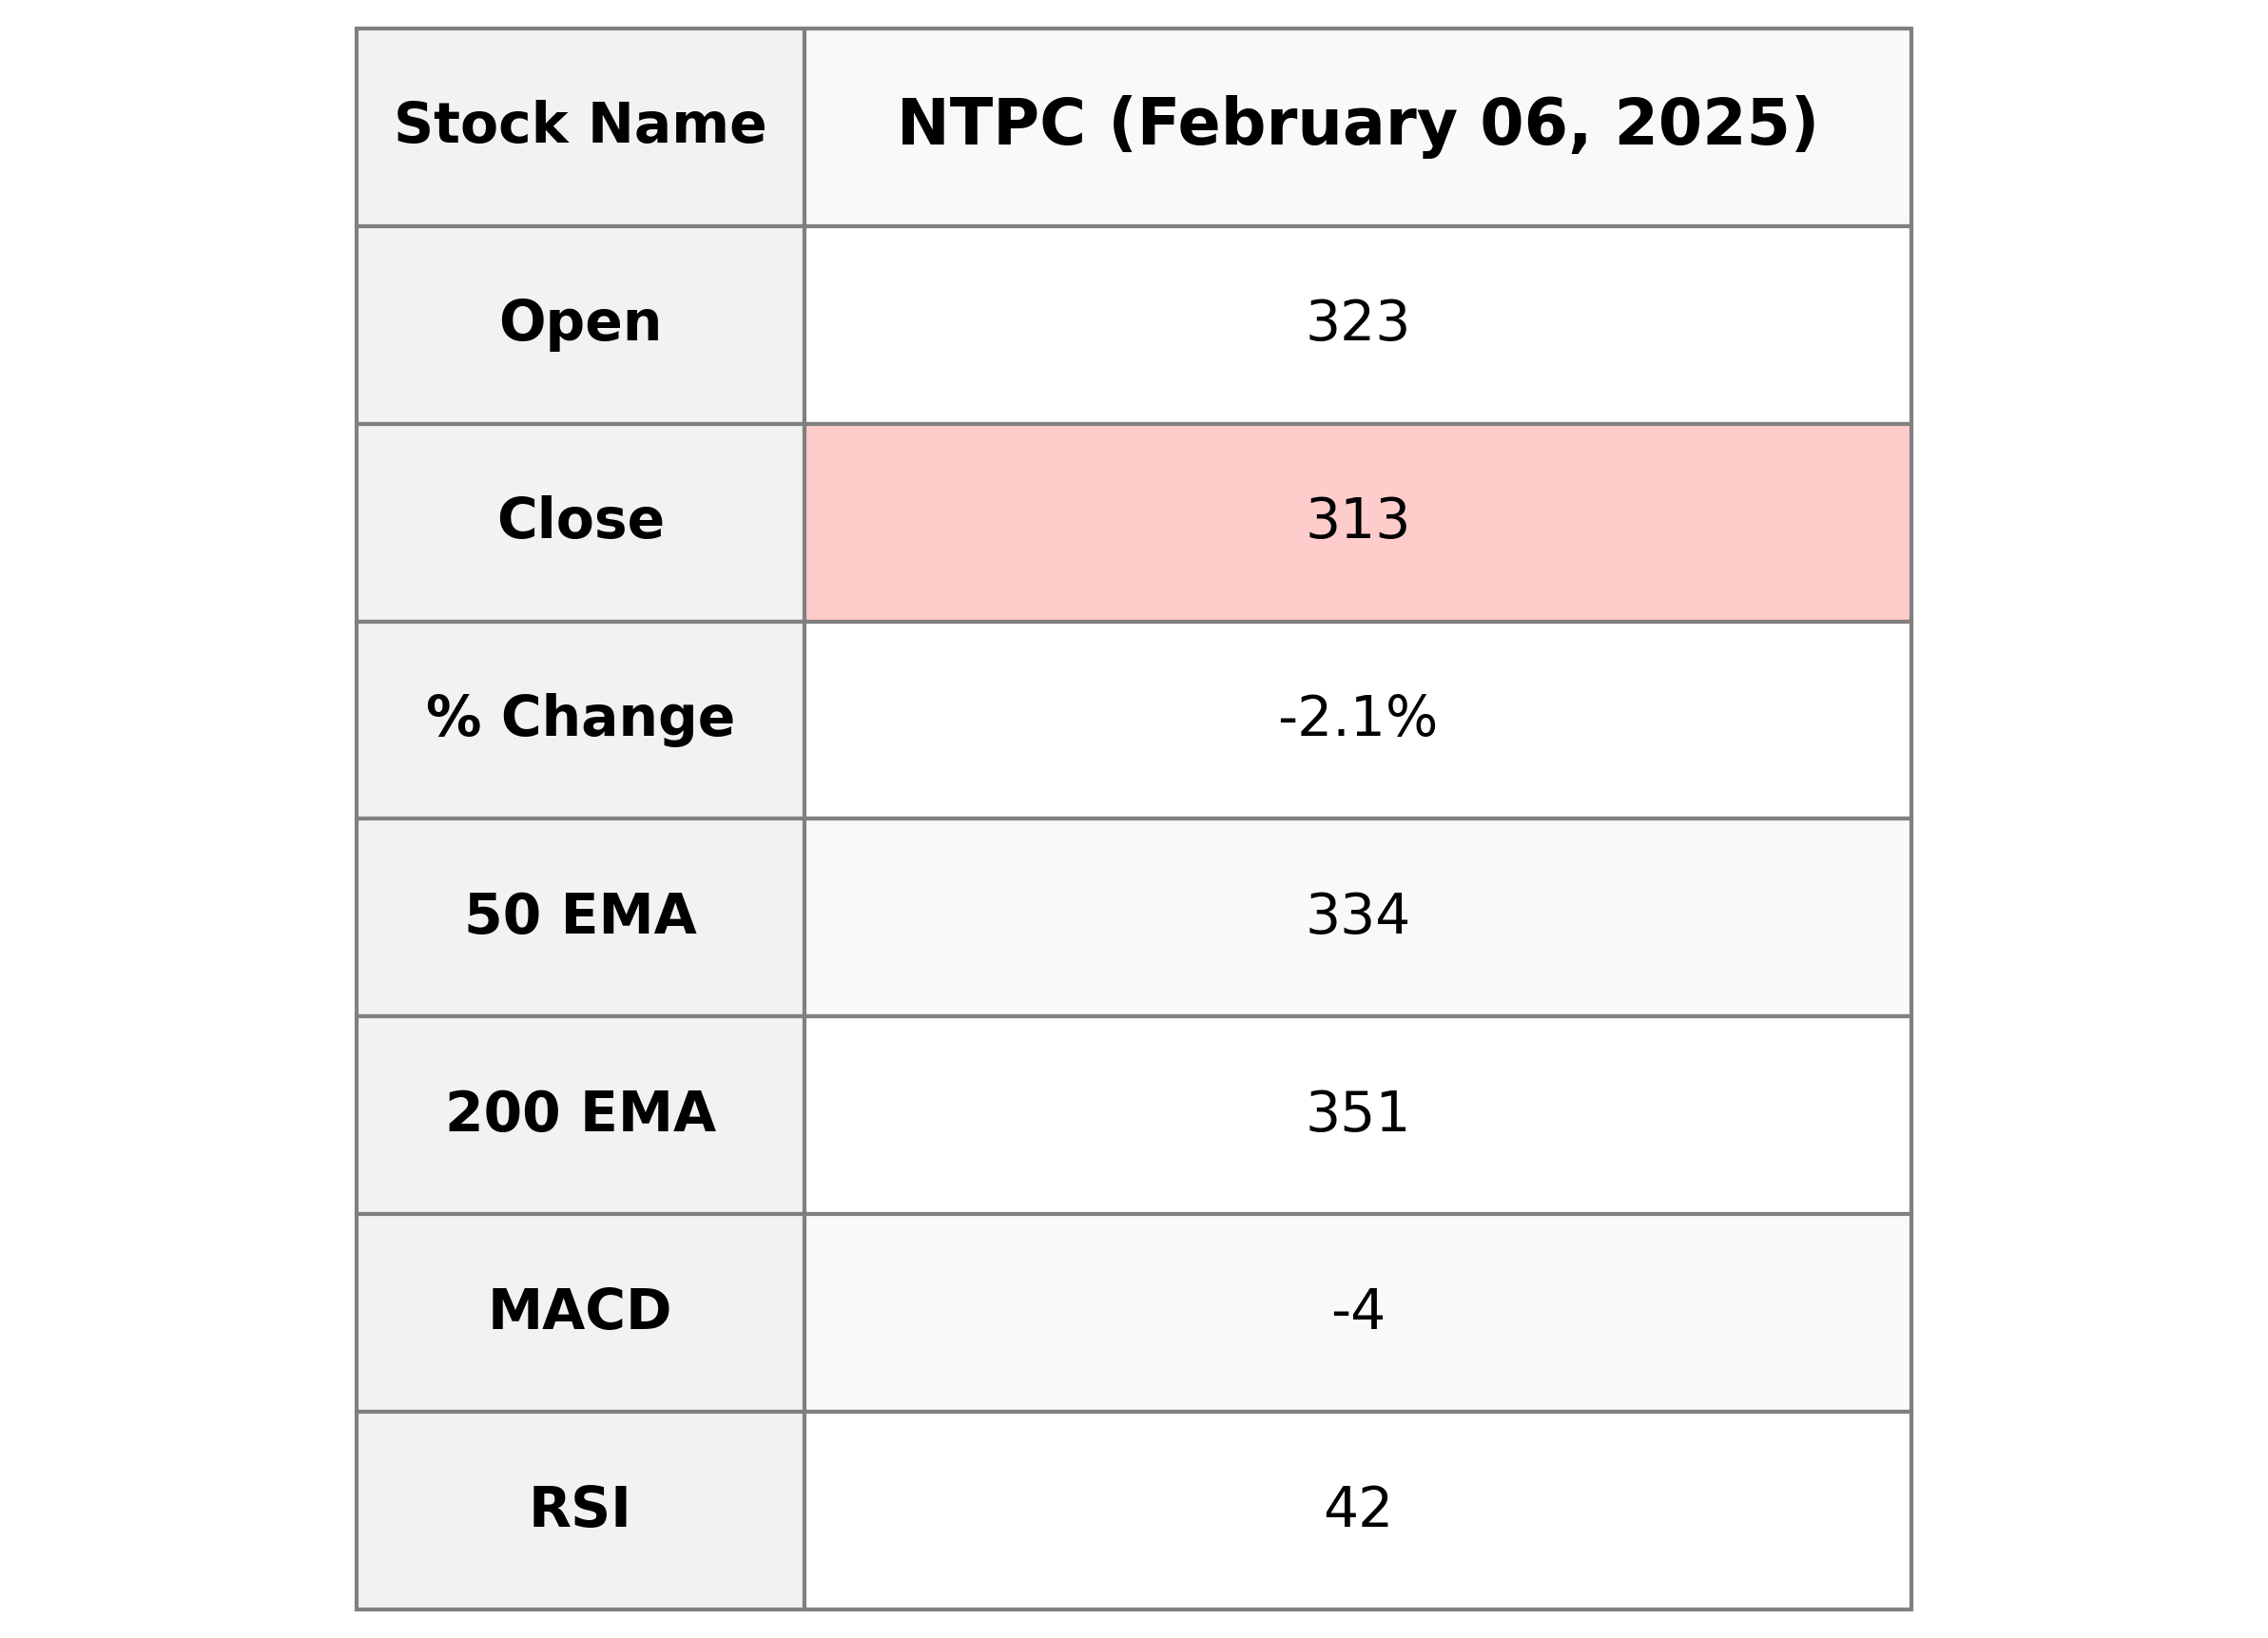
NTPC's stock performance shows a decline, with a notable percentage change of -2.13% and a decrease of 6.80 points from the previous close. The stock closed at 312.80, with a market cap of INR 3,033,118,277,632. The PE ratio stands at 14.58, while the RSI indicates slightly bearish momentum at 41.67.
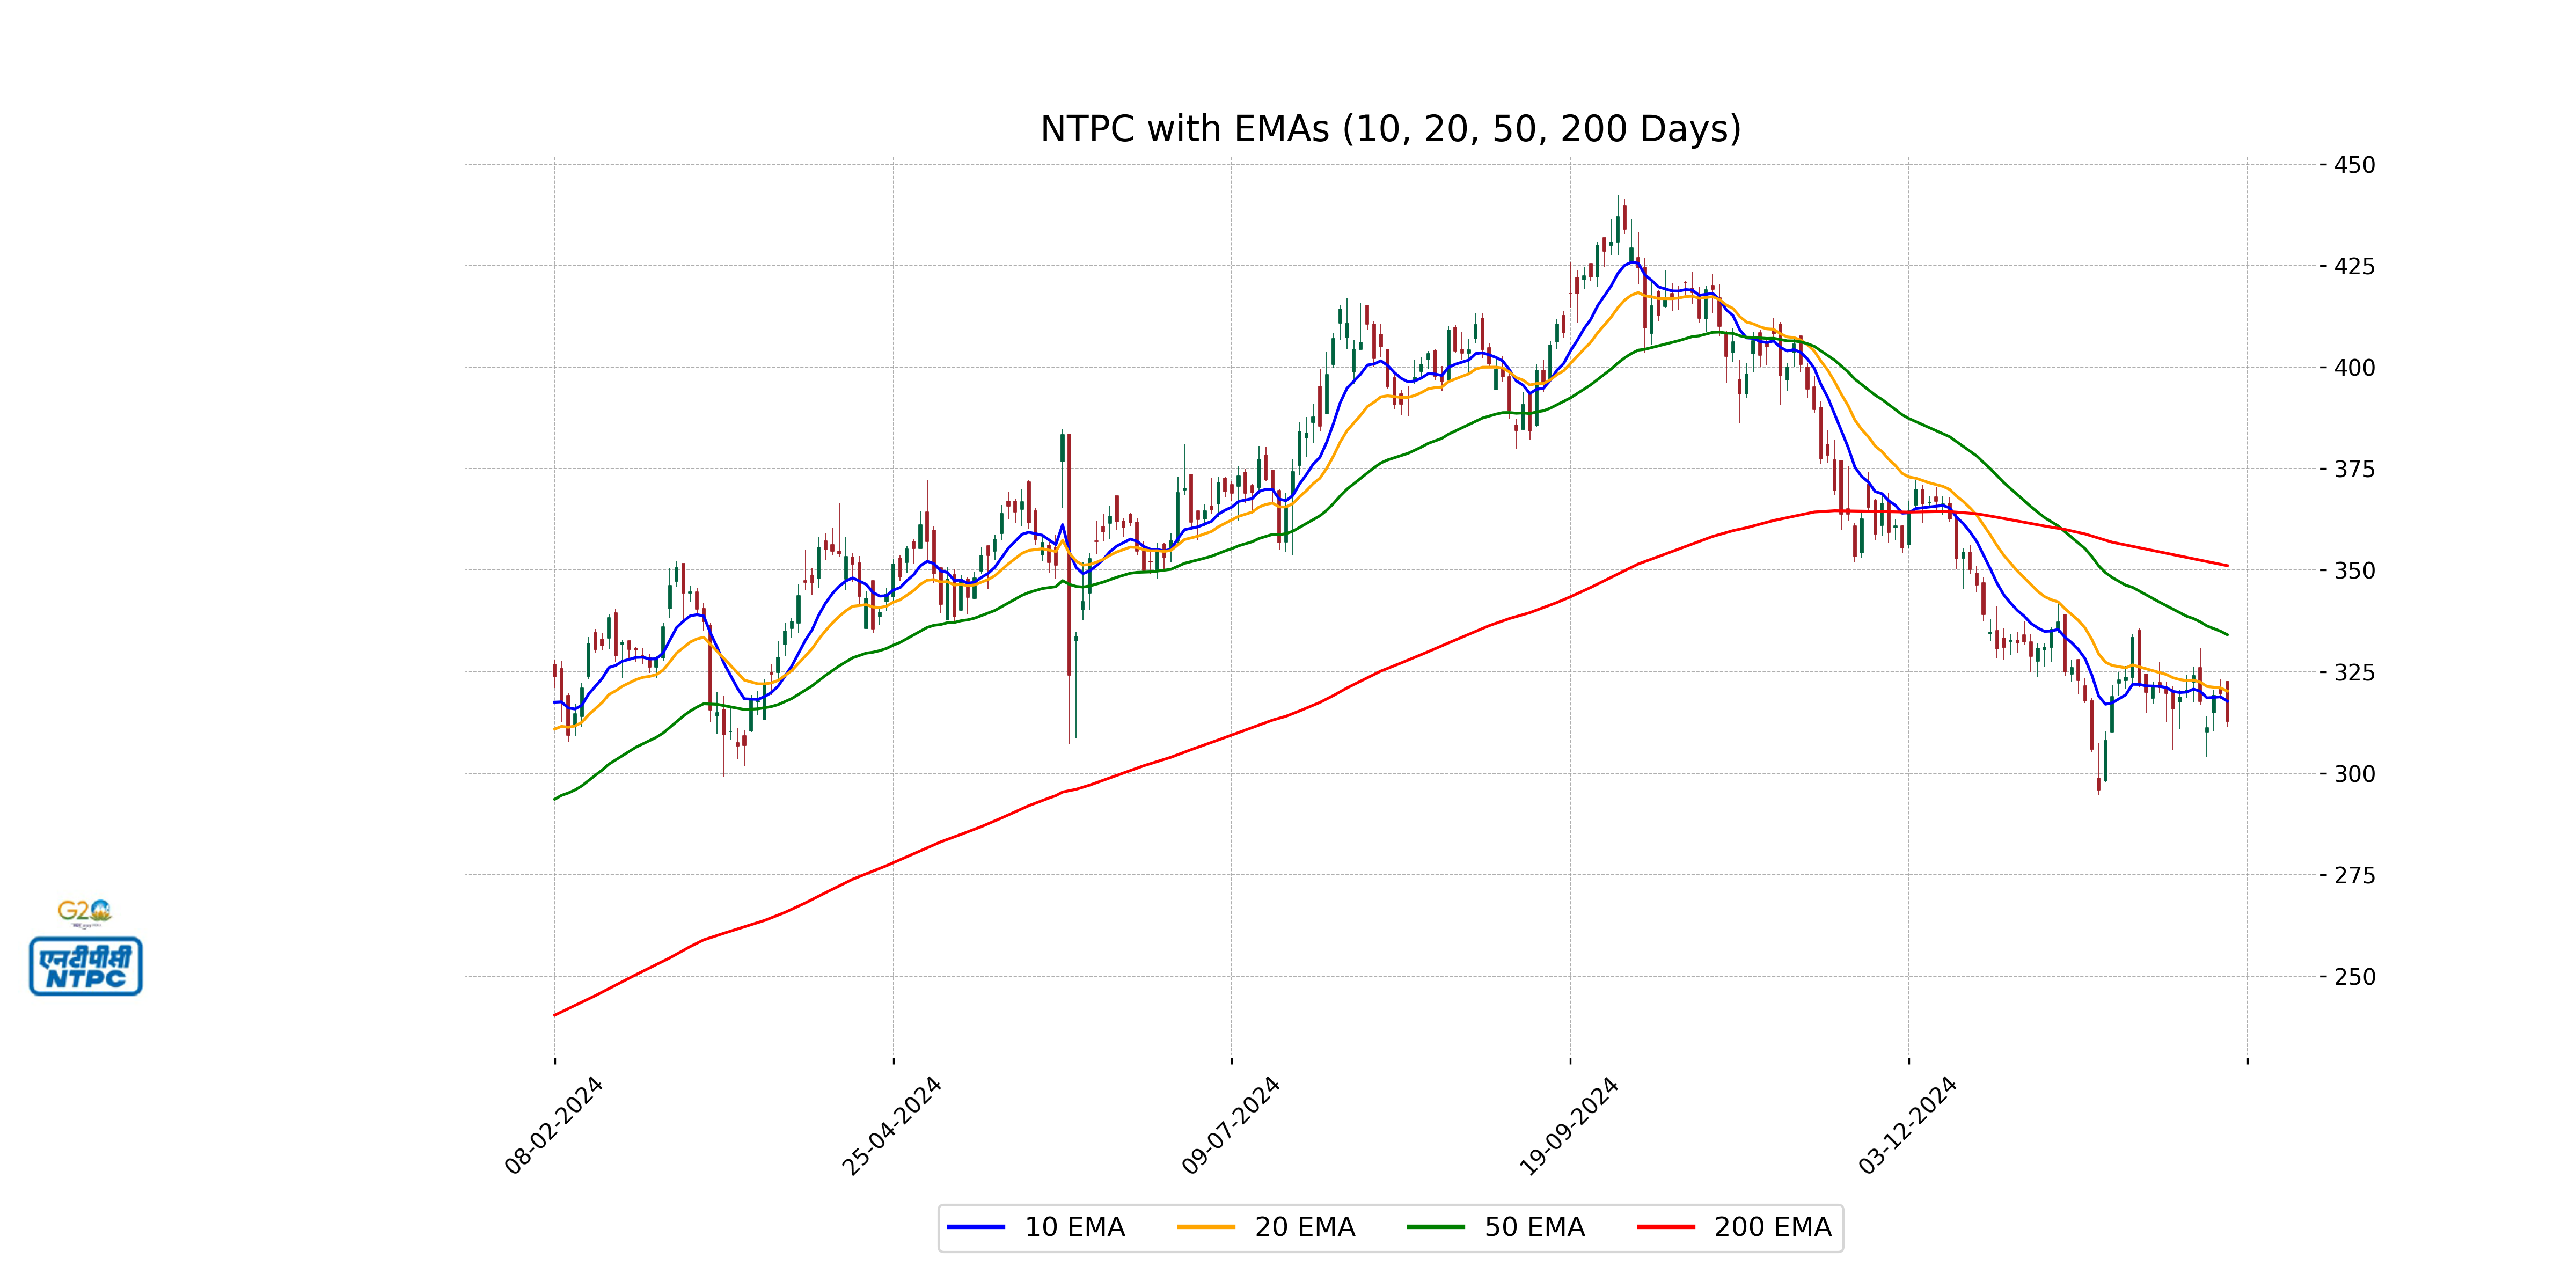
Relationship with Key Moving Averages
The current closing price of NTPC at 312.80 is below its key moving averages, with the 50 EMA at 334.09, the 200 EMA at 351.11, and the 10 EMA at 317.73. This indicates a bearish trend as the current price is trading below the short-term, mid-term, and long-term moving averages.
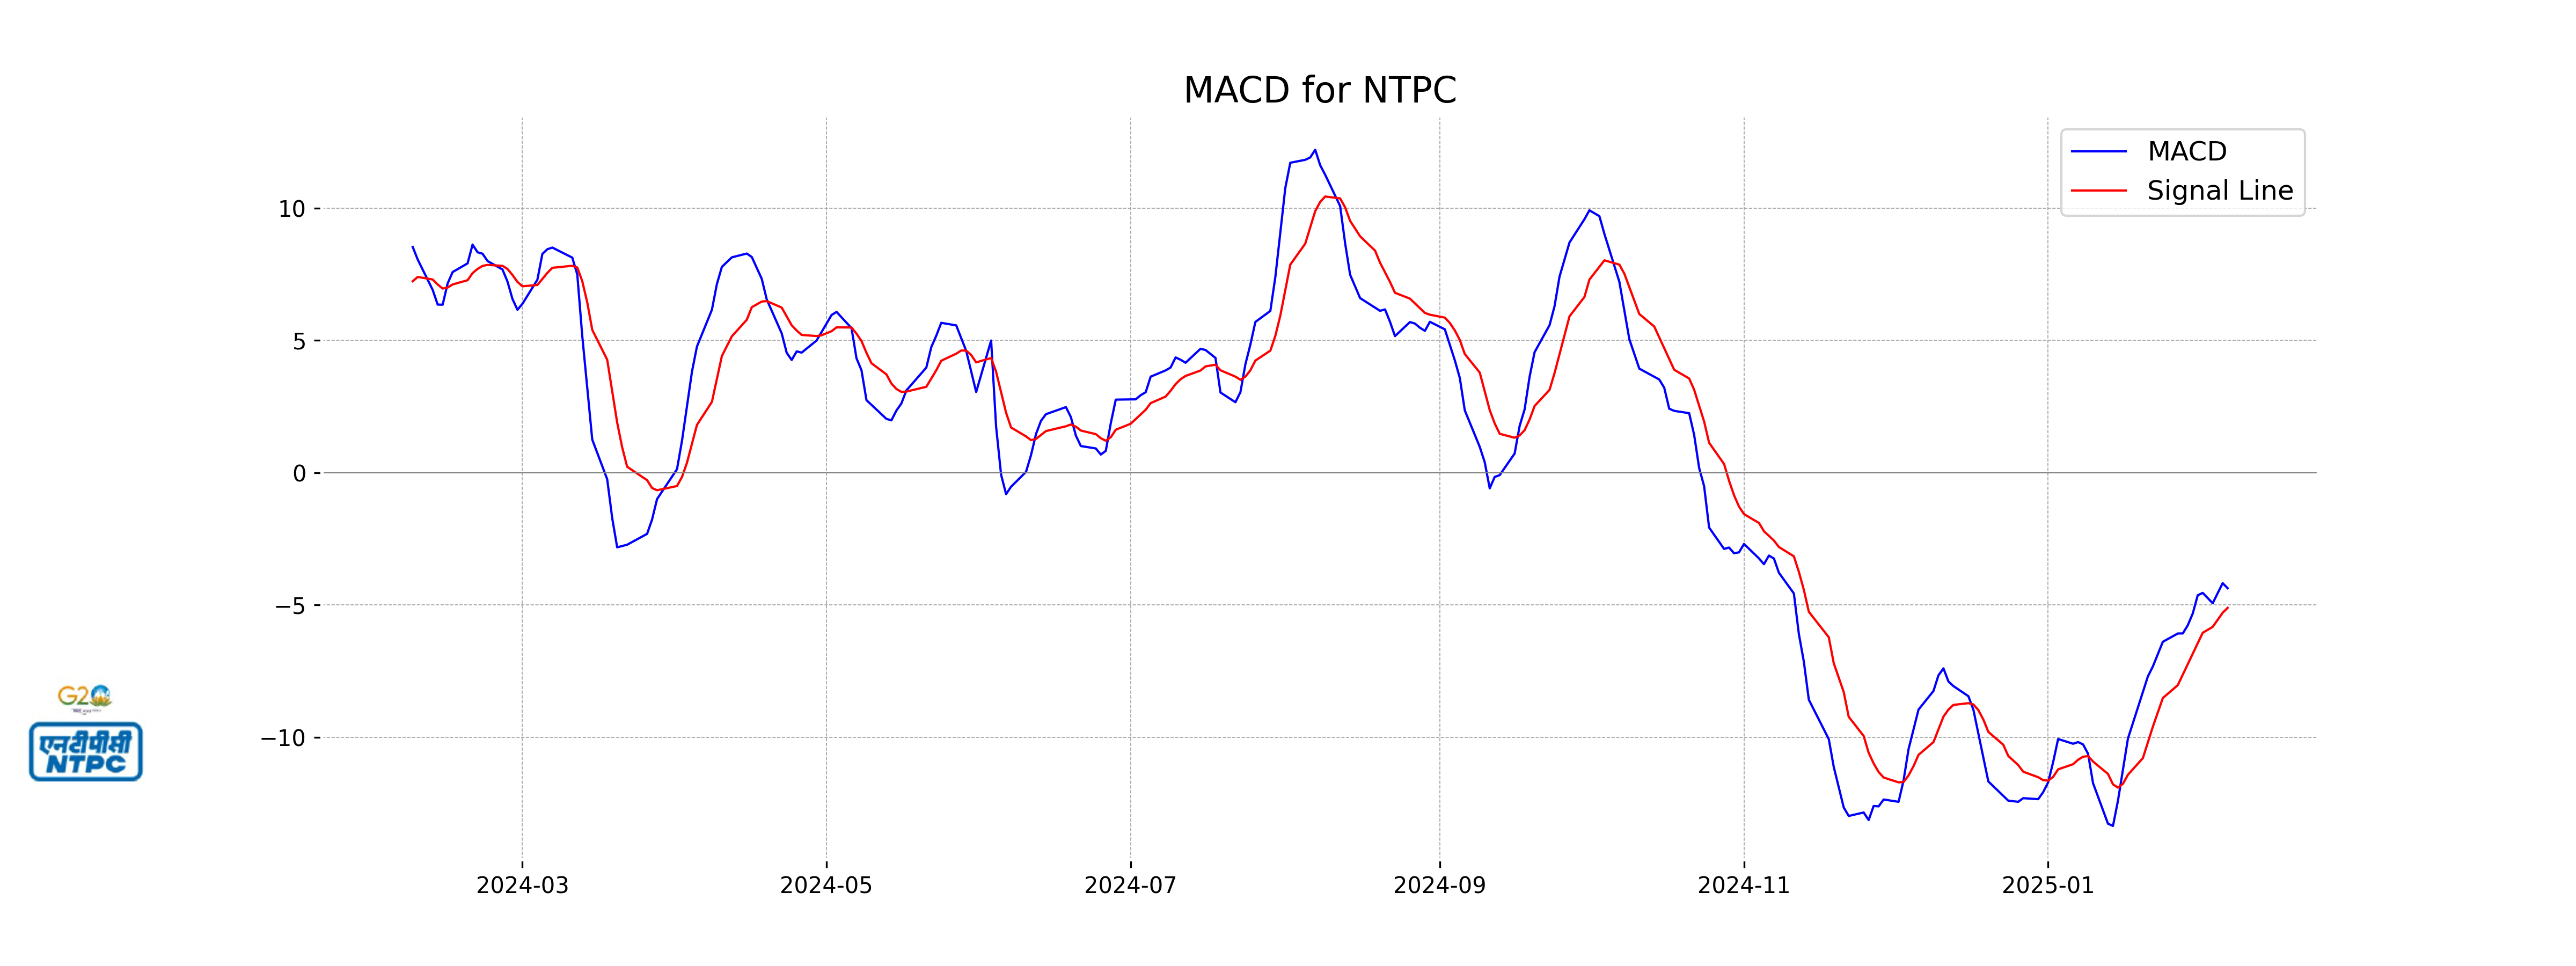
Moving Averages Trend (MACD)
The MACD for NTPC shows a bearish signal as it is at -4.368, with the MACD line above the signal line (-5.110). This suggests a potential downtrend as the MACD value is negative, indicating that momentum is weakening.
RSI Analysis
The RSI of NTPC is 41.67, which suggests that the stock is neither overbought nor oversold, indicating a relatively neutral momentum. Typically, an RSI below 30 is considered oversold, and above 70 is considered overbought. With its current RSI, NTPC's stock may be consolidating.
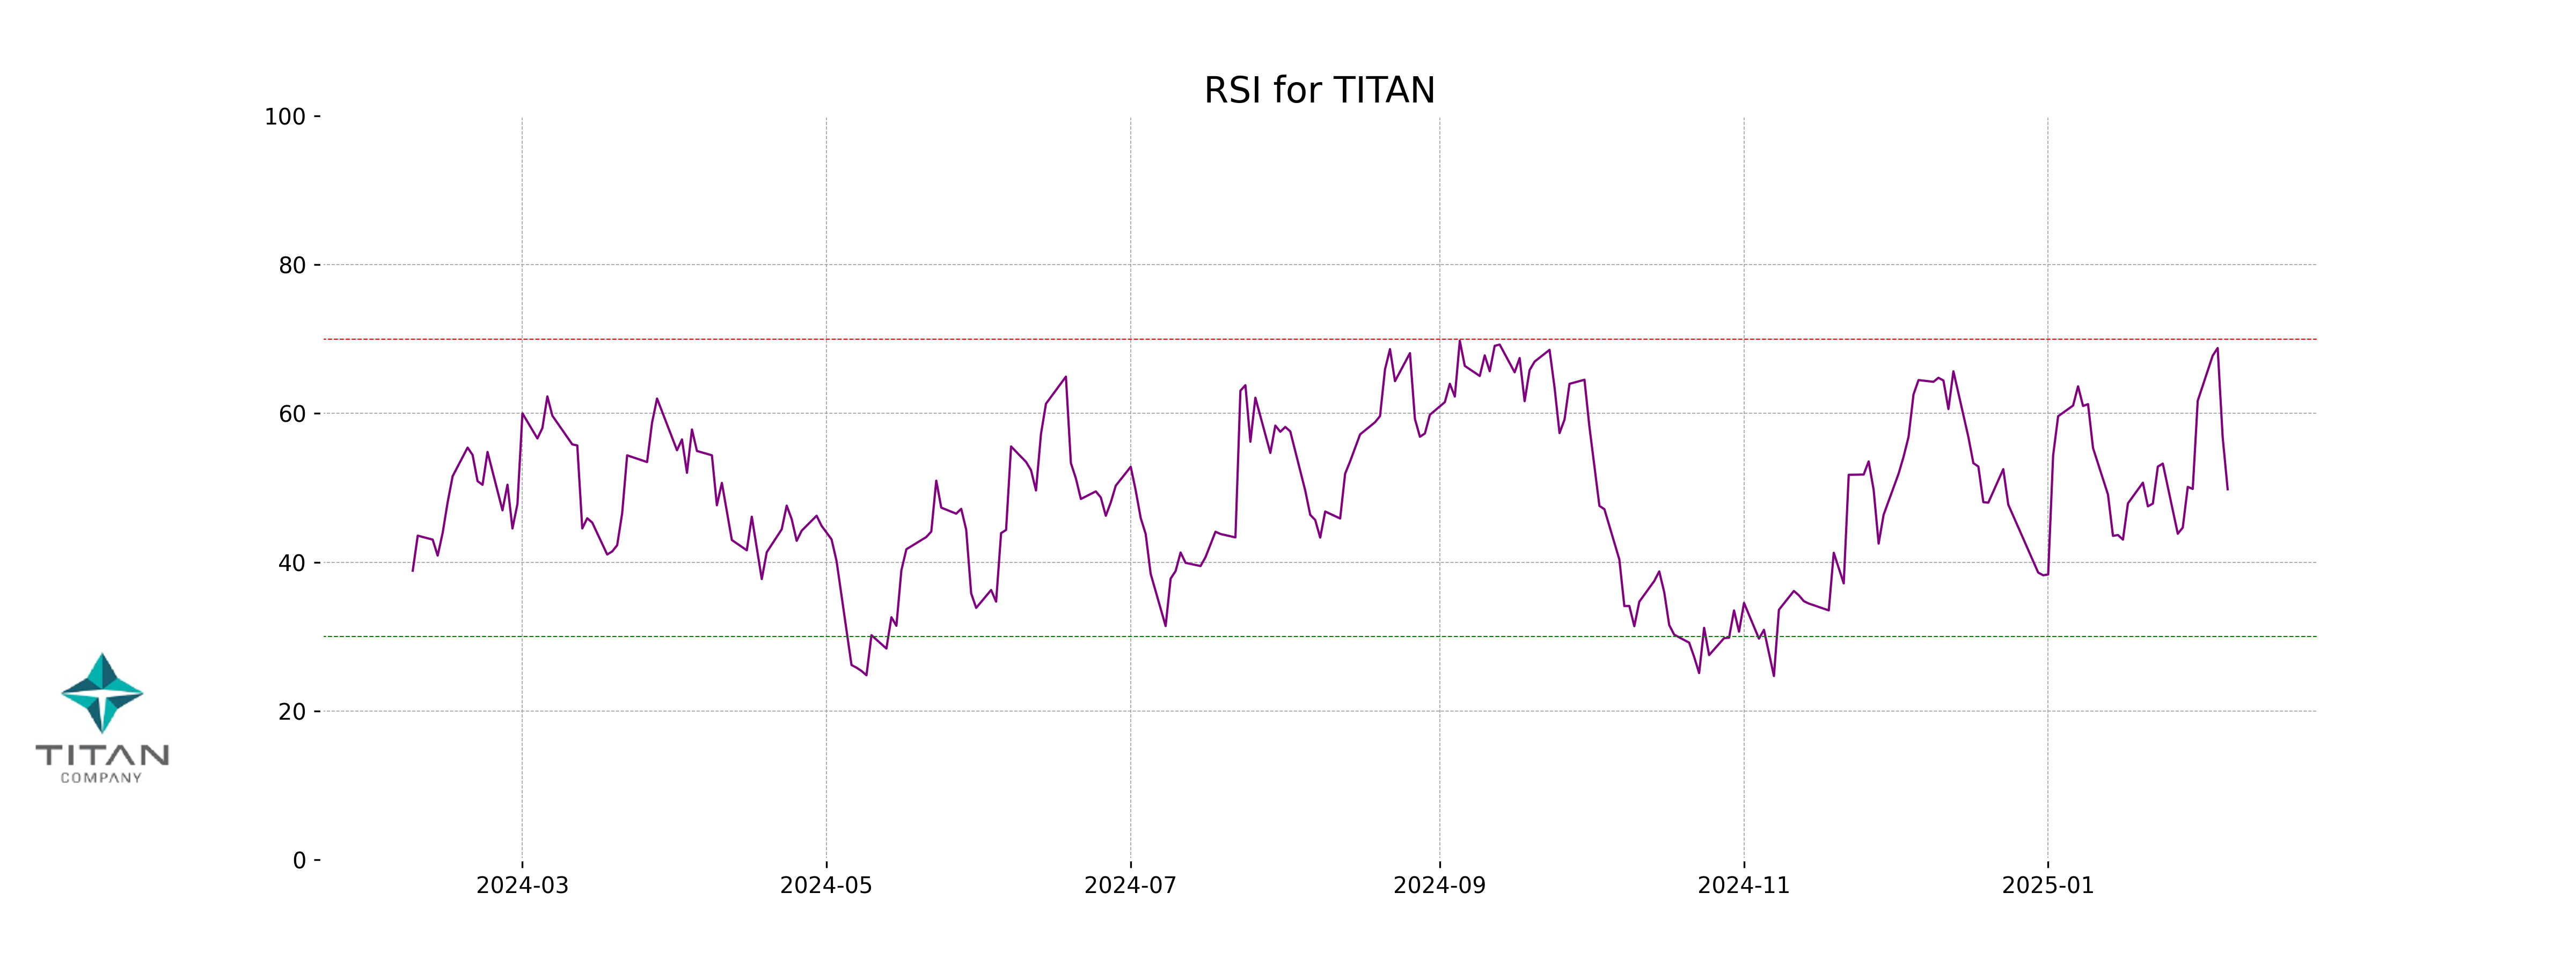
Analysis for Titan Company - February 06, 2025
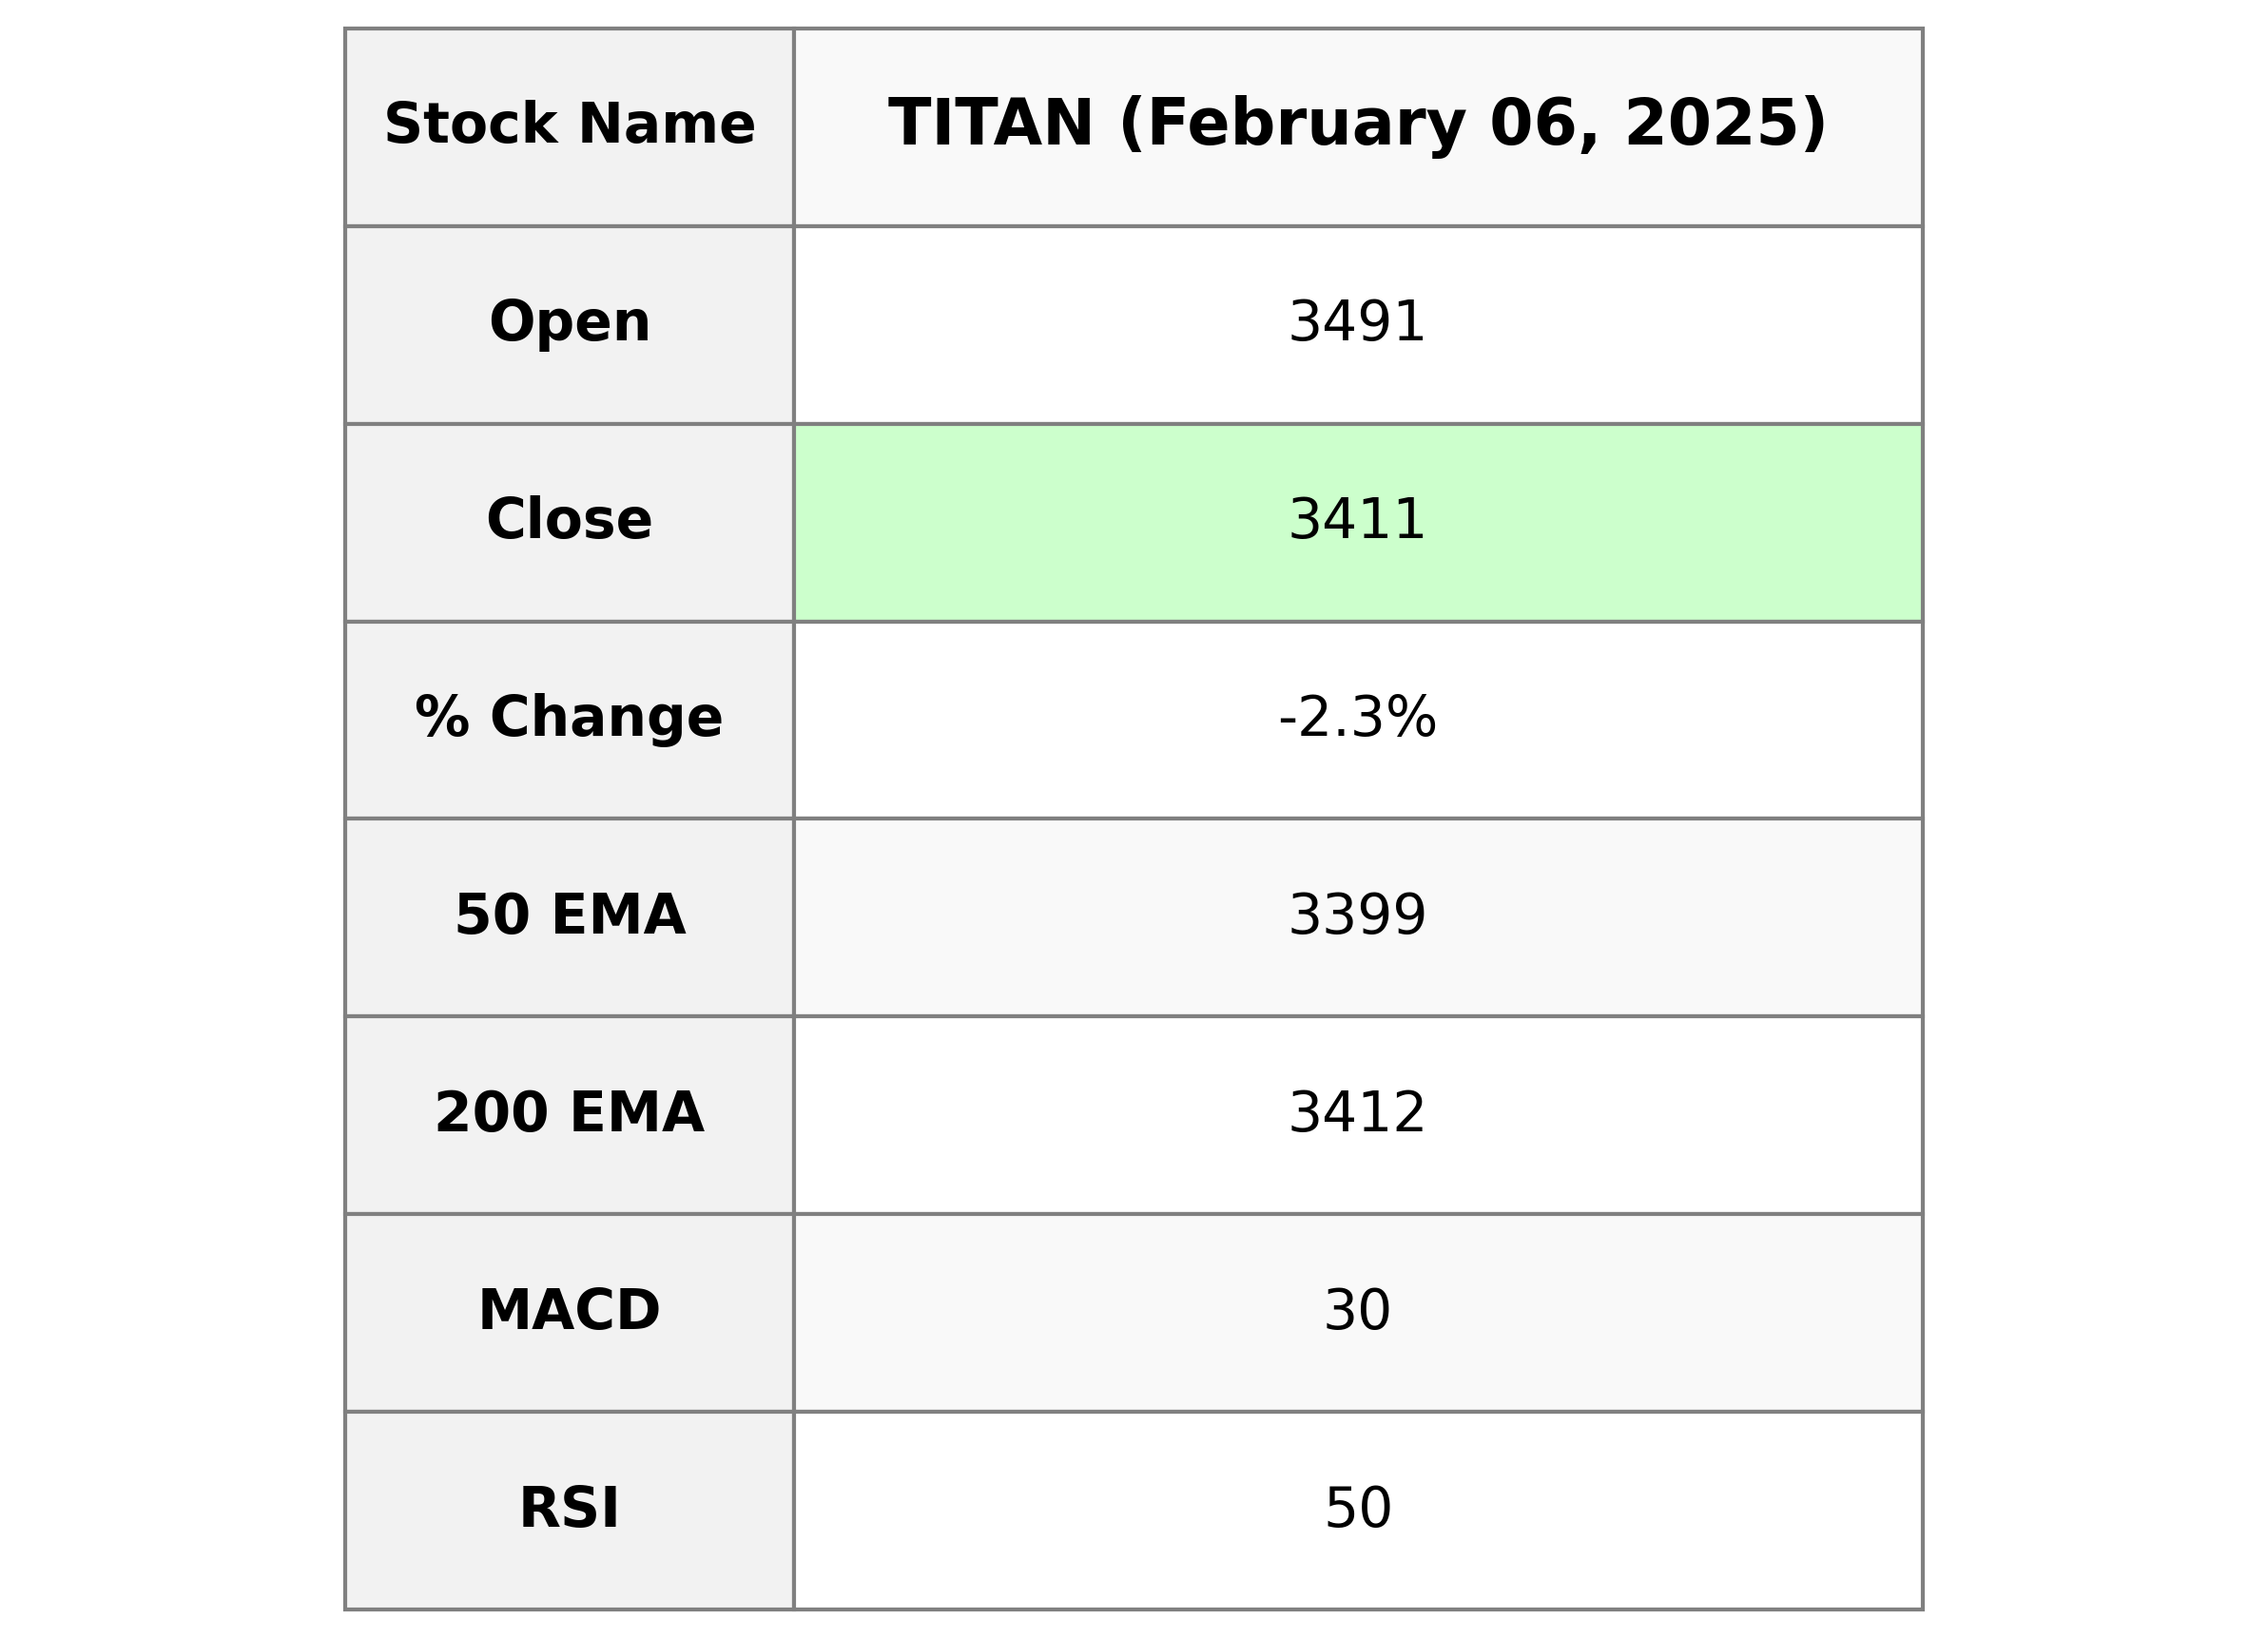
Titan Company showed a negative performance with its stock closing at 3410.75, which reflects a decline of approximately 2.30% compared to the previous close. The trading volume was 1,059,583 shares, and its market capitalization stood at 3,025,488,576,512 INR. The stock is part of the consumer cyclical sector, specifically in luxury goods, and shows a PE ratio of 93.06, indicating investor expectations for future growth.
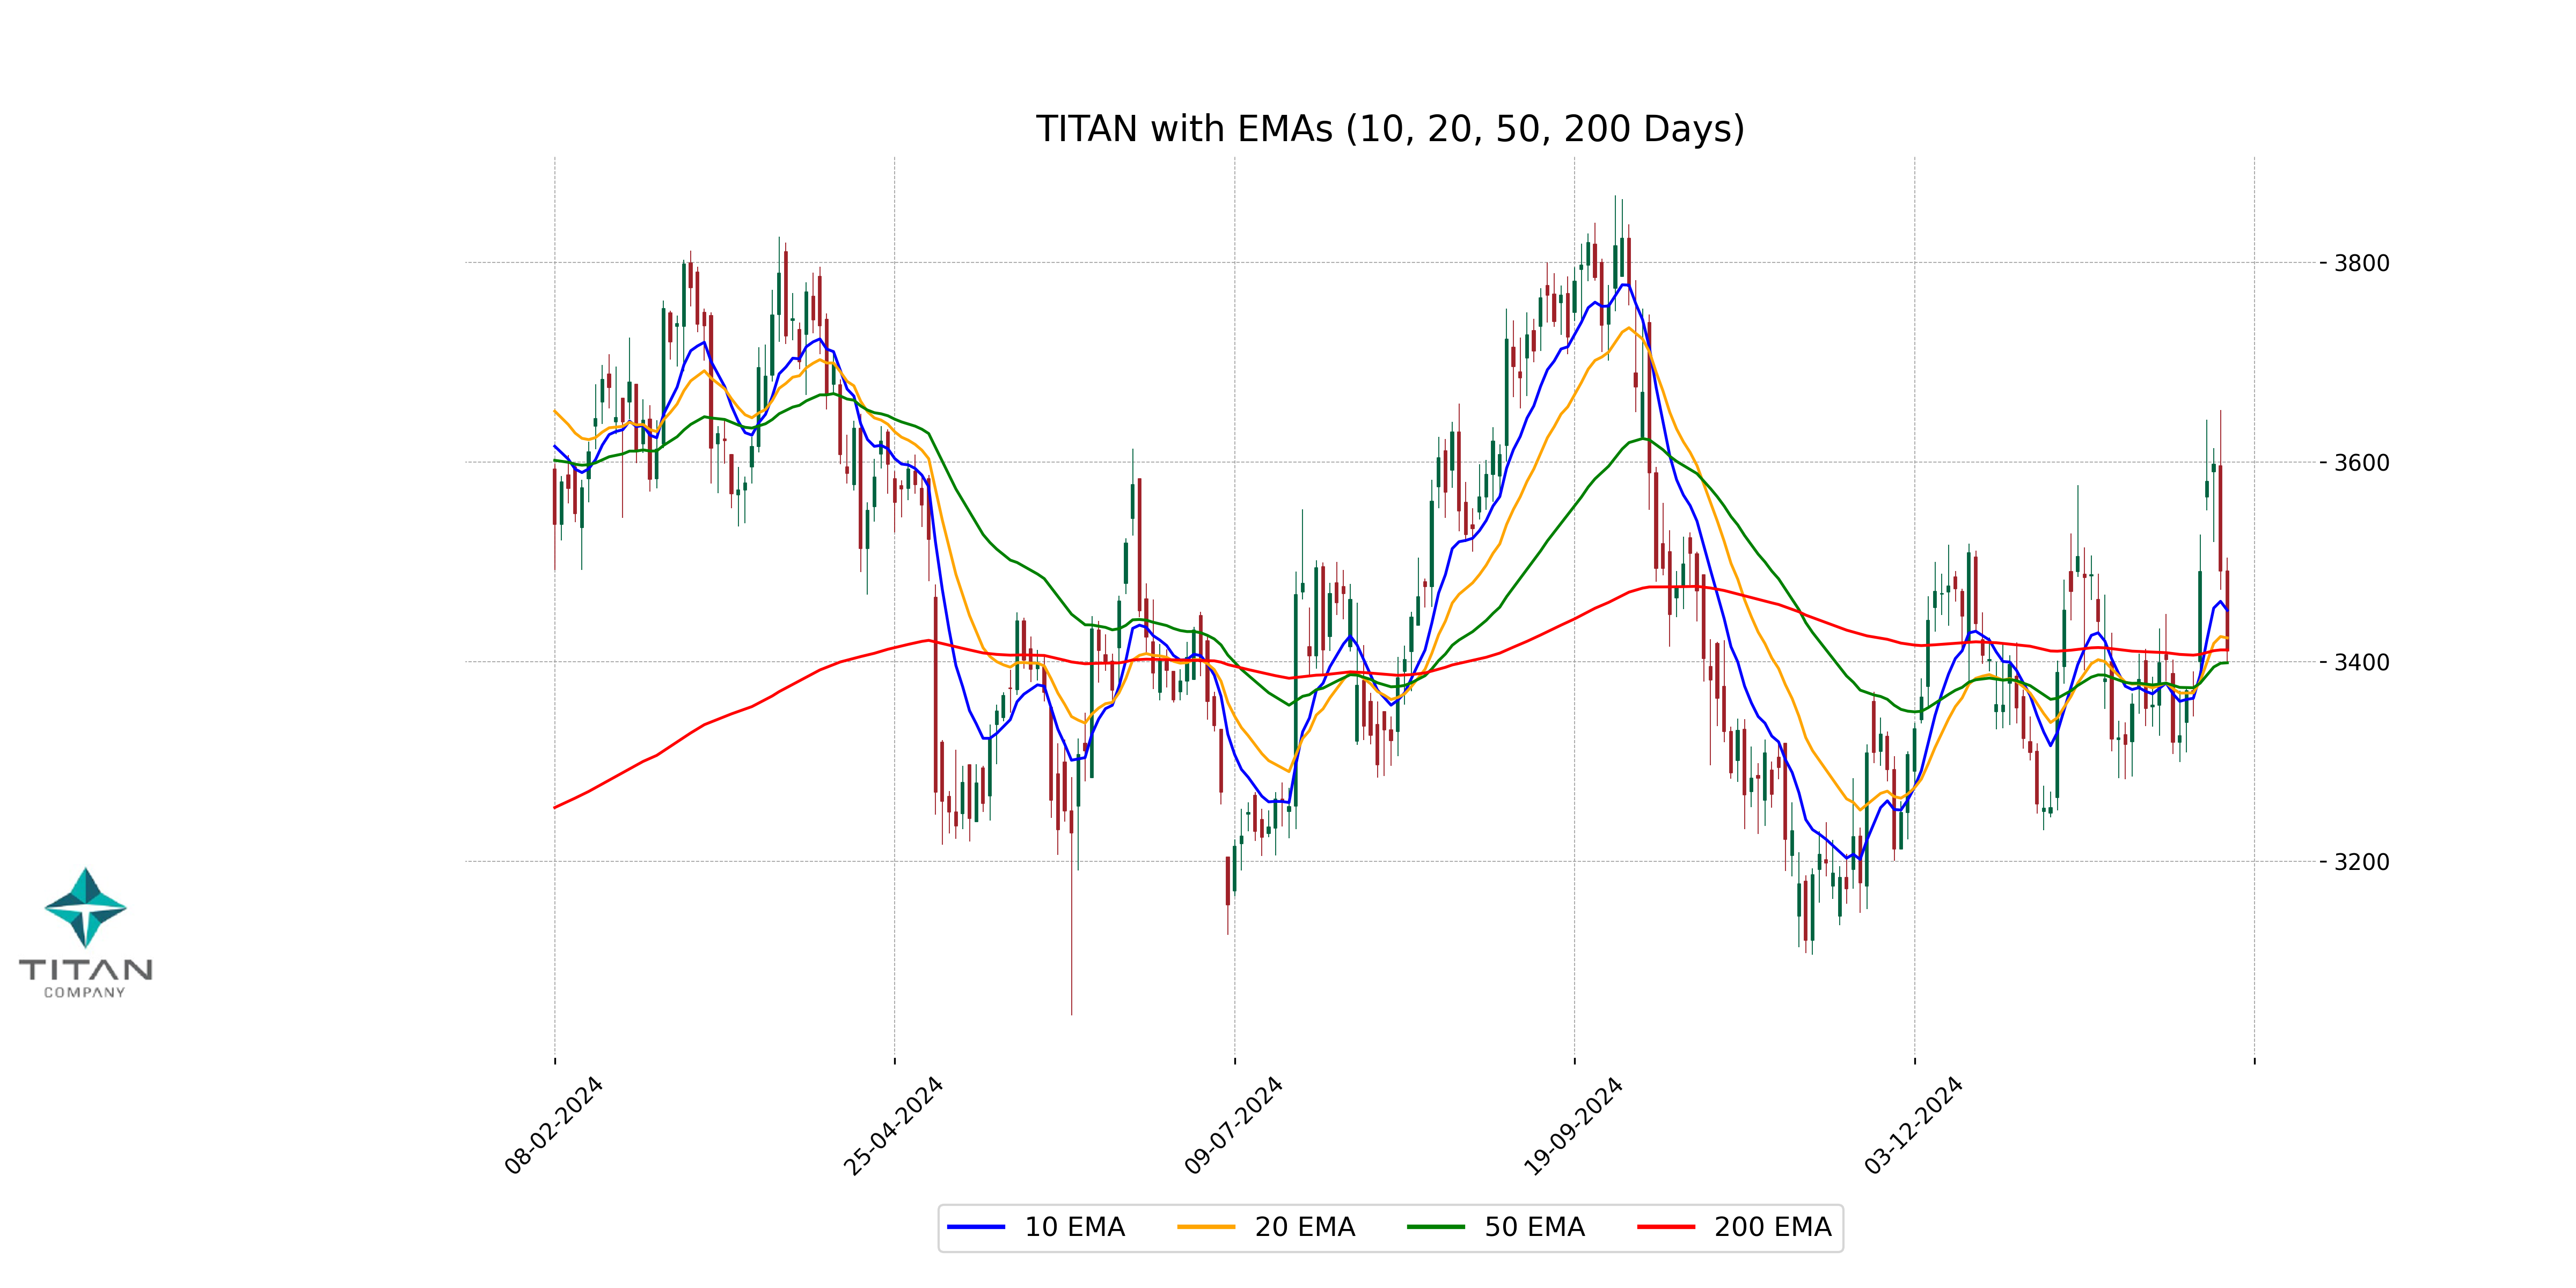
Relationship with Key Moving Averages
**Relationship with Key Moving Averages for Titan Company:** The current close price of 3410.75 is below the 50-day EMA of 3398.82 but slightly above the 200-day EMA of 3411.69, suggesting a short-term downtrend. The 10-day EMA of 3451.37 is above the close, indicating potential resistance.
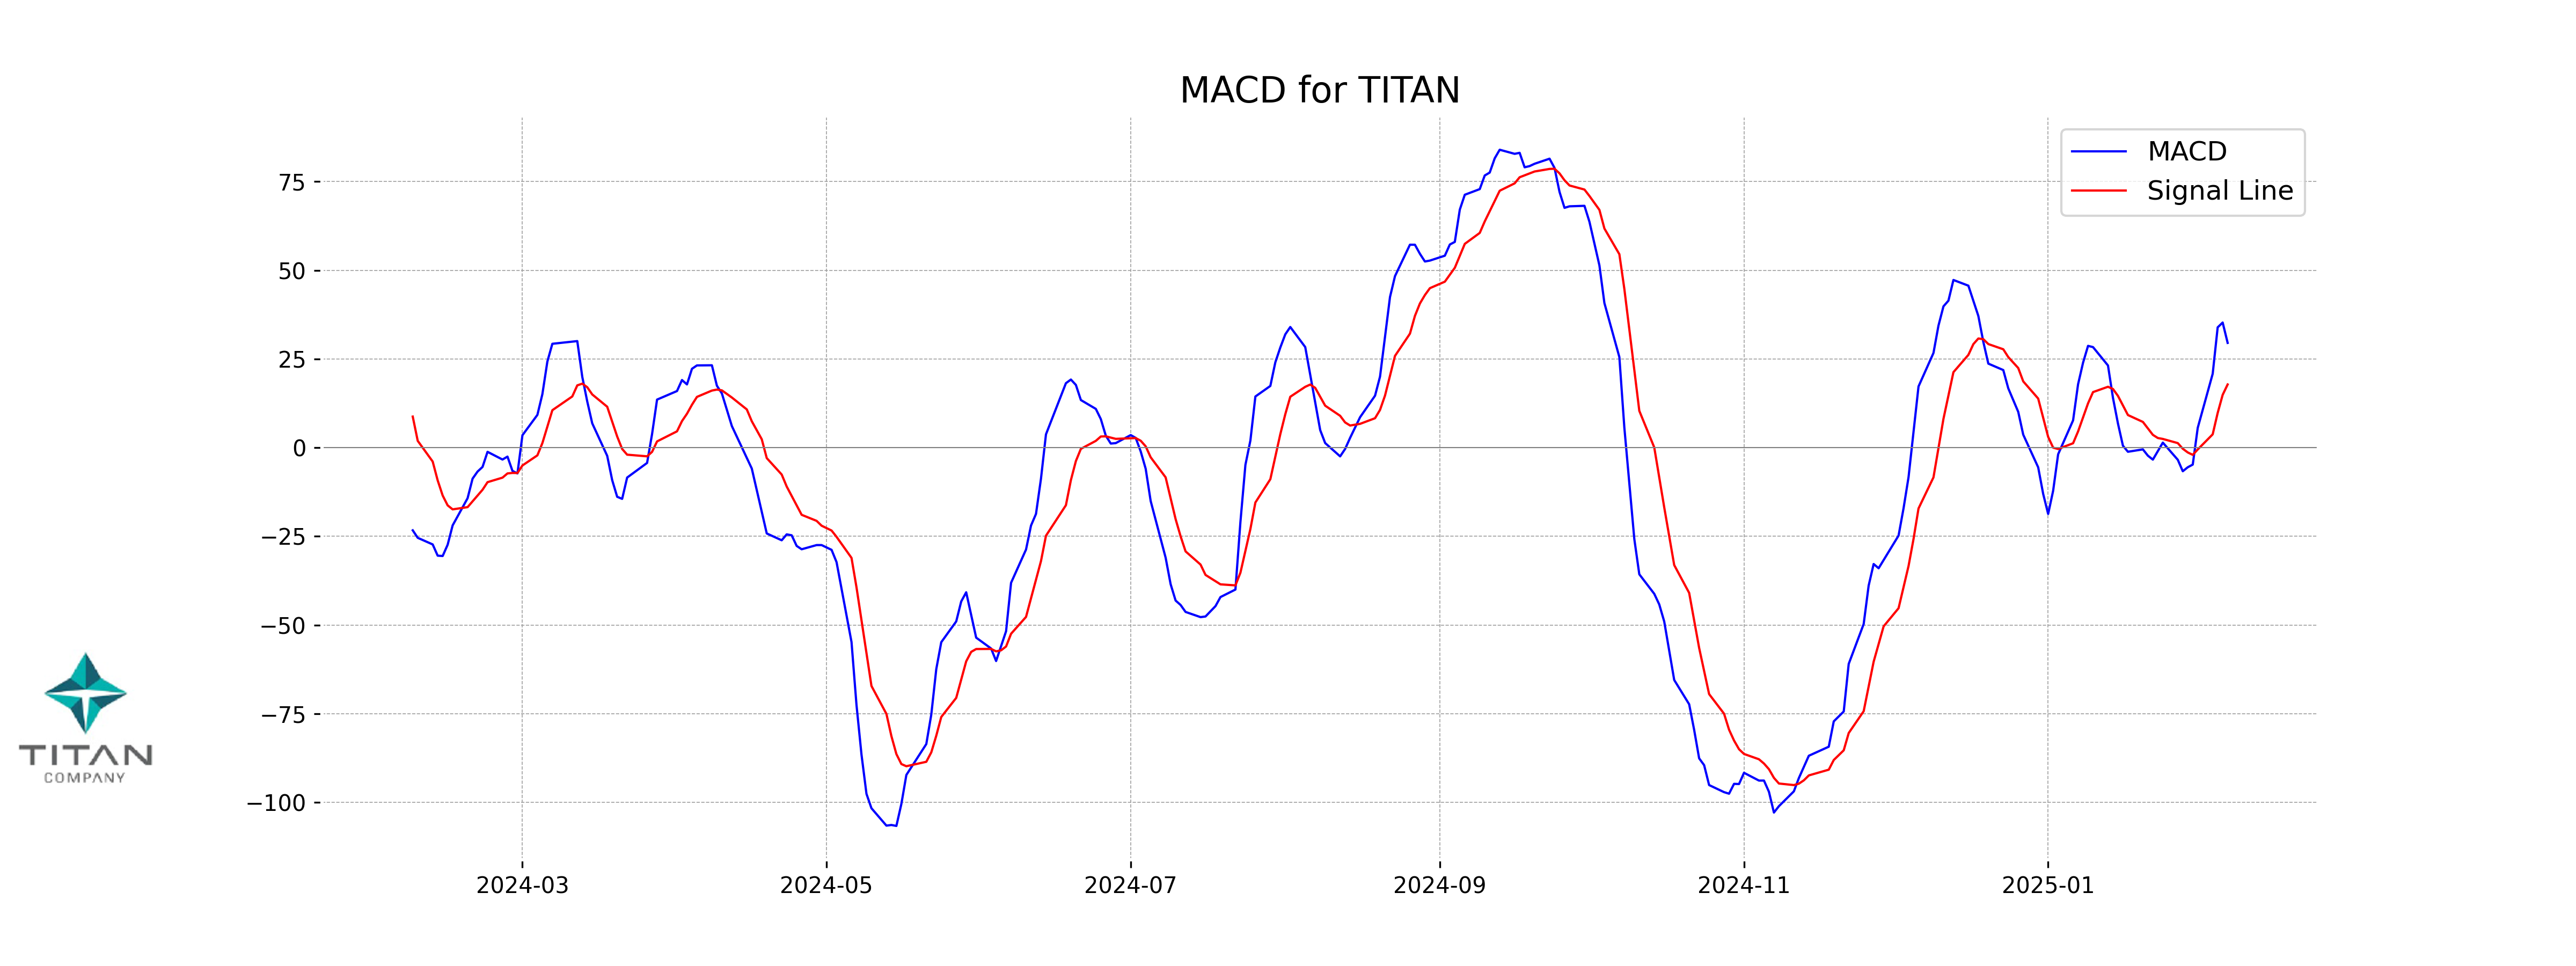
Moving Averages Trend (MACD)
Titan Company exhibits a positive MACD of 29.54, which is above its signal line at 17.82, indicating a bullish momentum. This suggests that the stock might experience further upward movement if the momentum sustains. However, other indicators and broader market conditions should be considered for a comprehensive analysis.
RSI Analysis
The Relative Strength Index (RSI) for Titan Company is 49.81, suggesting that the stock is currently in a neutral position. This indicates that there is no significant momentum in either the bullish or bearish direction, and the stock is neither overbought nor oversold.
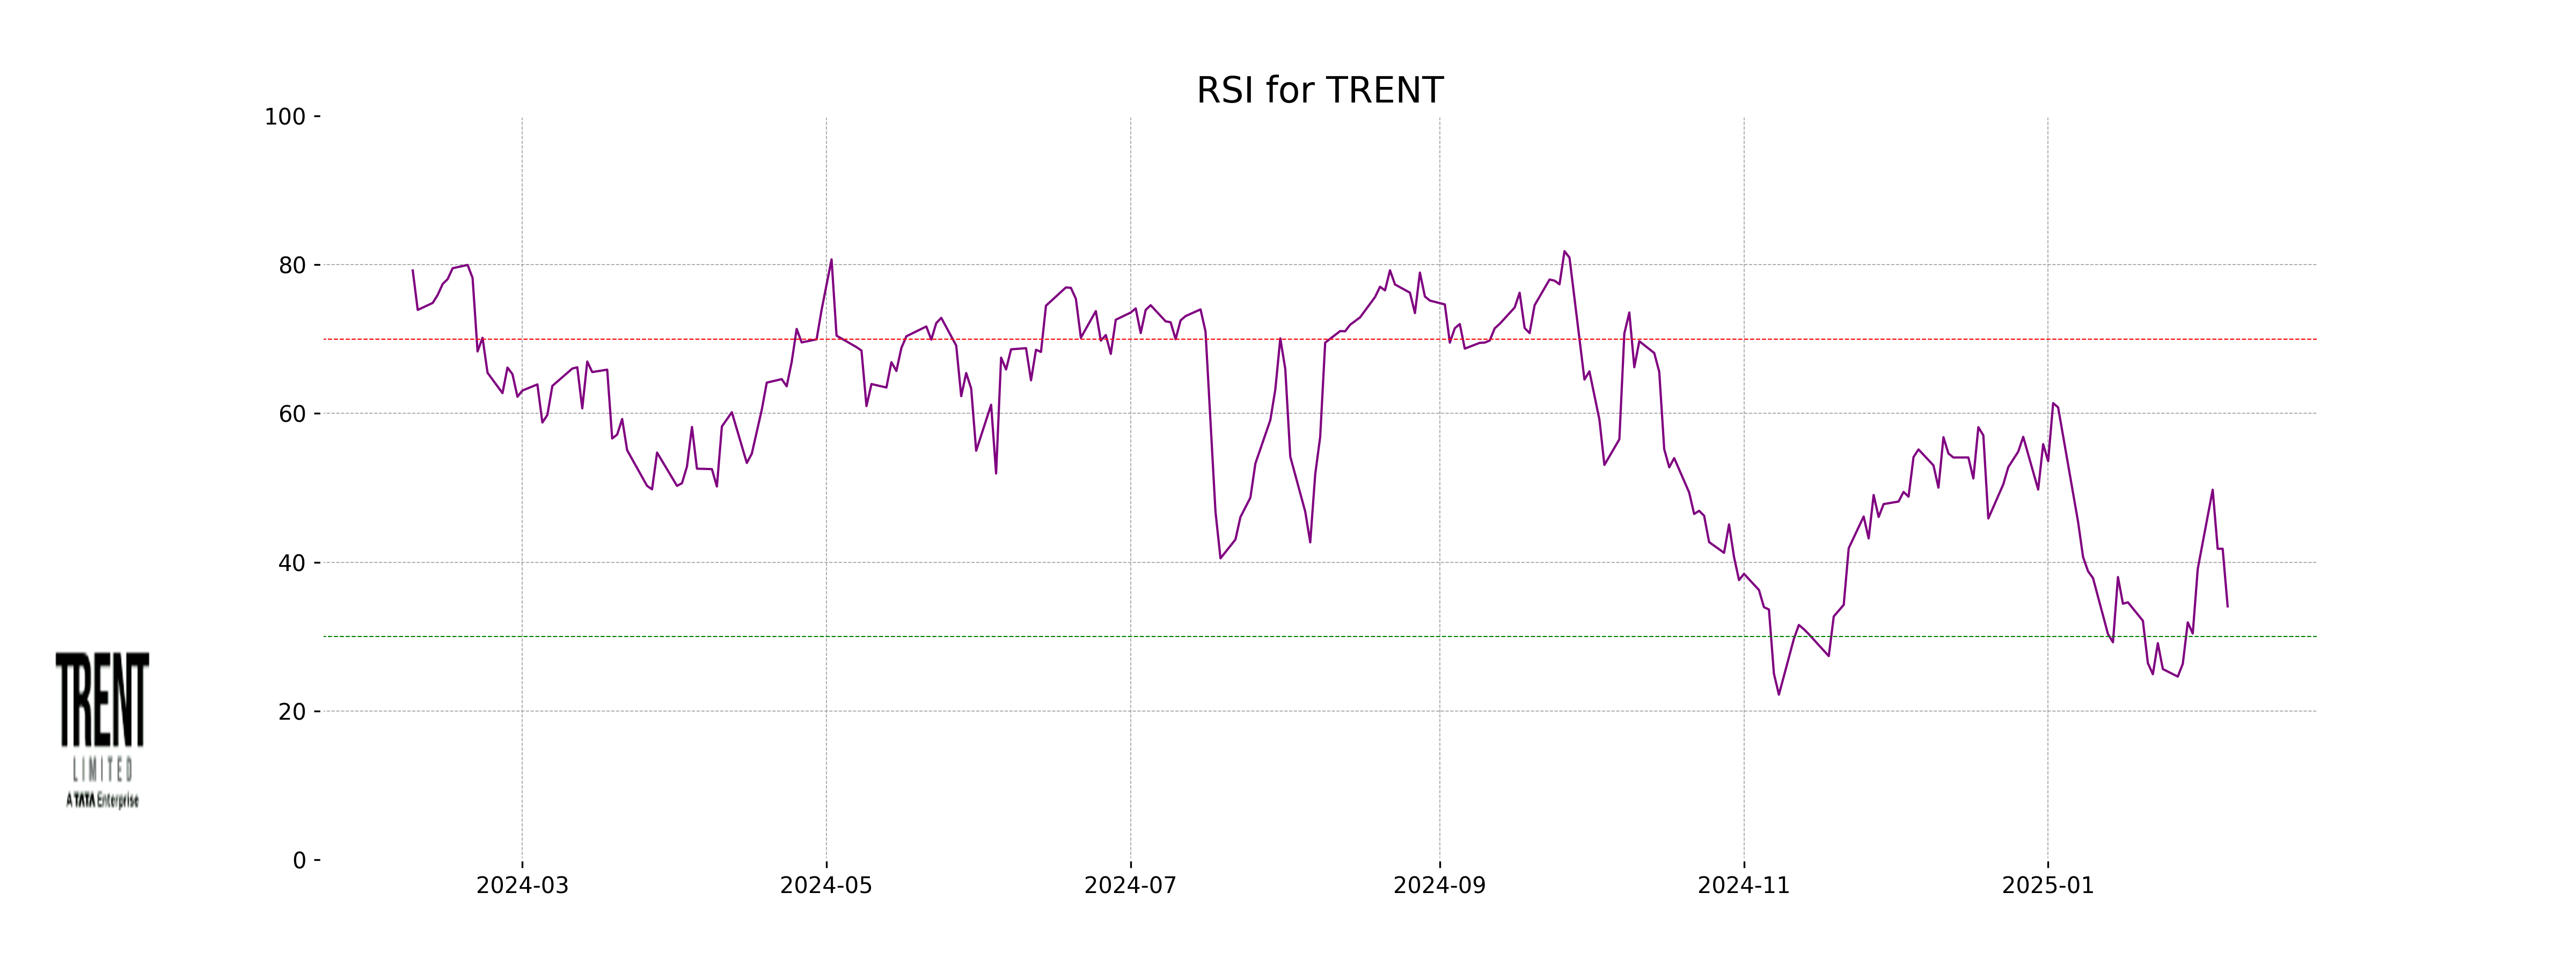
Analysis for Trent - February 06, 2025
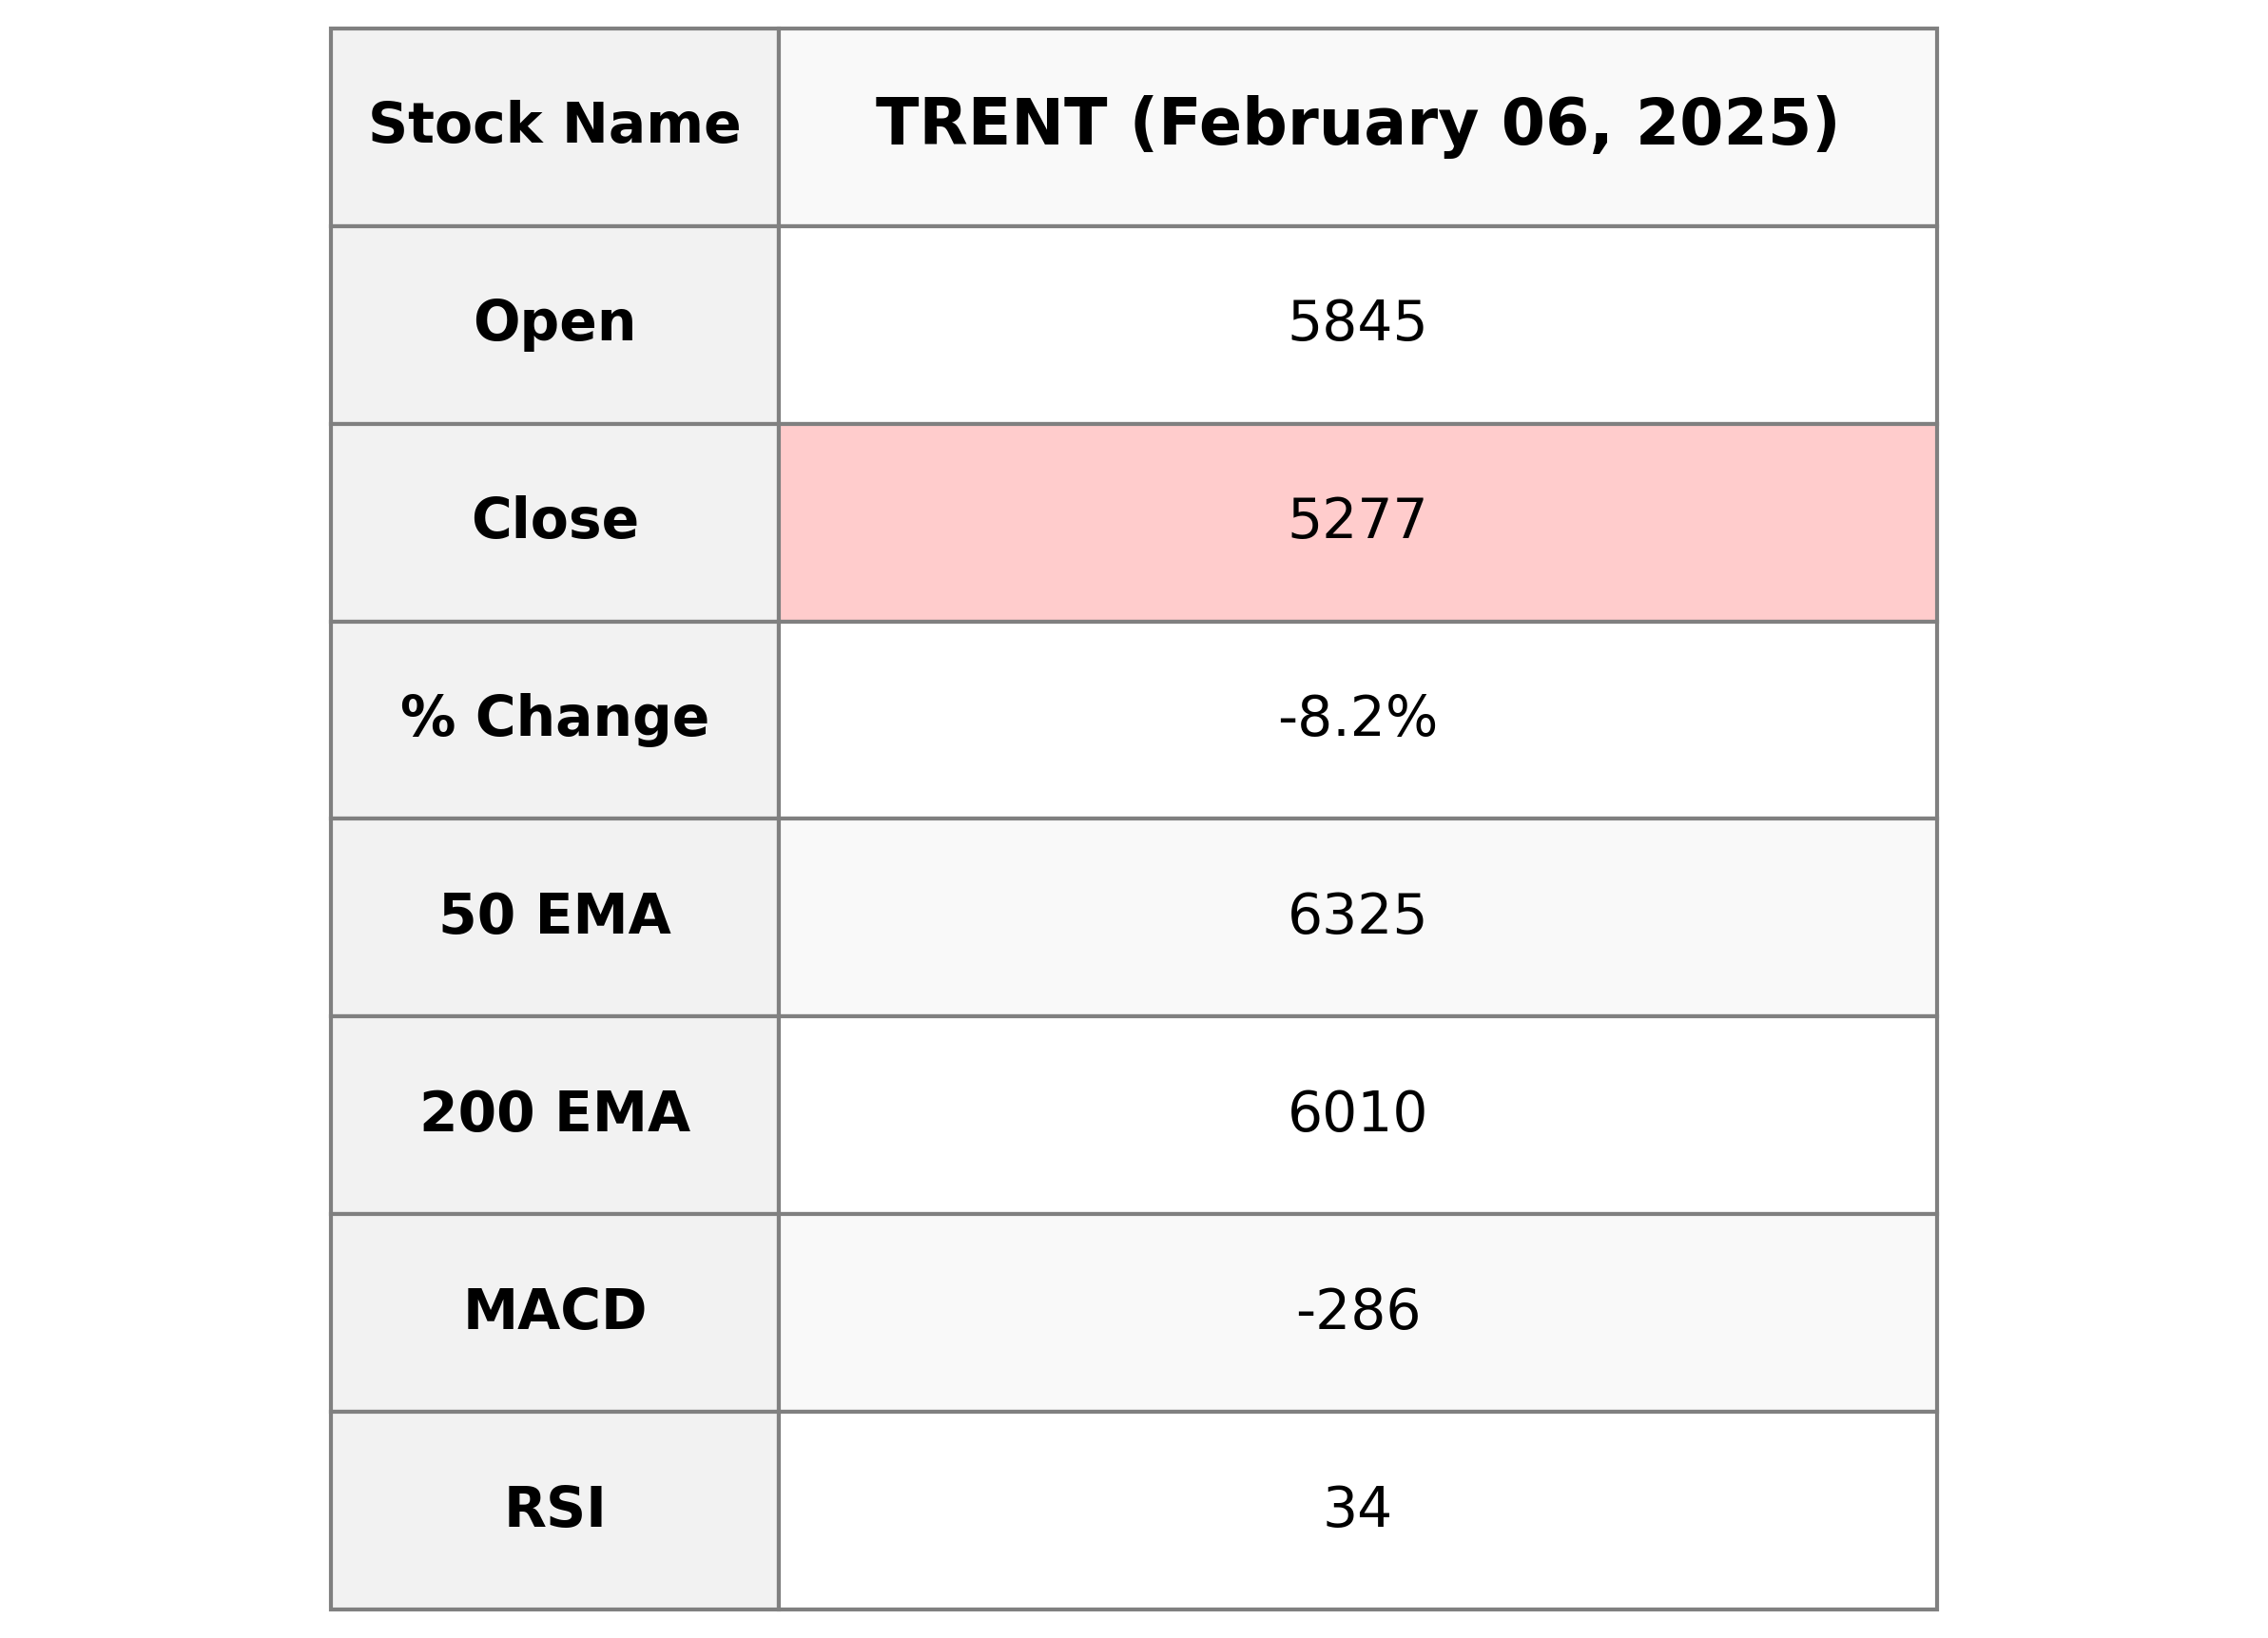
Trent has experienced a notable decline in its stock performance, with the closing price down by 8.22% from the previous close, reflecting a significant drop of 472.85 points. The stock's recent trading level is below both the 50-day and 200-day EMAs, suggesting a bearish trend. Additionally, the RSI value of 34.06 indicates that the stock is potentially oversold.
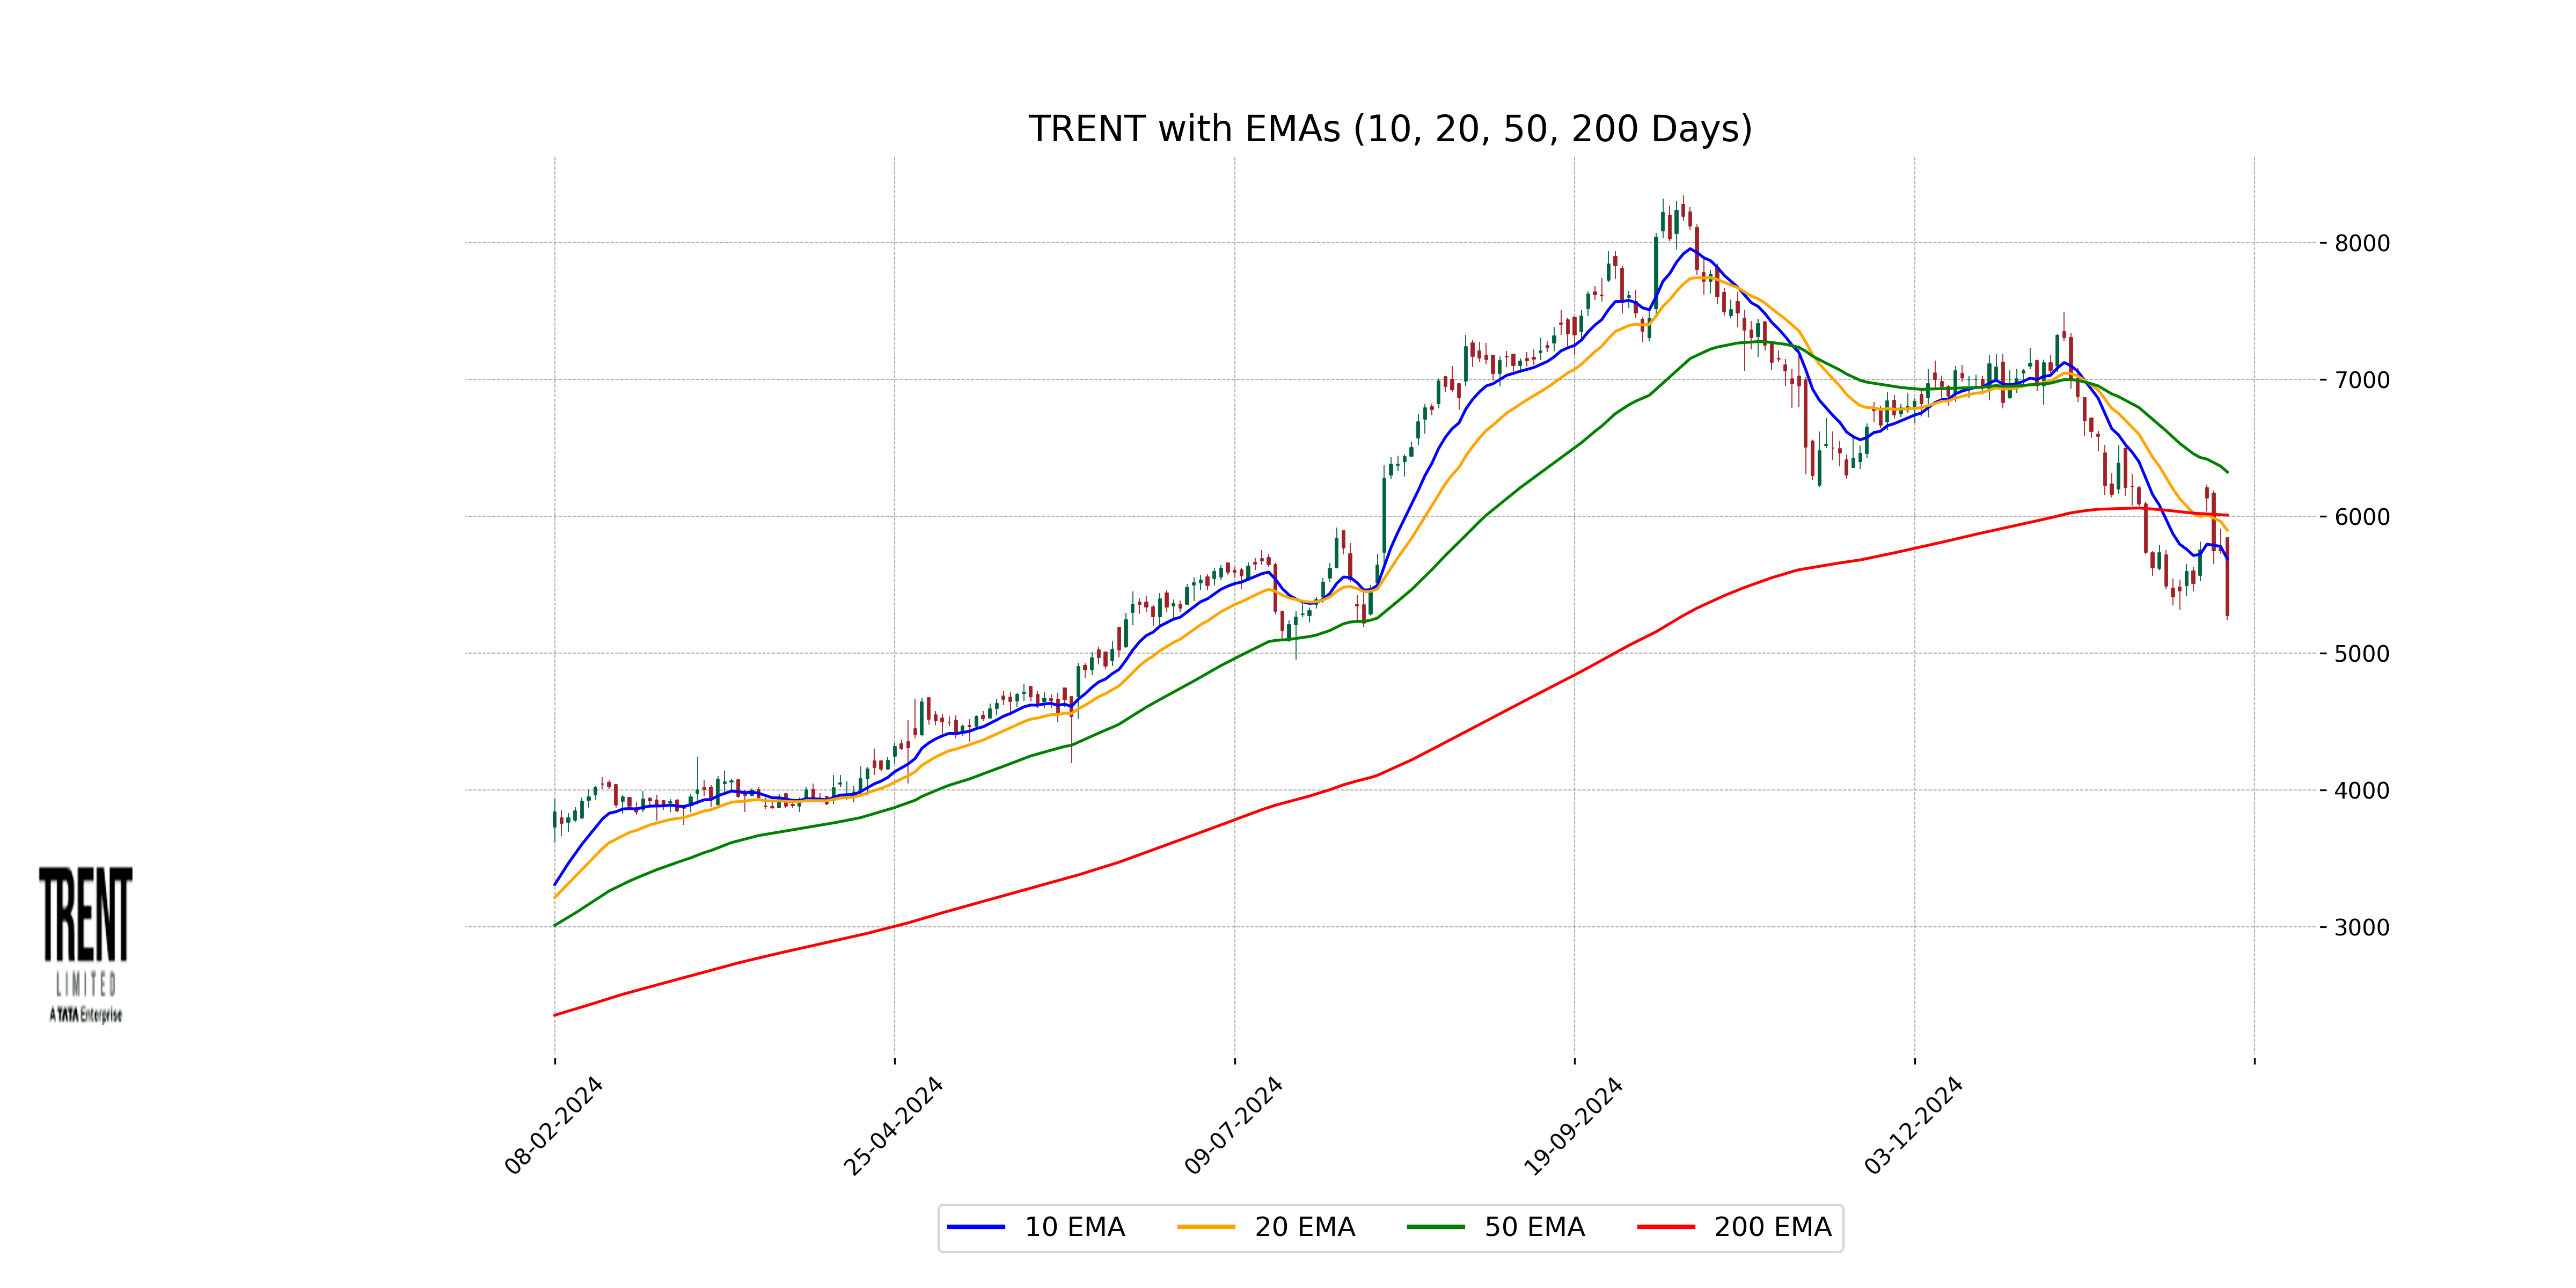
Relationship with Key Moving Averages
Trent's current close price of 5277.10 is significantly below its key moving averages, with the 50 EMA at 6325.15, 20 EMA at 5899.14, and 10 EMA at 5689.99, indicating a bearish trend. Additionally, the stock is also trading below its 200 EMA of 6009.88, further confirming a downward momentum relative to its historical averages.
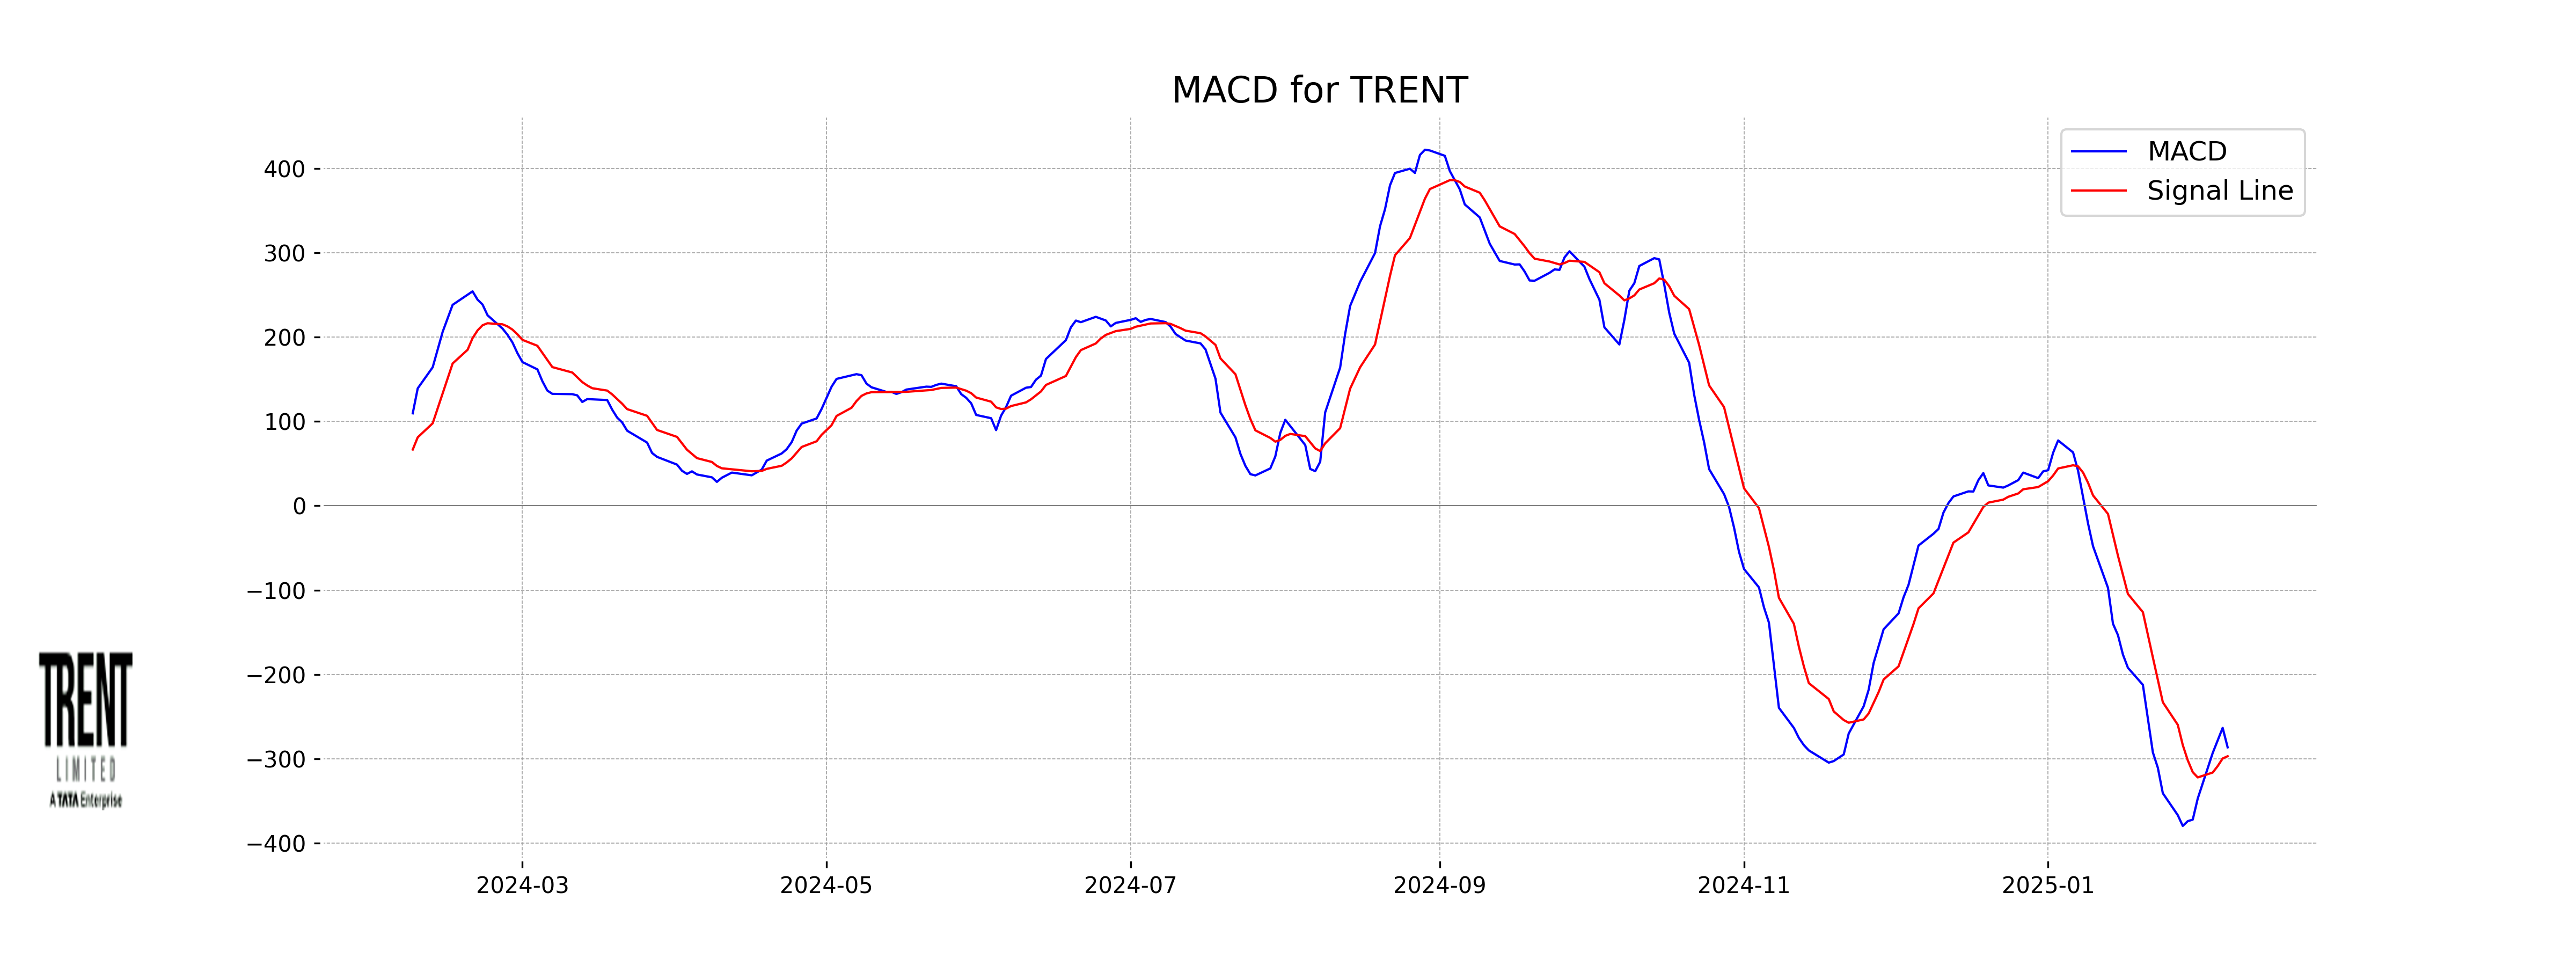
Moving Averages Trend (MACD)
The MACD for Trent is -286.32 with a signal line of -296.86, indicating a bearish trend. The negative MACD value and its position below the signal line suggest a potential continuation of downward momentum.
RSI Analysis
The Relative Strength Index (RSI) for Trent stands at 34.06, indicating that the stock is currently in the oversold territory. This suggests potential downward pressure in the short term, but it may also be viewed as a possible buying opportunity if RSI trends upwards.
Up Next
NSE Nifty 50: Top 5 stock losers of February 6, 2025

New Zealand commits USD 20 bn investment in India under FTA in 15 yrs; on lines of EFTA pact

India, New Zealand conclude FTA talks; pact to offer duty-free access, USD 20 bn FDI

FTA with New Zealand to significantly deepen bilateral economic engagement: Govt

Rupee breaches 91-mark against US dollar for first time in intra-day trade

Microsoft commits USD 17.5 billion investment in India: CEO Satya Nadella

More videos

CBI books Anil Ambani's son, Reliance Home Finance Ltd. in Rs 228 crore bank fraud case

RBI raises FY26 GDP growth projection to 7.3 pc

RBI trims policy interest rate by 25bps to 5.25pc, loans to get cheaper

Rupee slumps to all-time low of 90.25 against US dollar in intra-day trade

Reliance completes merger of Star Television Productions with Jiostar

India to lead emerging market growth with 7pc GDP rise in 2025: Moody’s

Nifty hits record high after 14 months; Sensex nears all-time peak

Reliance stops Russian oil use at its only-for-export refinery to comply with EU sanctions

ED attaches fresh assets worth over Rs 1,400 cr in case against Anil Ambani's Reliance Group

India signs one-year deal to import 2.2 million tonnes of LPG from US