


Highlights
- Britannia indicates mixed momentum.
- Eicher suggests strong bullishness.
- Trent shows bearish sentiment.
Latest news

Putin hails Ukraine gains, threatens more, in annual press conference

OnePlus Pad Go 2 Review: No drama, just a good tablet

Parliament Moment: Priyanka Gandhi shares tea with Rajnath Singh. PM Modi and Om Birla

Cold wave deepens in Kashmir as Chillai-Kalan nears, temperatures dip below freezing

Pakistan accuses India of attempting to undermine Indus treaty

Vande Mataram discussion in UP legislature to mark 150th anniversary: Yogi Adityanath

Ashes 2025: Travis Head slams unbeaten 142 to crush England's Ashes hopes

Tipra Motha youth wing protests Bangladesh leader's anti-India remarks in Agartala
NSE Nifty 50 Top losers: Who are the 5 Biggest Stock losers Today February 04, 2025


In this article, we will explore the technical indicators of some of the low-performing stocks on the Indian stock market, including BRITANNIA, EICHERMOT, HEROMOTOCO, NESTLEIND, and TRENT.
By looking at these stocks through the lens of key technical factors, we aim to better understand their price movements, trends, and potential future performance.

Analysis for Britannia - February 04, 2025

**Stock Symbol:** BRITANNIA.NS **Performance:** On the specified trading day, Britannia closed at 5028.35, which is a 1.51% decrease from its previous close of 5105.55, losing 77.20 points. The stock saw a trading volume of 434,662 shares. Notably, the 10-day EMA (5047.36) is above the closing price, while the RSI sits at 54.05, indicating moderate relative strength. The stock's MACD indicates a positive trend above the signal line.

Relationship with Key Moving Averages
The stock price of Britannia (close: 5028.35) is currently slightly above its 50-day EMA (5018.61), indicating a short-term bullish trend, but below the 200-day EMA (5226.71), suggesting an overall bearish outlook. Additionally, it is below the 10-day EMA (5047.36) yet above the 20-day EMA (4995.54), showing mixed short-term momentum.
Moving Averages Trend (MACD)
The MACD for Britannia (BRITANNIA.NS) is 54.98, with a MACD Signal of 41.84, indicating a positive trend as the MACD line is above the signal line. This suggests potential bullish momentum in the stock.

RSI Analysis
Based on the given data, Britannia's RSI (Relative Strength Index) is 54.05, which indicates that the stock is in a neutral zone. This suggests that it is neither overbought nor oversold, providing a balanced outlook for potential trading opportunities.

Analysis for Eicher Motors - February 04, 2025

**Eicher Motors (Stock Symbol: EICHERMOT.NS)**: Eicher Motors experienced a slight decline in stock price with a closing price of 5450.10, down 0.64% from the previous close. The company's stock market performance shows strong indicators with an RSI at 68.48 and a positive MACD value. With a substantial market cap, the auto manufacturer continues to be a significant player in India's consumer cyclical sector.

Relationship with Key Moving Averages
The closing price of Eicher Motors (EICHERMOT.NS) is currently above both the 50-day EMA (5030.11) and the 200-day EMA (4724.66), indicating a strong bullish trend. However, the price is slightly above the 10-day EMA (5241.53) and the 20-day EMA (5155.04), suggesting short-term overextension.
Moving Averages Trend (MACD)
**MACD Analysis for Eicher Motors:** The MACD for Eicher Motors stands at 98.75, with a signal line at 66.87. This indicates a positive momentum, as the MACD line is above the signal line, suggesting a potential bullish trend continuation.

RSI Analysis
Based on the provided data, Eicher Motors has an RSI value of 68.48. This suggests that the stock is approaching the overbought territory, indicating potential resistance or a possible pullback. A value above 70 typically signals that the asset might be overvalued, warranting caution for further buying.

Analysis for Hero MotoCorp - February 04, 2025

**Symbol:** HEROMOTOCO.NS Hero MotoCorp faced a slight decline in stock performance with a closing price of INR 4237.10, marking a decrease of approximately 1.16% from the previous close. The stock is trading below its 50 EMA and 200 EMA, indicating potential bearish momentum, while the RSI suggests a neutral trend. The company's market capitalization stands at approximately INR 847.42 billion, with its PE Ratio at 20.77.

Relationship with Key Moving Averages
Hero MotoCorp's stock is trading close to its 10-day and 20-day Exponential Moving Averages (EMAs), indicating potential short-term support or resistance levels. However, it remains below the 50-day and 200-day EMAs, suggesting bearish momentum in the medium to long term. The close proximity to the 10-day and 20-day EMAs may hint at a possible consolidation phase.
Moving Averages Trend (MACD)
Based on the data provided, Hero MotoCorp has a MACD value of -25.55 and a MACD Signal of -68.77, indicating a bullish crossover since the MACD is above the Signal line. This could suggest a potential upward momentum in the stock price if the trend continues.

RSI Analysis
The RSI (Relative Strength Index) for Hero MotoCorp is approximately 52.94, indicating a neutral momentum. With RSI values below 30 generally suggesting undervaluation (oversold conditions) and values above 70 suggesting overvaluation (overbought conditions), a value around 50 suggests that the stock is neither overbought nor oversold, and it is in a balanced state.

Analysis for Nestle - February 04, 2025

Nestlé India Limited, trading under the symbol NESTLEIND.NS, experienced a decline of 0.76% on the reported day, closing at 2299.45 from its previous close of 2317.10. The stock exhibited a range from a high of 2322.80 to a low of 2283.70. Despite the daily drop, technical indicators such as EMA and RSI suggest a stable medium to long-term trend in the Consumer Defensive sector.

Relationship with Key Moving Averages
The stock price of Nestle India (NESTLEIND.NS) is currently below its 200-day EMA (2355.50) and just above its 50-day EMA (2241.61), indicating a potential mixed sentiment among traders. The 10-day EMA (2260.15) is slightly above the recent close, suggesting short-term bullish momentum, while the 20-day EMA (2237.23) aligns closely with it. Overall, the price activity shows proximity to recent averages, reflecting tentative investor behavior.
Moving Averages Trend (MACD)
The MACD for Nestle (NESTLEIND.NS) is 20.919, which is significantly above the MACD Signal of 6.301, suggesting a bullish momentum in the stock price. This indicates that the stock might be experiencing upward momentum, but investors should watch for any changes or crossing points with the MACD Signal for confirmation.

RSI Analysis
The Relative Strength Index (RSI) for Nestle is currently at 60.96, which indicates that the stock is in a neutral zone, approaching overbought conditions. It suggests that while the stock has seen some buying interest, it is not yet overextended to an overbought level (typically above 70).

Analysis for Trent - February 04, 2025
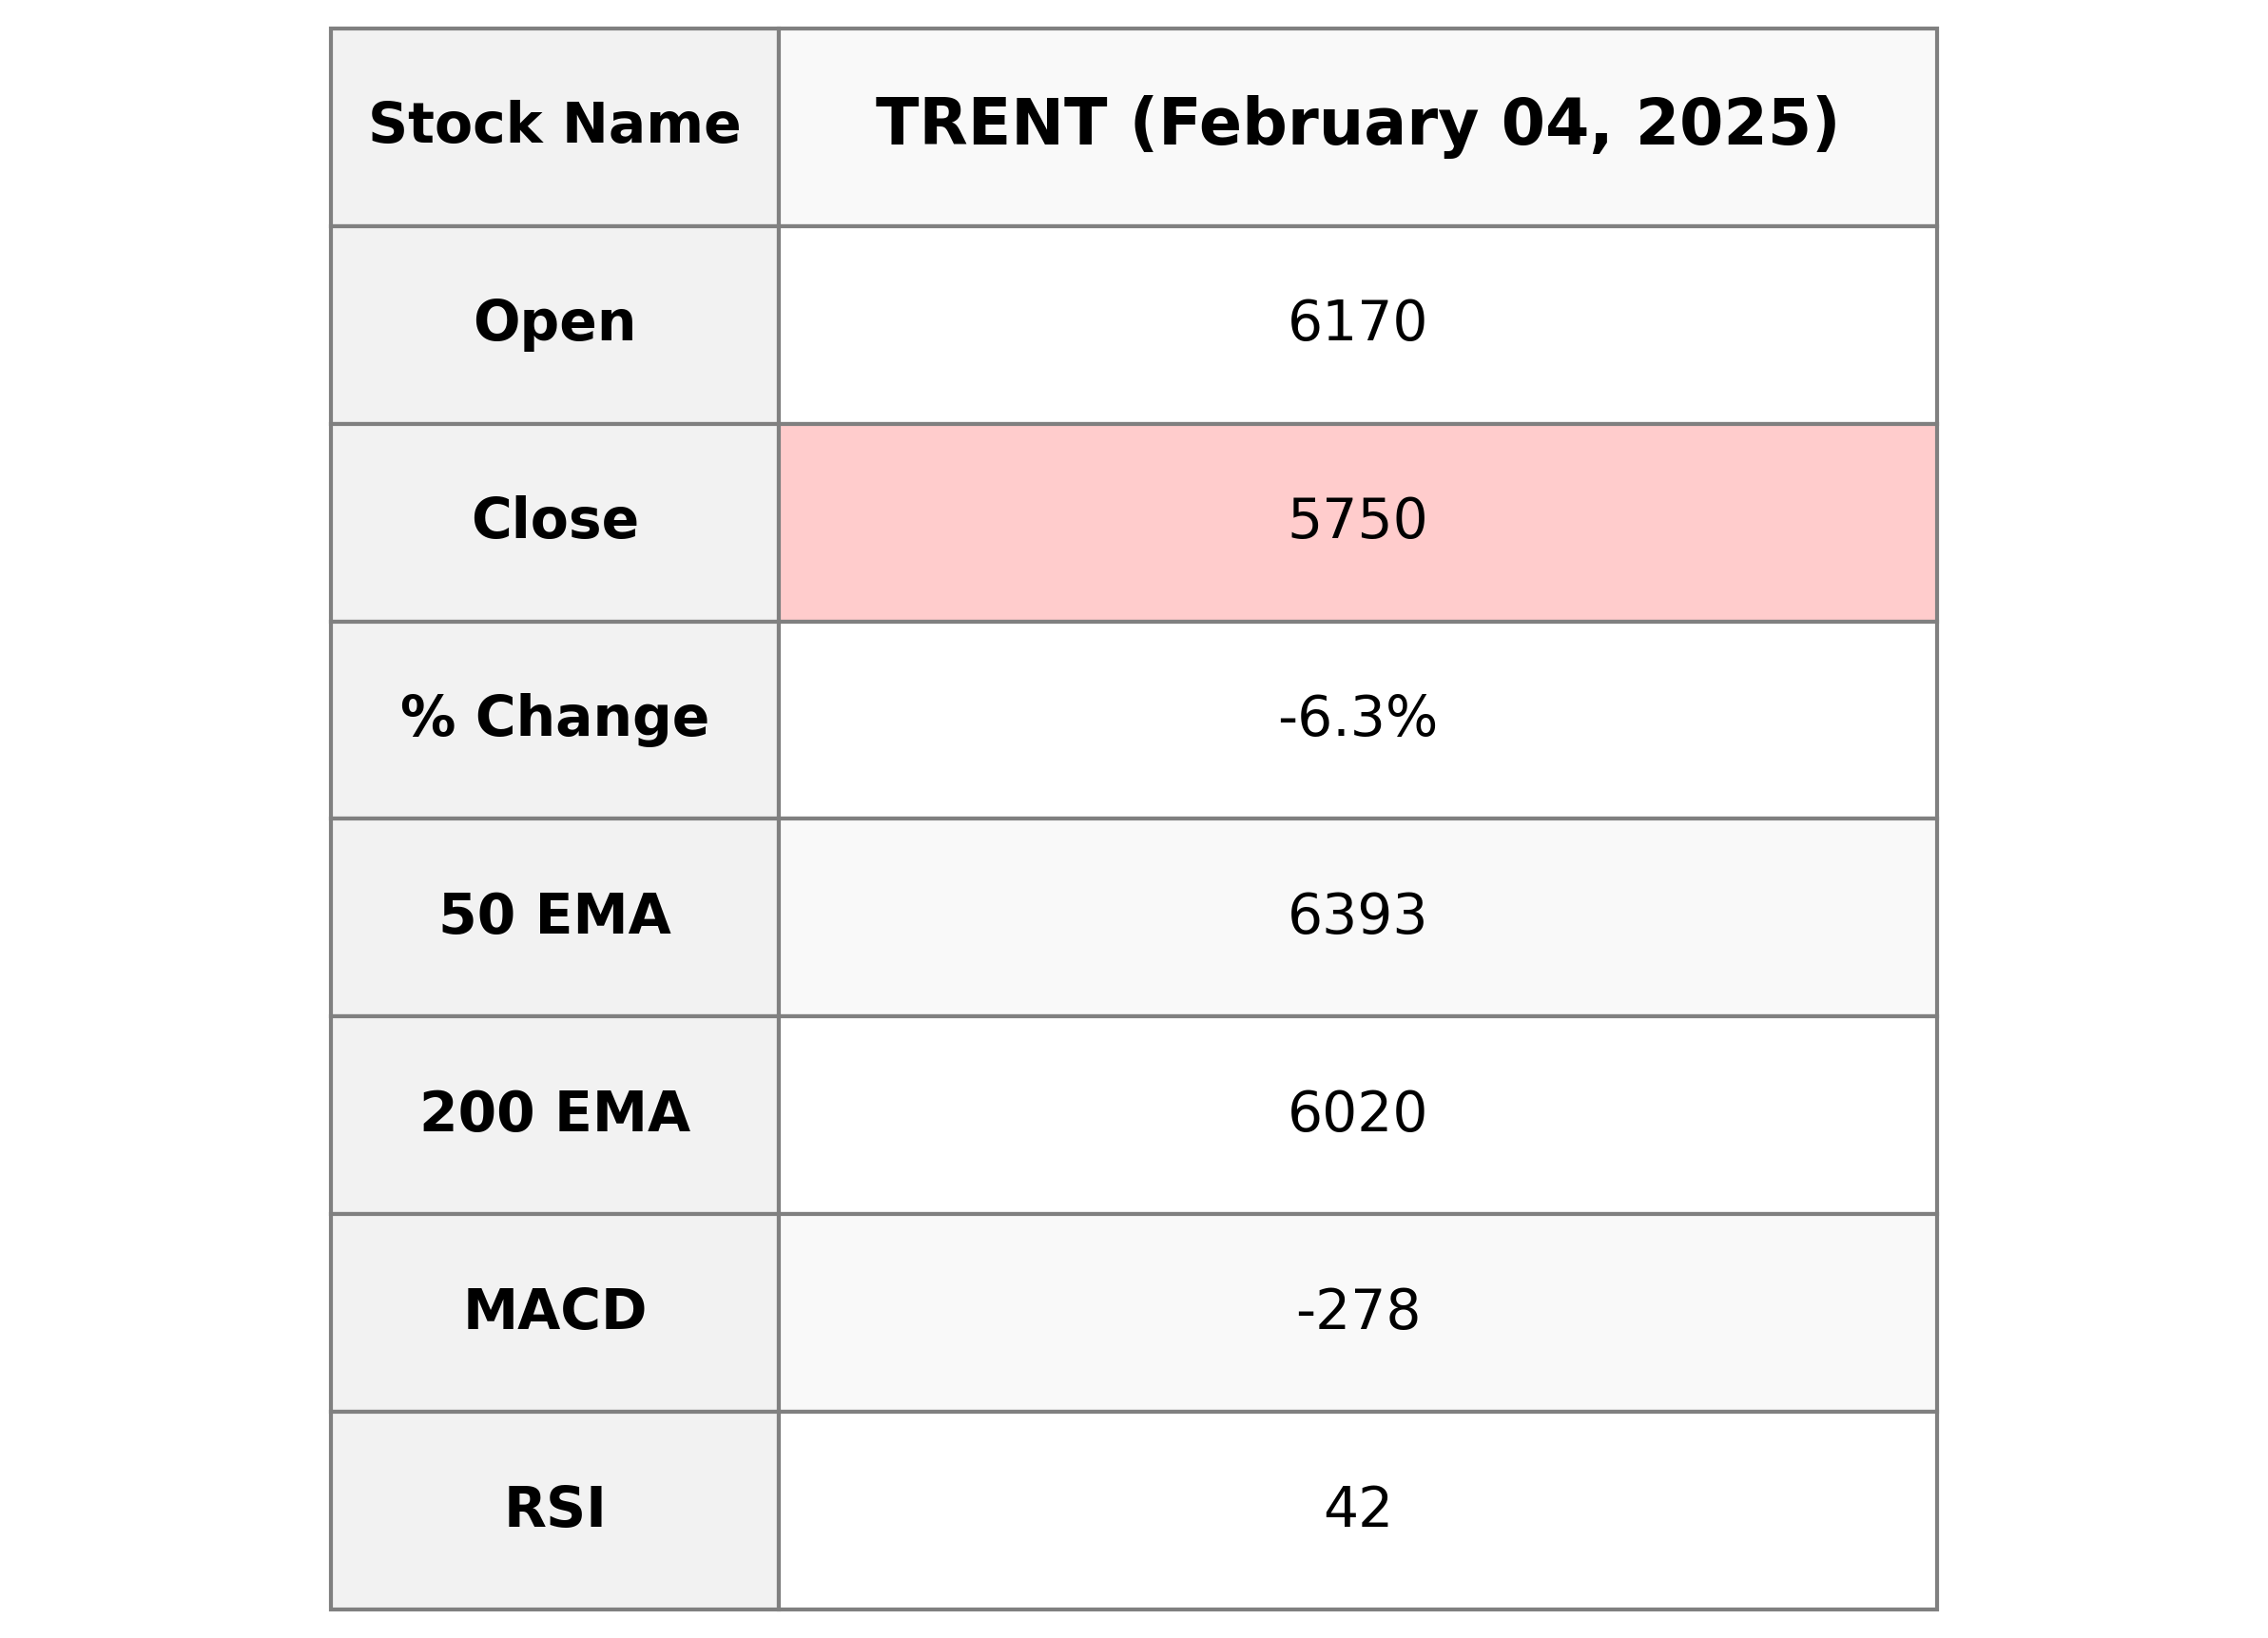
Trent Limited (Symbol: TRENT.NS) experienced a notable decline in its stock price, closing at 5750.30 after opening at 6169.95, resulting in a -6.27% change. The stock is currently trading below its 50 EMA and 200 EMA, with a RSI of 41.81, indicating potential bearish momentum. The company belongs to the Consumer Cyclical sector, specifically in the Apparel Retail industry in India.

Relationship with Key Moving Averages
Based on the given data for TRENT.NS, the stock is trading below its 50 EMA (6393.15) and 200 EMA (6019.85), as well as the 10 EMA (5788.80) and 20 EMA (5987.21). This indicates a bearish sentiment in the short-term trend, as the closing price (5750.30) is below these critical moving averages.
Moving Averages Trend (MACD)
The MACD for TRENT.NS is -278.08, while the MACD Signal is -308.56, indicating that the MACD line is currently above the signal line. This suggests a potential buy signal or bullish indication. However, considering the overall negative momentum with a decreasing stock price and RSI under 50, it would be prudent to observe the stock further before making decisions.

RSI Analysis
**RSI Analysis for Trent:** The current RSI is 41.81, placing the stock in the lower end of the neutral range. This suggests that the stock is neither overbought nor oversold, but it is closer to the oversold threshold, indicating the potential for buying interest if the downtrend continues.

Up Next
NSE Nifty 50 Top losers: Who are the 5 Biggest Stock losers Today February 04, 2025

Rupee breaches 91-mark against US dollar for first time in intra-day trade

Microsoft commits USD 17.5 billion investment in India: CEO Satya Nadella

CBI books Anil Ambani's son, Reliance Home Finance Ltd. in Rs 228 crore bank fraud case

RBI raises FY26 GDP growth projection to 7.3 pc

RBI trims policy interest rate by 25bps to 5.25pc, loans to get cheaper

More videos

Rupee slumps to all-time low of 90.25 against US dollar in intra-day trade

Reliance completes merger of Star Television Productions with Jiostar

India to lead emerging market growth with 7pc GDP rise in 2025: Moody’s

Nifty hits record high after 14 months; Sensex nears all-time peak

Reliance stops Russian oil use at its only-for-export refinery to comply with EU sanctions

ED attaches fresh assets worth over Rs 1,400 cr in case against Anil Ambani's Reliance Group

India signs one-year deal to import 2.2 million tonnes of LPG from US

India International Trade Fair begins at Pragati Maidan amid tight security

Stock markets decline in initial trade on foreign fund outflows, weak Asian peers

Amazon to lay off 30,000 office workers amid AI-driven cost cuts