


Highlights
- Technical indicators for Larsen & Toubro highlight a distinct downtrend
- Market sentiment leaning towards bearishness
- Investors and traders are advised to proceed with caution
Latest news

Putin hails Ukraine gains, threatens more, in annual press conference

OnePlus Pad Go 2 Review: No drama, just a good tablet

Parliament Moment: Priyanka Gandhi shares tea with Rajnath Singh. PM Modi and Om Birla

Cold wave deepens in Kashmir as Chillai-Kalan nears, temperatures dip below freezing

Pakistan accuses India of attempting to undermine Indus treaty

Vande Mataram discussion in UP legislature to mark 150th anniversary: Yogi Adityanath

Ashes 2025: Travis Head slams unbeaten 142 to crush England's Ashes hopes

Tipra Motha youth wing protests Bangladesh leader's anti-India remarks in Agartala
NSE Nifty 50: Top 5 stock losers of February 3, 2025


In this article, we will explore the technical indicators of some of the low-performing stocks on the Indian stock market, including BEL, COALINDIA, LT, ONGC, and TATACONSUM.
By looking at these stocks through the lens of key technical factors, we aim to better understand their price movements, trends, and potential future performance.

Analysis for Bharat Electronics - February 03, 2025
Stock Performance
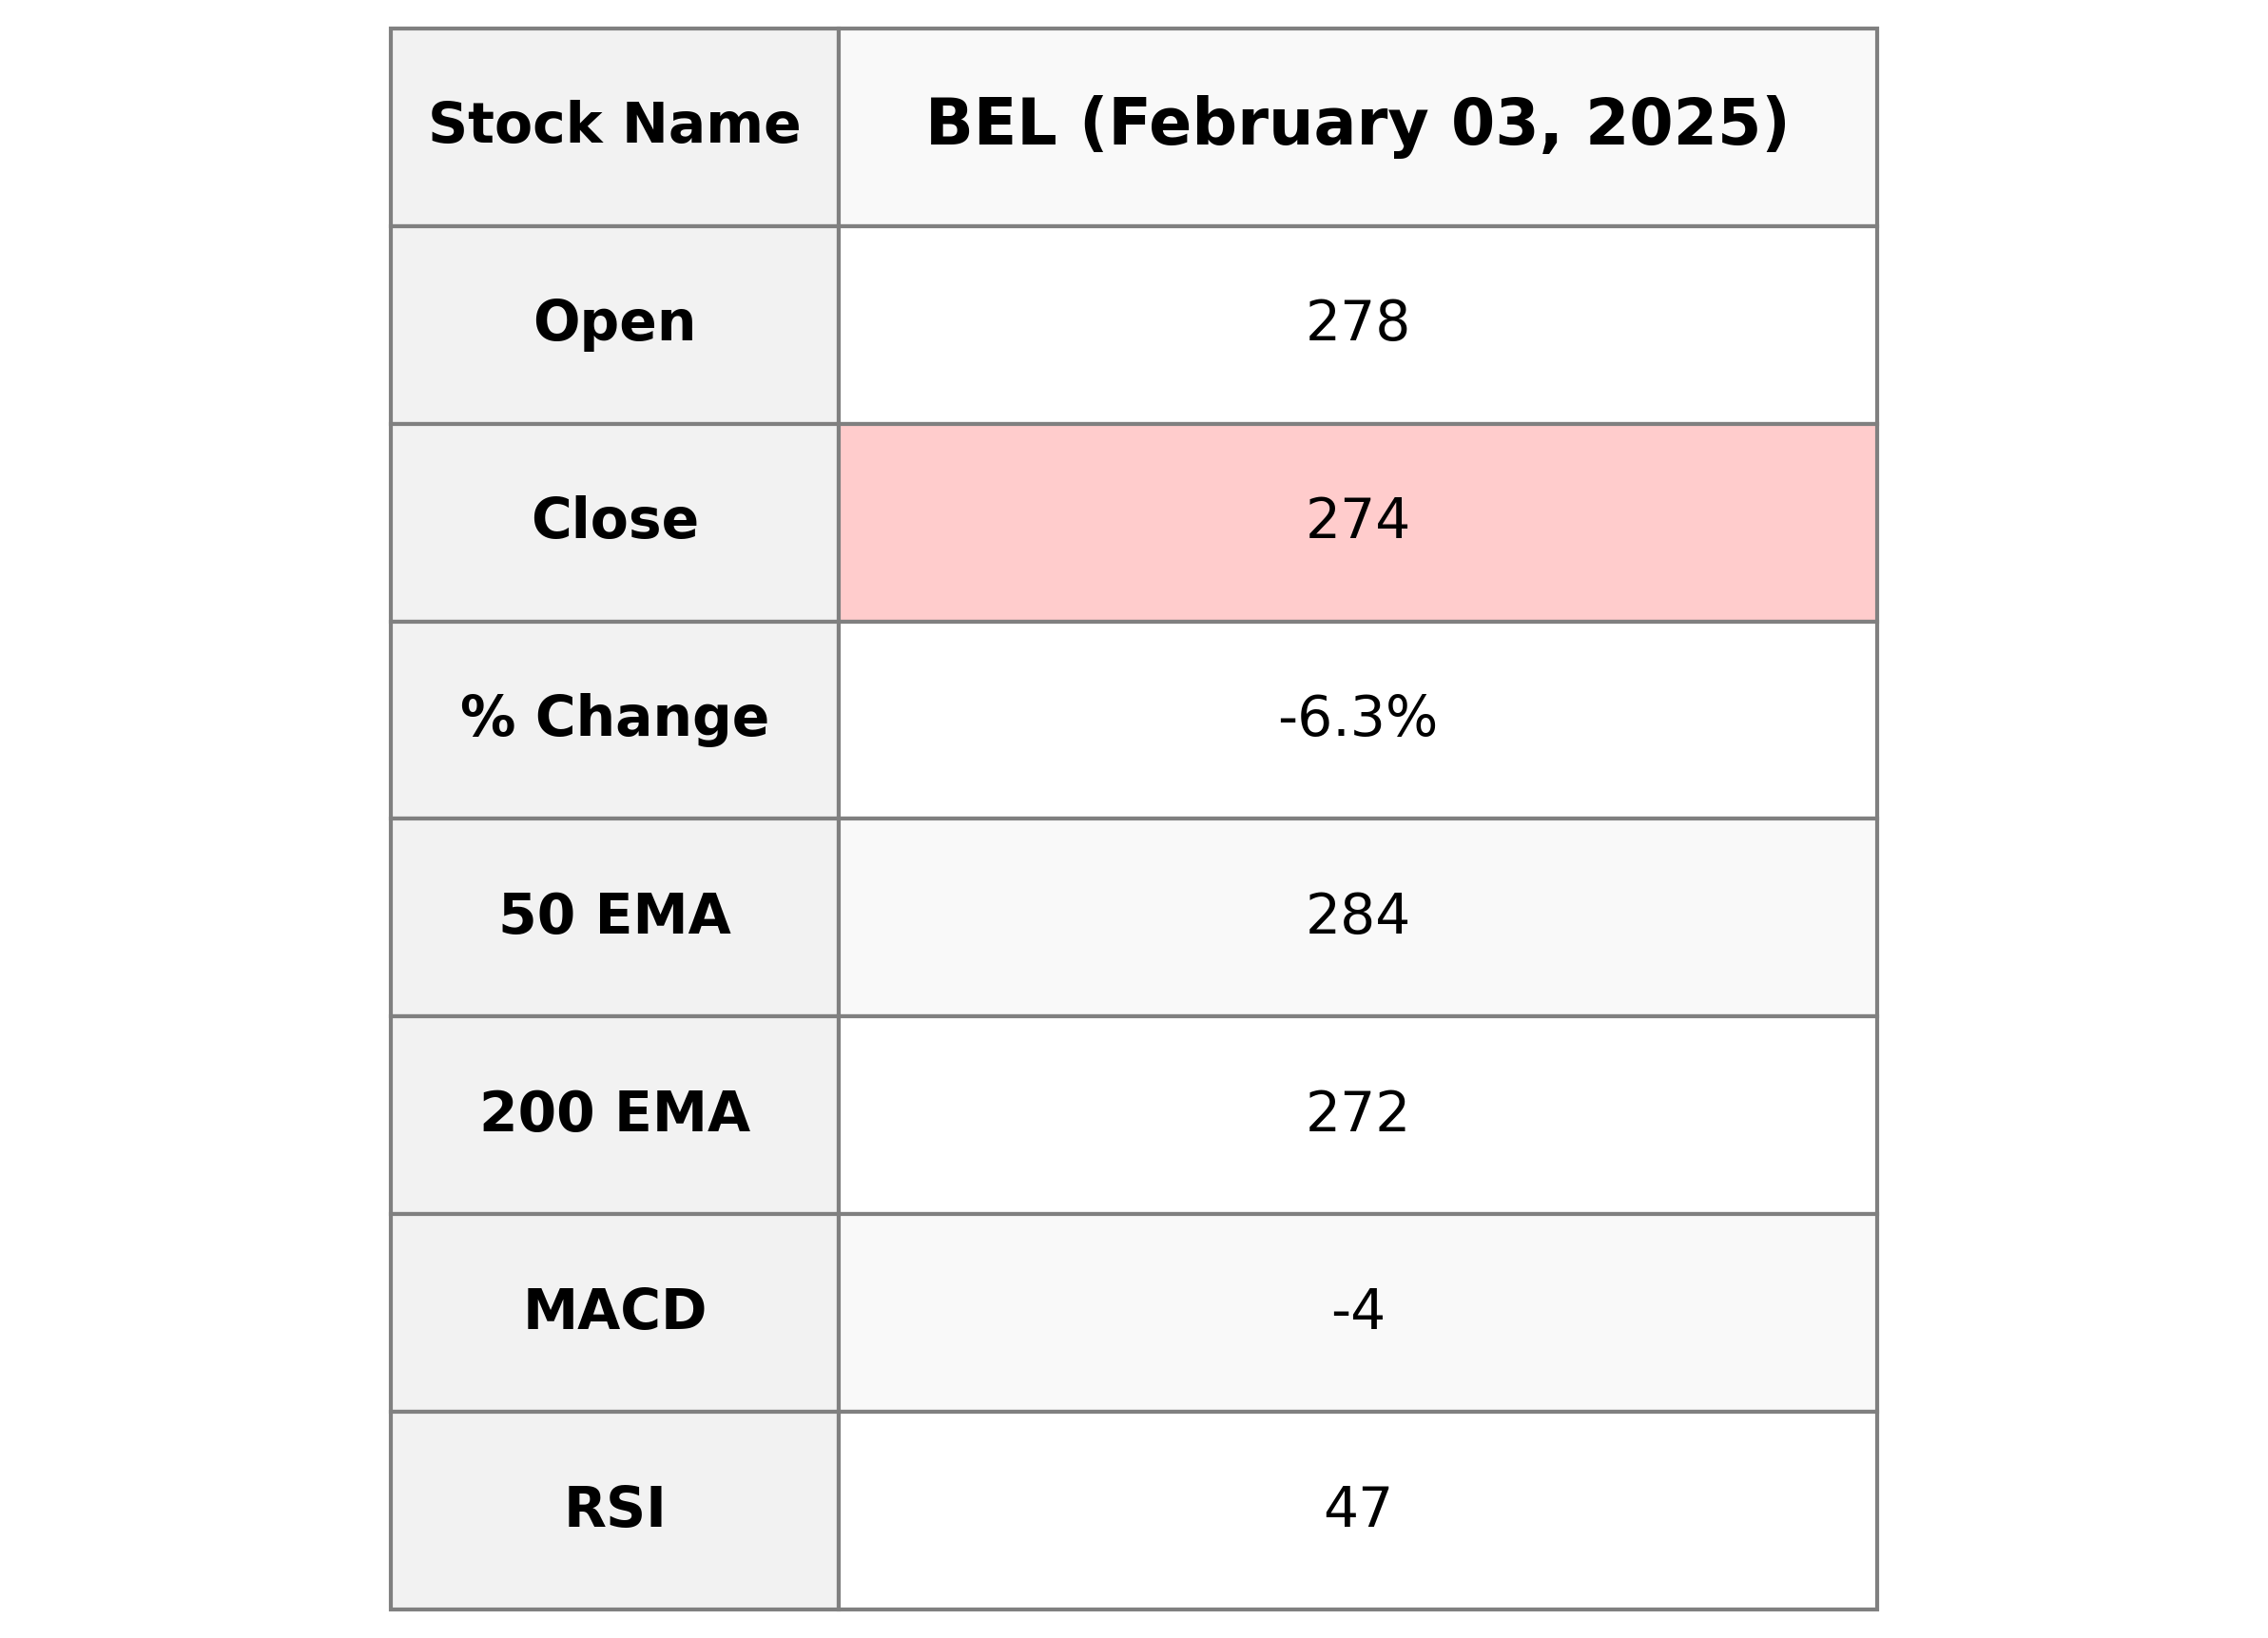
Bharat Electronics (BEL.NS) experienced a notable decrease in its stock performance, with a closing price of ₹274.15, down 6.32% from its previous close of ₹292.65. The company's stock is below its 50-day EMA of ₹284.05 and slightly above its 200-day EMA of ₹272.24, with an RSI of 47.34 indicating mild bearish momentum. The aerospace and defense firm, with a market cap of ₹2,003.98 billion, has a PE ratio of 40.20 but lacks an EPS value in the provided data.
Relationship with Key Moving Averages
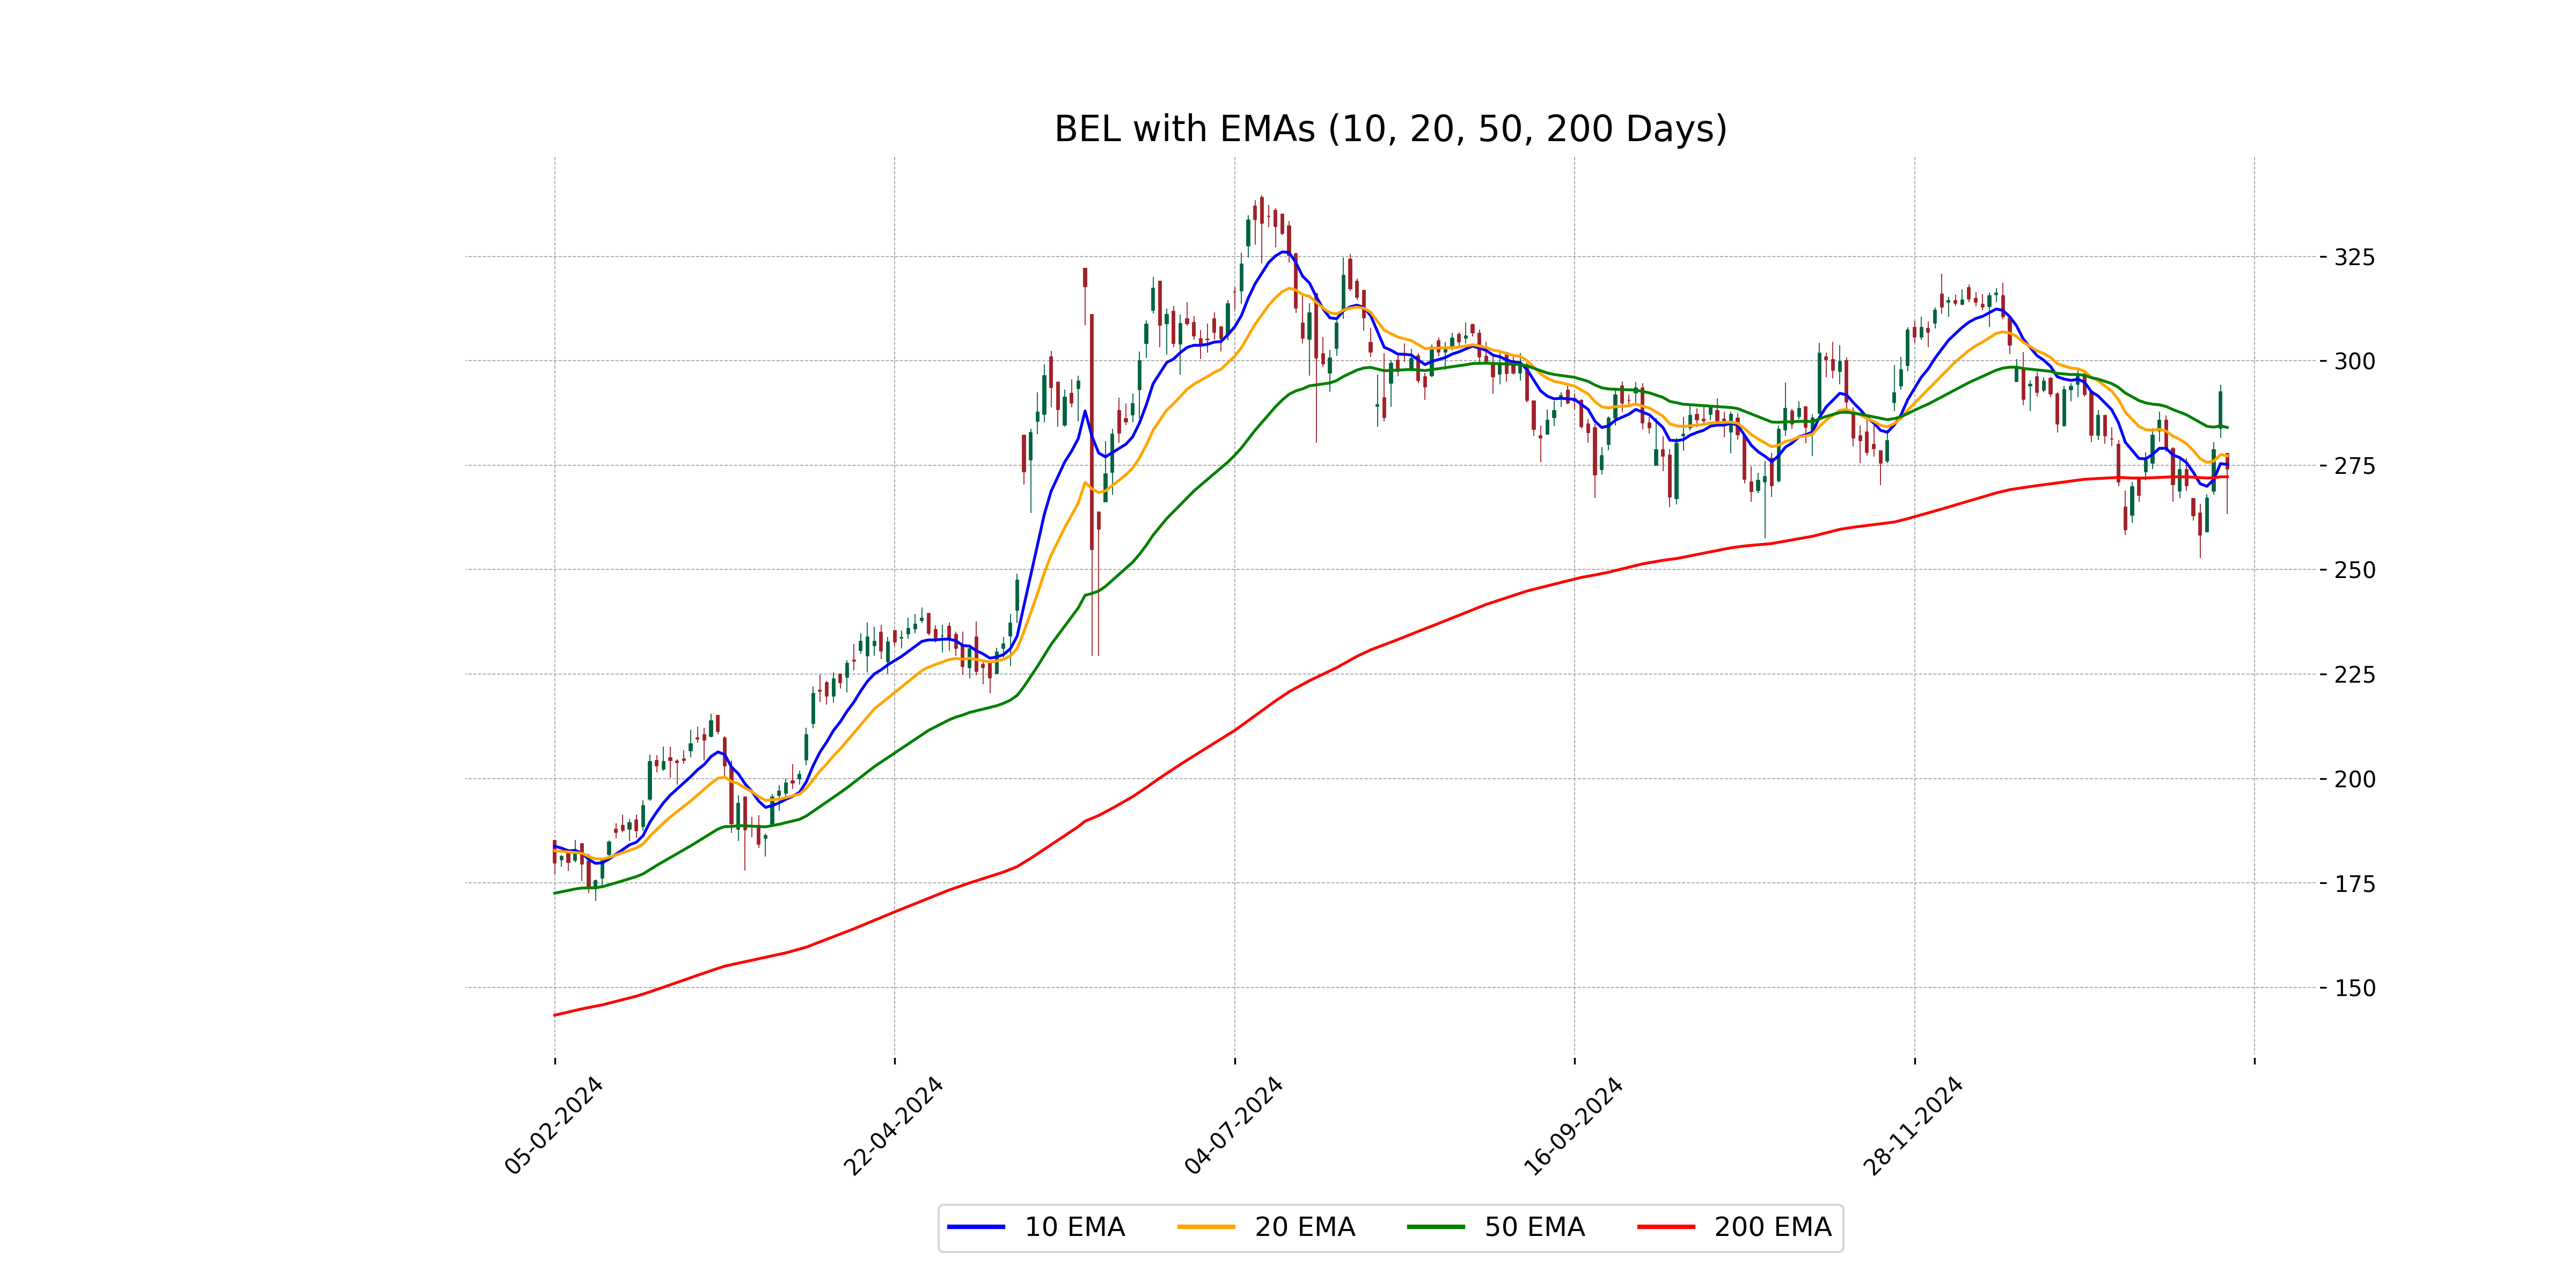
The stock price of Bharat Electronics (BEL.NS) is trading below its 50-day EMA of 284.05 and slightly above its 200-day EMA of 272.24, indicating a potential bearish cross. The 10-day EMA at 275.17 is close to the current price of 274.15, suggesting short-term consolidation near this level.
Moving Averages Trend (MACD)
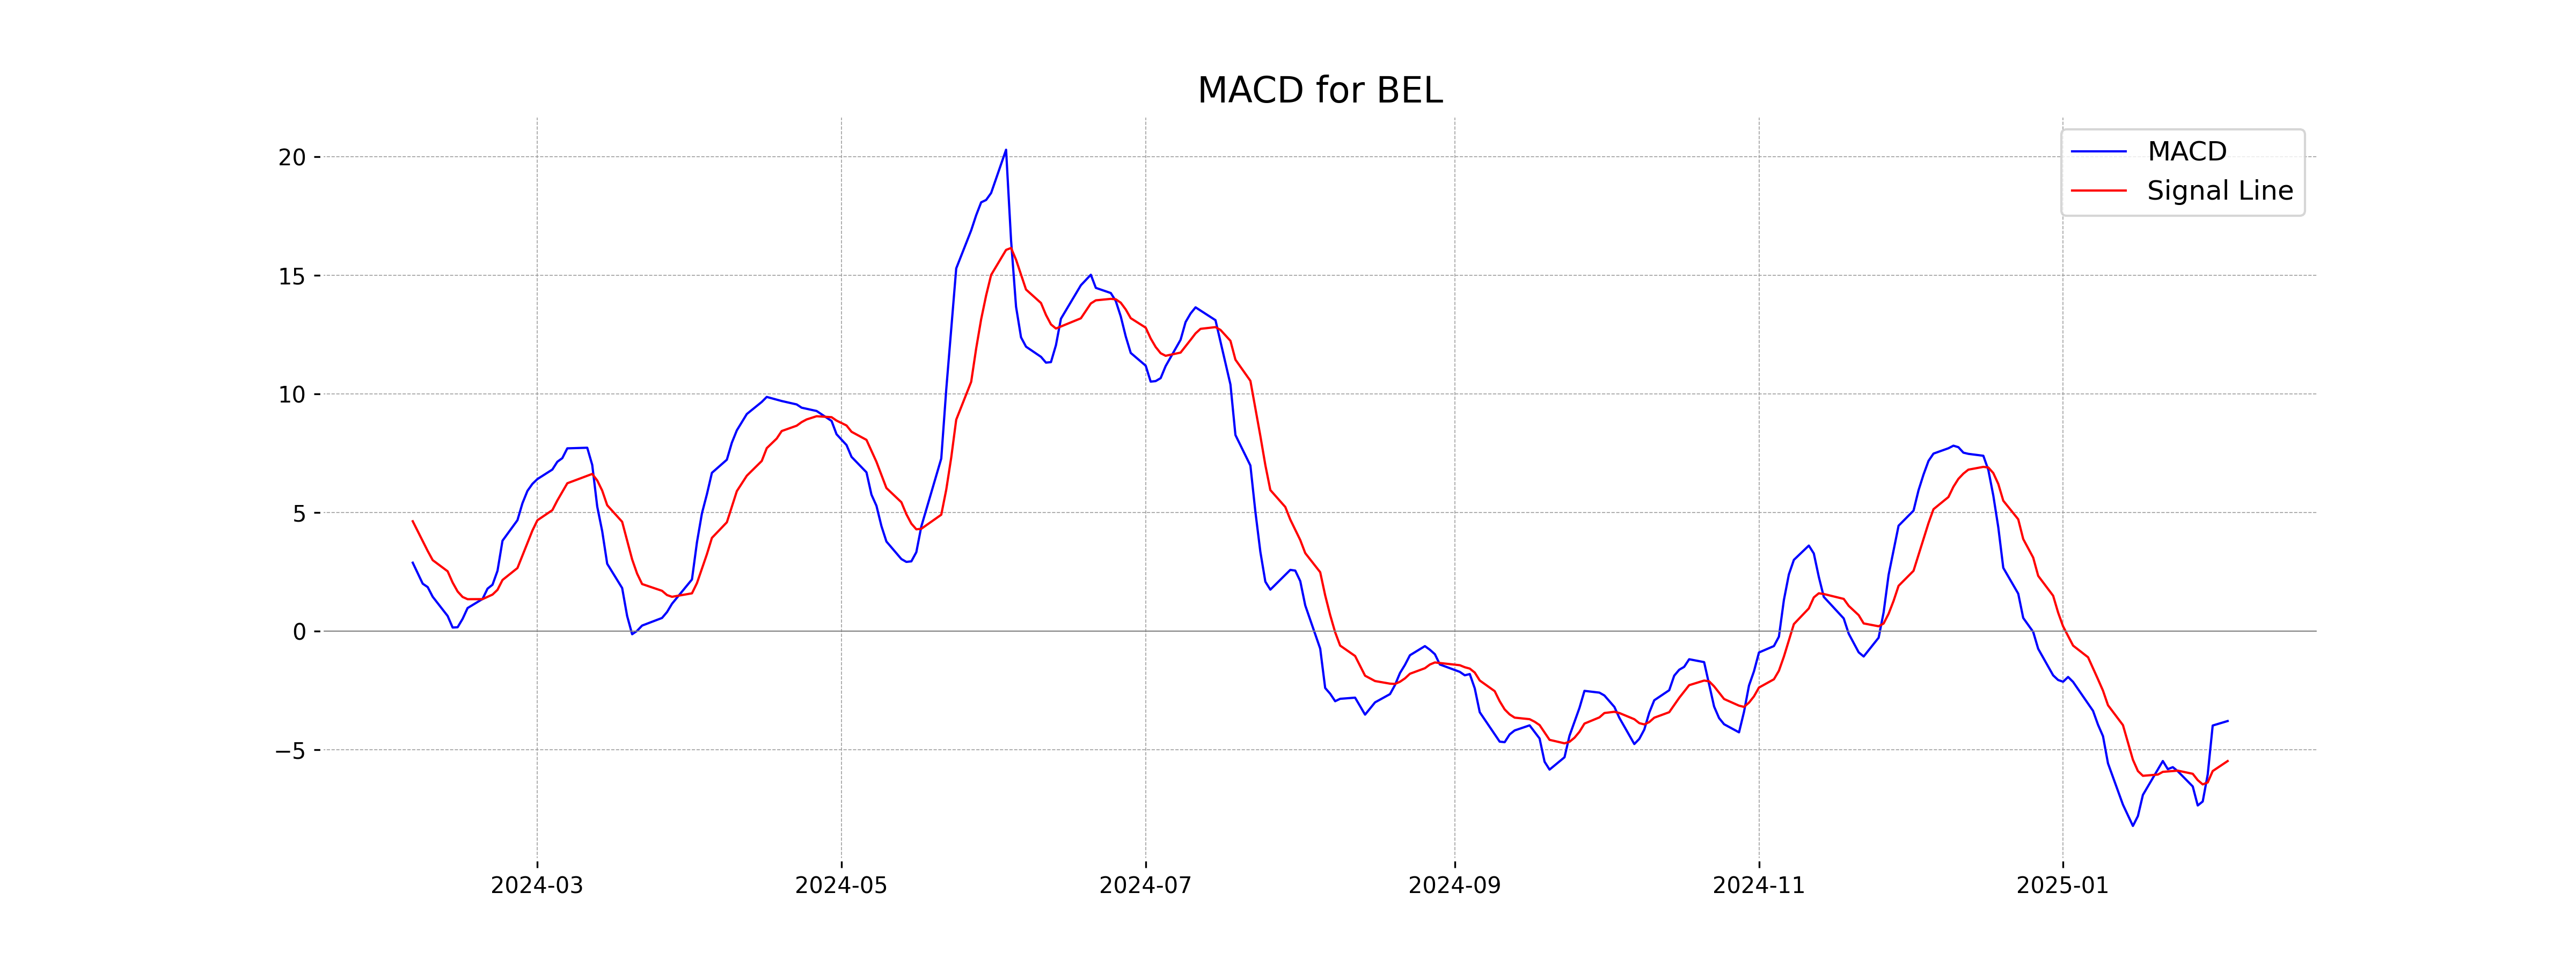
The MACD value for Bharat Electronics (BEL.NS) is -3.80, with its signal line at -5.49, indicating a bearish trend as the MACD is above its signal line but still in the negative region. This suggests caution, as the stock might be experiencing a momentum loss, although the gap indicates some potential for reversal if momentum strengthens.
RSI Analysis
For Bharat Electronics (BEL.NS), the Relative Strength Index (RSI) is 47.34, which indicates a neutral position as it is close to the midpoint of 50. This suggests that the stock is neither overbought nor oversold based on current momentum. Monitoring for any significant changes in RSI may help gauge future price movements.

Analysis for Coal India - February 03, 2025
Stock Performance
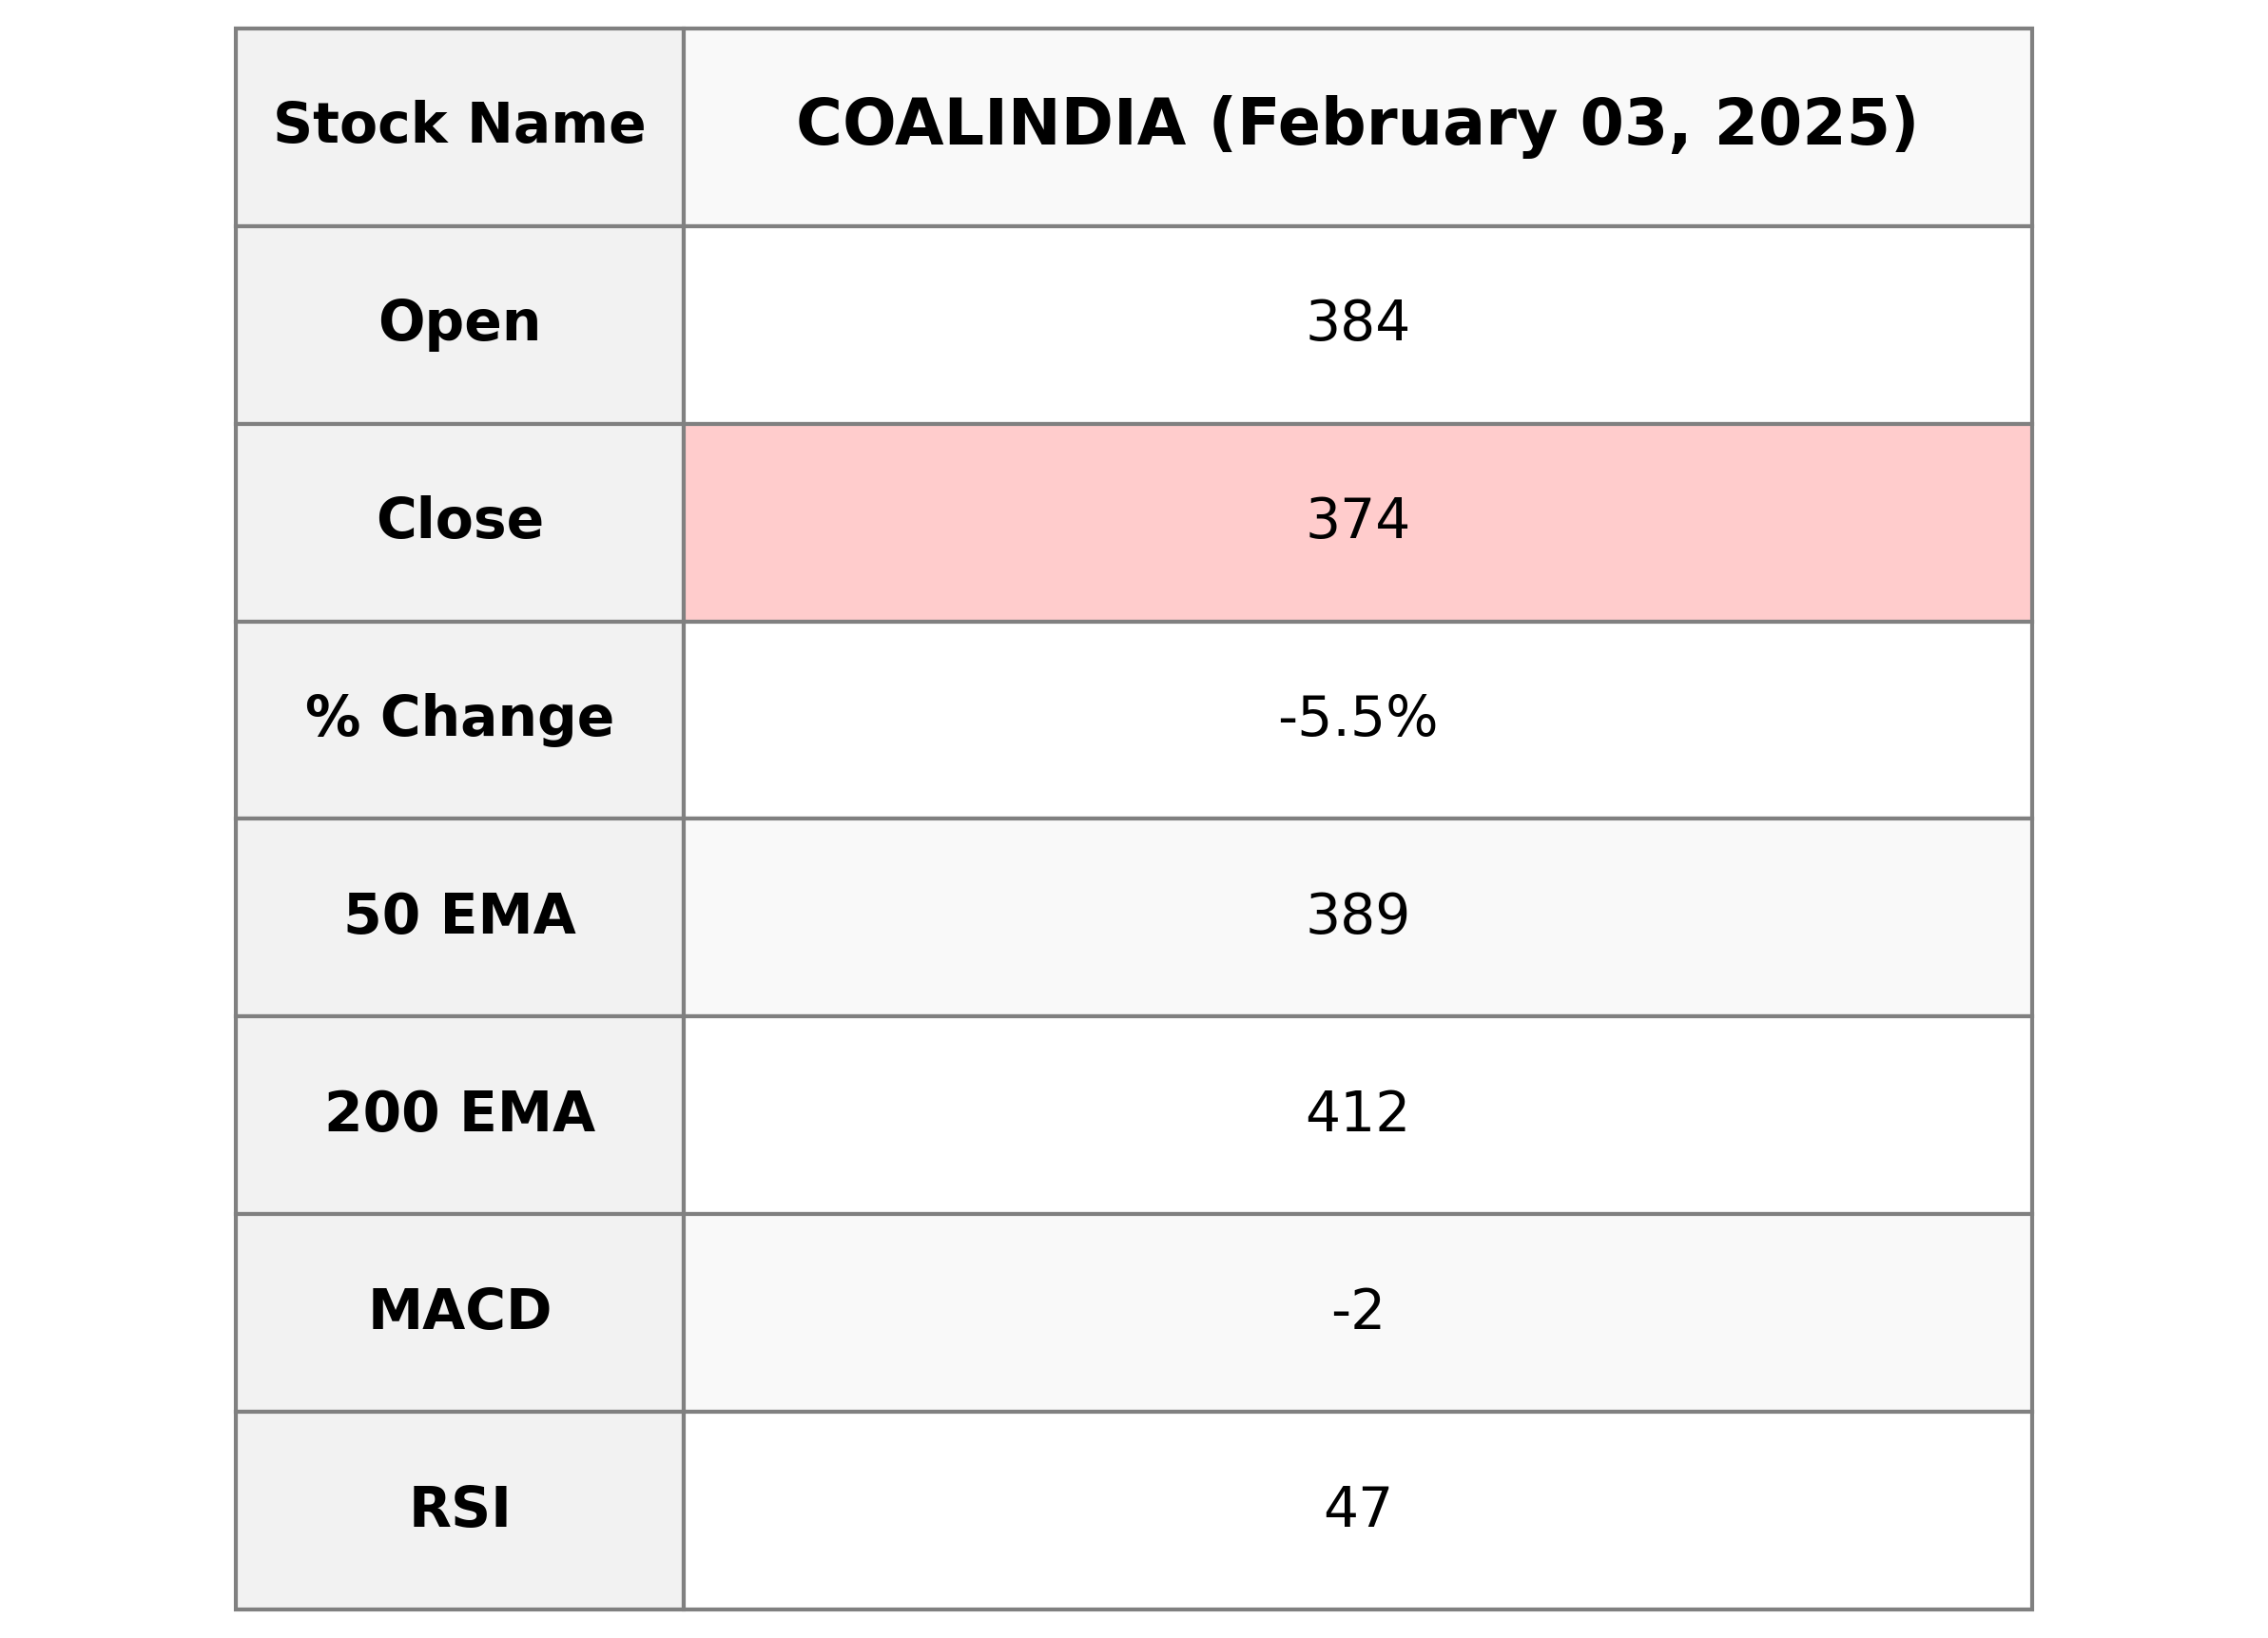
Coal India Limited (symbol: COALINDIA.NS), operating in the Energy sector, experienced a decline in its stock performance with a closing price of ₹374.0, down by 5.53% from the previous close. The stock's RSI is at 47.11, indicating a neutral trend, and the MACD is slightly negative, suggesting some bearish momentum. Despite the dip, the company maintains a strong market capitalization of ₹2.30 trillion.

Relationship with Key Moving Averages
Coal India Ltd is trading below its 50-day EMA of 389.06 and its 200-day EMA of 411.61, which might indicate a bearish trend in the medium to long term. However, it is slightly below the 10-day and 20-day EMAs, suggesting short-term weakness as well. The overall position below these key moving averages highlights potential downward pressure on the stock.
Moving Averages Trend (MACD)
The MACD for Coal India is -1.76, which is above the MACD Signal of -3.87, indicating potential bullish momentum. However, since both values are negative, it reflects a bearish overall trend, suggesting caution in expectations for a strong price increase.

RSI Analysis
The RSI (Relative Strength Index) for Coal India is 47.11, which indicates it's in the neutral range between 30 and 70. This suggests that the stock is neither overbought nor oversold at the moment, reflecting a balanced level of buying and selling pressure.

Analysis for HCL Technologies - February 03, 2025
Stock Performance

**HCL Technologies Performance Summary:** Based on the performance data provided, the stock symbol LT.NS, which pertains to a company in the Industrials sector, specifically in Engineering & Construction in India, has experienced a significant decline. There is a notable decrease in the stock's close price compared to the previous day's close, reflecting a % change of approximately -7.80%. This decline is also accompanied by a high volume of 6,076,160. Technical indicators such as the 50 EMA, 200 EMA, 10 EMA, and 20 EMA suggest that the stock is below its short-term and long-term moving averages, while the RSI indicates a potentially oversold condition at 34.55. The negative MACD value with respect to the MACD signal implies a bearish momentum.

Relationship with Key Moving Averages
The stock price of LT.NS is trading below its 50 EMA (3572.72), 20 EMA (3501.95), and 10 EMA (3454.37), indicating a bearish momentum and potential downward trend. Additionally, the current price of 3289.20 is also below the 200 EMA (3542.99), suggesting a weaker overall long-term sentiment for LT.NS.
Moving Averages Trend (MACD)
To provide a MACD analysis specifically for HCL Technologies, I would need data corresponding to that company. However, based on the structure of MACD analysis: A negative MACD value, such as -59.19, suggests that the stock is in a bearish trend, as the MACD line is below the signal line. Given that the MACD signal line is also negative, it could indicate a continuation of this downward momentum. Look for a potential crossover or convergence for signs of trend reversal. For a precise analysis on HCL Technologies, relevant data is required.

RSI Analysis
The RSI (Relative Strength Index) for Larsen & Toubro (LT.NS) is 34.55, which suggests that the stock is nearing the oversold territory, typically indicated by an RSI below 30. This could imply potential undervaluation or a possible reversal, but it's important to consider other indicators and market conditions before making investment decisions.

Analysis for ONGC - February 03, 2025
Stock Performance

**Performance of ONGC.NS:** ONGC has shown a notable decline in its stock performance with a closing price of 249.0, marking a -5.18% decrease from its previous close. The stock's market indicators such as RSI at 44.34 suggest a moderately weak momentum, and a MACD of 0.13 with its signal line at 1.34 indicating a bearish crossover. The company operates within the Energy sector in India, specifically in the Oil & Gas Integrated industry, and holds a market cap of approximately 3.13 trillion INR.

Relationship with Key Moving Averages
ONGC.NS is currently trading below its key moving averages, with the latest close at 249.0, compared to its 50-day EMA of 257.09 and 200-day EMA of 260.65. This indicates potential bearish momentum, as the stock price is also below the 10-day and 20-day EMAs of 256.08 and 256.48, respectively, suggesting ongoing pressure in the short to medium term.
Moving Averages Trend (MACD)
Based on the data provided for ONGC.NS, the MACD value is 0.133953, which is below the MACD Signal line of 1.340267. This suggests a bearish trend, as the MACD line crossing below the signal line generally indicates a potential downward momentum.

RSI Analysis
The RSI (Relative Strength Index) for ONGC is 44.34, which indicates that the stock is neither overbought nor oversold, as it sits in the middle range. This suggests a neutral market sentiment, with potential for consolidation or a change in trend depending on forthcoming market movements.

Analysis for Tata Consumer - February 03, 2025
Stock Performance

Tata Consumer Products Limited (TATACONSUM.NS) showed a positive market performance, with a closing price of 1036.30, marking a 1.14% increase from the previous close. The stock had a high trading volume of 1,298,383 shares and an RSI of 70.87, indicating a strong upward momentum. With a market cap exceeding ₹1 trillion, the stock is currently trading above its 50 EMA but close to the 200 EMA, suggesting a sustained bullish trend.

Relationship with Key Moving Averages
Tata Consumer's current closing price of 1036.30 is above its 50 EMA (969.35) and 20 EMA (972.46), indicating a short to medium-term bullish trend. It is also slightly above the 200 EMA (1032.12), suggesting a potential long-term upward momentum.
Moving Averages Trend (MACD)
Tata Consumer's MACD value of 15.773 indicates a bullish momentum in the stock, given that it is above the MACD Signal line of 9.749. This bullish crossover suggests a potential continuation of the upward trend, supported by the strong RSI of 70.87.

RSI Analysis
The RSI (Relative Strength Index) for Tata Consumer is 70.87, indicating that the stock is currently in an overbought condition. This suggests potential for a price correction or consolidation, as it is nearing the upper end of the typical RSI range.

Up Next
NSE Nifty 50: Top 5 stock losers of February 3, 2025

Rupee breaches 91-mark against US dollar for first time in intra-day trade

Microsoft commits USD 17.5 billion investment in India: CEO Satya Nadella

CBI books Anil Ambani's son, Reliance Home Finance Ltd. in Rs 228 crore bank fraud case

RBI raises FY26 GDP growth projection to 7.3 pc

RBI trims policy interest rate by 25bps to 5.25pc, loans to get cheaper

More videos

Rupee slumps to all-time low of 90.25 against US dollar in intra-day trade

Reliance completes merger of Star Television Productions with Jiostar

India to lead emerging market growth with 7pc GDP rise in 2025: Moody’s

Nifty hits record high after 14 months; Sensex nears all-time peak

Reliance stops Russian oil use at its only-for-export refinery to comply with EU sanctions

ED attaches fresh assets worth over Rs 1,400 cr in case against Anil Ambani's Reliance Group

India signs one-year deal to import 2.2 million tonnes of LPG from US

India International Trade Fair begins at Pragati Maidan amid tight security

Stock markets decline in initial trade on foreign fund outflows, weak Asian peers

Amazon to lay off 30,000 office workers amid AI-driven cost cuts