


Highlights
- Stock down for Bajaj Finserv, stable long-term
- SBI Life shows bullish momentum but is overbought
- Tata Motors sees bearish trend, RSI neutral
Latest news

Samsung Galaxy Z Fold 8, Fold 8 Ultra & Z Flip 8: A More Mature Foldable Family

Dell Launches New Alienware 16X Aurora, 16 Area-51 and 18 Area-51 Gaming Laptops in India

Samsung Takes on Premium Home Audio With New Music Studio Series

The End of OxygenOS: OnePlus Confirms Shift to Oppo's ColorOS

Fujifilm Instax Mini Evo Cinema Review: A Hybrid Camera That Prints Memories Differently

iQOO Teases Z11 Lite With AI Tools, Military-Grade Durability and a 6500mAh Battery

Editorji Launches Hook Global, Its International Digital News Brand

Samsung's Bespoke AI ACs Focus on Humidity, Hygiene and Smarter Cooling
NSE Nifty 50: Top 5 stock losers of April 30, 2025


In this article, we will explore the technical indicators of some of the low-performing stocks on the Indian stock market, including BAJAJFINSV, BAJFINANCE, SBILIFE, TATAMOTORS, and TRENT.
By looking at these stocks through the lens of key technical factors, we aim to better understand their price movements, trends, and potential future performance.

Analysis for Bajaj Finserv - April 30, 2025

Bajaj Finserv experienced a decline in stock price with a closing value of 1951.60, down by 5.58% from the previous close. The trading volume was substantial at 4,682,463 shares. Despite this fall, the stock remains above its 50-day EMA, indicating some stability amid market fluctuations.

Relationship with Key Moving Averages
Bajaj Finserv's stock closed below its 10 EMA and 20 EMA, indicating short-term bearish momentum. However, it closed above the 50 EMA and 200 EMA, suggesting that the longer-term trend remains bullish. The stock fell by approximately 5.58% from the previous close.
Moving Averages Trend (MACD)
Bajaj Finserv MACD Analysis: The Moving Average Convergence Divergence (MACD) for Bajaj Finserv stands at 42.44, with a MACD Signal of 46.53. This indicates a negative crossover as the MACD is below the signal line, suggesting potential bearish momentum.

RSI Analysis
Bajaj Finserv's RSI (Relative Strength Index) is 47.35, which indicates a neutral position. This suggests that the stock is neither overbought nor oversold at the moment. A position near 50 reflects a balanced momentum in price movements.

Analysis for Bajaj Finance - April 30, 2025

Bajaj Finance experienced a noticeable decline in its stock performance, with a closing price of 8634.5, marking a -5.04% change from the previous close of 9093. The stock has shown volatility between its high of 8888 and low of 8556. The RSI stands at 41.46, indicating potential undervaluation. The MACD is lower than the signal line, suggesting a bearish momentum. The stock's performance also reflected in its market cap of 5.36 trillion INR and a PE ratio of 33.44.

Relationship with Key Moving Averages
Bajaj Finance's current stock price of 8634.5 is trading below its 50-day EMA of 8673.99, indicating potential bearish momentum in the short term. It is also below the 10-day EMA of 9028.07 and the 20-day EMA of 8972.60, suggesting sustained selling pressure. However, the stock remains above its 200-day EMA of 7787.65, implying a longer-term uptrend might still be intact.
Moving Averages Trend (MACD)
Bajaj Finance's MACD analysis indicates a potential downtrend, as the MACD line (104.90) is below the MACD Signal line (149.45). This crossover suggests bearish momentum, especially when combined with the RSI value of 41.46, which is below the typical neutral level of 50.

RSI Analysis
Bajaj Finance shows an RSI of 41.46, which suggests that the stock is approaching oversold conditions. Investors might interpret this as a potential buying opportunity, though further analysis would be needed to confirm any reversal signals.

Analysis for SBI Life - April 30, 2025

SBI Life Performance: SBI Life, from the Financial Services sector and Life Insurance industry in India, opened at 1722.0 and closed at 1765.8, marking a 2.06% increase from its previous close. The stock witnessed a high of 1772.5 and a low of 1718.5, with a robust volume of 2,031,150 shares traded. It has an RSI of 77.74, suggesting it may be overbought, a PE Ratio of 73.42, and an EPS of 24.05, indicating strong earnings performance.

Relationship with Key Moving Averages
SBI Life's closing price of 1765.80 is significantly above its 10 EMA (1667.86), 20 EMA (1612.94), 50 EMA (1545.78), and 200 EMA (1528.71), indicating that the stock is in a strong uptrend. The current RSI of 77.74 suggests it is overbought, but the gap with key moving averages supports a sustained bullish momentum in the near term.
Moving Averages Trend (MACD)
SBI Life's MACD is 62.08, which is significantly higher than the MACD Signal of 43.34, indicating a strong bullish momentum. This suggests that the stock may continue to rise in the short term. However, with an RSI of 77.74, the stock could be reaching overbought conditions, necessitating caution.

RSI Analysis
RSI Analysis for SBI Life: The Relative Strength Index (RSI) for SBI Life is 77.74, indicating that the stock is in overbought territory. This may suggest that the stock has been over-purchased in recent times, and there could be a potential reversal or pullback in price.

Analysis for Tata Motors - April 30, 2025

### Tata Motors Performance Tata Motors witnessed a decline in stock performance, with the closing price at 644.25, reflecting a 3.21% decrease from the previous close. Technical indicators such as RSI and MACD suggest bearish momentum, while the company's PE Ratio is 7.44, indicative of potential undervaluation in the Consumer Cyclical sector.

Relationship with Key Moving Averages
Tata Motors' current stock price of 644.25 is trading below its 50-day EMA of 663.72 and significantly below its 200-day EMA of 769.38, indicating a bearish trend. The 10-day and 20-day EMAs are closely aligned at 648.40 and 646.26, suggesting recent price action is slightly consolidating around these levels.
Moving Averages Trend (MACD)
Tata Motors exhibits a MACD value of -1.17, indicating a potential bearish trend as the MACD line is below the signal line, suggesting downward momentum. The signal line value of -6.80 further supports this bearish sentiment, hinting at possible continued weakness in the short term.

RSI Analysis
RSI Analysis for Tata Motors: The Relative Strength Index (RSI) for Tata Motors is 48.66, indicating that the stock is neither in the overbought nor the oversold territory. Generally, an RSI between 30 and 70 suggests a neutral condition, with potential to move in either direction based on market conditions.

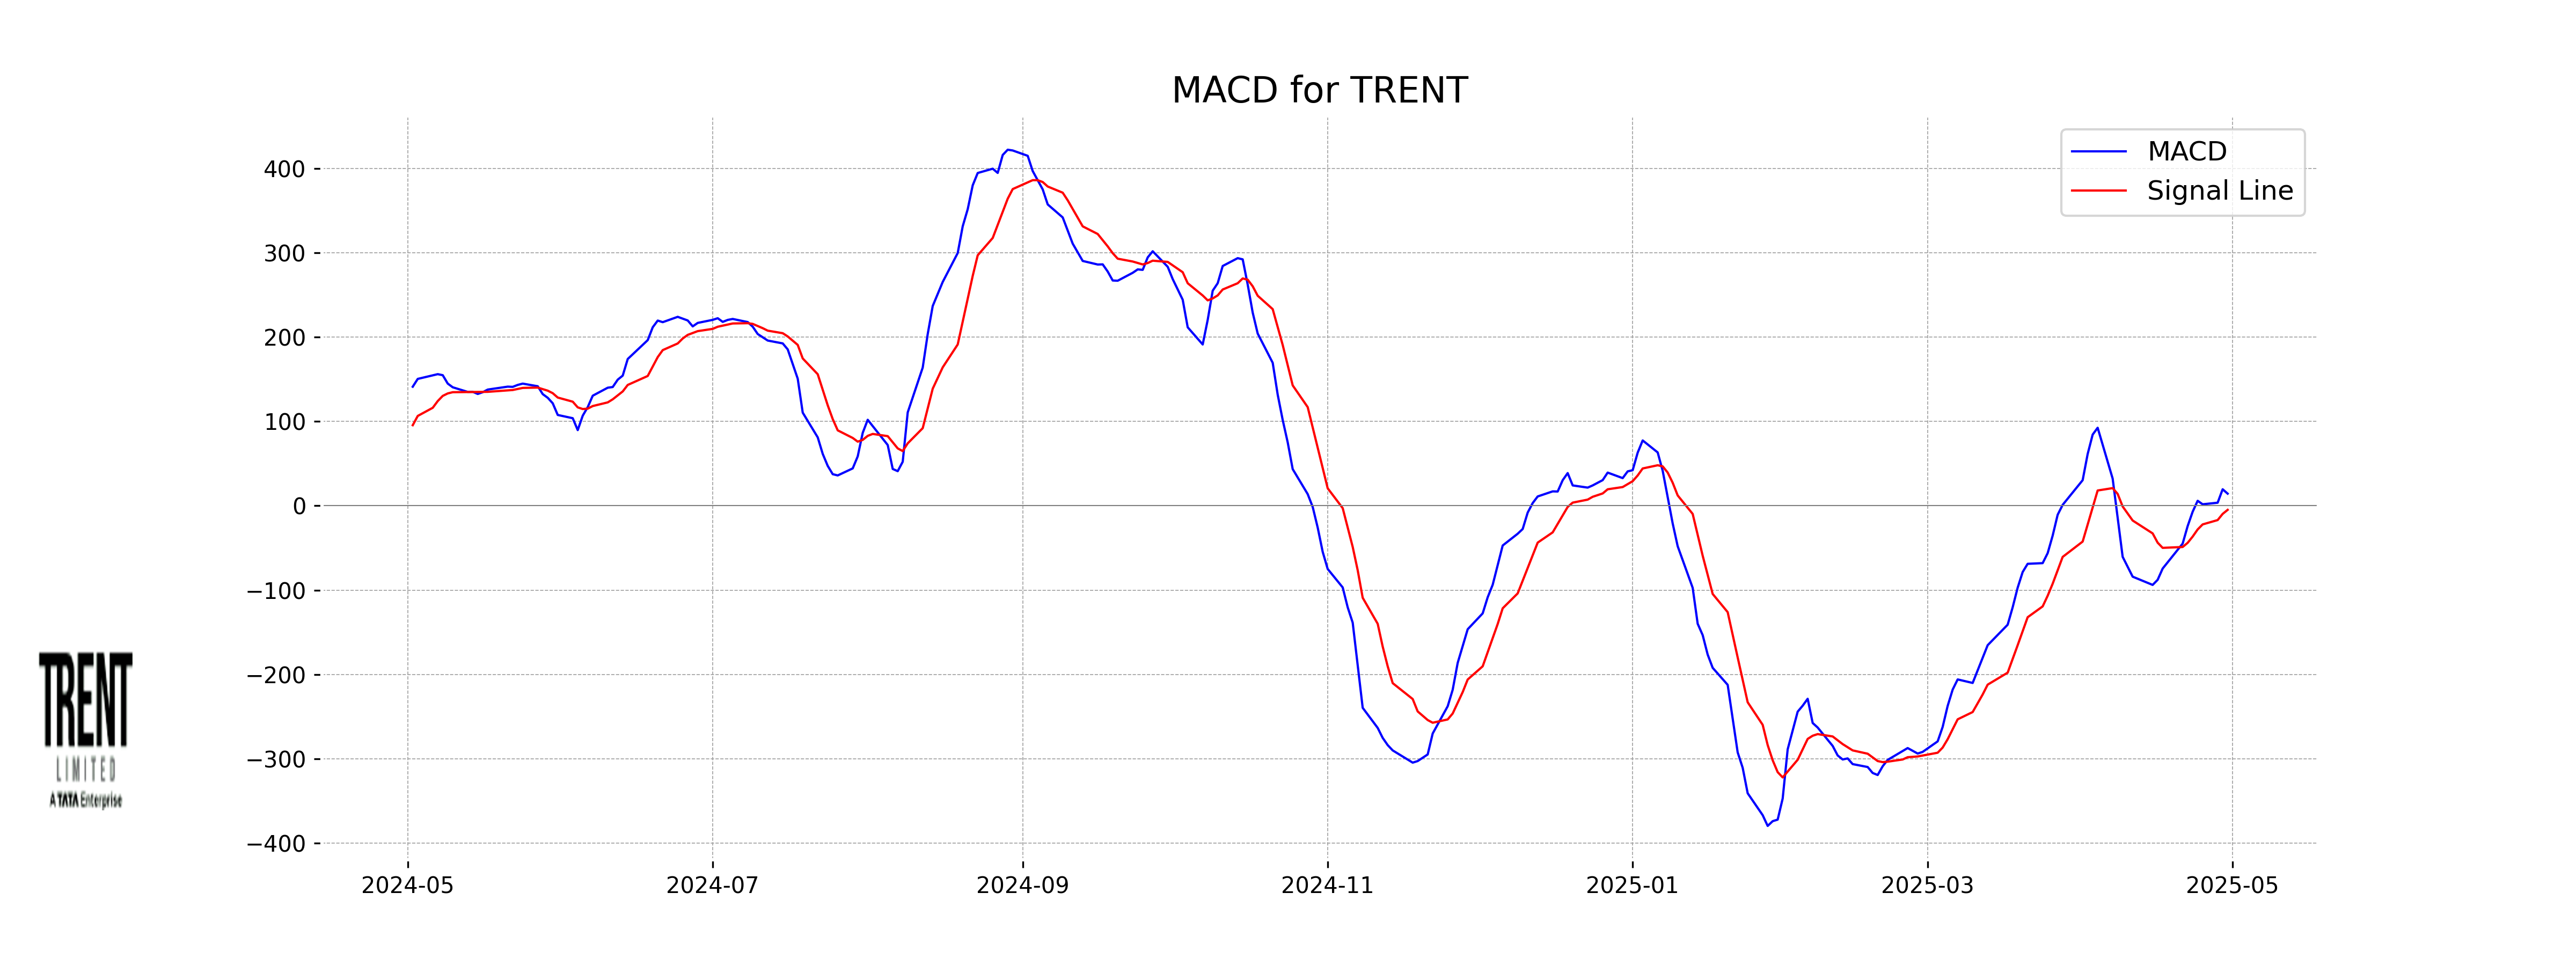
Analysis for Trent - April 30, 2025

Trent Performance: Trent Ltd experienced a decline in its stock value, closing at 5172.5, which represents a 4.06% drop from the previous close. Despite strong trading volume at over 2.7 million, the stock remains below its 50 and 200-day EMAs. The RSI indicates a balanced market sentiment, suggesting that the stock is neither overbought nor oversold. The company, part of the Consumer Cyclical sector in the Apparel Retail industry, maintains a high PE ratio, reflecting its growth expectations in the Indian market.

Relationship with Key Moving Averages
The closing price of Trent is 5172.5, which is below both its 50-day EMA (5302.12) and 200-day EMA (5658.29), indicating potential bearish momentum. However, it is above the 10-day EMA (5219.70) and almost at par with the 20-day EMA (5196.57), suggesting short-term mixed signals.
Moving Averages Trend (MACD)
The MACD for Trent is 14.38, which is above the MACD Signal of -4.84, indicating a bullish momentum despite the recent drop in stock price. This suggests potential for a price correction or upward movement in the short term.
RSI Analysis
Trent's RSI (Relative Strength Index) is currently at 49.21. This indicates that the stock is neither in the overbought nor oversold territory, suggesting a balanced momentum. It implies that there is no strong directional bias in the current price trend.

Up Next
NSE Nifty 50: Top 5 stock losers of April 30, 2025

Step-by-step guide to apply for a mortgage loan online with minimal documentation

Honda Activa 6G: Everything You Need to Know Before Buying

How much does a ULIP plan really cost? A break-down of all charges

Centre plans to borrow Rs 8.20 lakh cr from market in first half of FY27

Reliance denies buying Iranian oil amid US sanctions waiver

More videos

Premium petrol price up Rs 2, industrial diesel up Rs 22; no change in normal petrol, diesel rates

India's GDP expected to register over 8 pc growth in Sep-Dec: Report

Govt announces seven measures to help boost exports

RBI keeps interest rates on hold after US trade deal boosts outlook

RBI proposes to compensate customers up to Rs 25,000 loss due to fraud

RBI raises GDP growth projection of Q1, Q2 of FY27

RBI pauses rate cuts, retains interest rate at 5.25 pc

Rupee jumps 122 paise to close at 90.27 against US dollar on India-US trade deal

Stock markets cheer India-US trade deal: Sensex, Nifty surge 2.5 pc

UPI transactions hit record high of Rs 230 lakh crore in 2025-26 till Dec: Govt