


Highlights
- Infosys and Wipro nearing oversold RSI levels
- Hero MotoCorp and IndusInd show mixed signals
- Power Grid maintains strength above long EMAs
Latest news

Indian cricket prodigy Vaibhav Suryavanshi honoured with 'Pradhan Mantri Rashtriya Bal Puraskar'

AAP Gujarat chief Isudan Gadhvi calls BJP allegations against MLA Chaitar Vasava as politically driven

Aditya Dhar's 'Dhurandhar' earns over Rs 1000 crore at box office

Australia lead England by 46 after 20 wickets fall on crazy day at MCG

Delhi HC asks Centre to respond on plea seeking GST cut on air purifiers amid worsening air quality

Congress pays tribute to former PM Manmohan Singh on first death anniversary

Ruled out of last two Ashes Tests, Cummins sets sights on T20 World Cup in Feb

CEO among three held for gangrape of woman IT firm manager in Udaipur
NSE Nifty 50: Top 5 stock losers of April 22, 2025


In this article, we will explore the technical indicators of some of the low-performing stocks on the Indian stock market, including HEROMOTOCO, INDUSINDBK, INFY, POWERGRID, and WIPRO.
By looking at these stocks through the lens of key technical factors, we aim to better understand their price movements, trends, and potential future performance.

Analysis for Hero MotoCorp - April 22, 2025

Hero MotoCorp Performance: Hero MotoCorp experienced a decline in its stock price, with a closing price of 3833.60, marking a decrease of -2.13% compared to the previous close. The stock's performance is supported by indicators such as the 50-day EMA of 3791.80 and a relatively neutral RSI of 56.74. The company, with a market cap of approximately ₹766,762 million, operates in the Auto Manufacturers industry within the Consumer Cyclical sector in India.

Relationship with Key Moving Averages
Hero MotoCorp's stock is trading above the 50 EMA at 3833.6 compared to 3791.8, indicating potential short-term bullish momentum. However, it is below the 200 EMA of 4253.2, suggesting a bearish trend in the longer term.
Moving Averages Trend (MACD)
Hero MotoCorp's MACD value is 24.77, which is above its MACD Signal value of -5.99, indicating a bullish signal. This suggests that the stock might be in an upward trend. However, it's important to consider other indicators and market conditions for a comprehensive analysis.

RSI Analysis
RSI Analysis for Hero MotoCorp: The RSI (Relative Strength Index) for Hero MotoCorp is 56.74, indicating that the stock is in a neutral zone, neither overbought nor oversold. This suggests a balanced momentum for the stock at the moment.

Analysis for IndusInd Bank - April 22, 2025

IndusInd Bank Performance IndusInd Bank's stock observed a decrease, closing at 787.5 from a previous close of 828.2, marking a 4.91% decline. The Relative Strength Index (RSI) indicates moderate momentum at 54.58. Despite a dip in closing price, the bank maintains a strong market cap of 613,505,040,384 INR and a healthy PE ratio of 8.46, reflecting its stable earnings per share.

Relationship with Key Moving Averages
IndusInd Bank's stock closed at 787.5, which is below its 50 EMA of 814.34 and significantly below its 200 EMA of 1057.02, indicating a potential bearish trend in the short to medium term. However, it remains above its 10 EMA and 20 EMA, situated at 753.10 and 746.14 respectively.
Moving Averages Trend (MACD)
The MACD for IndusInd Bank is -9.81, which is above the MACD Signal of -35.94. This indicates a bullish crossover, suggesting potential upward momentum. However, with both MACD and its Signal being negative, it suggests that overall momentum is currently weak.

RSI Analysis
Based on the data provided, the RSI (Relative Strength Index) for IndusInd Bank is 54.58. This indicates a relatively neutral momentum, suggesting the stock is neither overbought nor oversold at the current levels.

Analysis for Infosys - April 22, 2025

Infosys Performance Infosys shares showed a decrease with a closing price of 1422.80, marking a -1.94% change from the previous close. The stock's RSI of 33.87 indicates it's nearing the oversold territory, while its MACD reflects a negative trend. With a market cap of over 5.8 trillion INR, Infosys operates in the Technology sector, specifically in Information Technology Services in India.

Relationship with Key Moving Averages
The current closing price of Infosys is below its 10-day, 50-day, and 200-day EMAs, which are 1443.68, 1614.24, and 1725.39, respectively. This indicates a bearish trend in the short, medium, and long-term moving averages, as the price is trailing behind all these key moving averages.
Moving Averages Trend (MACD)
Infosys currently has a MACD value of -69.31, which is below the MACD Signal line at -72.87. This indicates a bearish trend in the stock's momentum, suggesting potential continued weakness in the short term.

RSI Analysis
Based on the given data, the RSI for Infosys is 33.87, indicating that the stock is nearing oversold territory. An RSI below 30 is typically considered oversold, which may suggest a potential buying opportunity if other indicators align.

Analysis for Power Grid - April 22, 2025

Power Grid Performance Overview: Power Grid reported a decline with a closing price of 312.55 INR, marking a -2.33% change from its previous close of 320.00 INR. Despite the slight drop, the stock's indicators such as a 66.69 RSI suggest relative strength, and its MACD indicates an upward trend compared to its MACD Signal. With a market cap of approximately 2.91 trillion INR and a PE ratio of 18.75, Power Grid remains a significant player in India's regulated electric utilities sector.
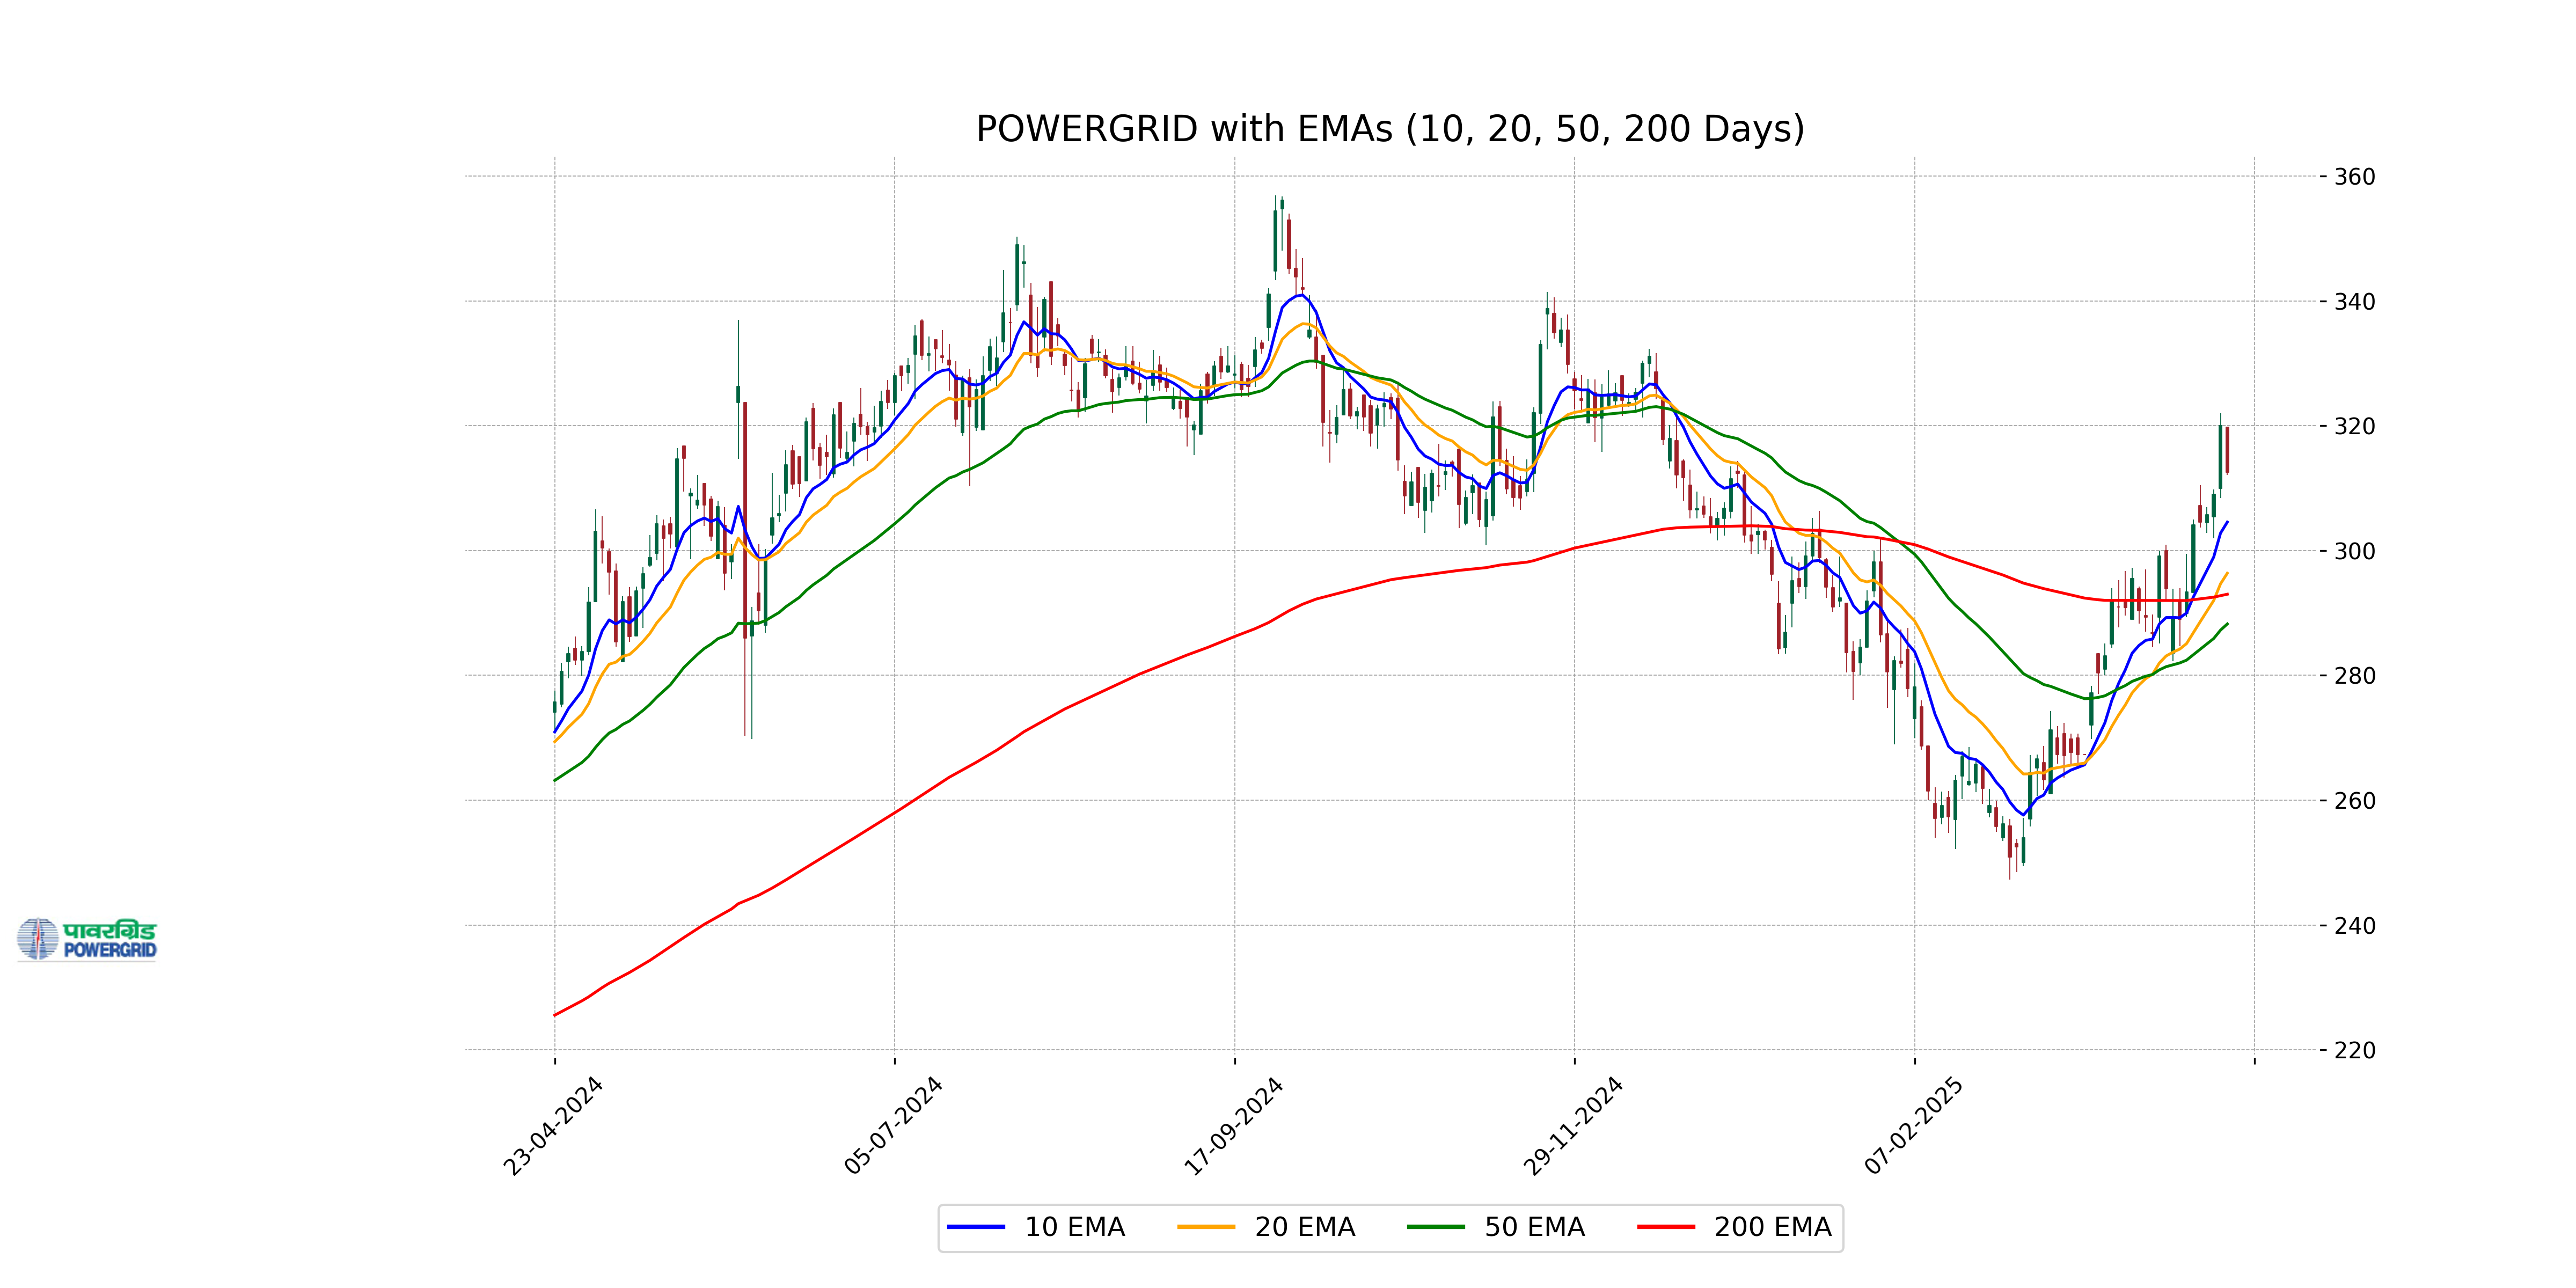
Relationship with Key Moving Averages
Power Grid's current stock price is trading below its 10 EMA (304.56) but well above its 50 EMA (288.24) and 200 EMA (293.01), indicating a recent downward trend against short-term averages while maintaining strength over longer periods.
Moving Averages Trend (MACD)
Power Grid: The MACD value for Power Grid is 9.5933, which is higher than the MACD Signal of 7.6519. This suggests a bullish trend, indicating that the stock's upward momentum might continue. However, considering the overall market conditions and other indicators, investors should exercise caution.

RSI Analysis
The RSI (Relative Strength Index) for Power Grid is 66.69, which suggests that the stock is neither oversold nor overbought, as it is below the typical overbought threshold of 70. The stock appears to be in a neutral zone, indicating balanced momentum at present.

Analysis for Wipro - April 22, 2025

### Wipro Performance Summary Wipro experienced a downward trend in its share price, with a -1.80% change and a close at 234.15 INR. The stock's RSI suggests it is nearing oversold territory at 31.96. With a market cap of approximately 2,449.3 billion INR and a PE ratio of 18.70, Wipro's performance indicates some short-term bearish sentiment in the Technology sector within India.

Relationship with Key Moving Averages
For Wipro, the current close price of 234.15 is below critical moving averages with the 10 EMA at 243.18, the 20 EMA at 251.69, the 50 EMA at 268.49, and the 200 EMA at 270.86. This indicates a bearish trend in comparison to short and long-term moving averages.
Moving Averages Trend (MACD)
The MACD analysis for Wipro indicates a bearish trend as the MACD value (-11.26) is below the Signal line (-10.71), suggesting downward momentum in the stock price. With its RSI at 31.96, the stock is approaching oversold conditions, which might attract buyers if the trend shifts.

RSI Analysis
Wipro's RSI is 31.96, indicating that the stock is currently in oversold territory. This suggests potential for a price reversal or a buying opportunity if other indicators are supportive.

Up Next
NSE Nifty 50: Top 5 stock losers of April 22, 2025

India revamps tax regime in 2025, new I-T Act to take effect from April 1

New Zealand commits USD 20 bn investment in India under FTA in 15 yrs; on lines of EFTA pact

India, New Zealand conclude FTA talks; pact to offer duty-free access, USD 20 bn FDI

FTA with New Zealand to significantly deepen bilateral economic engagement: Govt

Rupee breaches 91-mark against US dollar for first time in intra-day trade

More videos

Microsoft commits USD 17.5 billion investment in India: CEO Satya Nadella

CBI books Anil Ambani's son, Reliance Home Finance Ltd. in Rs 228 crore bank fraud case

RBI raises FY26 GDP growth projection to 7.3 pc

RBI trims policy interest rate by 25bps to 5.25pc, loans to get cheaper

Rupee slumps to all-time low of 90.25 against US dollar in intra-day trade

Reliance completes merger of Star Television Productions with Jiostar

India to lead emerging market growth with 7pc GDP rise in 2025: Moody’s

Nifty hits record high after 14 months; Sensex nears all-time peak

Reliance stops Russian oil use at its only-for-export refinery to comply with EU sanctions

ED attaches fresh assets worth over Rs 1,400 cr in case against Anil Ambani's Reliance Group