


Highlights
- Wipro and TechM approach oversold RSI levels
- JSW Steel and Hero MotoCorp show weakness
- Coal India MACD suggests mild bearish momentum
Latest news

Indian cricket prodigy Vaibhav Suryavanshi honoured with 'Pradhan Mantri Rashtriya Bal Puraskar'

AAP Gujarat chief Isudan Gadhvi calls BJP allegations against MLA Chaitar Vasava as politically driven

Aditya Dhar's 'Dhurandhar' earns over Rs 1000 crore at box office

Australia lead England by 46 after 20 wickets fall on crazy day at MCG

Delhi HC asks Centre to respond on plea seeking GST cut on air purifiers amid worsening air quality

Congress pays tribute to former PM Manmohan Singh on first death anniversary

Ruled out of last two Ashes Tests, Cummins sets sights on T20 World Cup in Feb

CEO among three held for gangrape of woman IT firm manager in Udaipur
NSE Nifty 50: Top 5 stock losers of April 17, 2025


In this article, we will explore the technical indicators of some of the low-performing stocks on the Indian stock market, including COALINDIA, HEROMOTOCO, JSWSTEEL, TECHM, and WIPRO.
By looking at these stocks through the lens of key technical factors, we aim to better understand their price movements, trends, and potential future performance.

Analysis for Coal India - April 17, 2025
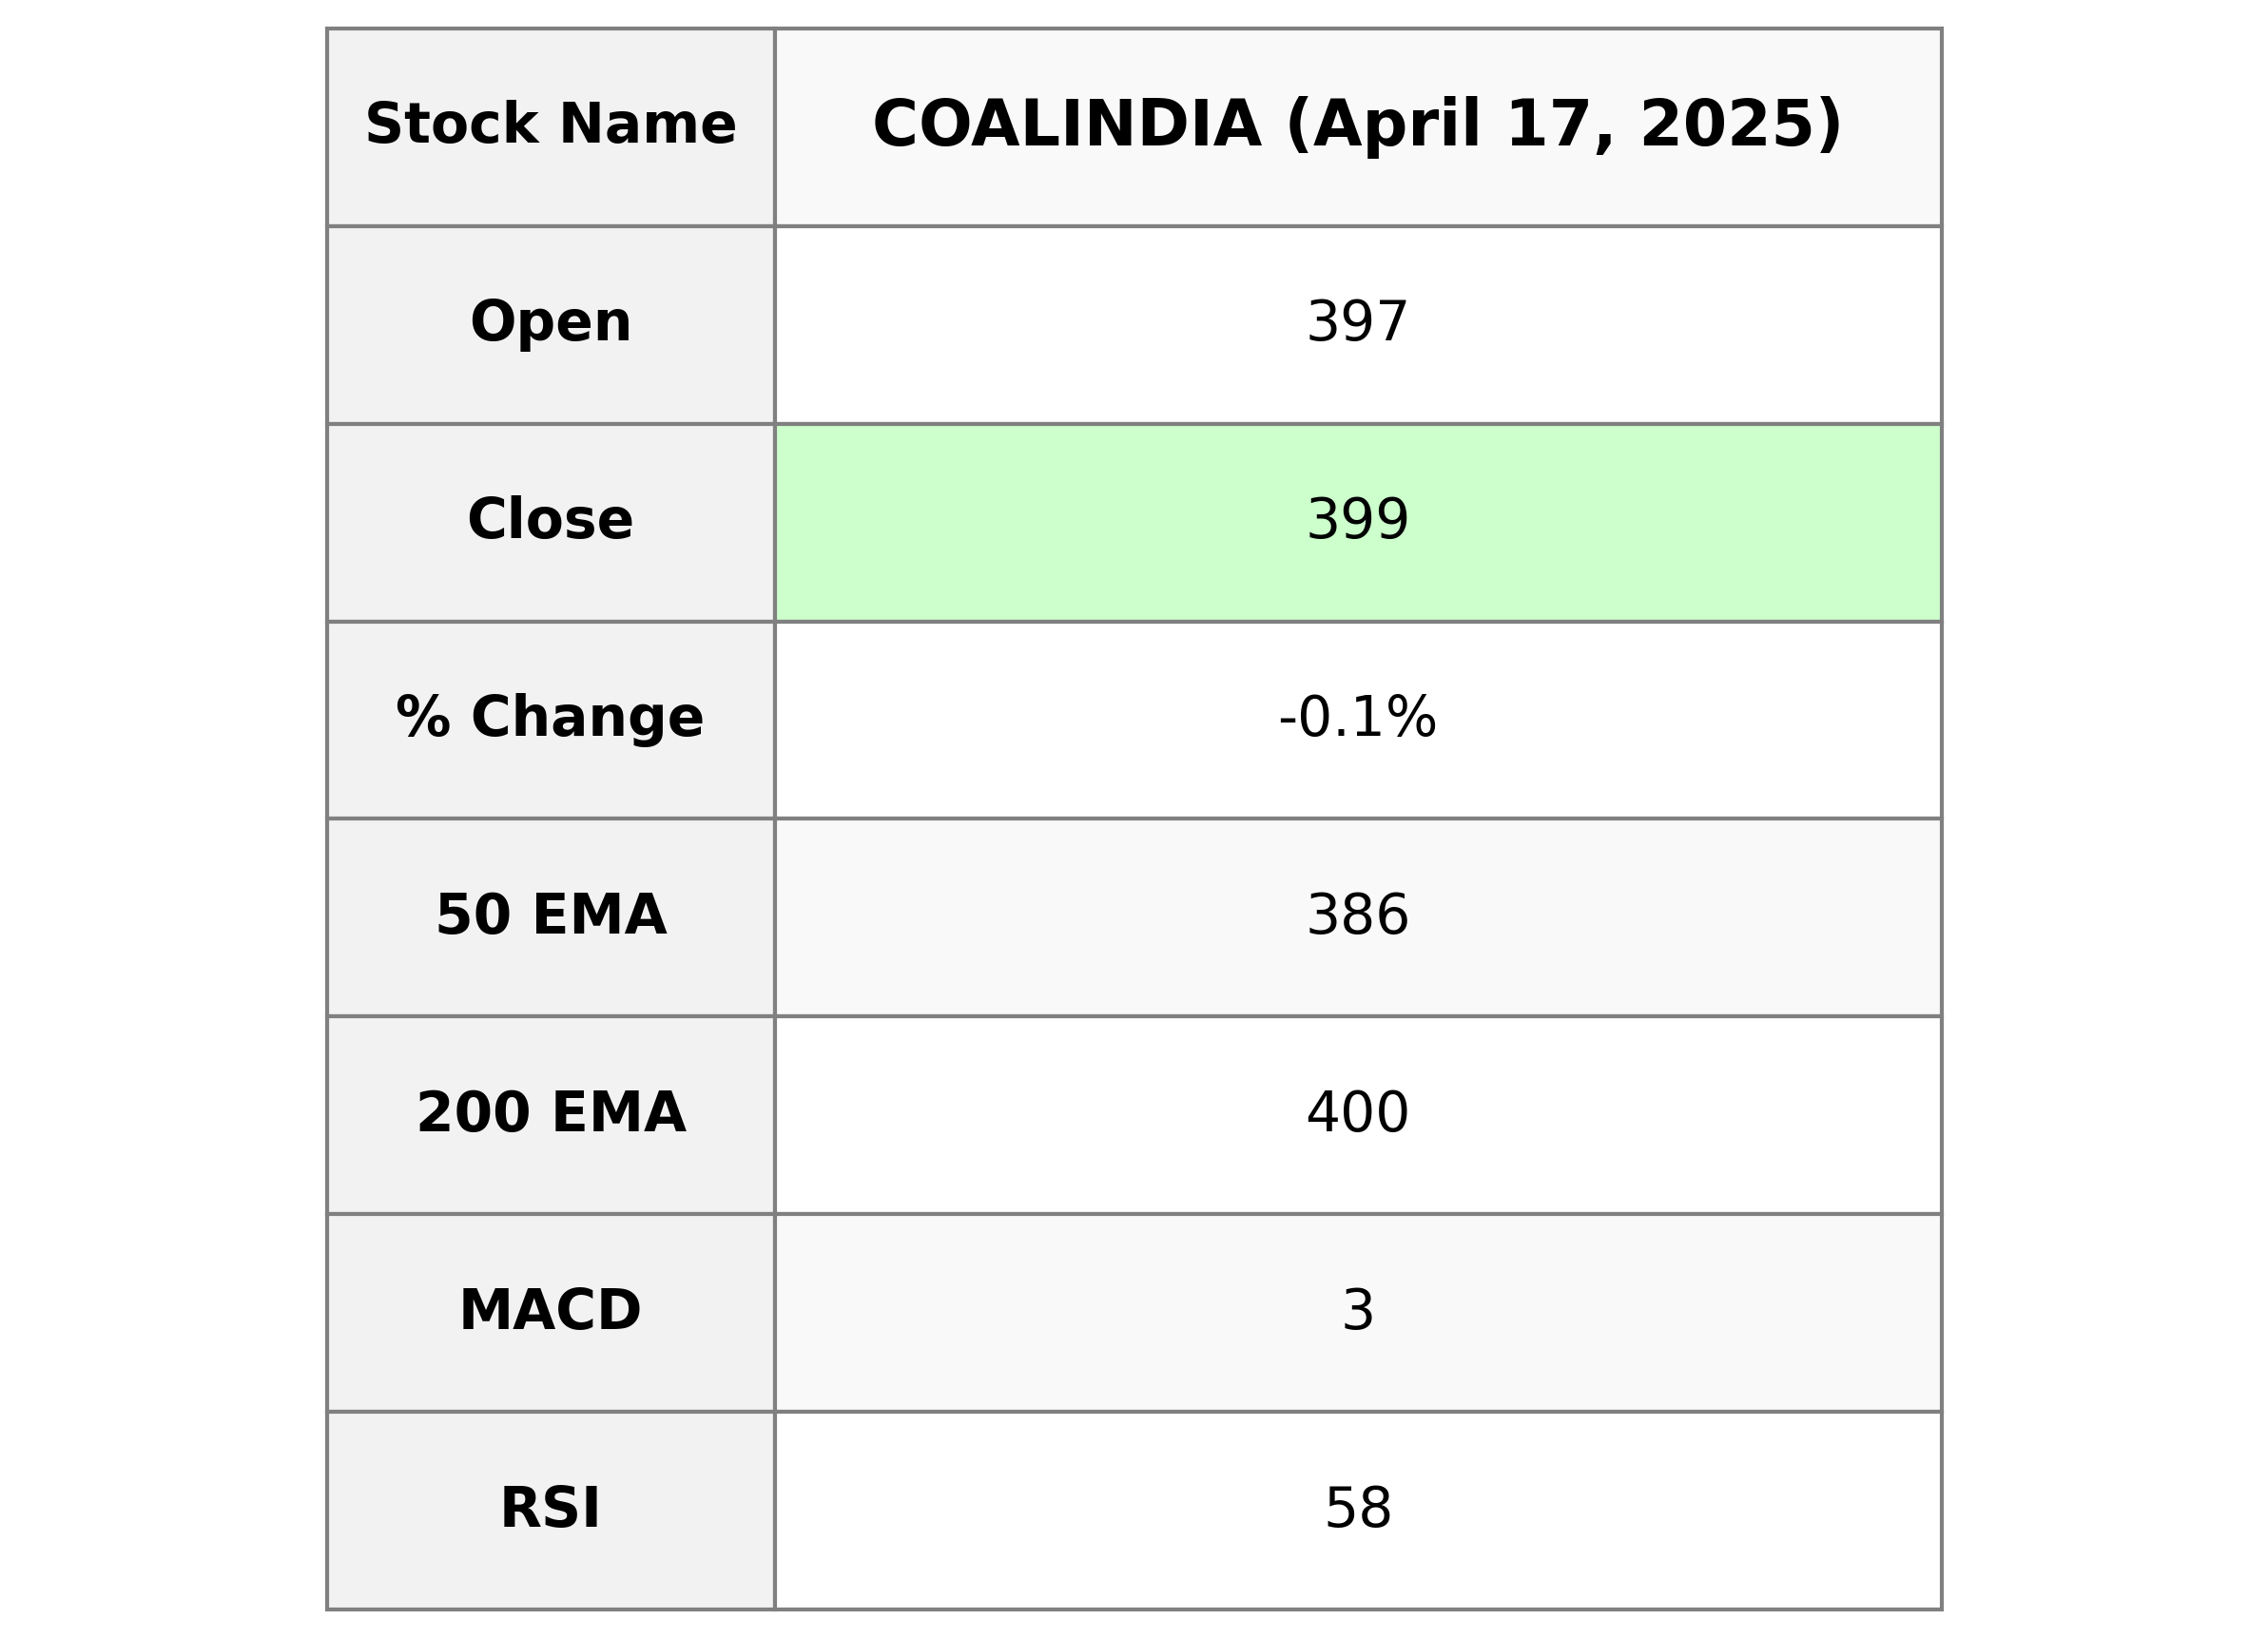
Coal India Performance Coal India, a leading company in the Thermal Coal industry, witnessed a slight decrease in its closing stock price, falling by 0.10% to 398.85. The stock displays a strong RSI of 57.98, indicating gradual upward momentum, although its MACD suggests mild bearish sentiment. With a substantial market cap of 2,458,005 million INR, the company is positioned solidly in the Energy sector in India.

Relationship with Key Moving Averages
For Coal India, the closing price (398.85) is slightly below its previous close (399.25), indicating a minor decline. The stock is trading above its 50-day EMA (385.89) and 20-day EMA (390.12), but below the 200-day EMA (400.07), suggesting short-term strength yet caution for longer-term trends.
Moving Averages Trend (MACD)
MACD Analysis for Coal India: The MACD value is 3.31, which is slightly below the MACD Signal of 3.45. This suggests a bearish trend as the MACD line is below the signal line, indicating potential downside momentum in the short term.

RSI Analysis
The RSI for Coal India is approximately 57.98, which is below the typical overbought threshold of 70, indicating that the stock is not currently overbought. This suggests a neutral momentum with no immediate overbought or oversold signals, allowing room for potential future price movements in either direction.

Analysis for Hero MotoCorp - April 17, 2025

Hero MotoCorp Performance Summary: Hero MotoCorp experienced a slight decline in its stock price with a close at 3771.80, down by 0.27% from the previous close. The company's RSI is at 55.01, indicating moderate momentum, while the MACD shows a positive trend with a value of 1.22. The market capitalization stands at approximately ₹75,440 crore, with a PE ratio of 18.20, reflecting its position within the Consumer Cyclical sector in India's Auto Manufacturers industry.

Relationship with Key Moving Averages
Hero MotoCorp's current closing price of 3771.80 is slightly below the 50-day EMA of 3784.92 but above the 10-day and 20-day EMAs of 3708.64 and 3693.58, respectively. This positioning suggests a short-term bullish trend, although it remains significantly below the 200-day EMA of 4262.72, indicating overall bearish pressure over a longer timeframe.
Moving Averages Trend (MACD)
MACD Analysis for Hero MotoCorp: The MACD value of 1.22, compared to the signal line at -21.68, suggests that currently there is a bullish momentum, as the MACD line is above the signal line. However, the substantial negative value of the signal line indicates prior bearish pressure, so further observation is required to confirm a sustained uptrend.

RSI Analysis
The RSI (Relative Strength Index) of Hero MotoCorp is currently 55.01. This value suggests that the stock is in neutral territory, indicating that it is neither overbought nor oversold. Traders often consider an RSI between 30 and 70 as a normal range.

Analysis for JSW Steel - April 17, 2025

JSW Steel: JSW Steel experienced a slight decrease in its stock price, closing at 1007.20 against the previous close of 1009.40, marking a -0.22% change. Despite a strong volume of 2,074,003 shares, the stock's PE ratio of 74.44 suggests a high market valuation relative to its EPS of 13.53. The stock operates within the Basic Materials sector, specifically in the Steel industry in India.

Relationship with Key Moving Averages
JSW Steel's closing price of 1007.20 is above its 50-day EMA of 995.31 and its 200-day EMA of 951.78, indicating a bullish trend relative to these key moving averages. However, it is slightly below the 20-day EMA of 1006.94, suggesting a potential short-term consolidation or possible pullback.
Moving Averages Trend (MACD)
JSW Steel: The MACD for JSW Steel is showing -2.71, which is below the MACD Signal at 2.33. This indicates a bearish momentum in the stock's price trend. It suggests that the stock might be experiencing selling pressure in the short term.

RSI Analysis
The Relative Strength Index (RSI) for JSW Steel is 50.36, indicating a neutral stance in terms of momentum. An RSI around 50 suggests that the stock is neither overbought nor oversold, implying no strong buy or sell signals based solely on this indicator.

Analysis for Tech Mahindra - April 17, 2025

Tech Mahindra experienced a slight decrease in stock value, closing at 1306.80, down by -1.90 points or -0.15%. The company shows a bearish trend with an RSI of 34.22 and a negative MACD suggesting potential for negative momentum in the short term. The stock's market cap stands at 1,156.52 billion INR within the Technology sector, specifically in Information Technology Services in India.

Relationship with Key Moving Averages
Tech Mahindra is trading below its key moving averages, with the current close of 1306.80 below the 10-day EMA of 1323.44, the 50-day EMA of 1468.04, and the 200-day EMA of 1531.75. This indicates a bearish trend as the stock price remains under these critical averages.
Moving Averages Trend (MACD)
MACD Analysis for Tech Mahindra: The MACD value is -59.70, which is below the signal line at -59.38, indicating a bearish trend. The negative MACD value suggests that the stock may experience continued downward momentum in the short term. Additionally, the RSI at 34.23 also points to potential oversold conditions.

RSI Analysis
Tech Mahindra's Relative Strength Index (RSI) is 34.23, indicating that the stock is nearing the oversold territory. An RSI below 30 is typically considered oversold, suggesting the potential for a price reversal or continuation of the downtrend if it drops further.

Analysis for Wipro - April 17, 2025

### Wipro Performance Overview: Wipro experienced a decline in its stock price, closing at 236.90 INR with a -4.34% change from its previous close of 247.65 INR. The stock's RSI of 32.60 indicates it is nearing an oversold condition, while the MACD suggests a bearish trend. Despite the short-term dip, Wipro is part of the technology sector in India, with a market cap of approximately 2.48 trillion INR.

Relationship with Key Moving Averages
Wipro is currently trading below its key moving averages, with its closing price at 236.90 being below the 50 EMA of 271.17, the 200 EMA of 271.55, the 10 EMA of 246.68, and the 20 EMA of 255.12. This indicates a bearish trend relative to these averages.
Moving Averages Trend (MACD)
Wipro MACD Analysis: The MACD for Wipro is currently indicating a bearish signal with a negative MACD value of -11.08, which is lower than the MACD Signal line at -10.46. This suggests that the stock is experiencing downward momentum, and traders might be cautious about entering long positions.

RSI Analysis
RSI Analysis for Wipro: The Relative Strength Index (RSI) for Wipro is 32.60, indicating that the stock is nearing oversold conditions. This suggests that there may be potential for a price reversal if the stock continues to demonstrate bearish momentum.

Up Next
NSE Nifty 50: Top 5 stock losers of April 17, 2025

India revamps tax regime in 2025, new I-T Act to take effect from April 1

New Zealand commits USD 20 bn investment in India under FTA in 15 yrs; on lines of EFTA pact

India, New Zealand conclude FTA talks; pact to offer duty-free access, USD 20 bn FDI

FTA with New Zealand to significantly deepen bilateral economic engagement: Govt

Rupee breaches 91-mark against US dollar for first time in intra-day trade

More videos

Microsoft commits USD 17.5 billion investment in India: CEO Satya Nadella

CBI books Anil Ambani's son, Reliance Home Finance Ltd. in Rs 228 crore bank fraud case

RBI raises FY26 GDP growth projection to 7.3 pc

RBI trims policy interest rate by 25bps to 5.25pc, loans to get cheaper

Rupee slumps to all-time low of 90.25 against US dollar in intra-day trade

Reliance completes merger of Star Television Productions with Jiostar

India to lead emerging market growth with 7pc GDP rise in 2025: Moody’s

Nifty hits record high after 14 months; Sensex nears all-time peak

Reliance stops Russian oil use at its only-for-export refinery to comply with EU sanctions

ED attaches fresh assets worth over Rs 1,400 cr in case against Anil Ambani's Reliance Group