


Highlights
- Hindalco and JSW Steel signal bearish momentum
- Shriram Finance shows weakness below short-term EMAs
- Trent drops 14%, nearing oversold RSI levels
Latest news

CEO among three held for gangrape of woman IT firm manager in Udaipur

PM Modi says government reforms to continue with greater vigour, focusing on ‘Ease of Living’

Reflation, possible earnings revival to push Indian equities higher through 2026: Report

Declassified US documents reveal US, Russia 'nervous' over Pakistan's nuclear proliferation

Delhi Environment Minister warns pollution could spike again amid western disturbances

China hits out at Pentagon report alleging bid to weaken US-India ties

Four VHP, Bajrang Dal members arrested for Christmas vandalism in Assam school

'Papa, I cannot bear pain': Indian-origin man dies after 8-hour wait at Canada hospital
NSE Nifty 50: Top 5 stock losers of April 7, 2025


In this article, we will explore the technical indicators of some of the low-performing stocks on the Indian stock market, including HINDALCO, JSWSTEEL, SHRIRAMFIN, TATASTEEL, and TRENT.
By looking at these stocks through the lens of key technical factors, we aim to better understand their price movements, trends, and potential future performance.

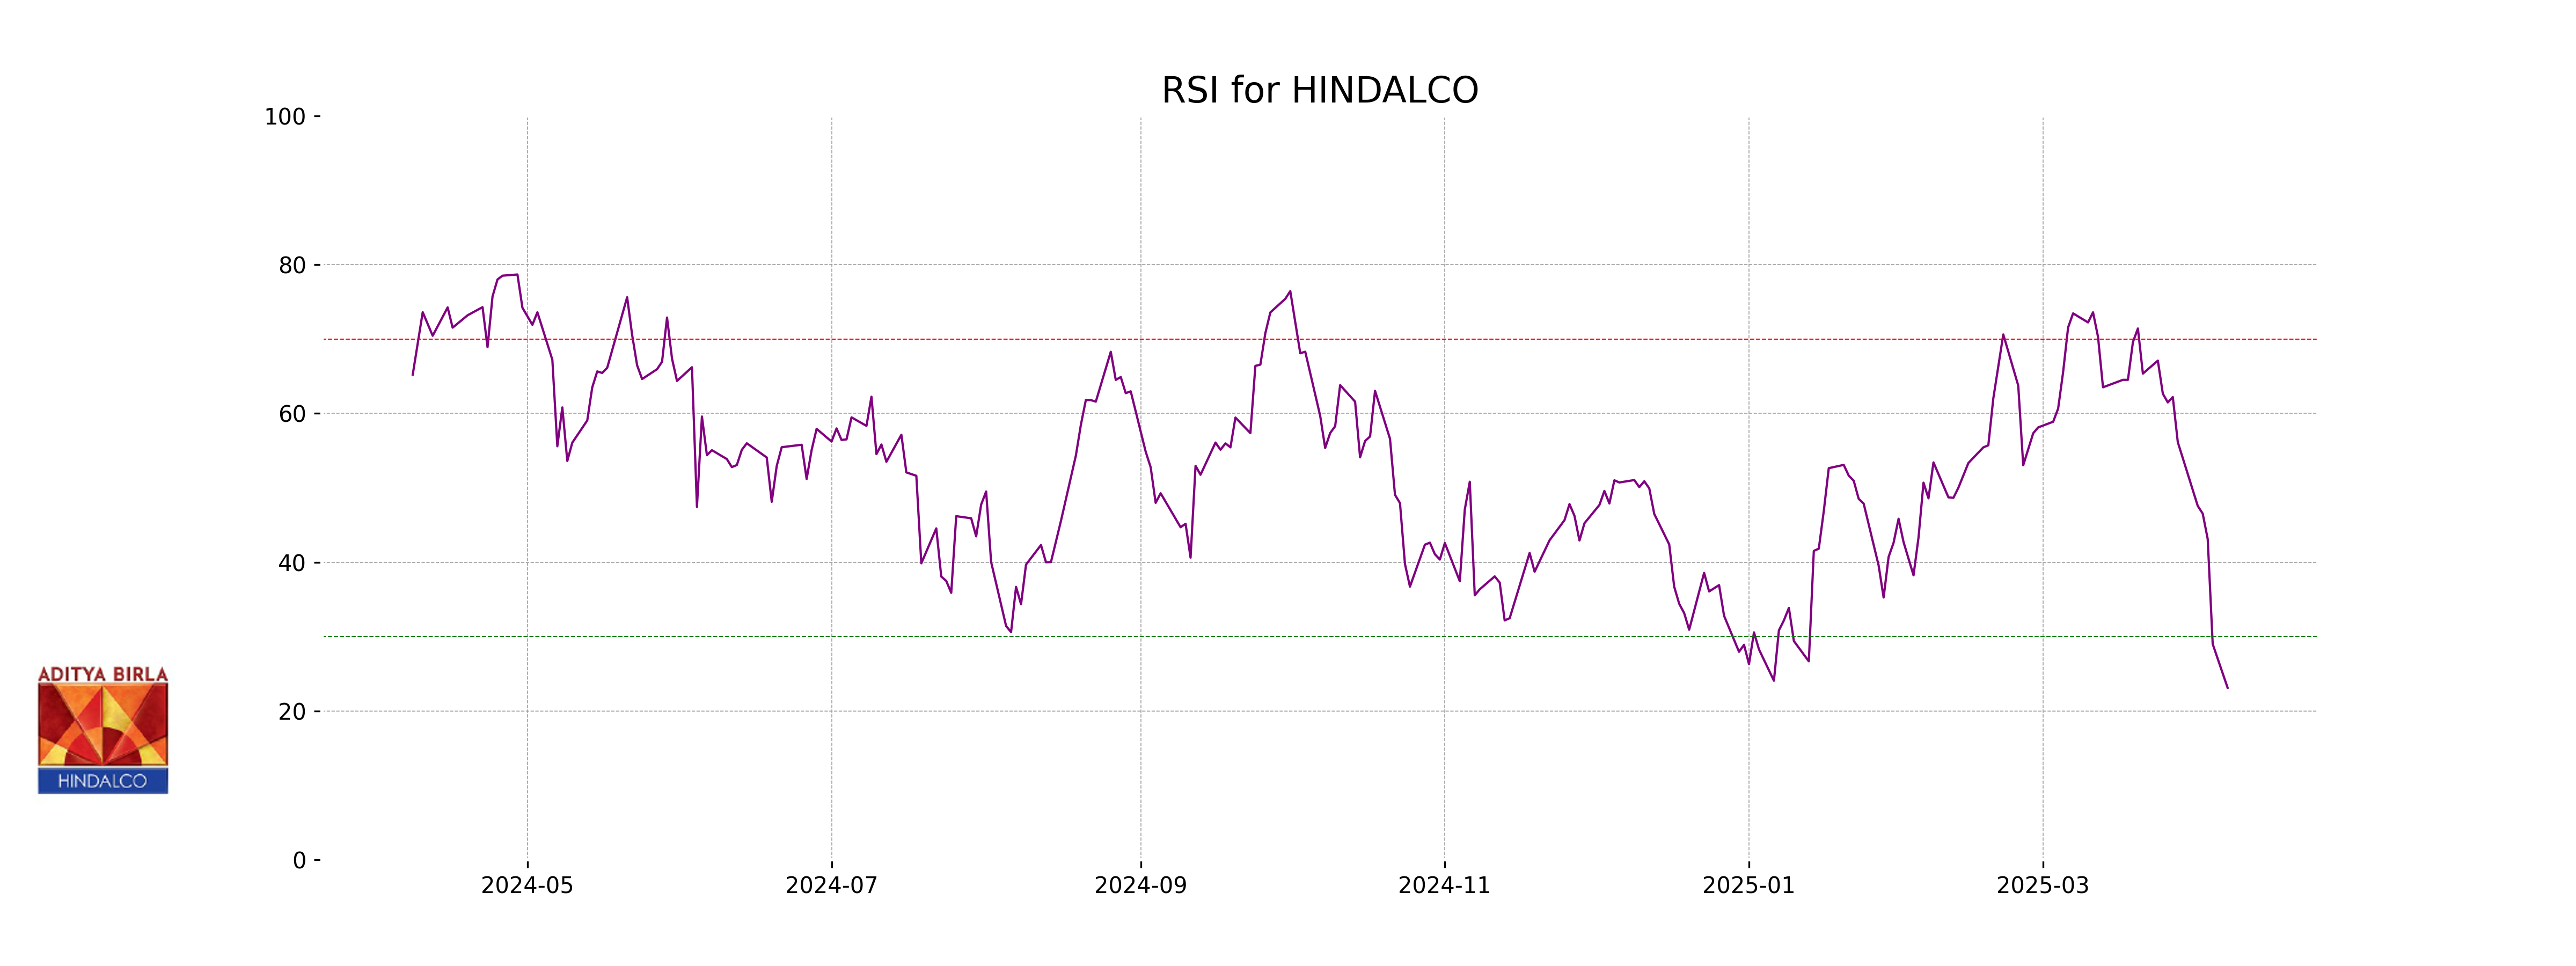
Analysis for HINDALCO - April 07, 2025

### Stock Performance: Hindalco Hindalco experienced a significant decrease in its stock price, closing at 561.80 after opening at 559.00, marking a -6.36% change. With a low RSI value of 23.10, it shows oversold conditions, and the negative MACD indicates potential bearish momentum. The stock's performance was hindered despite a strong market capitalization and a reasonable PE ratio, highlighting potential pressure in the aluminum industry.

Relationship with Key Moving Averages
Hindalco's current closing price of 561.80 is below its key moving averages, with the 50 EMA at 648.50, the 200 EMA at 638.85, the 10 EMA at 643.40, and the 20 EMA at 656.06. This suggests a bearish trend in the short to long term as the price is trading below all significant EMAs.
Moving Averages Trend (MACD)
Hindalco's MACD analysis indicates a bearish trend as the MACD value of -7.22 is well below the MACD Signal line of 8.15. This suggests downward momentum in the stock's price and potential further downside.

RSI Analysis
Hindalco's RSI stands at 23.10, indicating that the stock is currently oversold. This low RSI suggests that the stock may be undervalued at this time, potentially offering a buying opportunity if other indicators align.
Analysis for JSW Steel - April 07, 2025

JSW Steel Performance JSW Steel experienced a significant decline in its stock price, closing at 930.30, which is a drop of approximately 7.5% from its previous close. The stock's RSI suggests oversold conditions, while its MACD indicates a bearish trend. Despite the drop, the market cap remains substantial at over 2.27 trillion Indian rupees. The company's performance shows a significant divergence from multiple EMAs, highlighting current volatility within the steel sector.
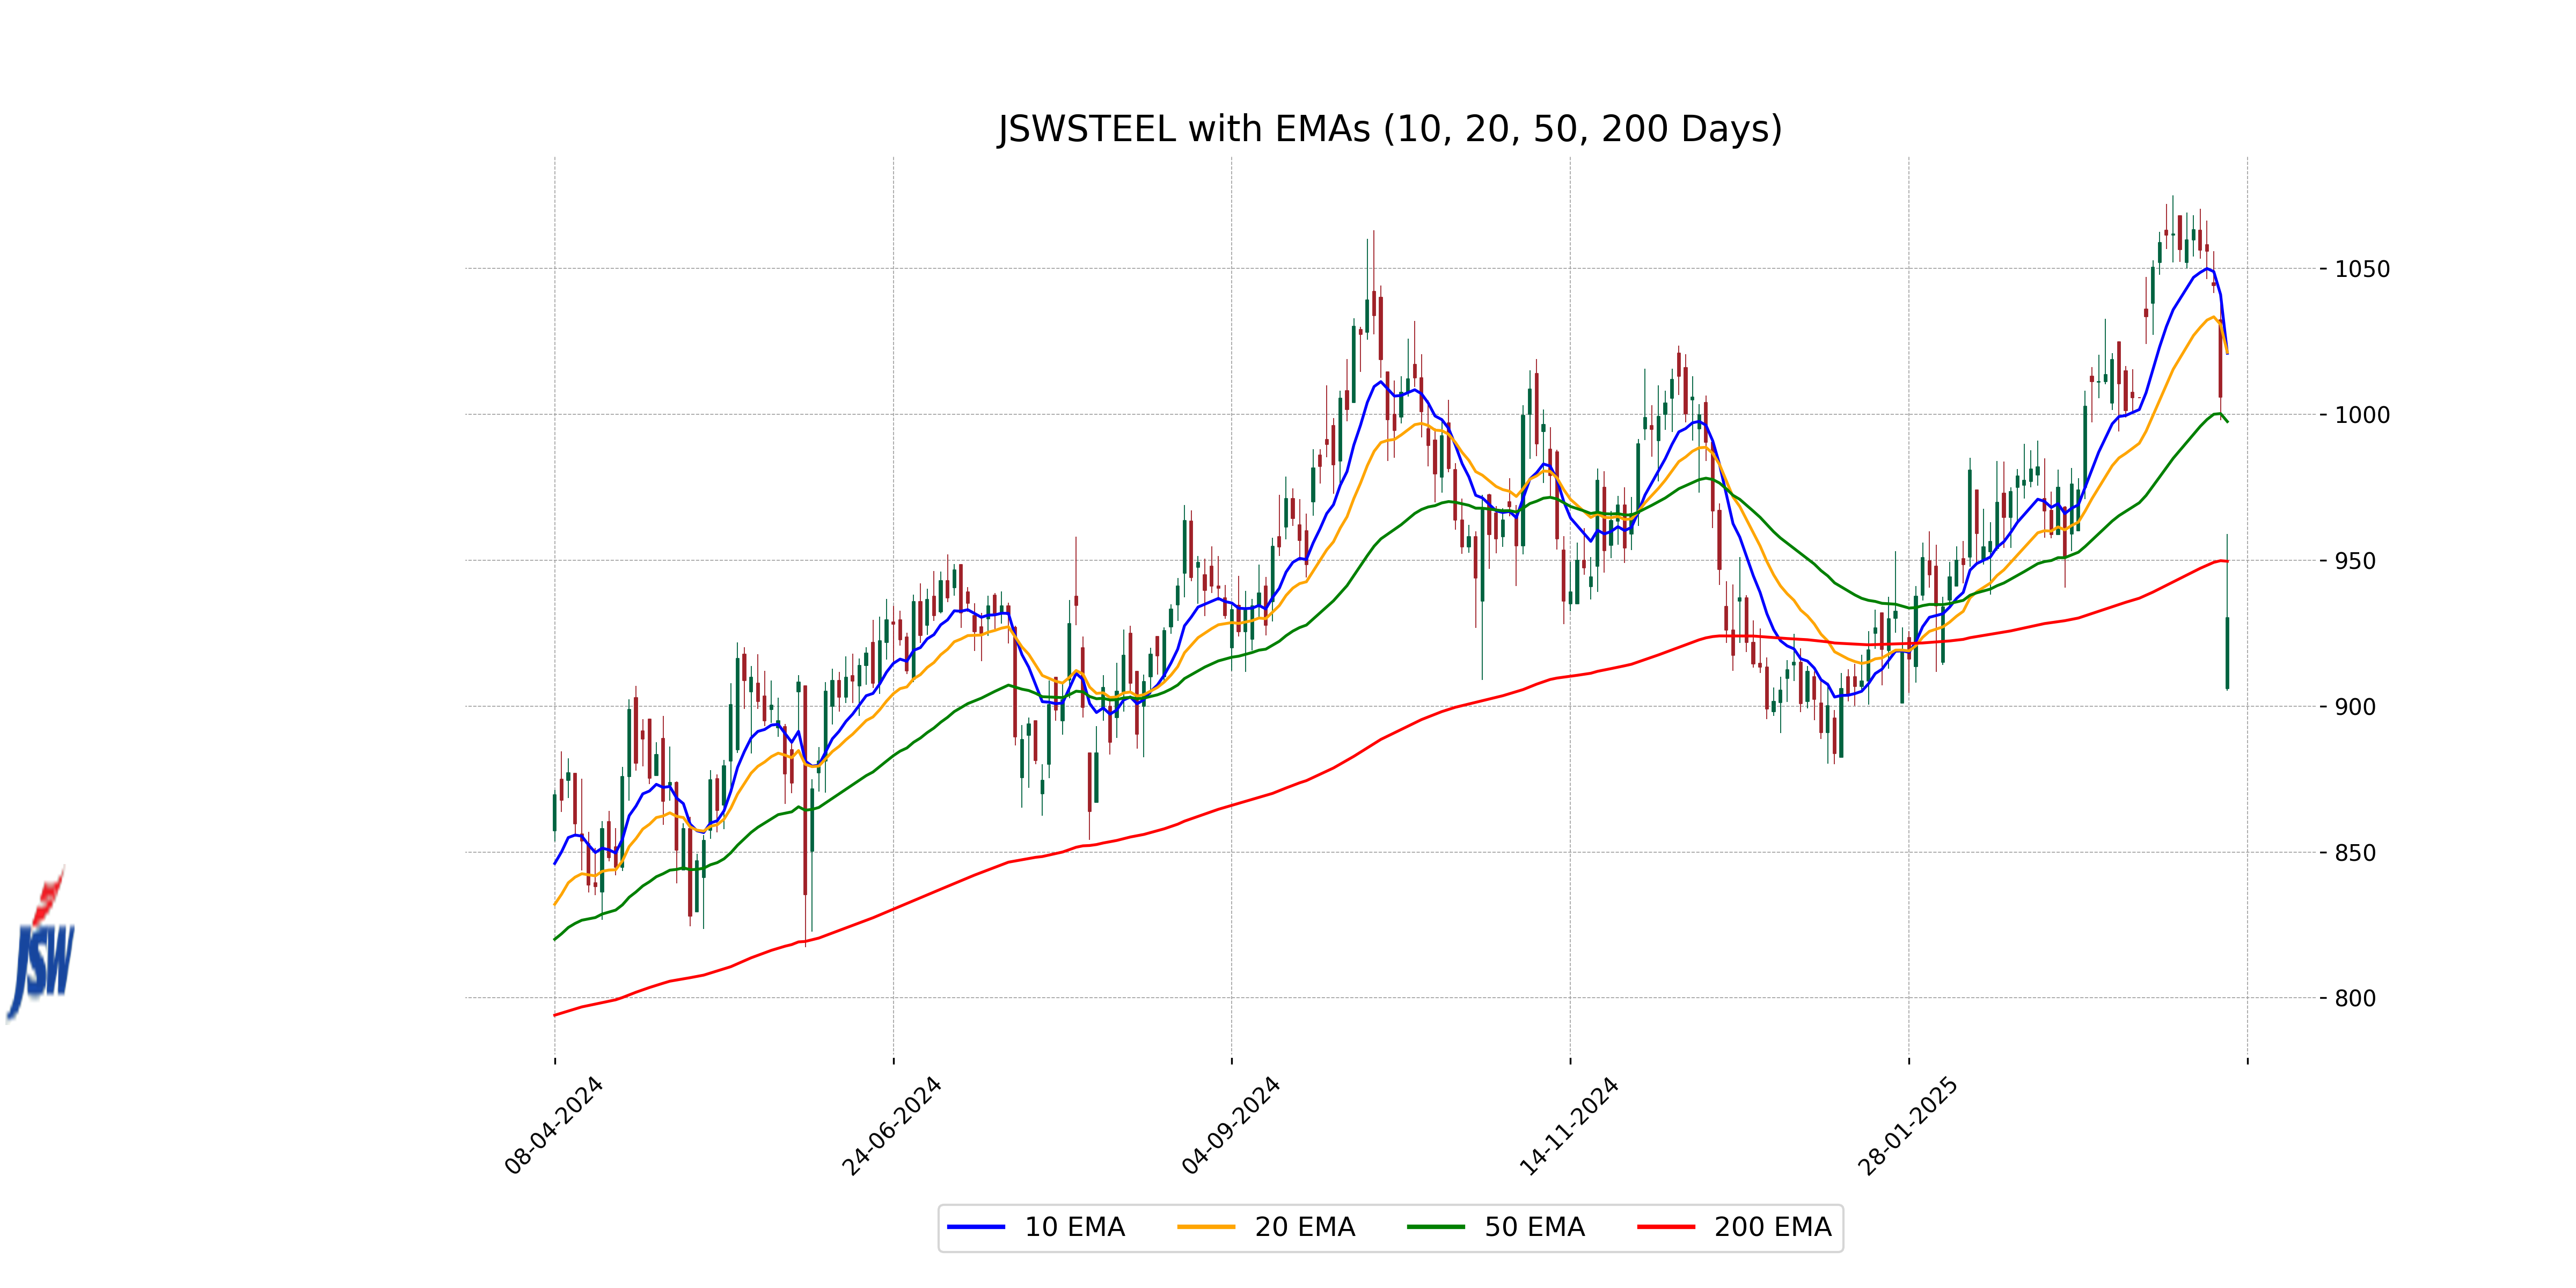
Relationship with Key Moving Averages
The stock price of JSW Steel is trading below its 10-day, 20-day, and 50-day EMAs, indicating a bearish trend. However, it is currently above the 200-day EMA, suggesting longer-term support.
Moving Averages Trend (MACD)
JSW Steel's MACD reading is 6.68, which is currently below the MACD Signal line of 18.39. This suggests a bearish momentum in the stock's price movement.

RSI Analysis
RSI Analysis for JSW Steel: The Relative Strength Index (RSI) for JSW Steel is currently at 27.62, indicating that the stock is in an oversold condition. Typically, an RSI below 30 suggests the stock may be undervalued, and buyers could potentially enter the market.

Analysis for Shriram Finance - April 07, 2025
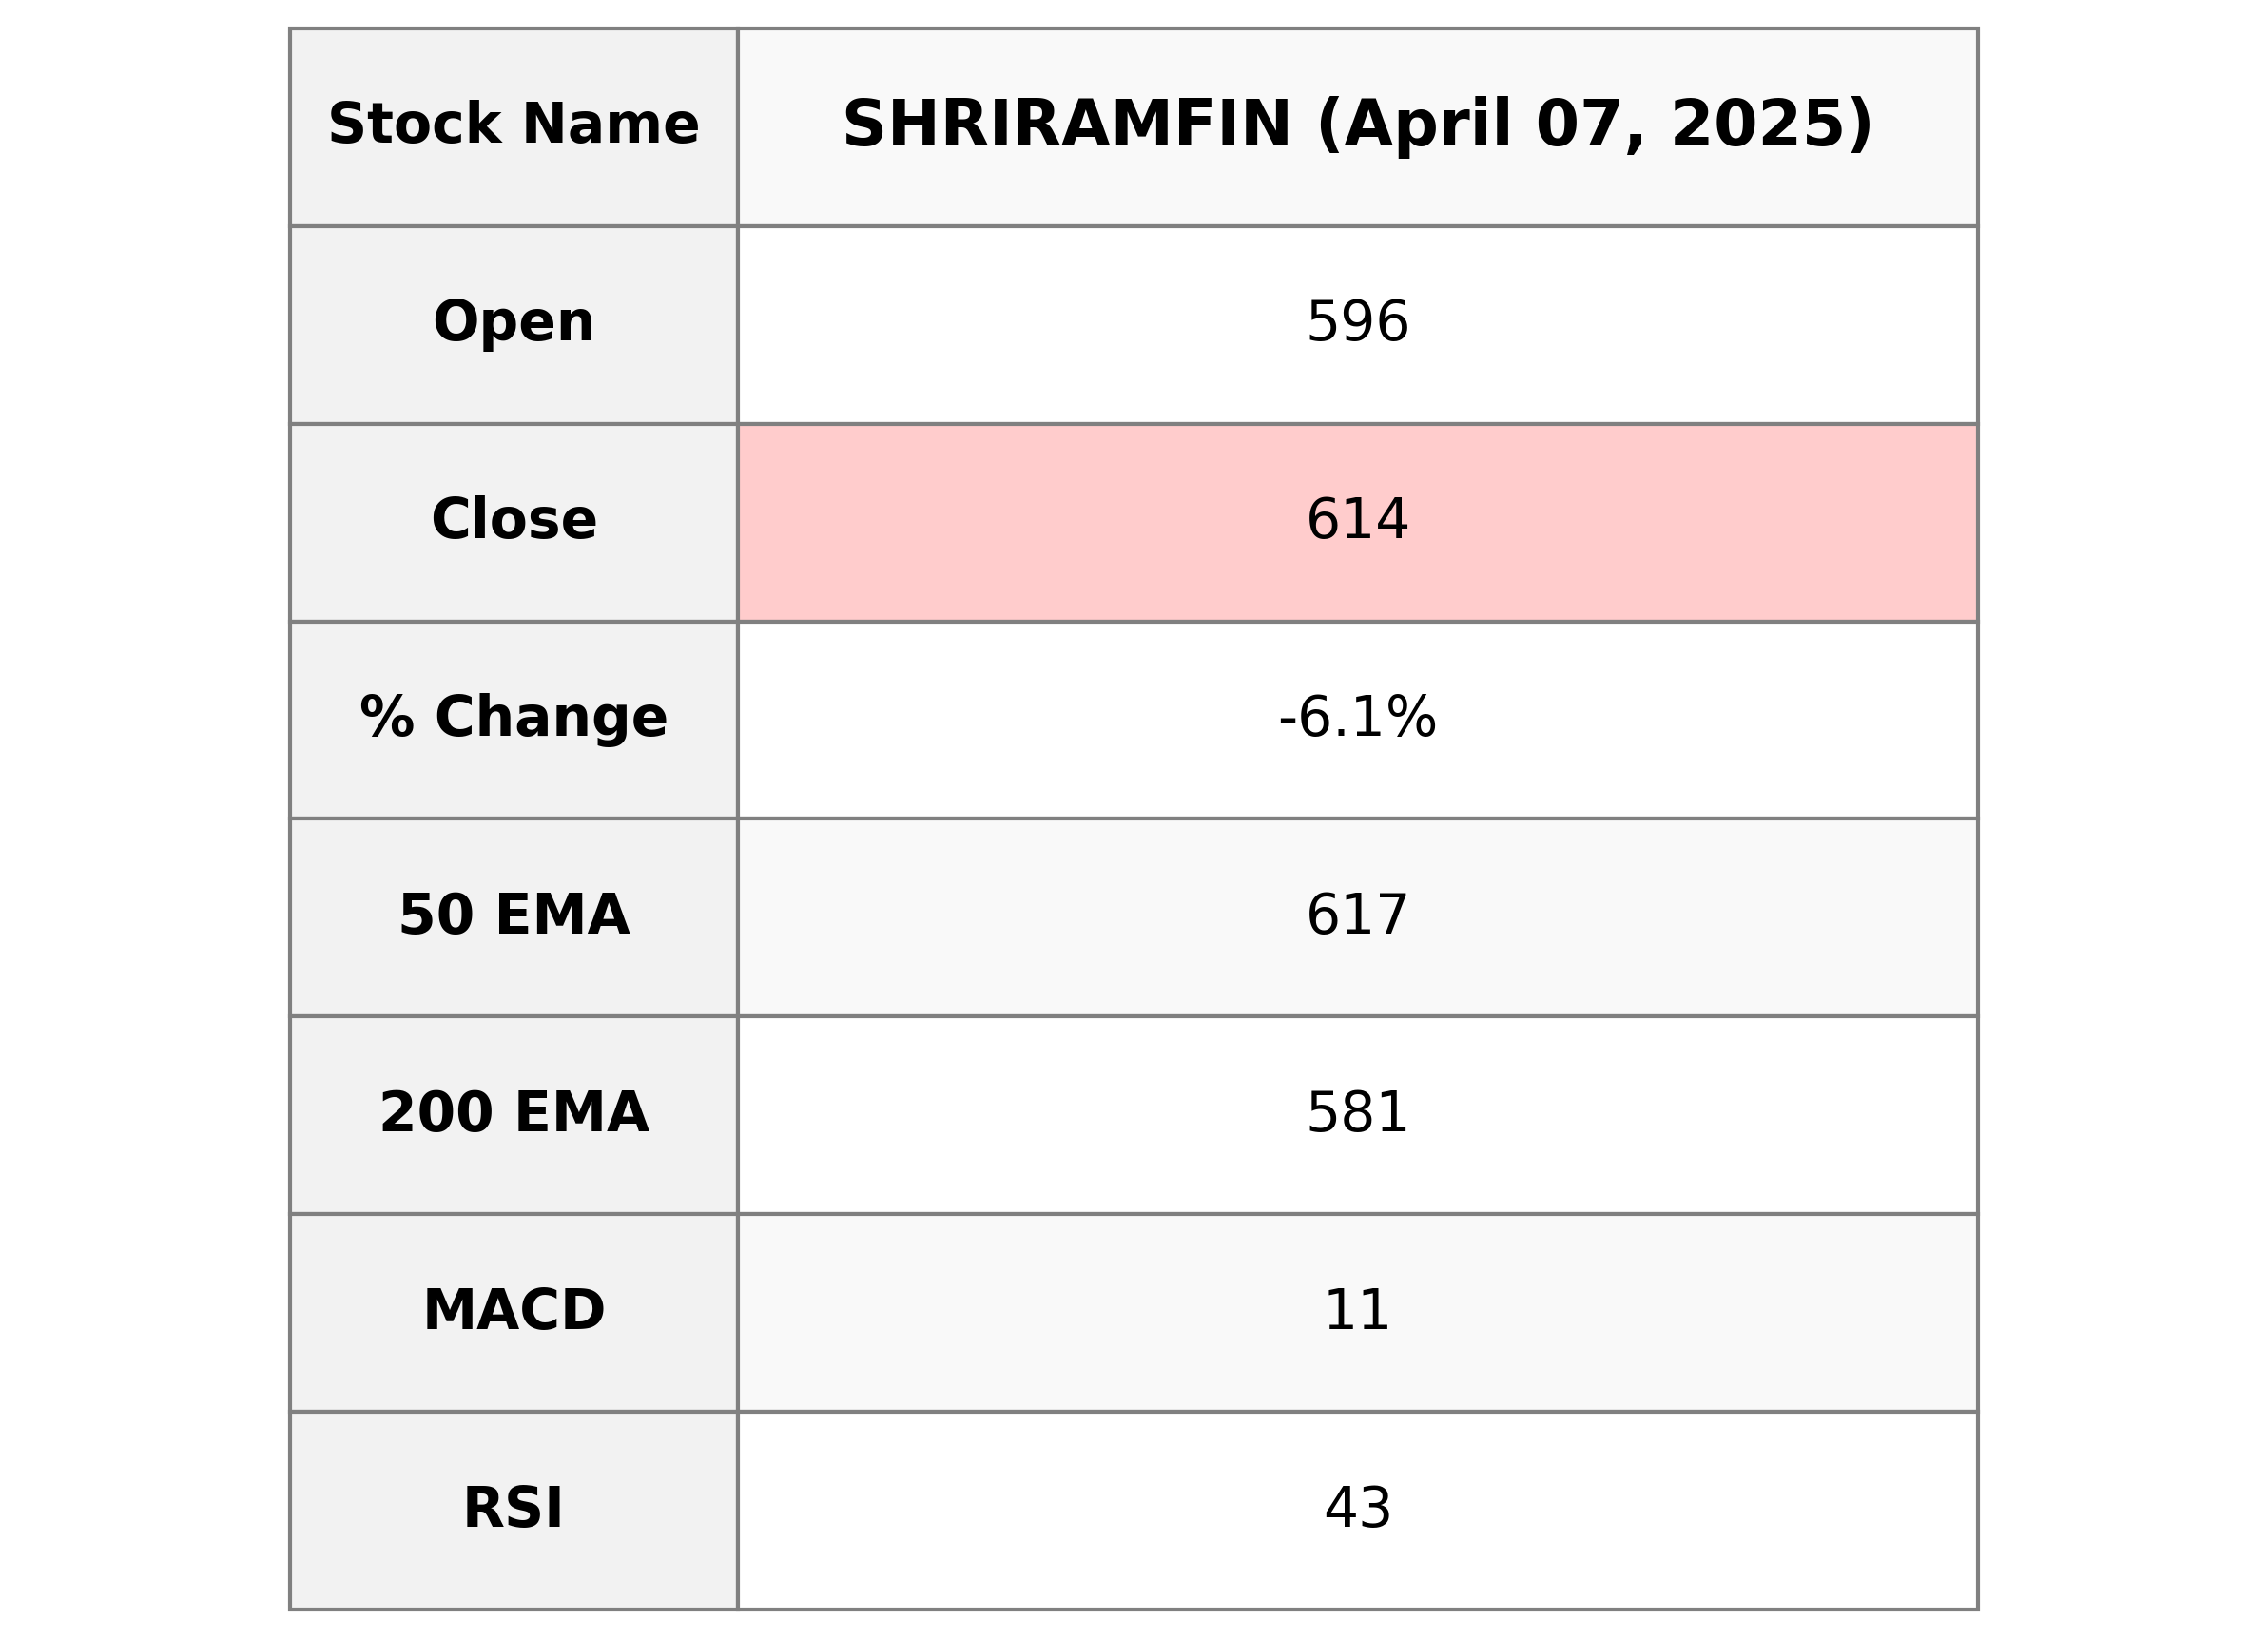
Shriram Finance Performance Overview: Shriram Finance experienced a decrease of approximately 6.06% in stock price, closing at 614 from the previous close of 653.60. The stock's RSI stands at 43.30, indicating weakened momentum, while the MACD suggests a bearish signal. The company operates within the Financial Services sector, specifically in Credit Services, and is based in India.

Relationship with Key Moving Averages
Shriram Finance closed at a price of 614.0, which is below its 10 EMA (646.65), 20 EMA (641.86), and just below the 50 EMA (617.25), but above the 200 EMA (580.77). This suggests a short-term downtrend as it is trading below the short-term EMAs, while remaining above the long-term support of the 200 EMA.
Moving Averages Trend (MACD)
Shriram Finance MACD Analysis: The MACD line for Shriram Finance is currently at 11.03, which is below the MACD Signal line at 17.98. This indicates a bearish trend as the MACD is decreasing and is below the signal line, suggesting potential weakness in the stock's price movement.

RSI Analysis
The RSI (Relative Strength Index) for Shriram Finance is 43.30, which indicates that the stock is currently in the neutral zone, neither overbought nor oversold. An RSI below 30 is considered oversold, while above 70 is considered overbought.

Analysis for Tata Steel - April 07, 2025

Tata Steel, operating in the Basic Materials sector and Steel industry in India, experienced a decline with a close at 129.48, significantly down by approximately 7.77% compared to the previous close. The stock's performance indicates bearish momentum, with the RSI indicating oversold conditions at 26.19 and moving averages showing a downward trend under key EMA values.
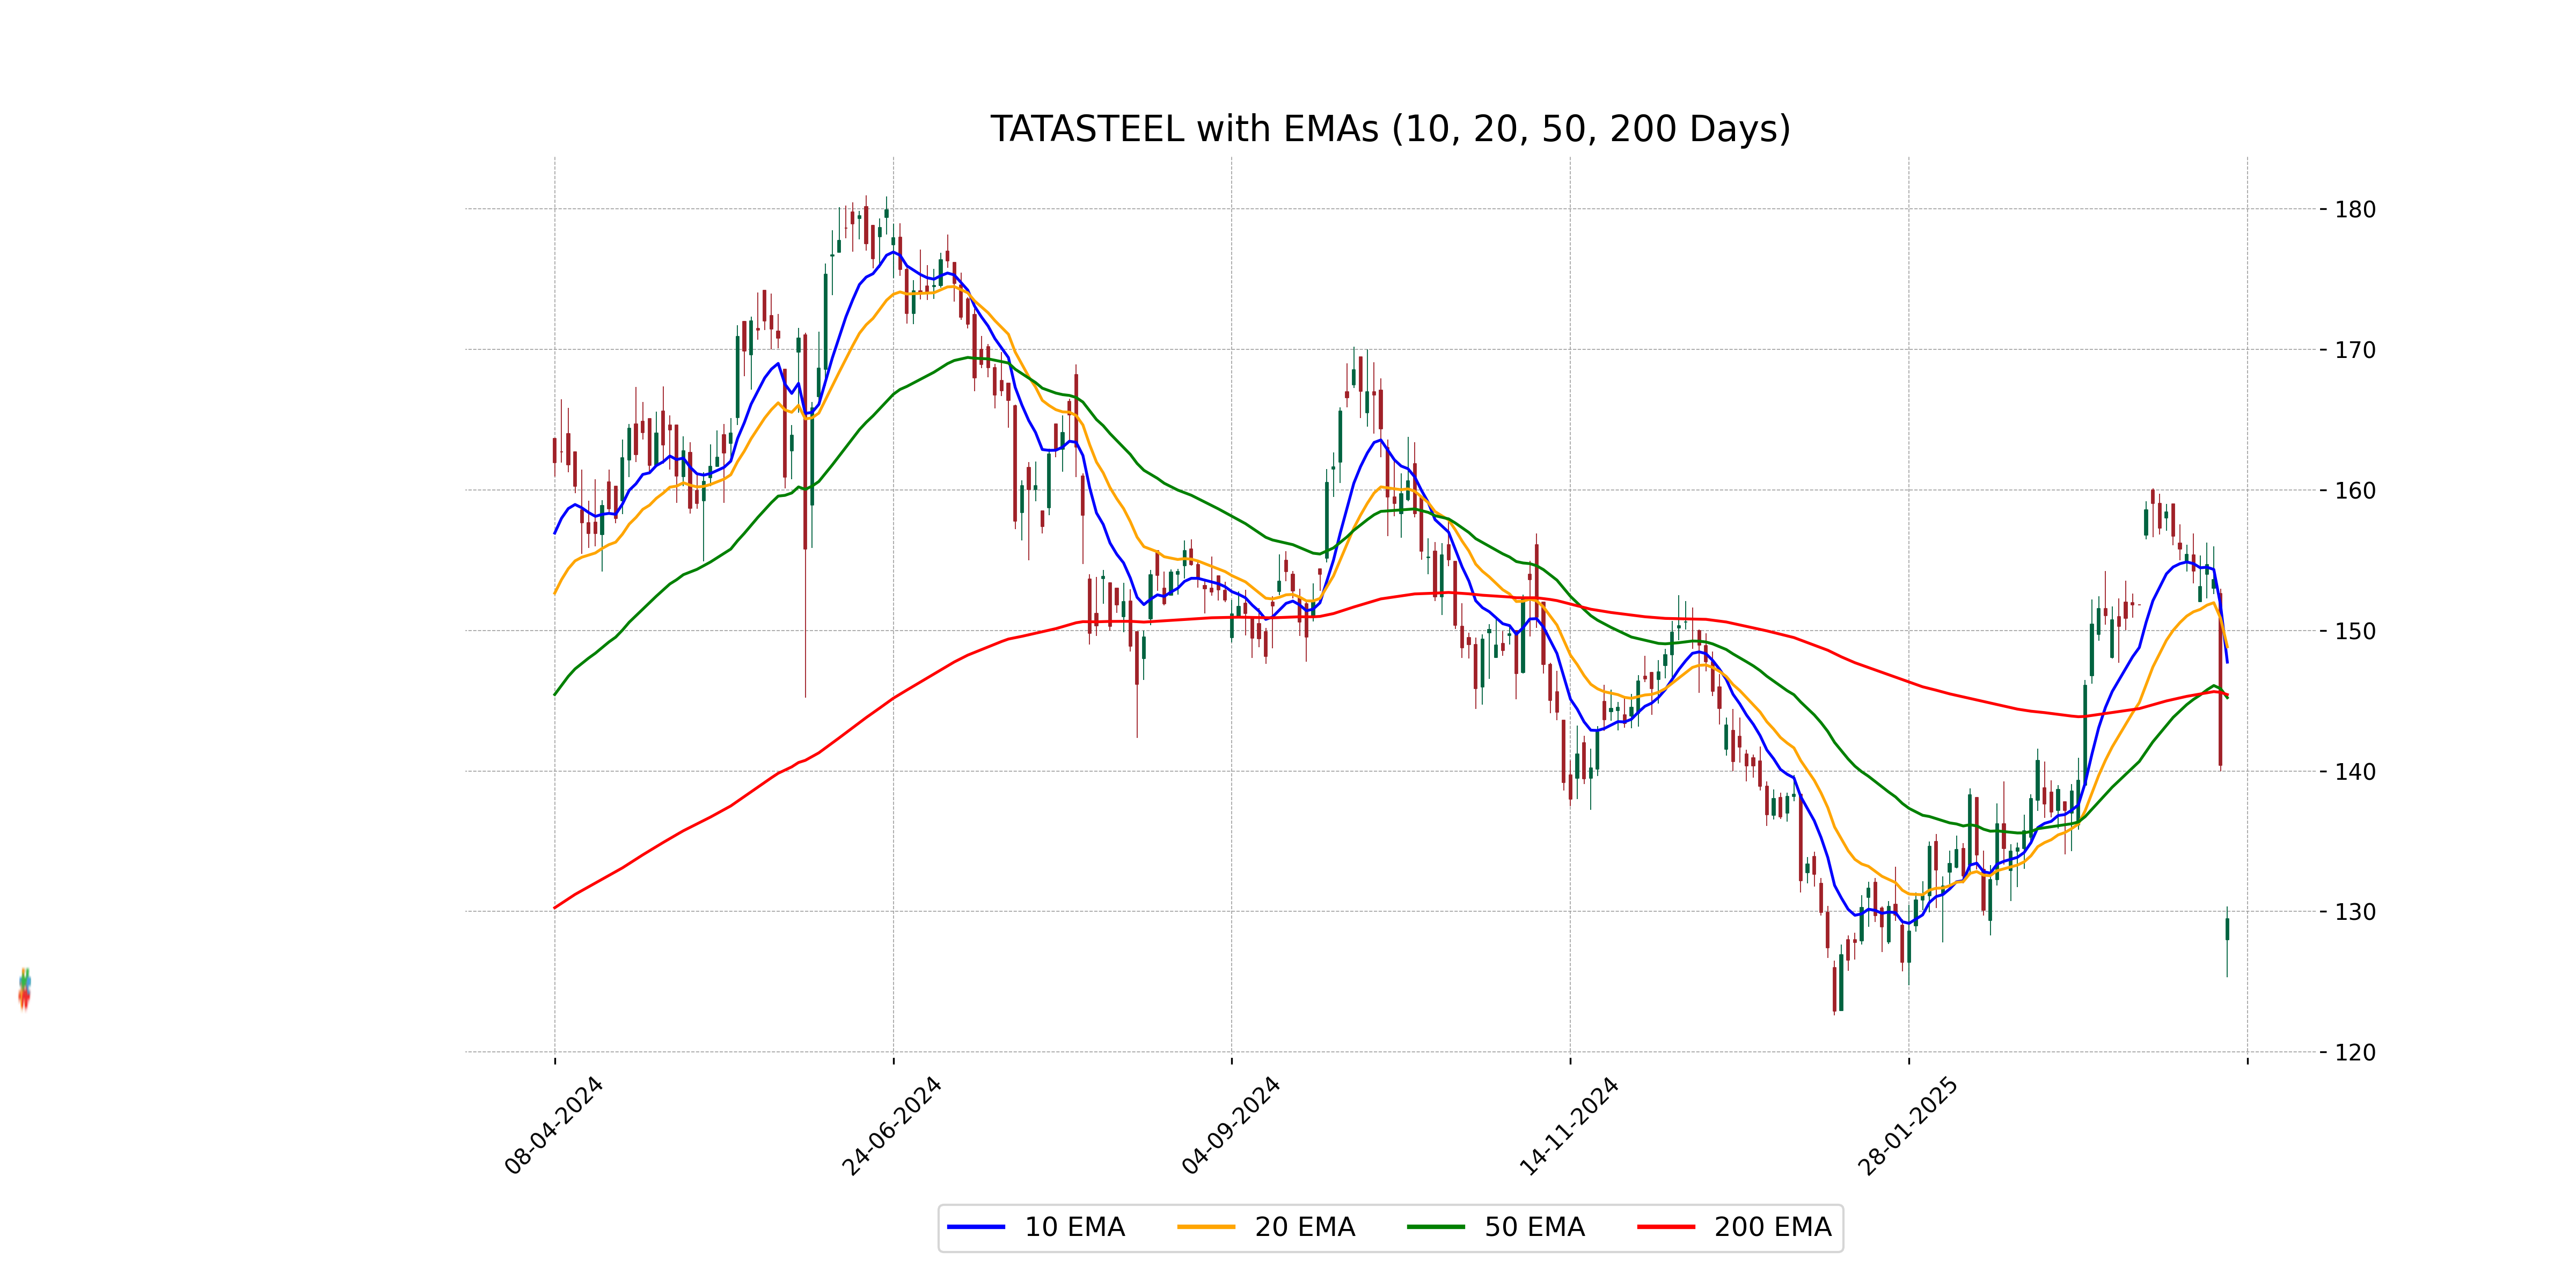
Relationship with Key Moving Averages
Tata Steel's current stock price is significantly below its key moving averages, with the 50 EMA at 145.22, the 200 EMA at 145.44, and the 10 EMA at 147.75. This indicates a bearish momentum as the stock closes at 129.48, highlighting potential pressure against upward movement.
Moving Averages Trend (MACD)
Tata Steel's MACD reading is 0.3614, which is below the MACD Signal of 3.3127, indicating a bearish trend. The stock price reflects a negative percentage change, and the RSI of 26.19 suggests the stock is in oversold territory, reinforcing the bearish outlook.

RSI Analysis
RSI Analysis for Tata Steel: The Relative Strength Index (RSI) value for Tata Steel is 26.19, indicating that the stock is in the oversold territory. An RSI below 30 often suggests that the stock might be undervalued, potentially signaling a buying opportunity, though further analysis is recommended before making any investment decisions.

Analysis for Trent - April 07, 2025

Trent has seen a notable decrease in its market performance, with a closing price of 4740.95, representing a significant drop of 14.77% from the previous close. The stock's RSI is at 36.31, indicating it may be approaching oversold territory, while its MACD suggests potential future movements. With a high P/E ratio of 86.958, this means investors are paying highly for future earnings, possibly reflecting growth expectations in the Apparel Retail industry in India.

Relationship with Key Moving Averages
The current close of Trent at 4740.95 is below its 50 EMA of 5428.42, 200 EMA of 5738.98, 10 EMA of 5316.90, and 20 EMA of 5274.21, indicating a bearish trend relative to these key moving averages. This suggests potential downward momentum in the short to medium term.
Moving Averages Trend (MACD)
Trent's MACD analysis shows a positive MACD of 32.19, which is higher than the MACD Signal of 20.93. This implies a bullish momentum divergence, potentially indicating a buy signal or positive trend strength, although traders should be cautious given the overall market conditions.

RSI Analysis
RSI Analysis for Trent: The current RSI for Trent is 36.31, which indicates that the stock is nearing the oversold territory. This may suggest potential for a reversal or buying opportunity, but further technical analysis and market conditions should be considered for investment decisions.

Up Next
NSE Nifty 50: Top 5 stock losers of April 7, 2025

New Zealand commits USD 20 bn investment in India under FTA in 15 yrs; on lines of EFTA pact

India, New Zealand conclude FTA talks; pact to offer duty-free access, USD 20 bn FDI

FTA with New Zealand to significantly deepen bilateral economic engagement: Govt

Rupee breaches 91-mark against US dollar for first time in intra-day trade

Microsoft commits USD 17.5 billion investment in India: CEO Satya Nadella

More videos

CBI books Anil Ambani's son, Reliance Home Finance Ltd. in Rs 228 crore bank fraud case

RBI raises FY26 GDP growth projection to 7.3 pc

RBI trims policy interest rate by 25bps to 5.25pc, loans to get cheaper

Rupee slumps to all-time low of 90.25 against US dollar in intra-day trade

Reliance completes merger of Star Television Productions with Jiostar

India to lead emerging market growth with 7pc GDP rise in 2025: Moody’s

Nifty hits record high after 14 months; Sensex nears all-time peak

Reliance stops Russian oil use at its only-for-export refinery to comply with EU sanctions

ED attaches fresh assets worth over Rs 1,400 cr in case against Anil Ambani's Reliance Group

India signs one-year deal to import 2.2 million tonnes of LPG from US