


Highlights
Latest news

Vijay Hazare trophy: Rohit Sharma smashes 155, enthralls 20,000 fans in Jaipur

India to get three new airlines as Shankh Air, Al Hind Air, FlyExpress receive NOC from government

Delhi HC directs GST Council to meet at earliest, consider lowering GST on air purifiers

Cabinet clears Delhi Metro Phase 5A project worth Rs 12,015 crore

Got apology from Bumrah & Pant; Conrad should've chosen better words: Bavuma reflects on India tour

Virat Kohli goes past Tendulkar to become fastest to 16000 List A runs

Delhi HC expresses displeasure over no tax exemption on air purifiers in 'emergency situation'
-MNS alliance, compares hype to Russia-Ukraine peace talks")
Fadnavis mocks Sena (UBT)-MNS alliance, compares hype to Russia-Ukraine peace talks
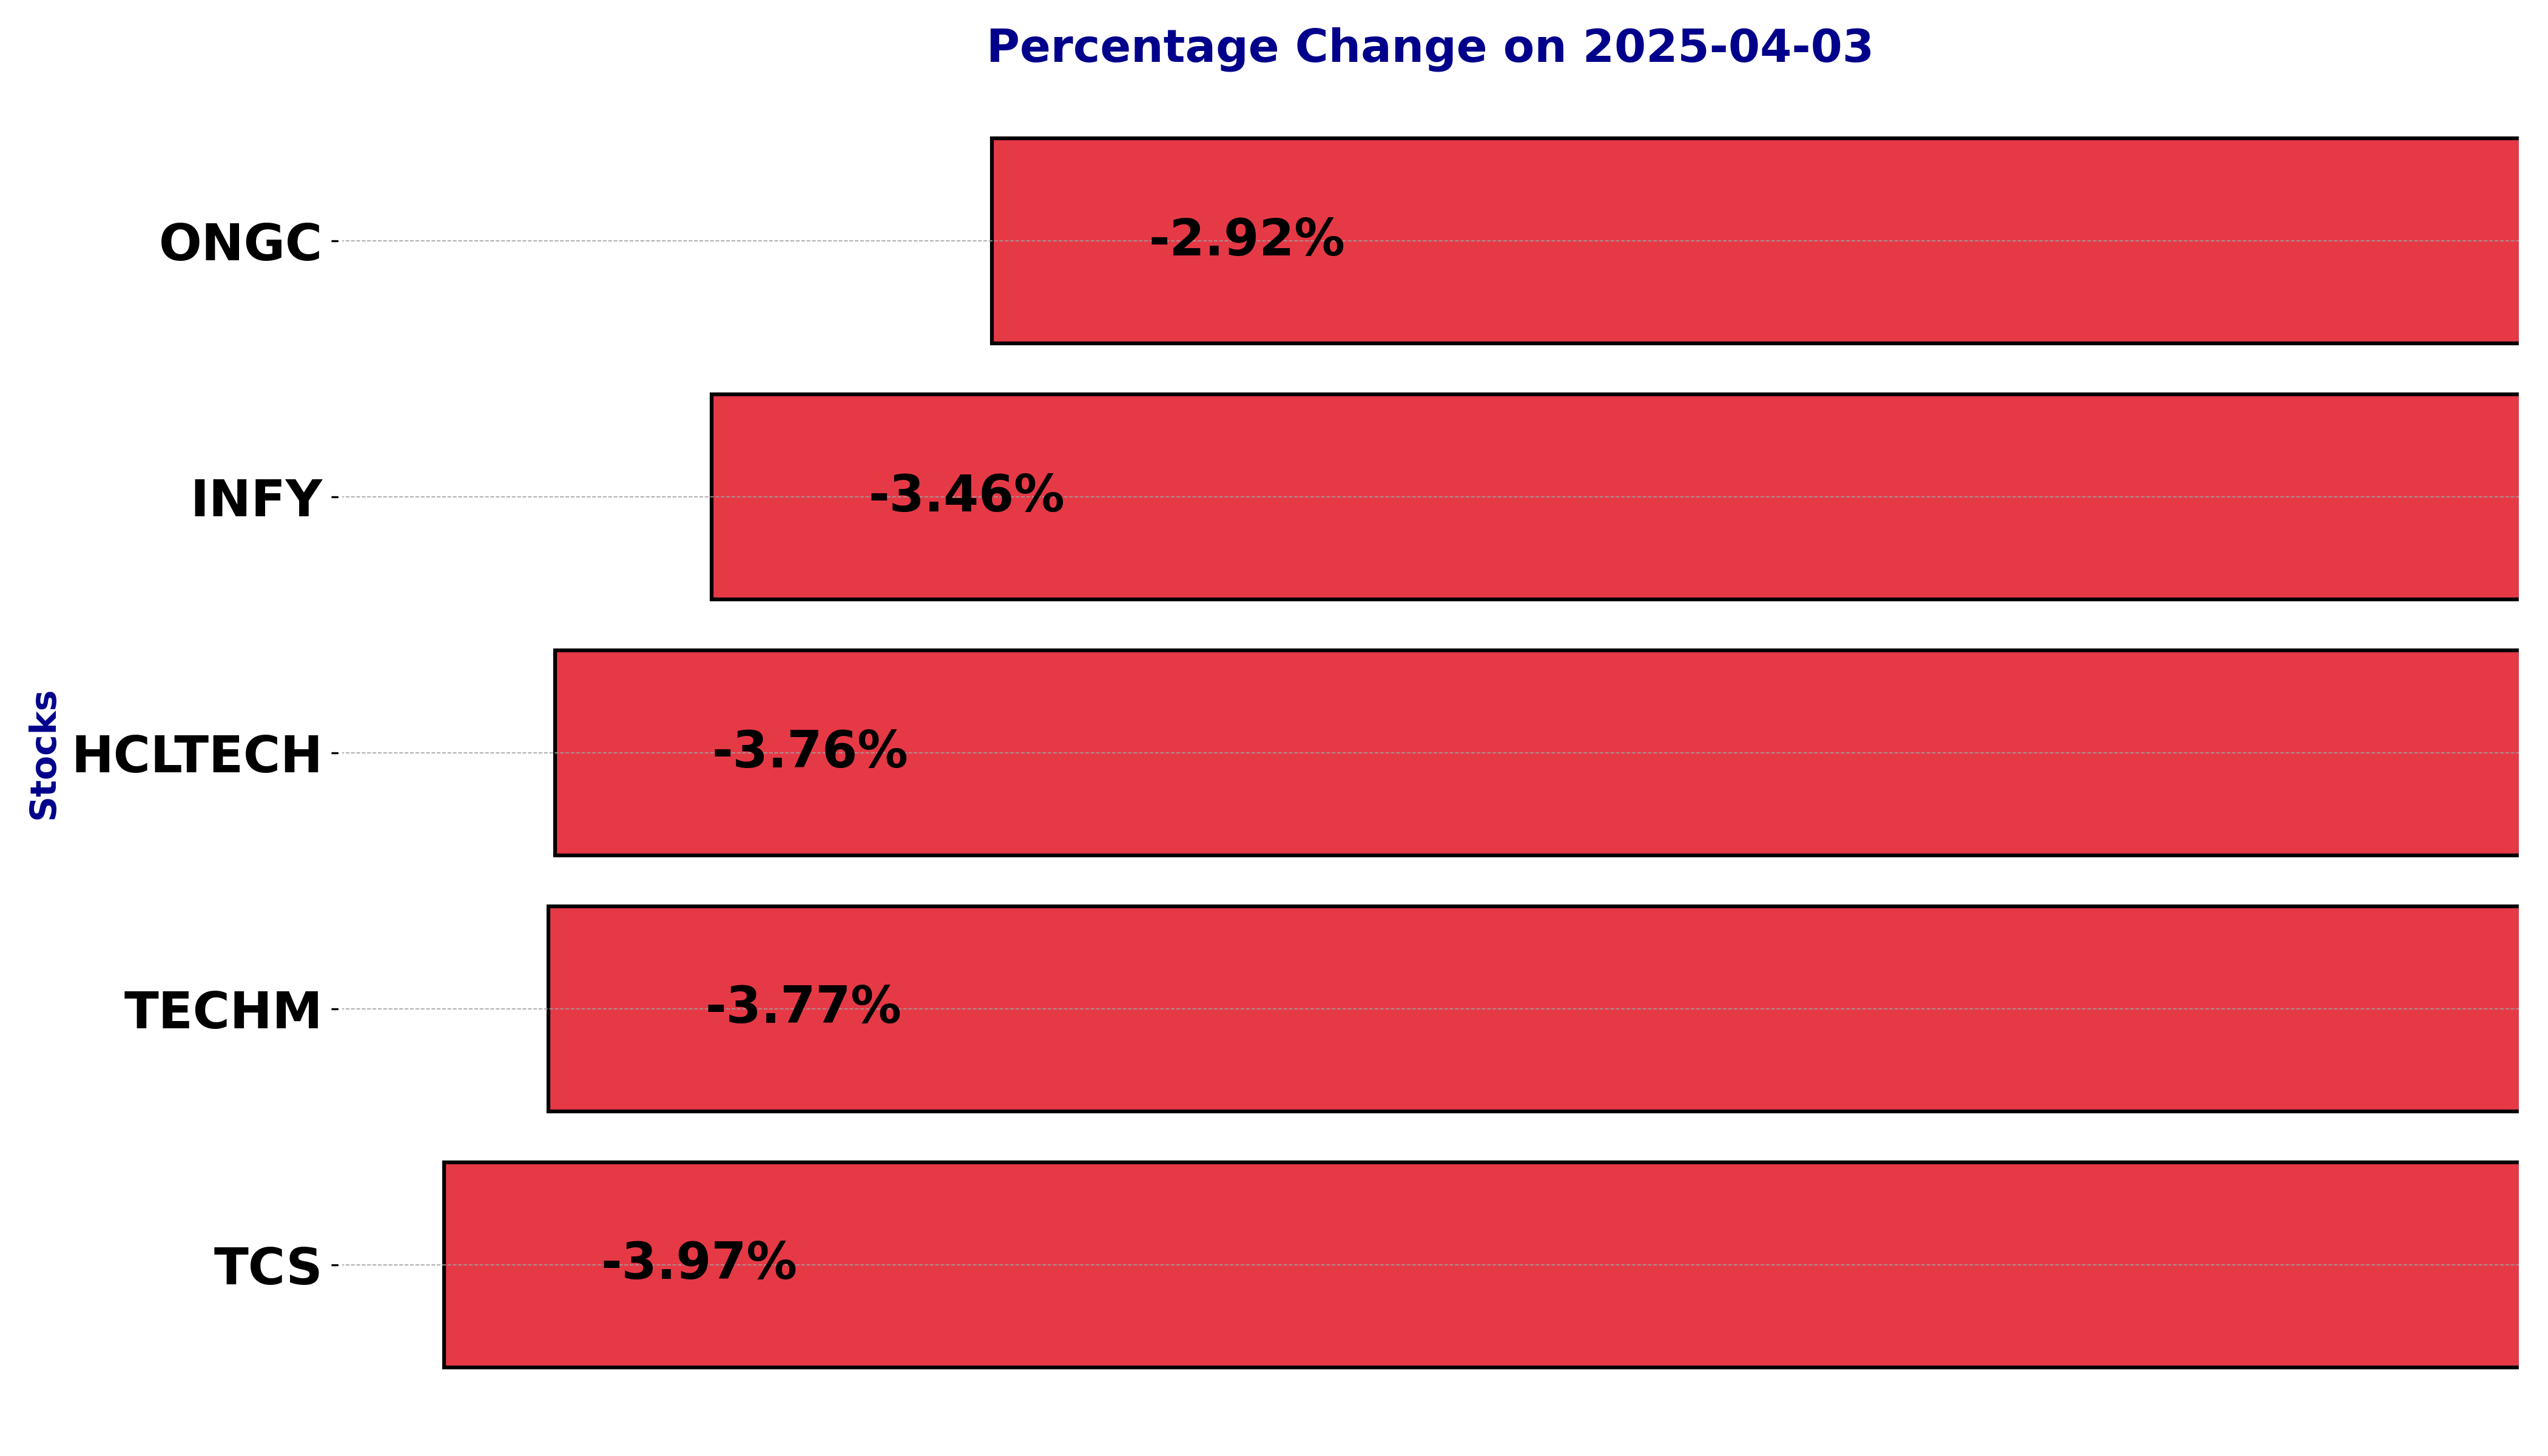
NSE Nifty 50 Top losers: What are the 5 Biggest Stock losers Today April 03, 2025


In this article, we will explore the technical indicators of some of the low-performing stocks on the Indian stock market, including HCLTECH, INFY, ONGC, TCS, and TECHM.
By looking at these stocks through the lens of key technical factors, we aim to better understand their price movements, trends, and potential future performance.
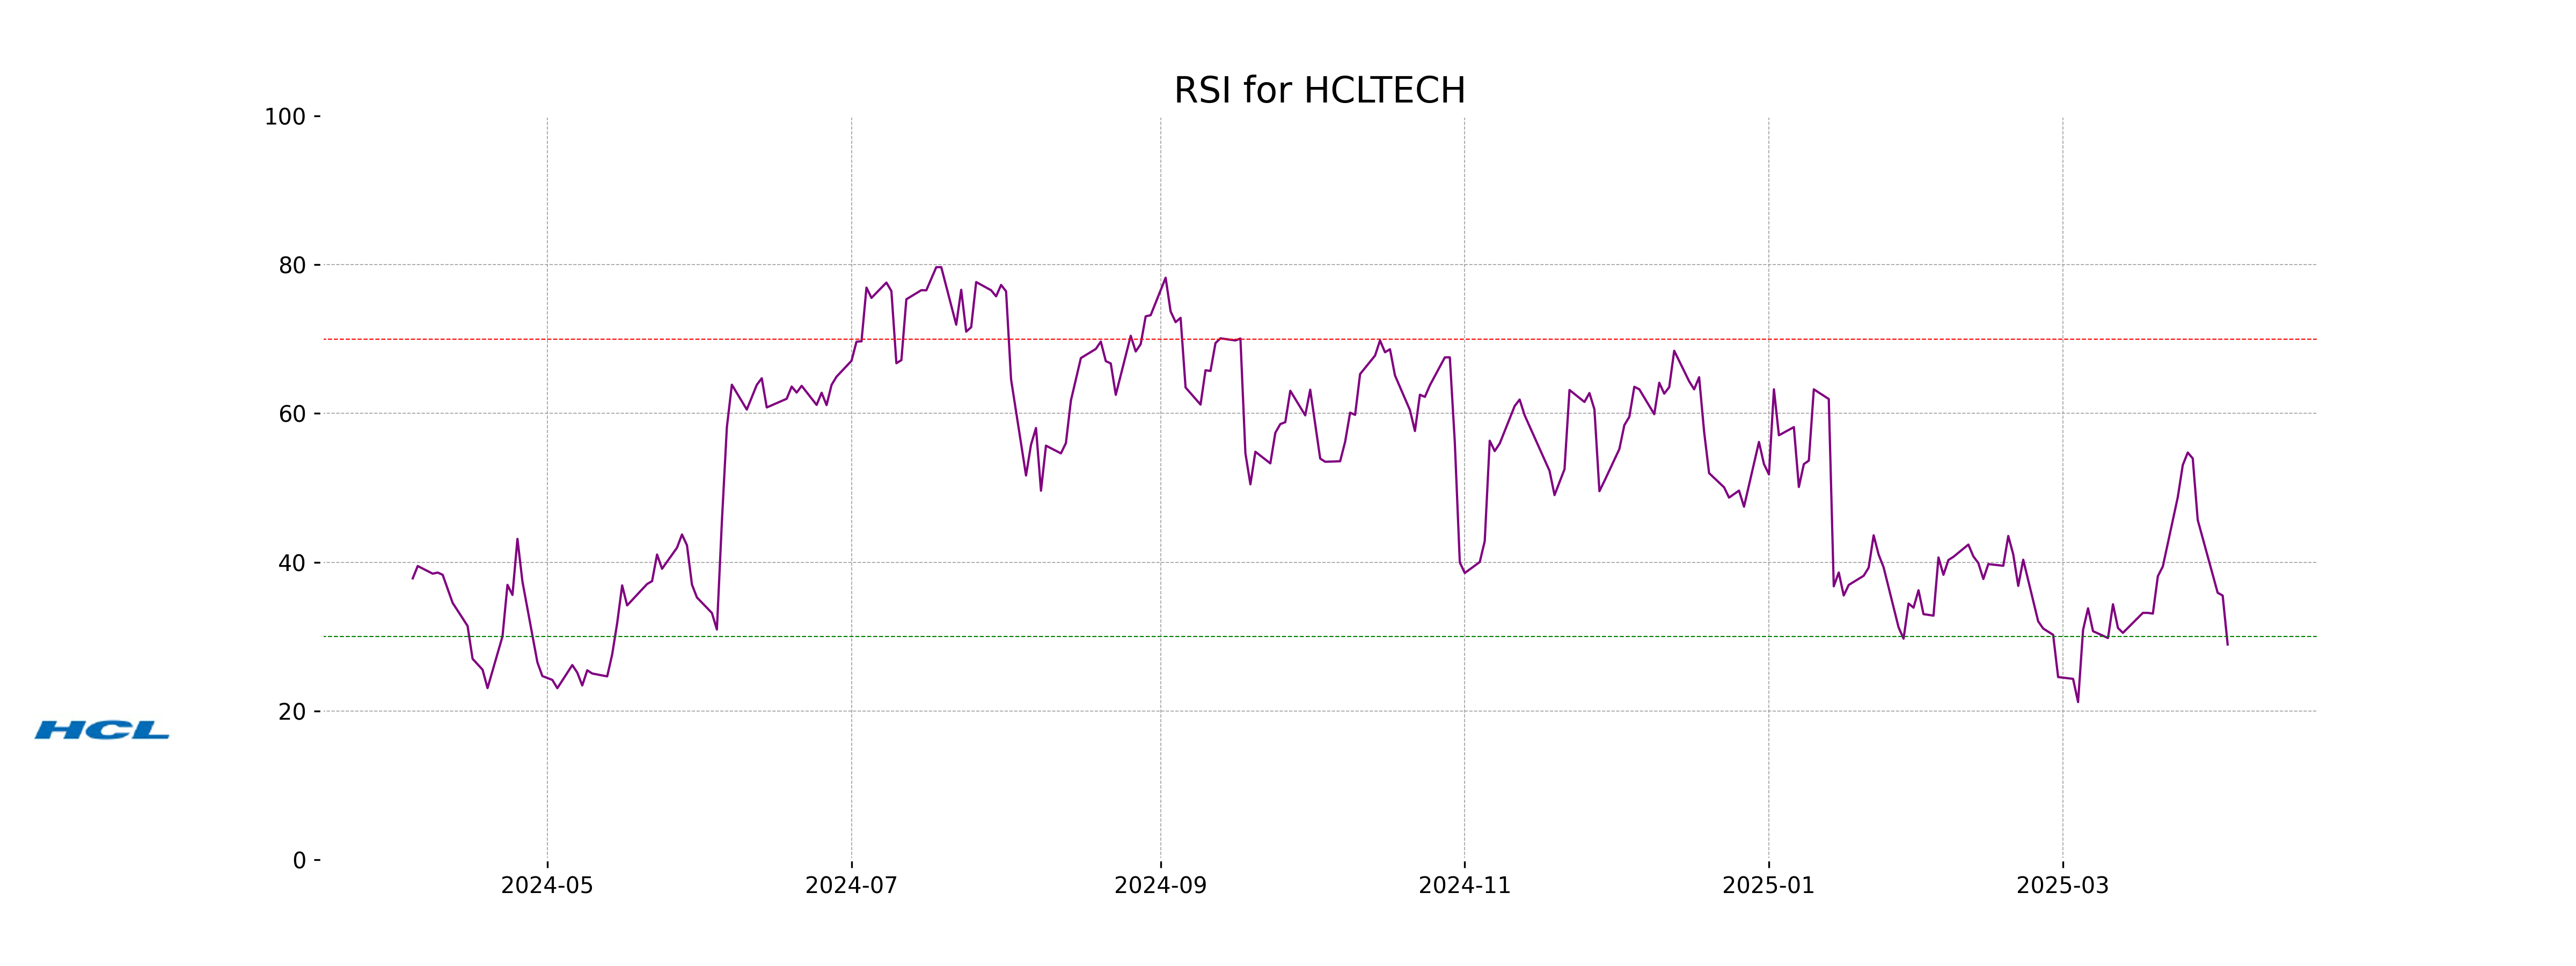
Analysis for HCL Technologies - April 03, 2025
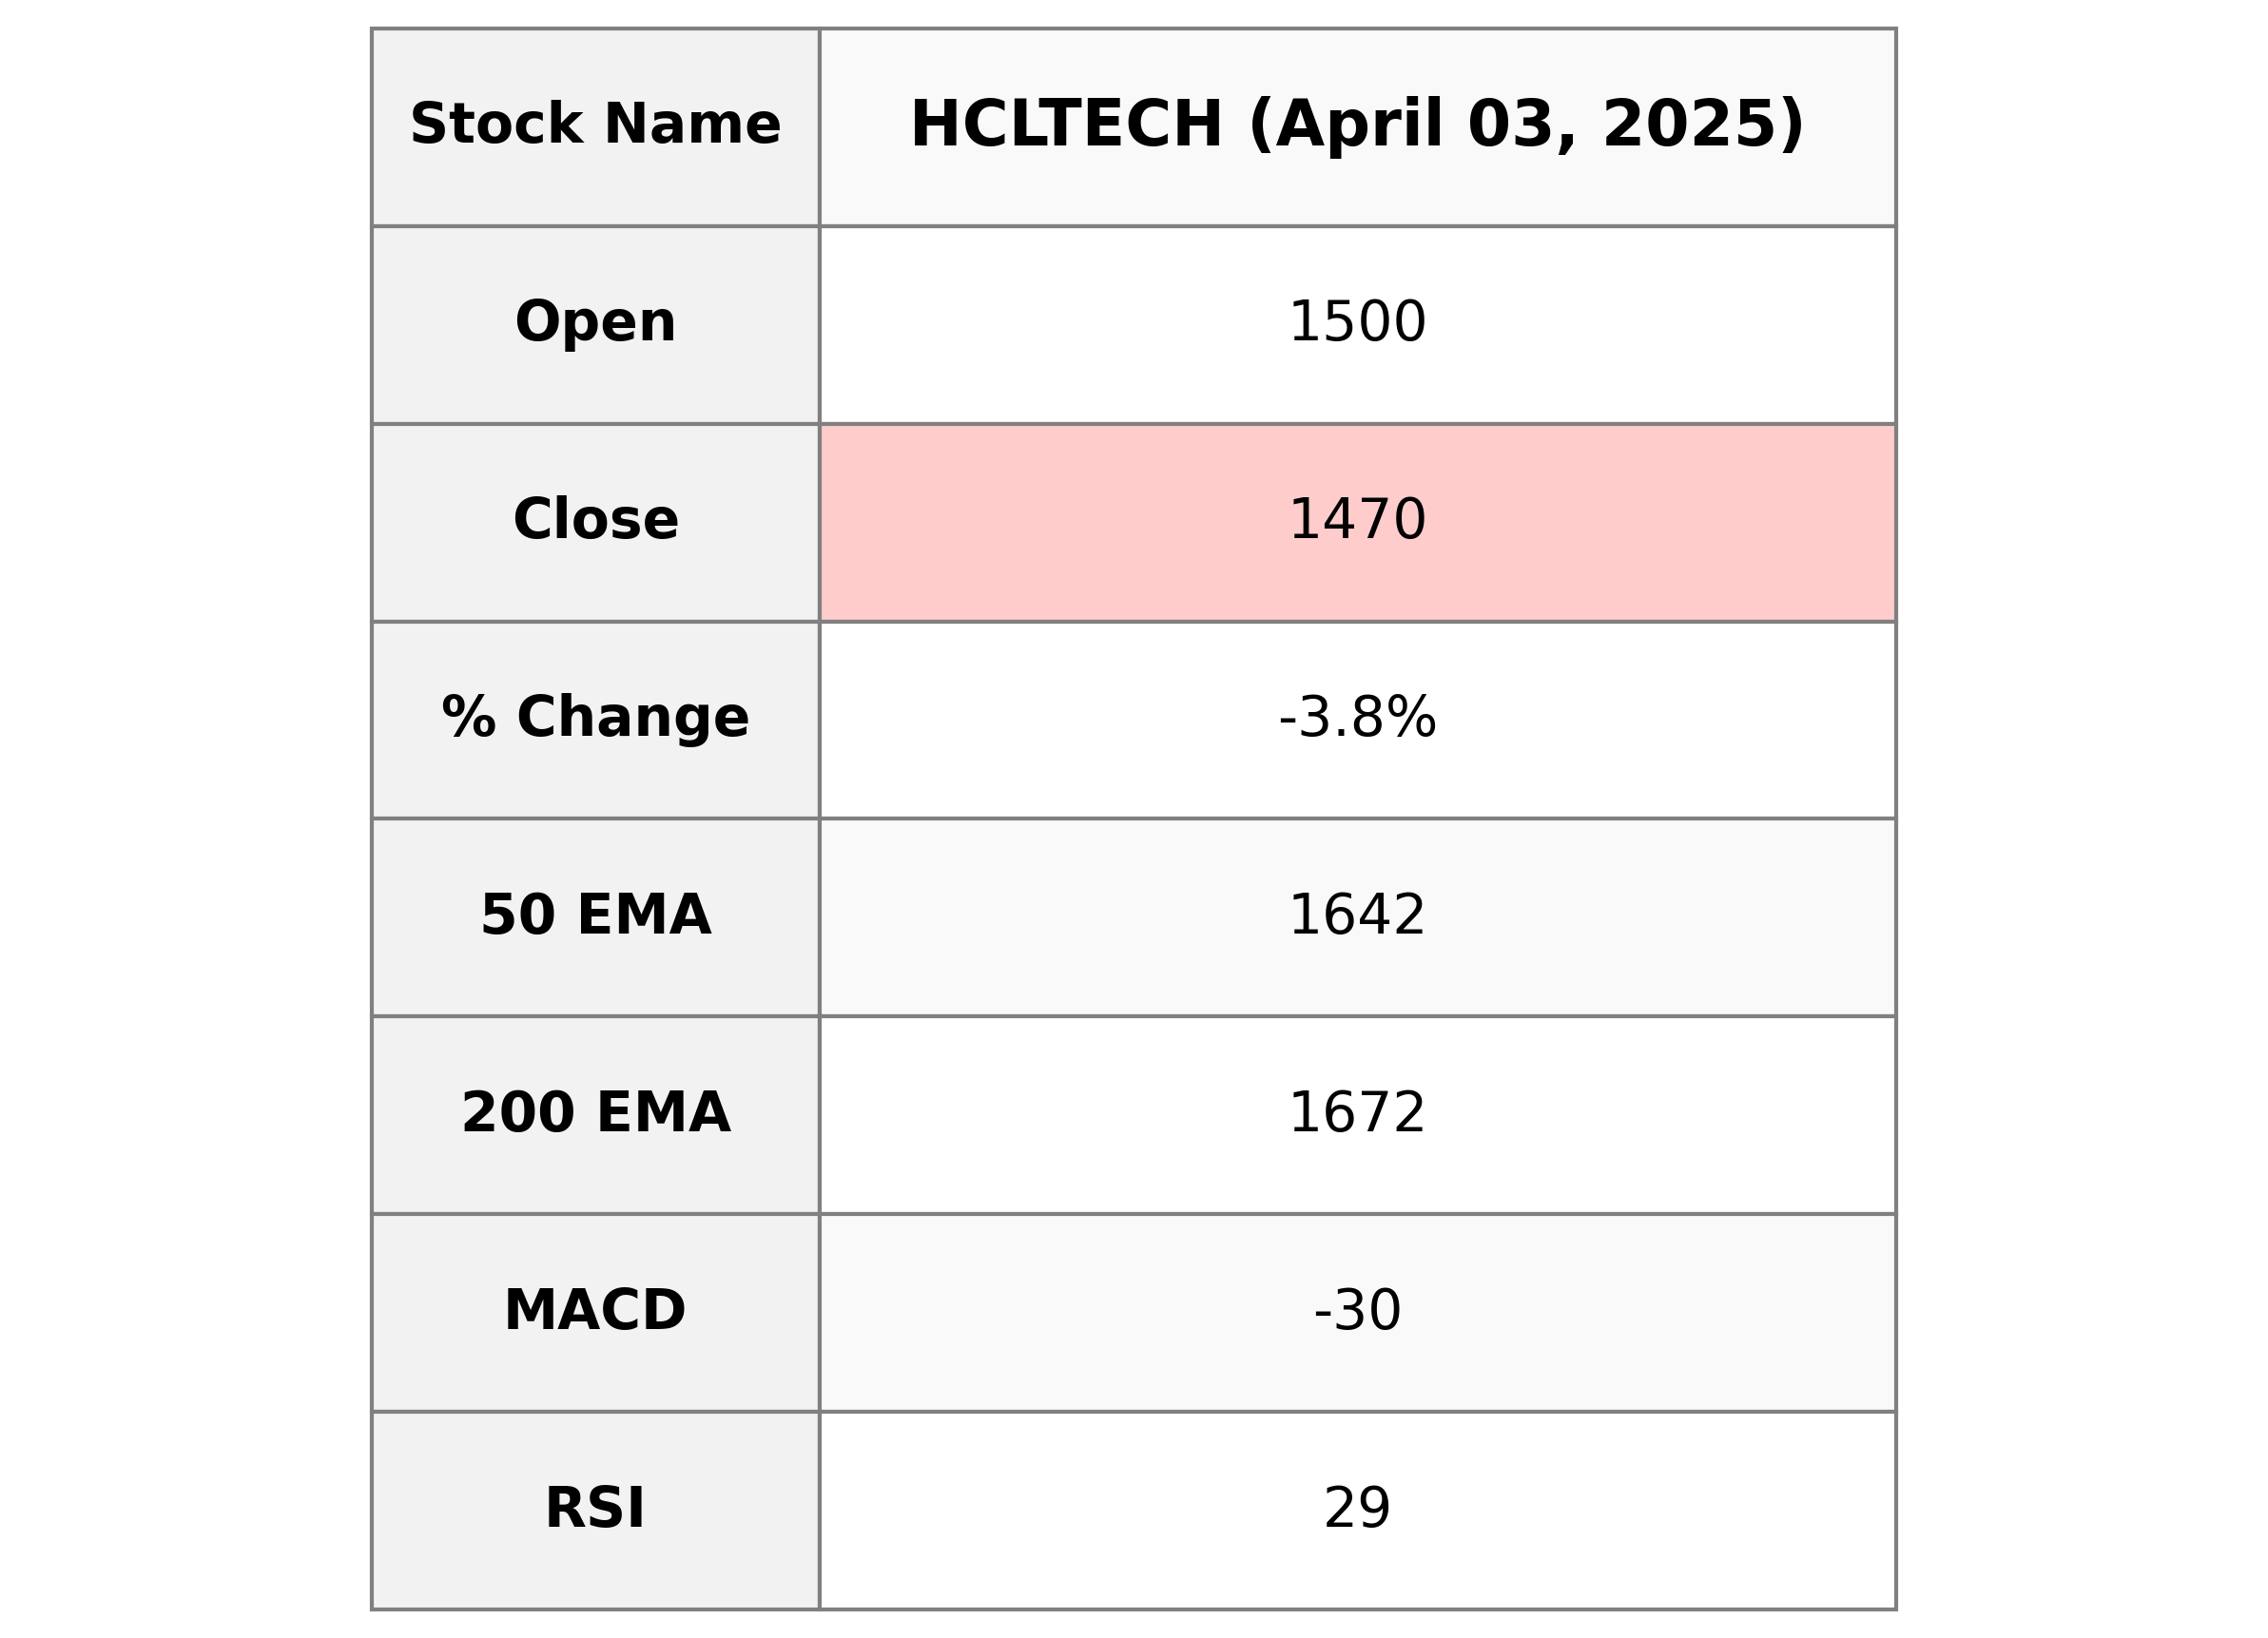
HCL Technologies, operating in the Technology sector, faced a decrease in its stock price on the recent trading day, with a closing price of 1,470.10 compared to the previous close of 1,527.55, resulting in a %-Change of -3.76%. The company's current market conditions indicate a downtrend as the RSI is at 28.94, suggesting it is in the oversold territory. The company's PE Ratio stands at 23.36 with an EPS of 62.94, reflecting its earnings performance relative to its share price.
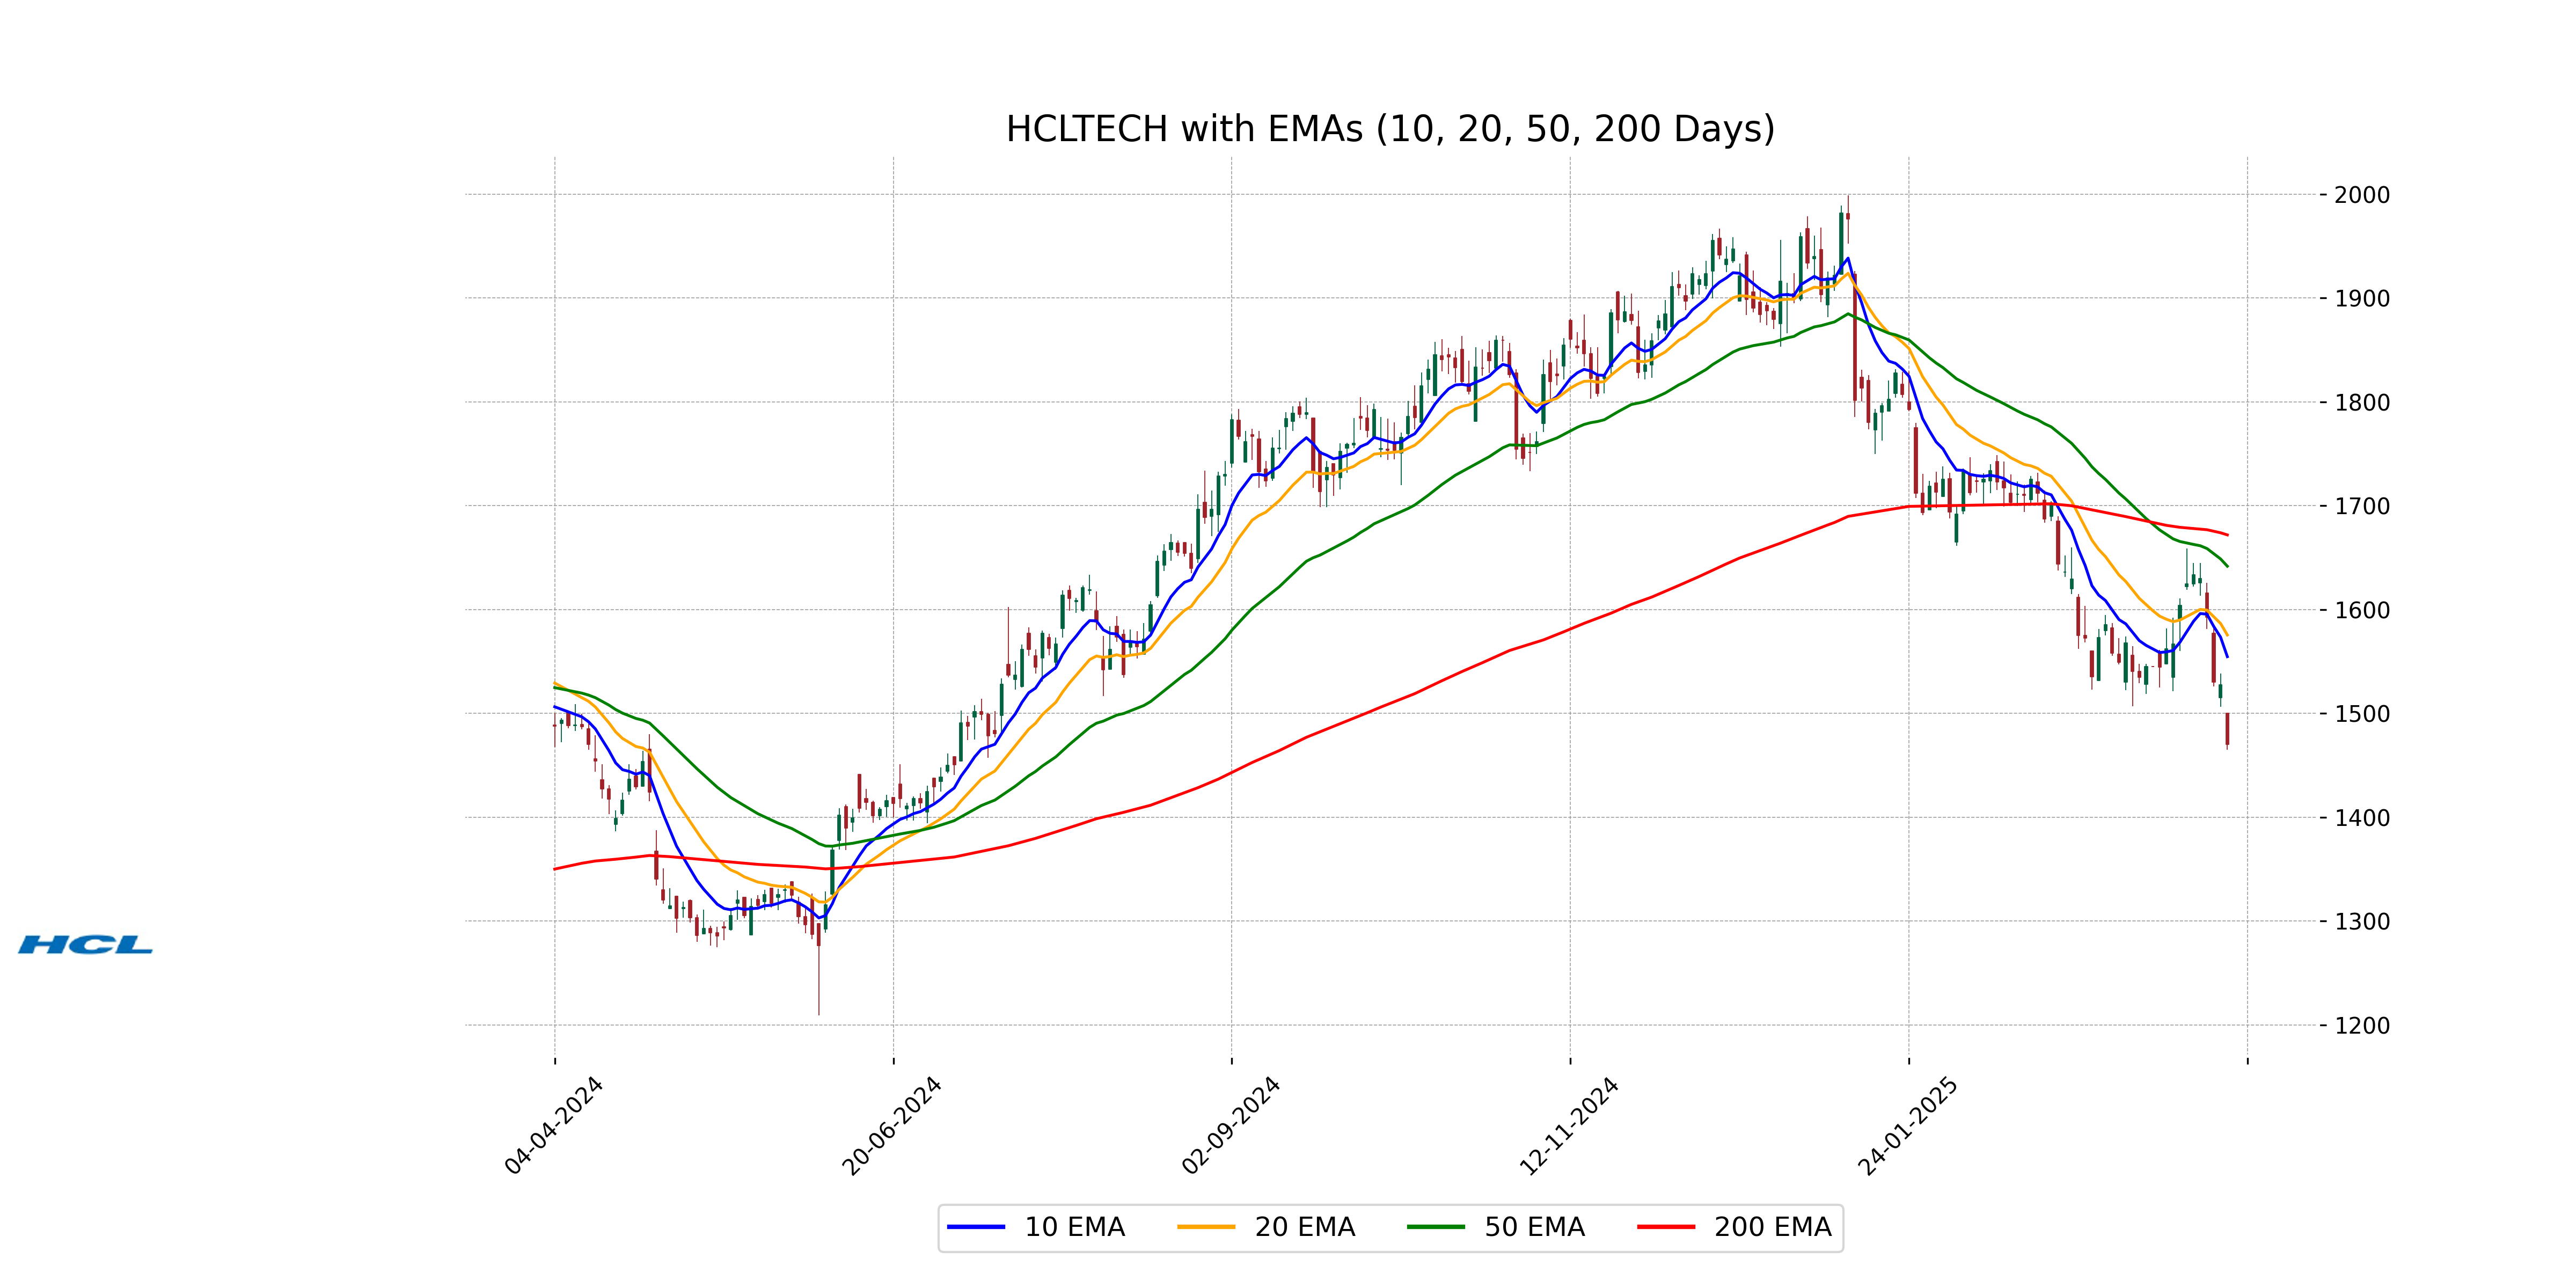
Relationship with Key Moving Averages
HCL Technologies' current closing price of 1470.10 is below its 50 EMA of 1641.81 and its 200 EMA of 1671.95, suggesting a bearish trend relative to these key moving averages. The 10 EMA of 1554.70 is also higher than the closing price, which further emphasizes the stock's short-term bearish momentum.
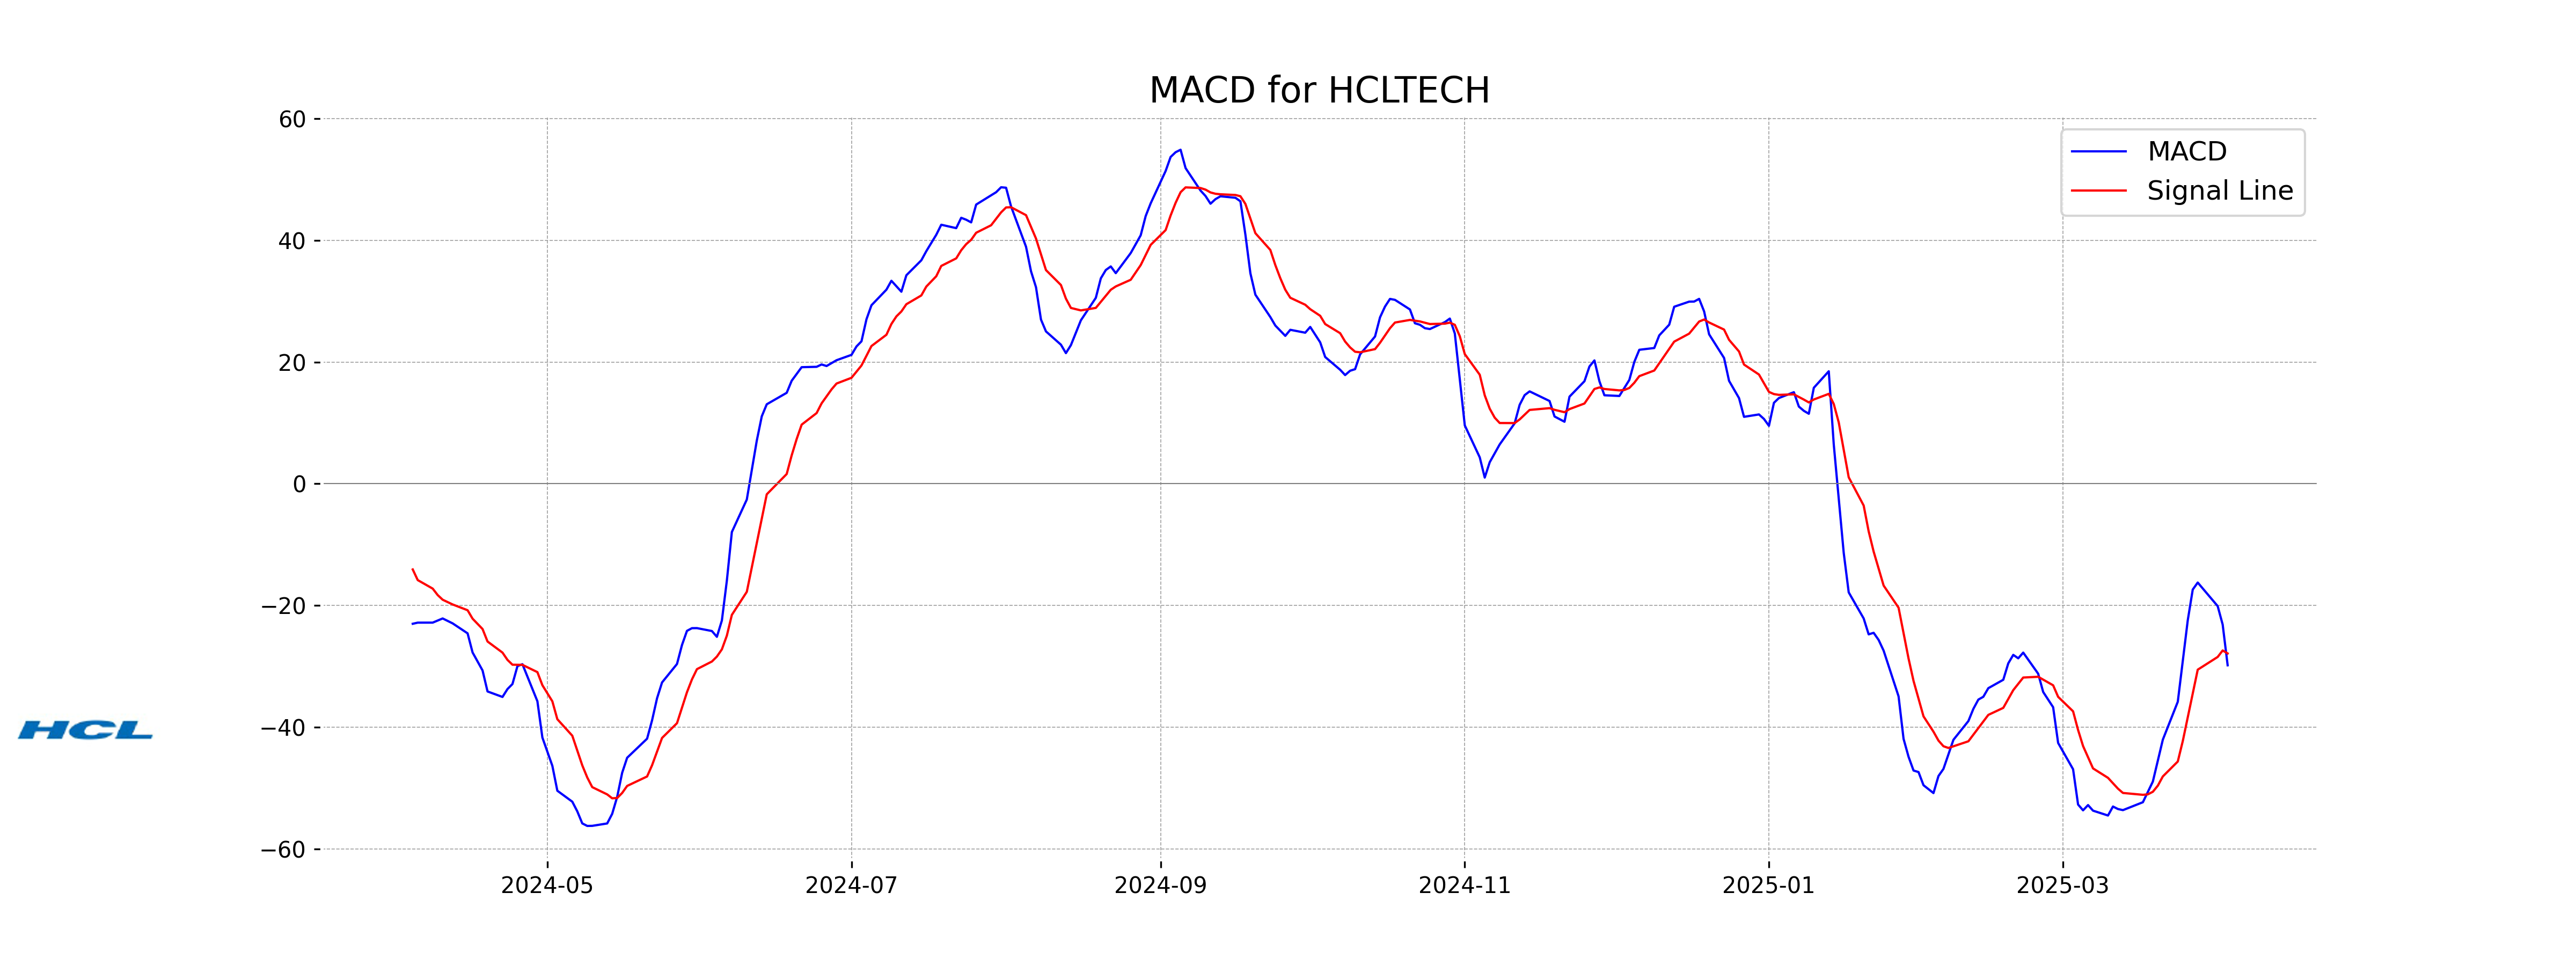
Moving Averages Trend (MACD)
Based on the MACD analysis for HCL Technologies, the MACD value of -29.82 is lower than the signal line value of -27.87, suggesting bearish momentum. With the RSI at 28.94, it indicates the stock may be in oversold territory, potentially hinting at a reversal or consolidation.
RSI Analysis
The RSI for HCL Technologies is 28.94, which is below the typical oversold threshold of 30. This indicates the stock might be oversold, suggesting potential for a price rebound or consolidation. However, other factors should also be considered before making investment decisions.
Analysis for Infosys - April 03, 2025
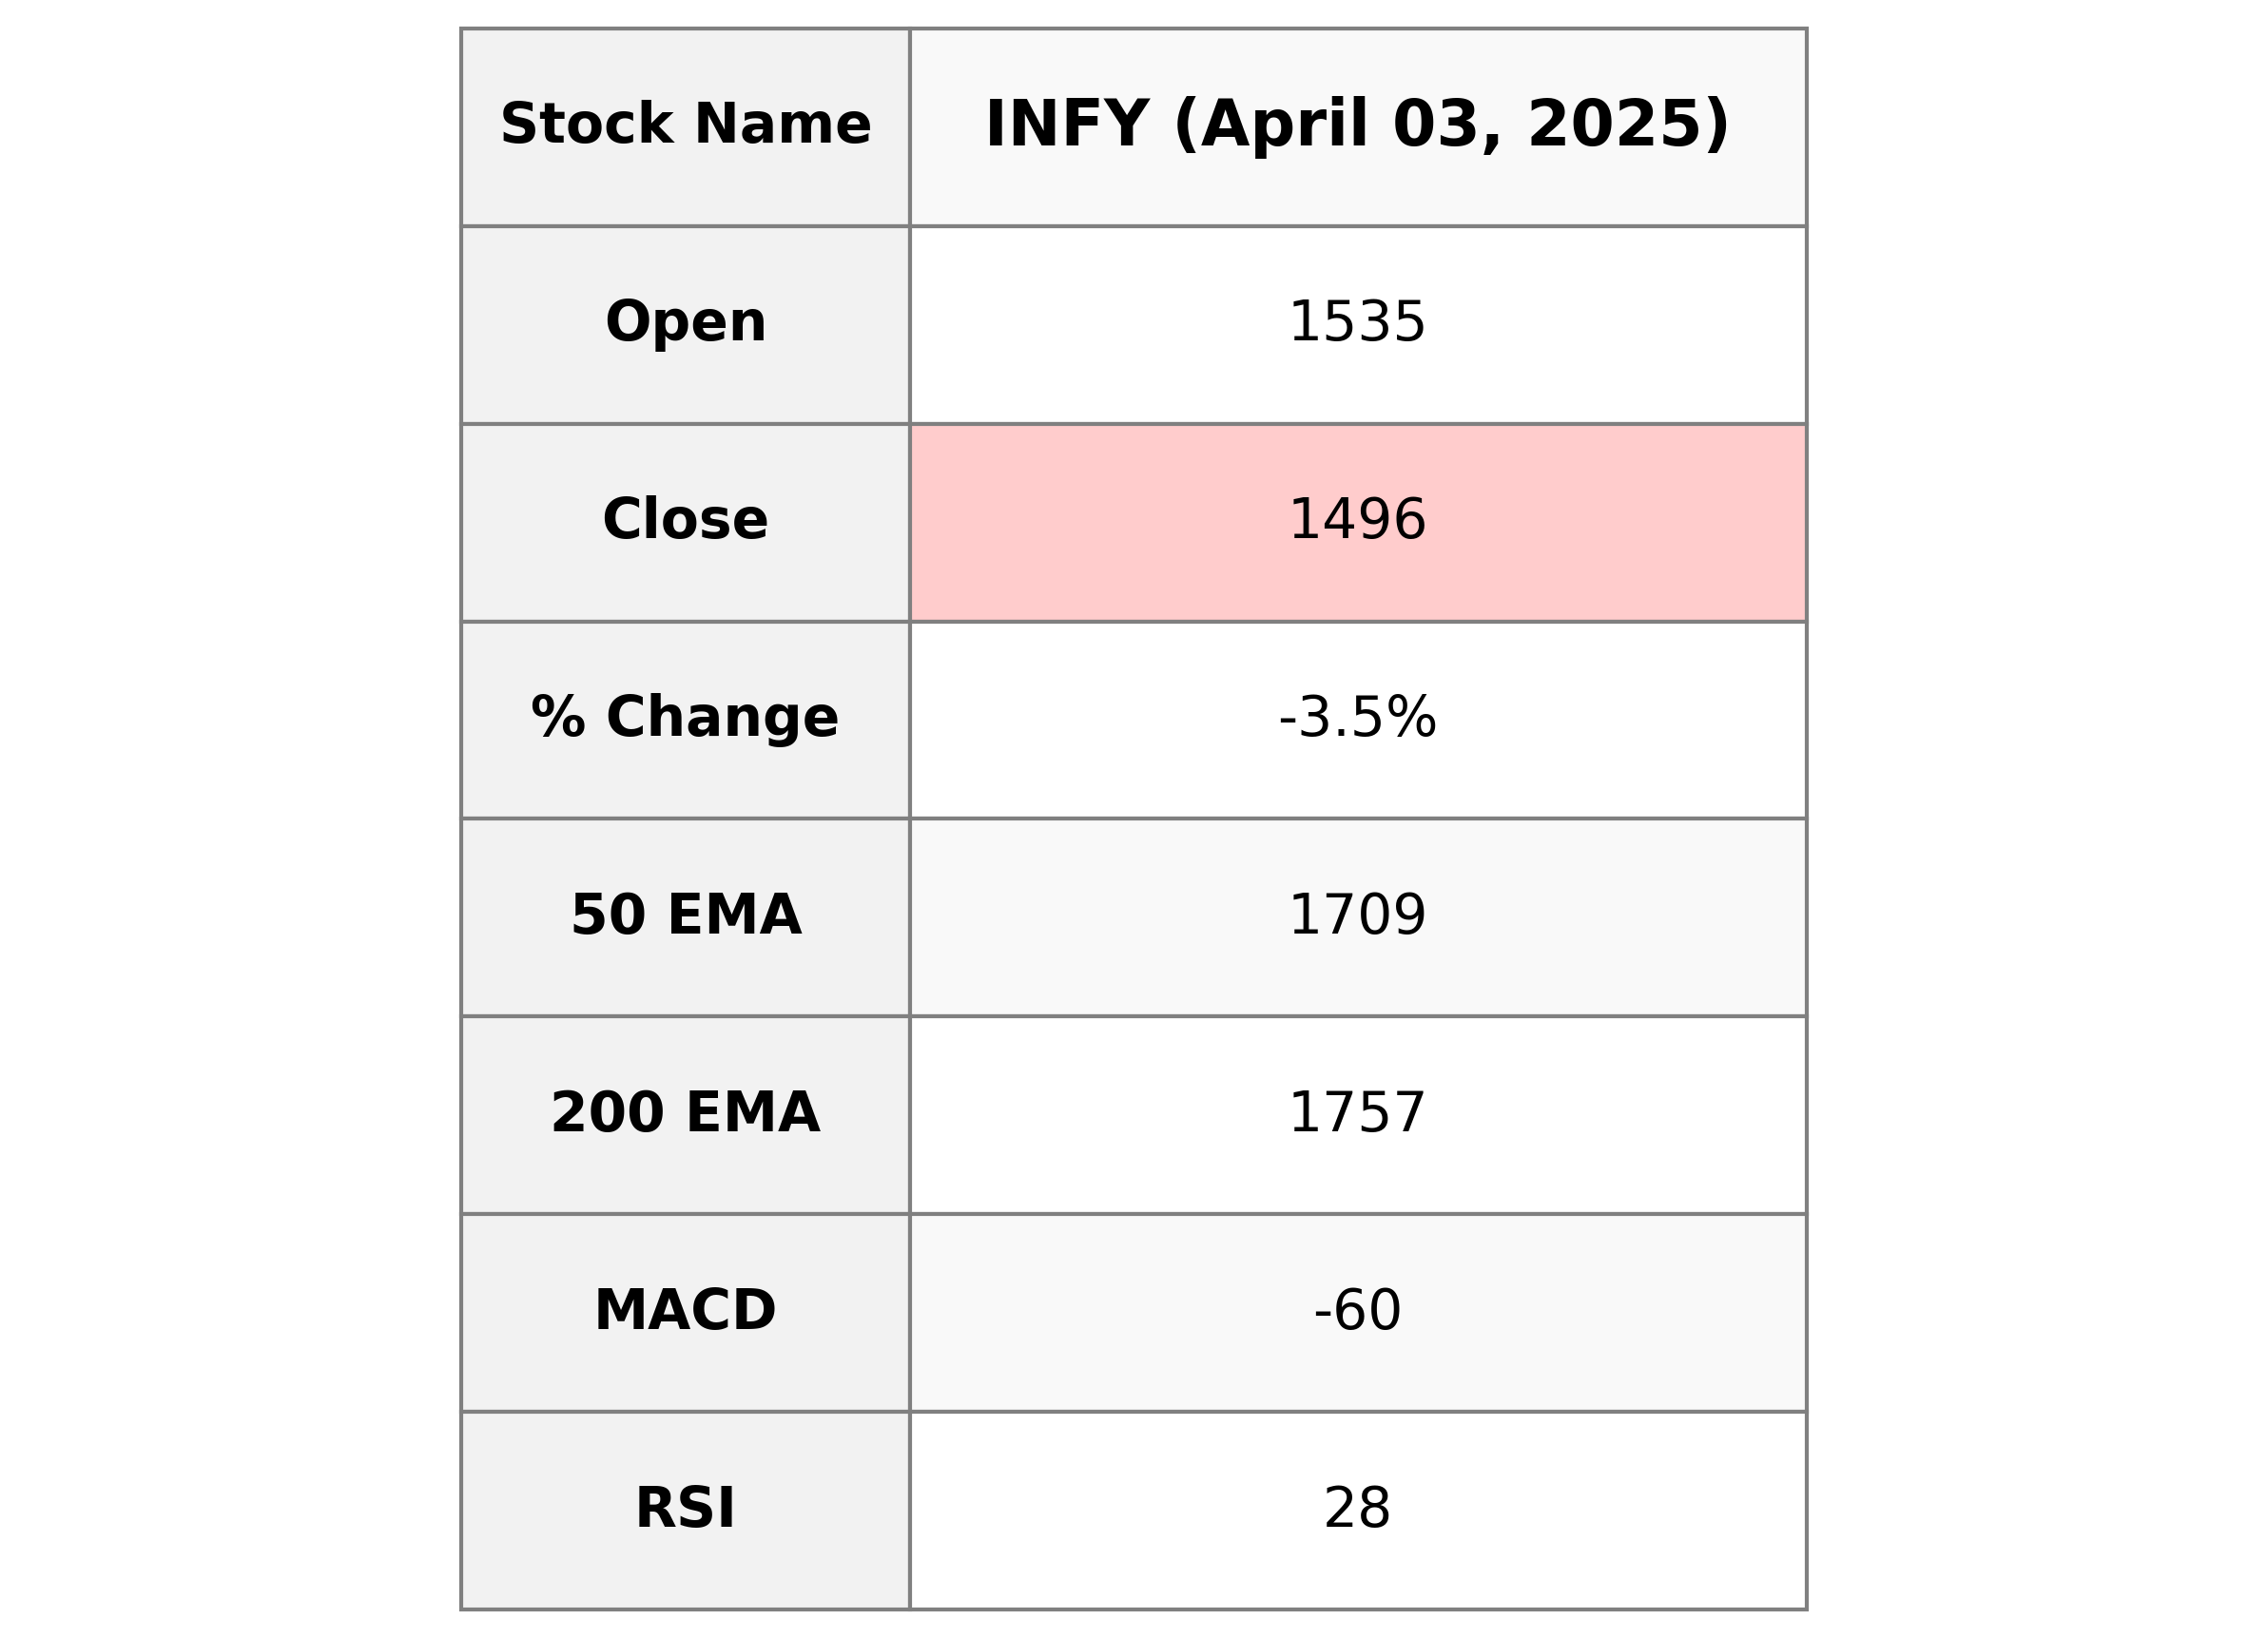
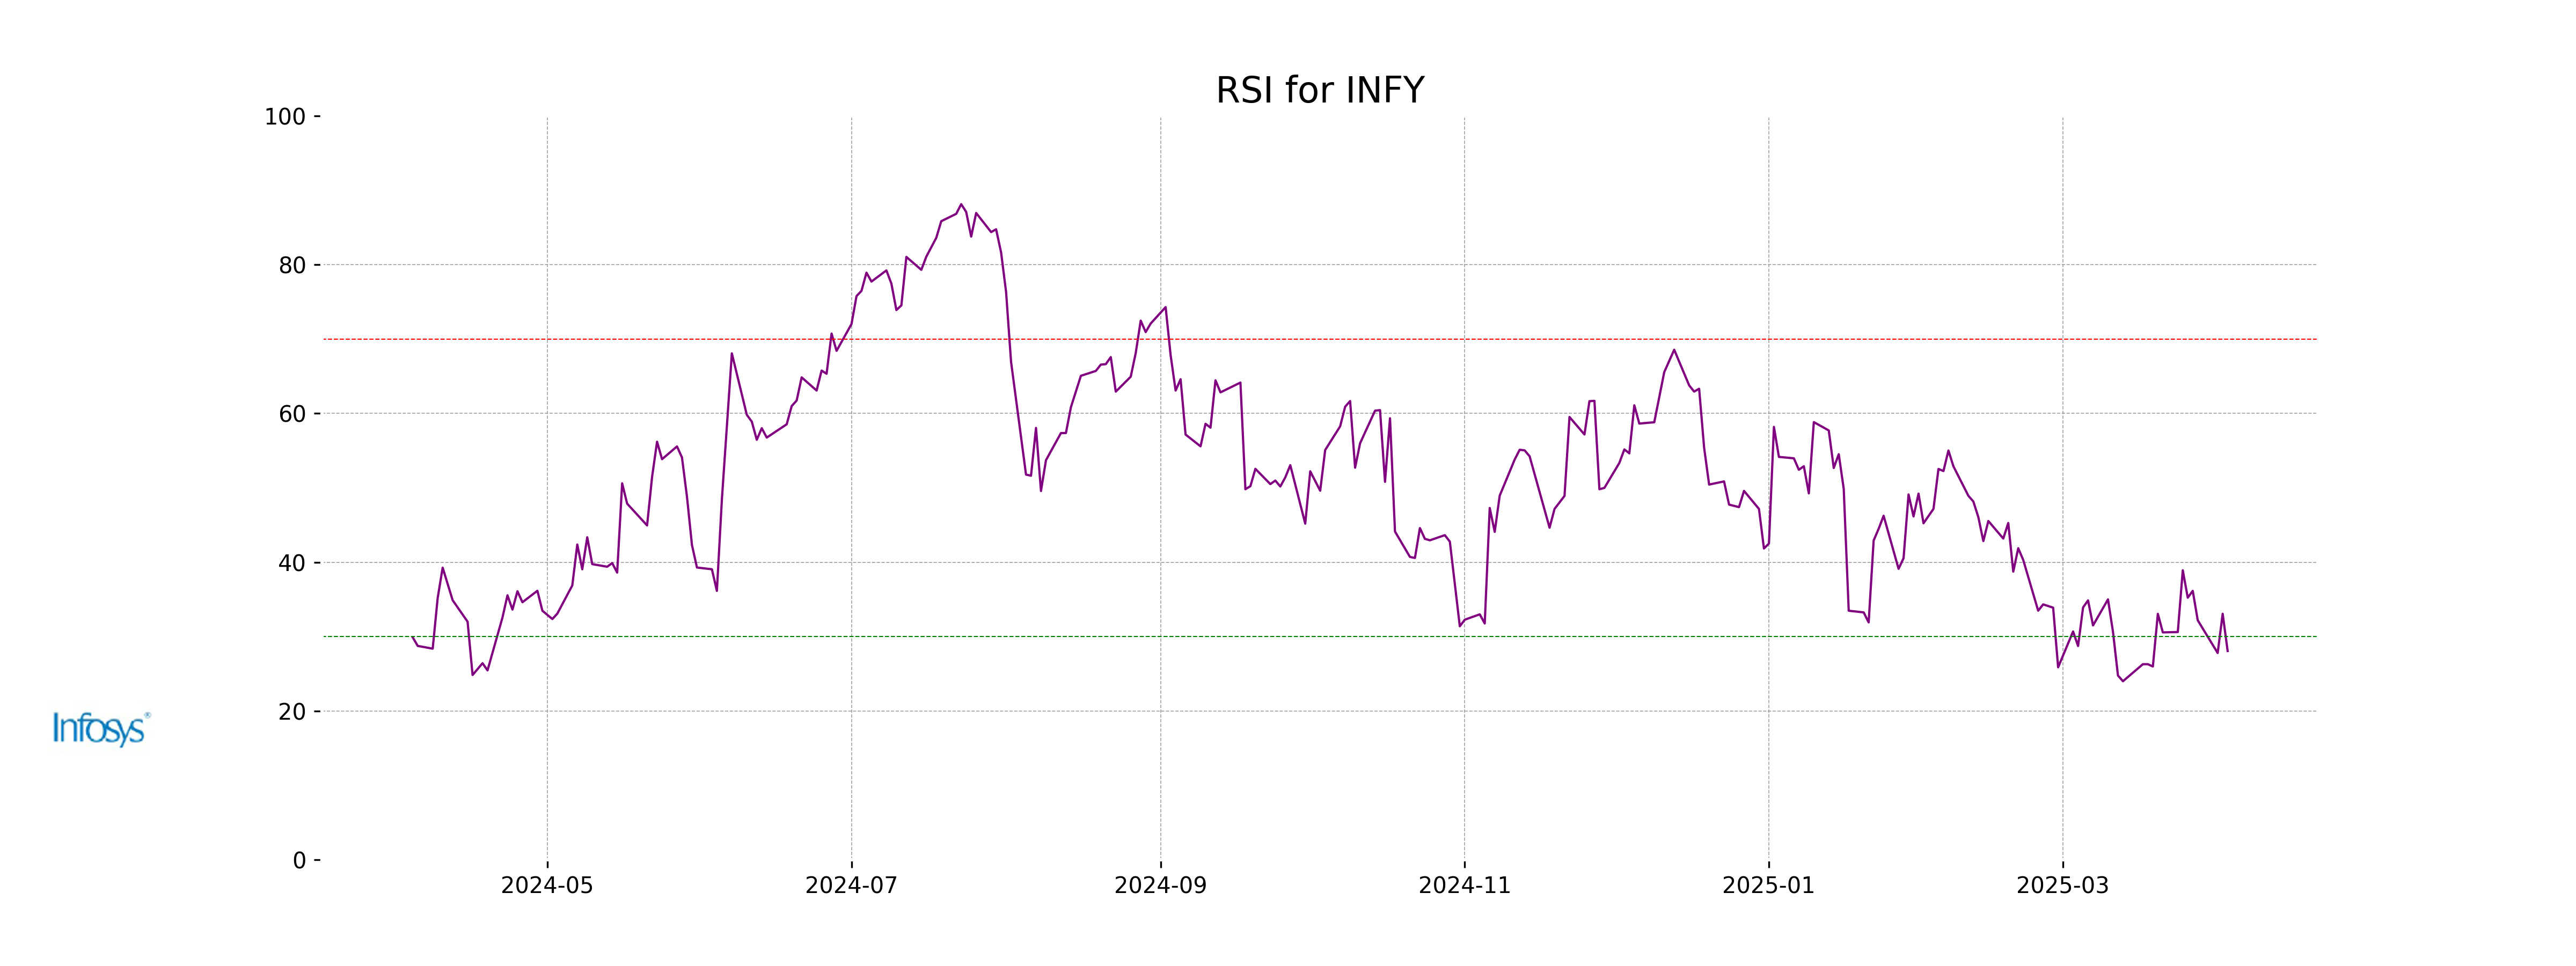
Infosys had a closing price of 1496.5, marking a decline of approximately 3.46% from the previous close. The stock's RSI is 28.06, indicating it might be oversold. Infosys operates in the Technology sector, specifically within Information Technology Services, and is based in India.
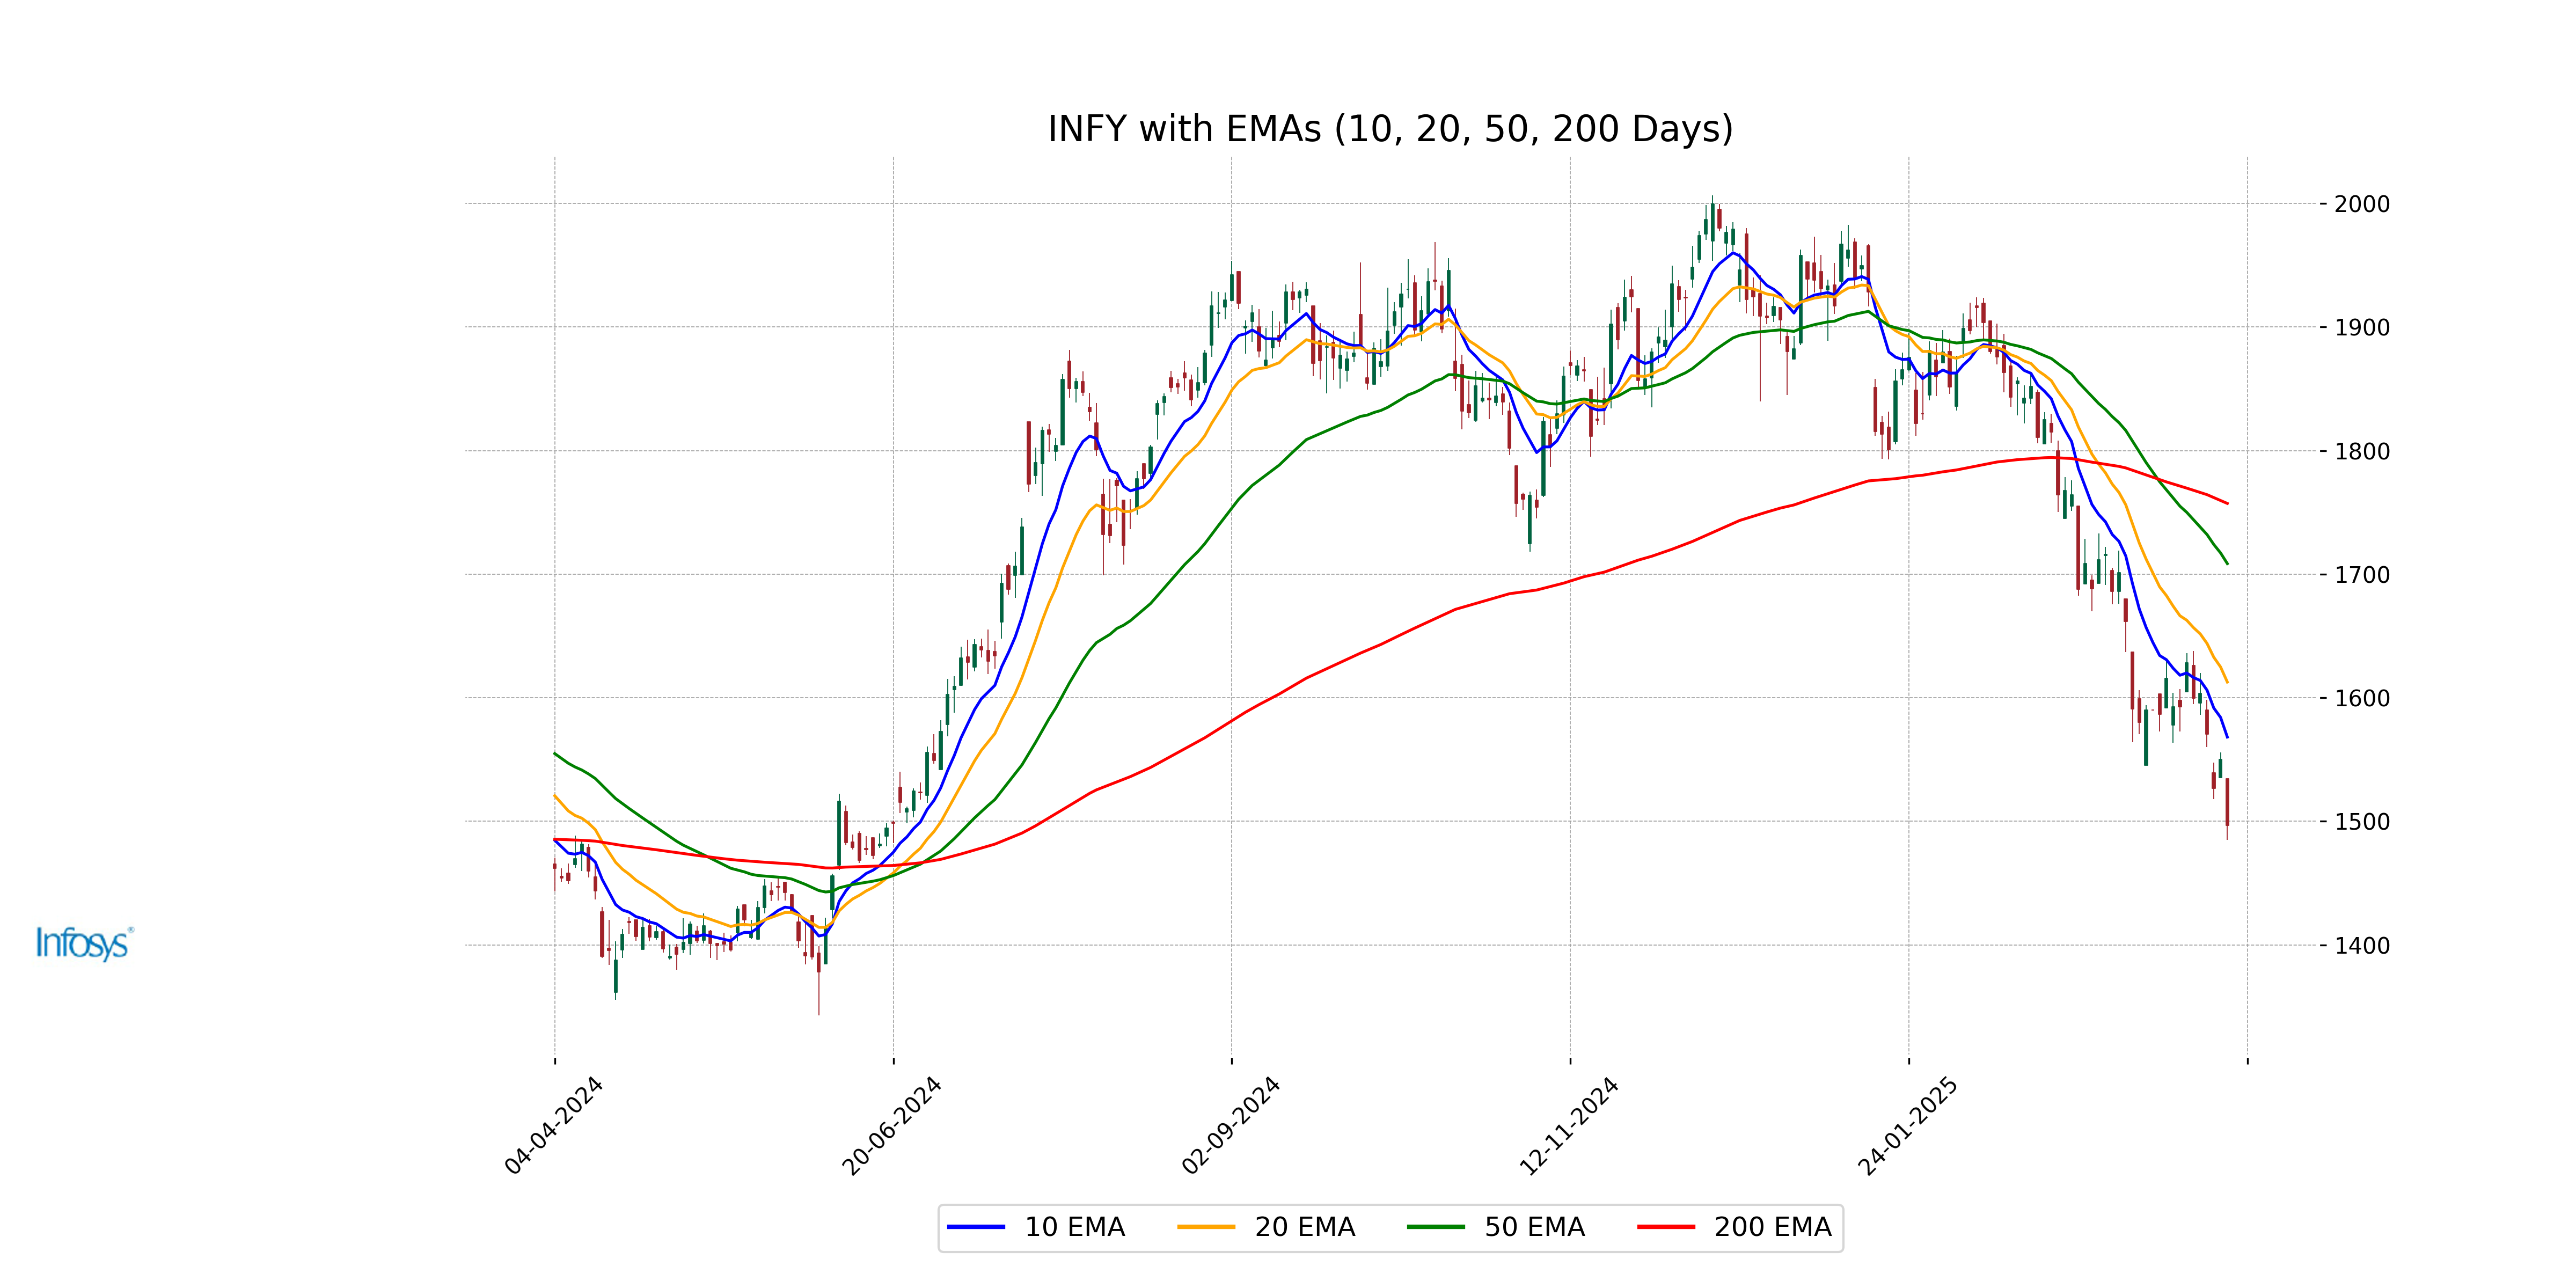
Relationship with Key Moving Averages
The stock price of Infosys is trading below its 10 EMA, 20 EMA, 50 EMA, and 200 EMA, indicating a potential bearish trend in comparison to its key moving averages. The RSI is 28.06, suggesting the stock may be oversold.
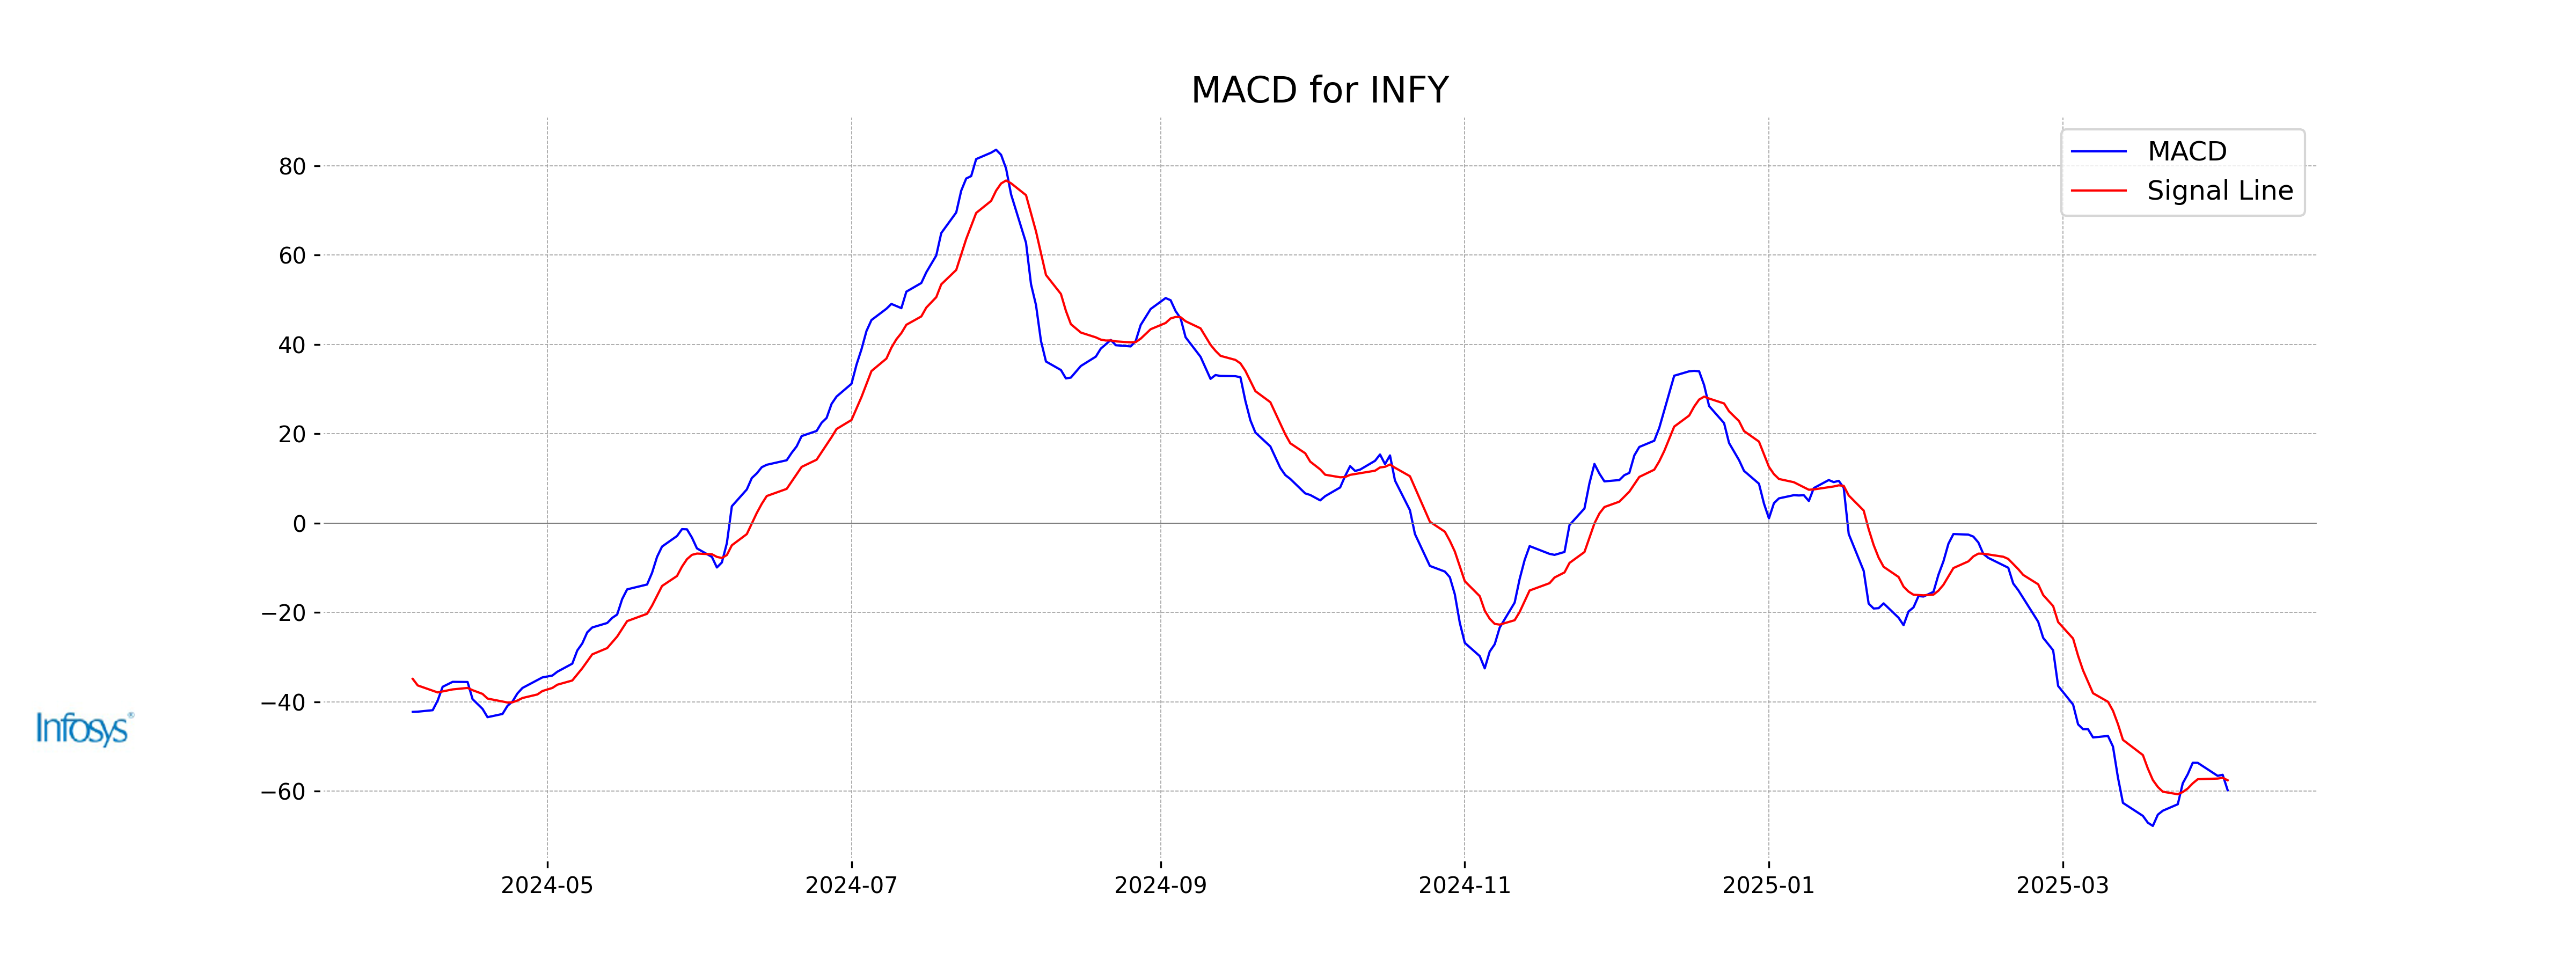
Moving Averages Trend (MACD)
The MACD for Infosys is currently at -59.75, with a signal line of -57.54. This indicates a bearish momentum as the MACD is below the signal line, suggesting that the stock is experiencing a downward trend.
RSI Analysis
The RSI of Infosys is 28.06, indicating that the stock is in oversold territory. Typically, an RSI below 30 suggests that the stock may be undervalued, which could present a buying opportunity, though investors should consider other factors before making decisions.
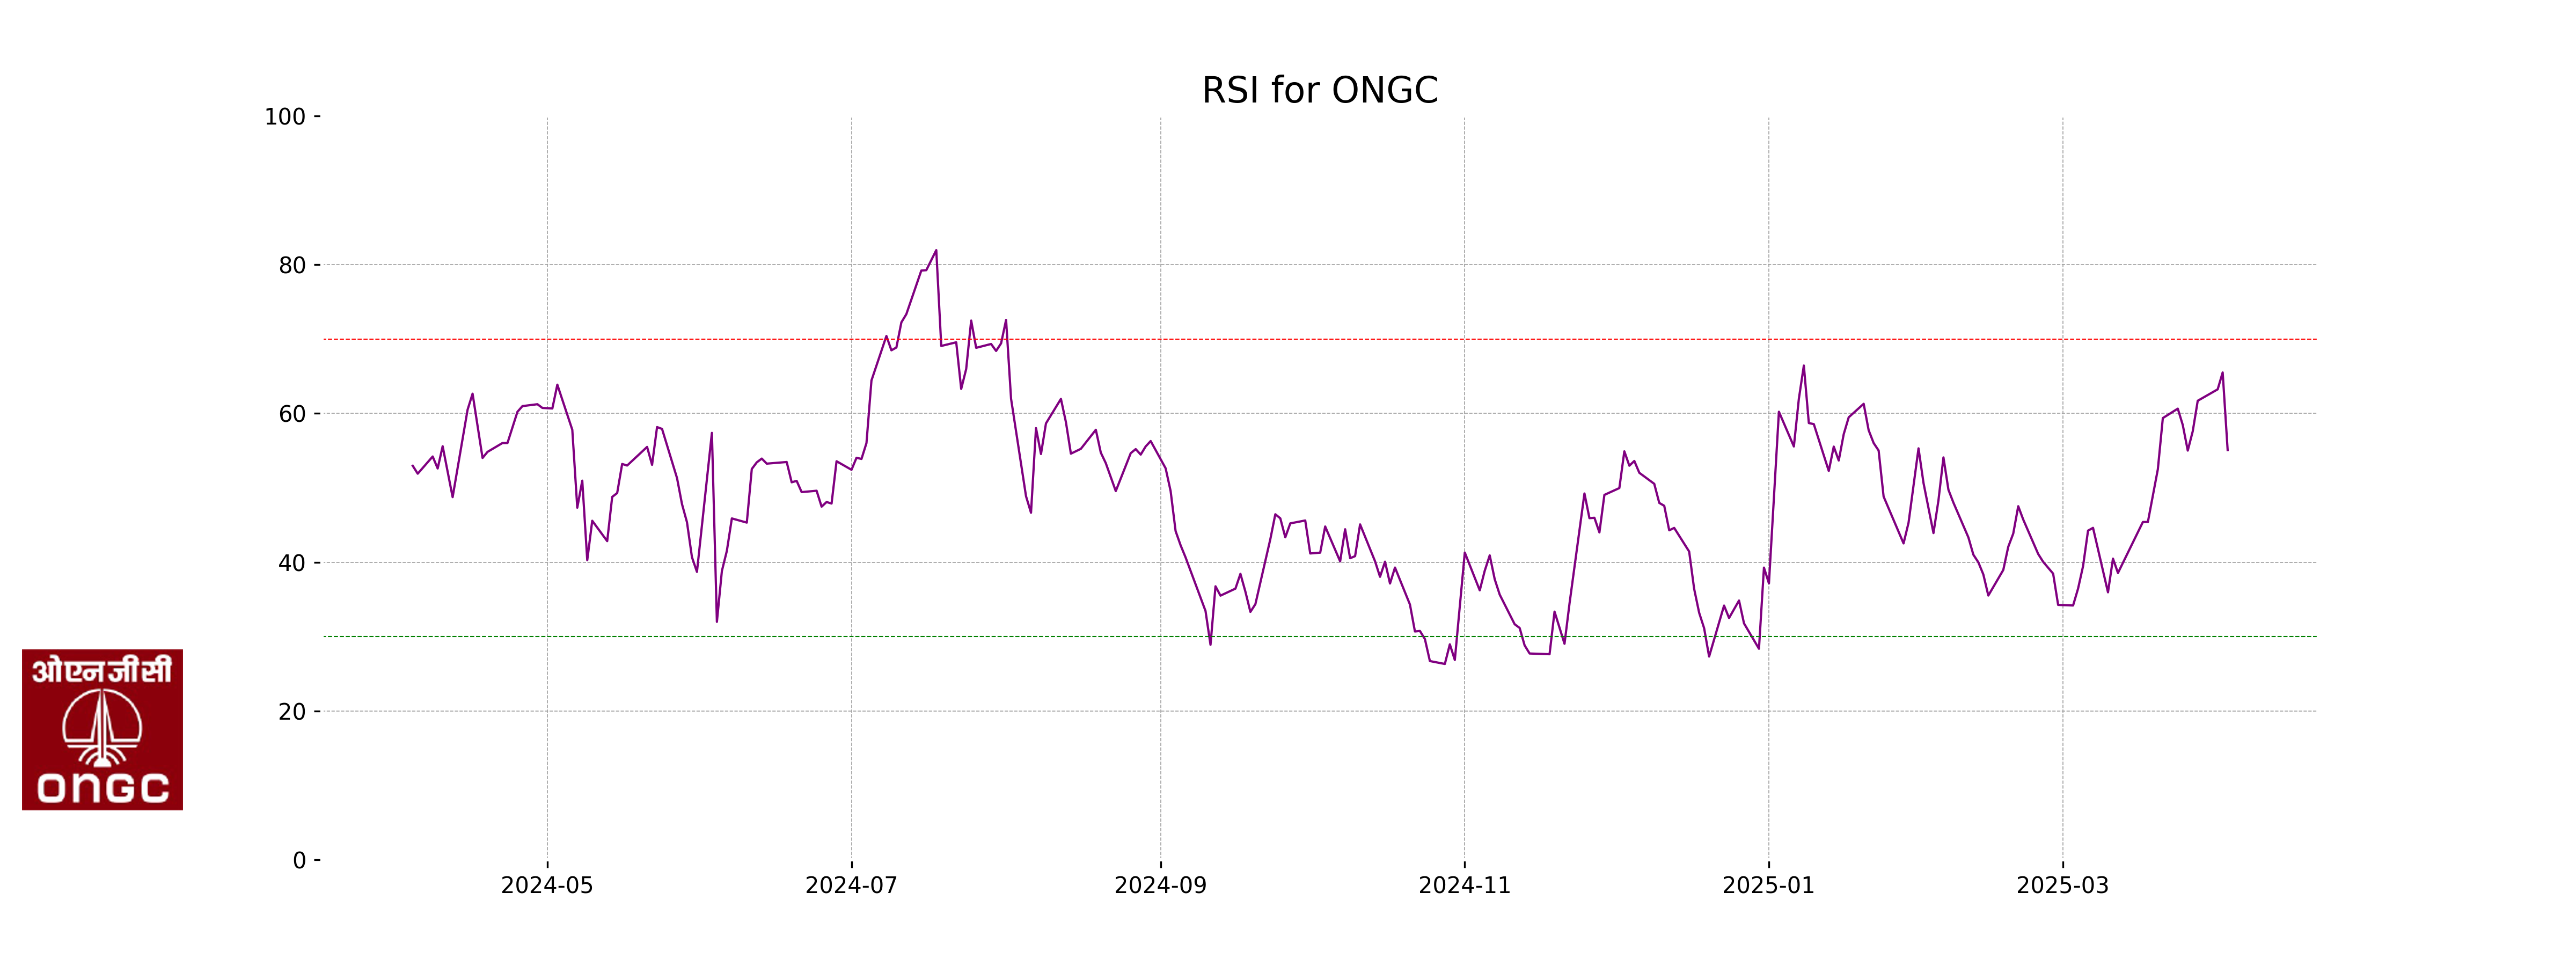
Analysis for ONGC - April 03, 2025
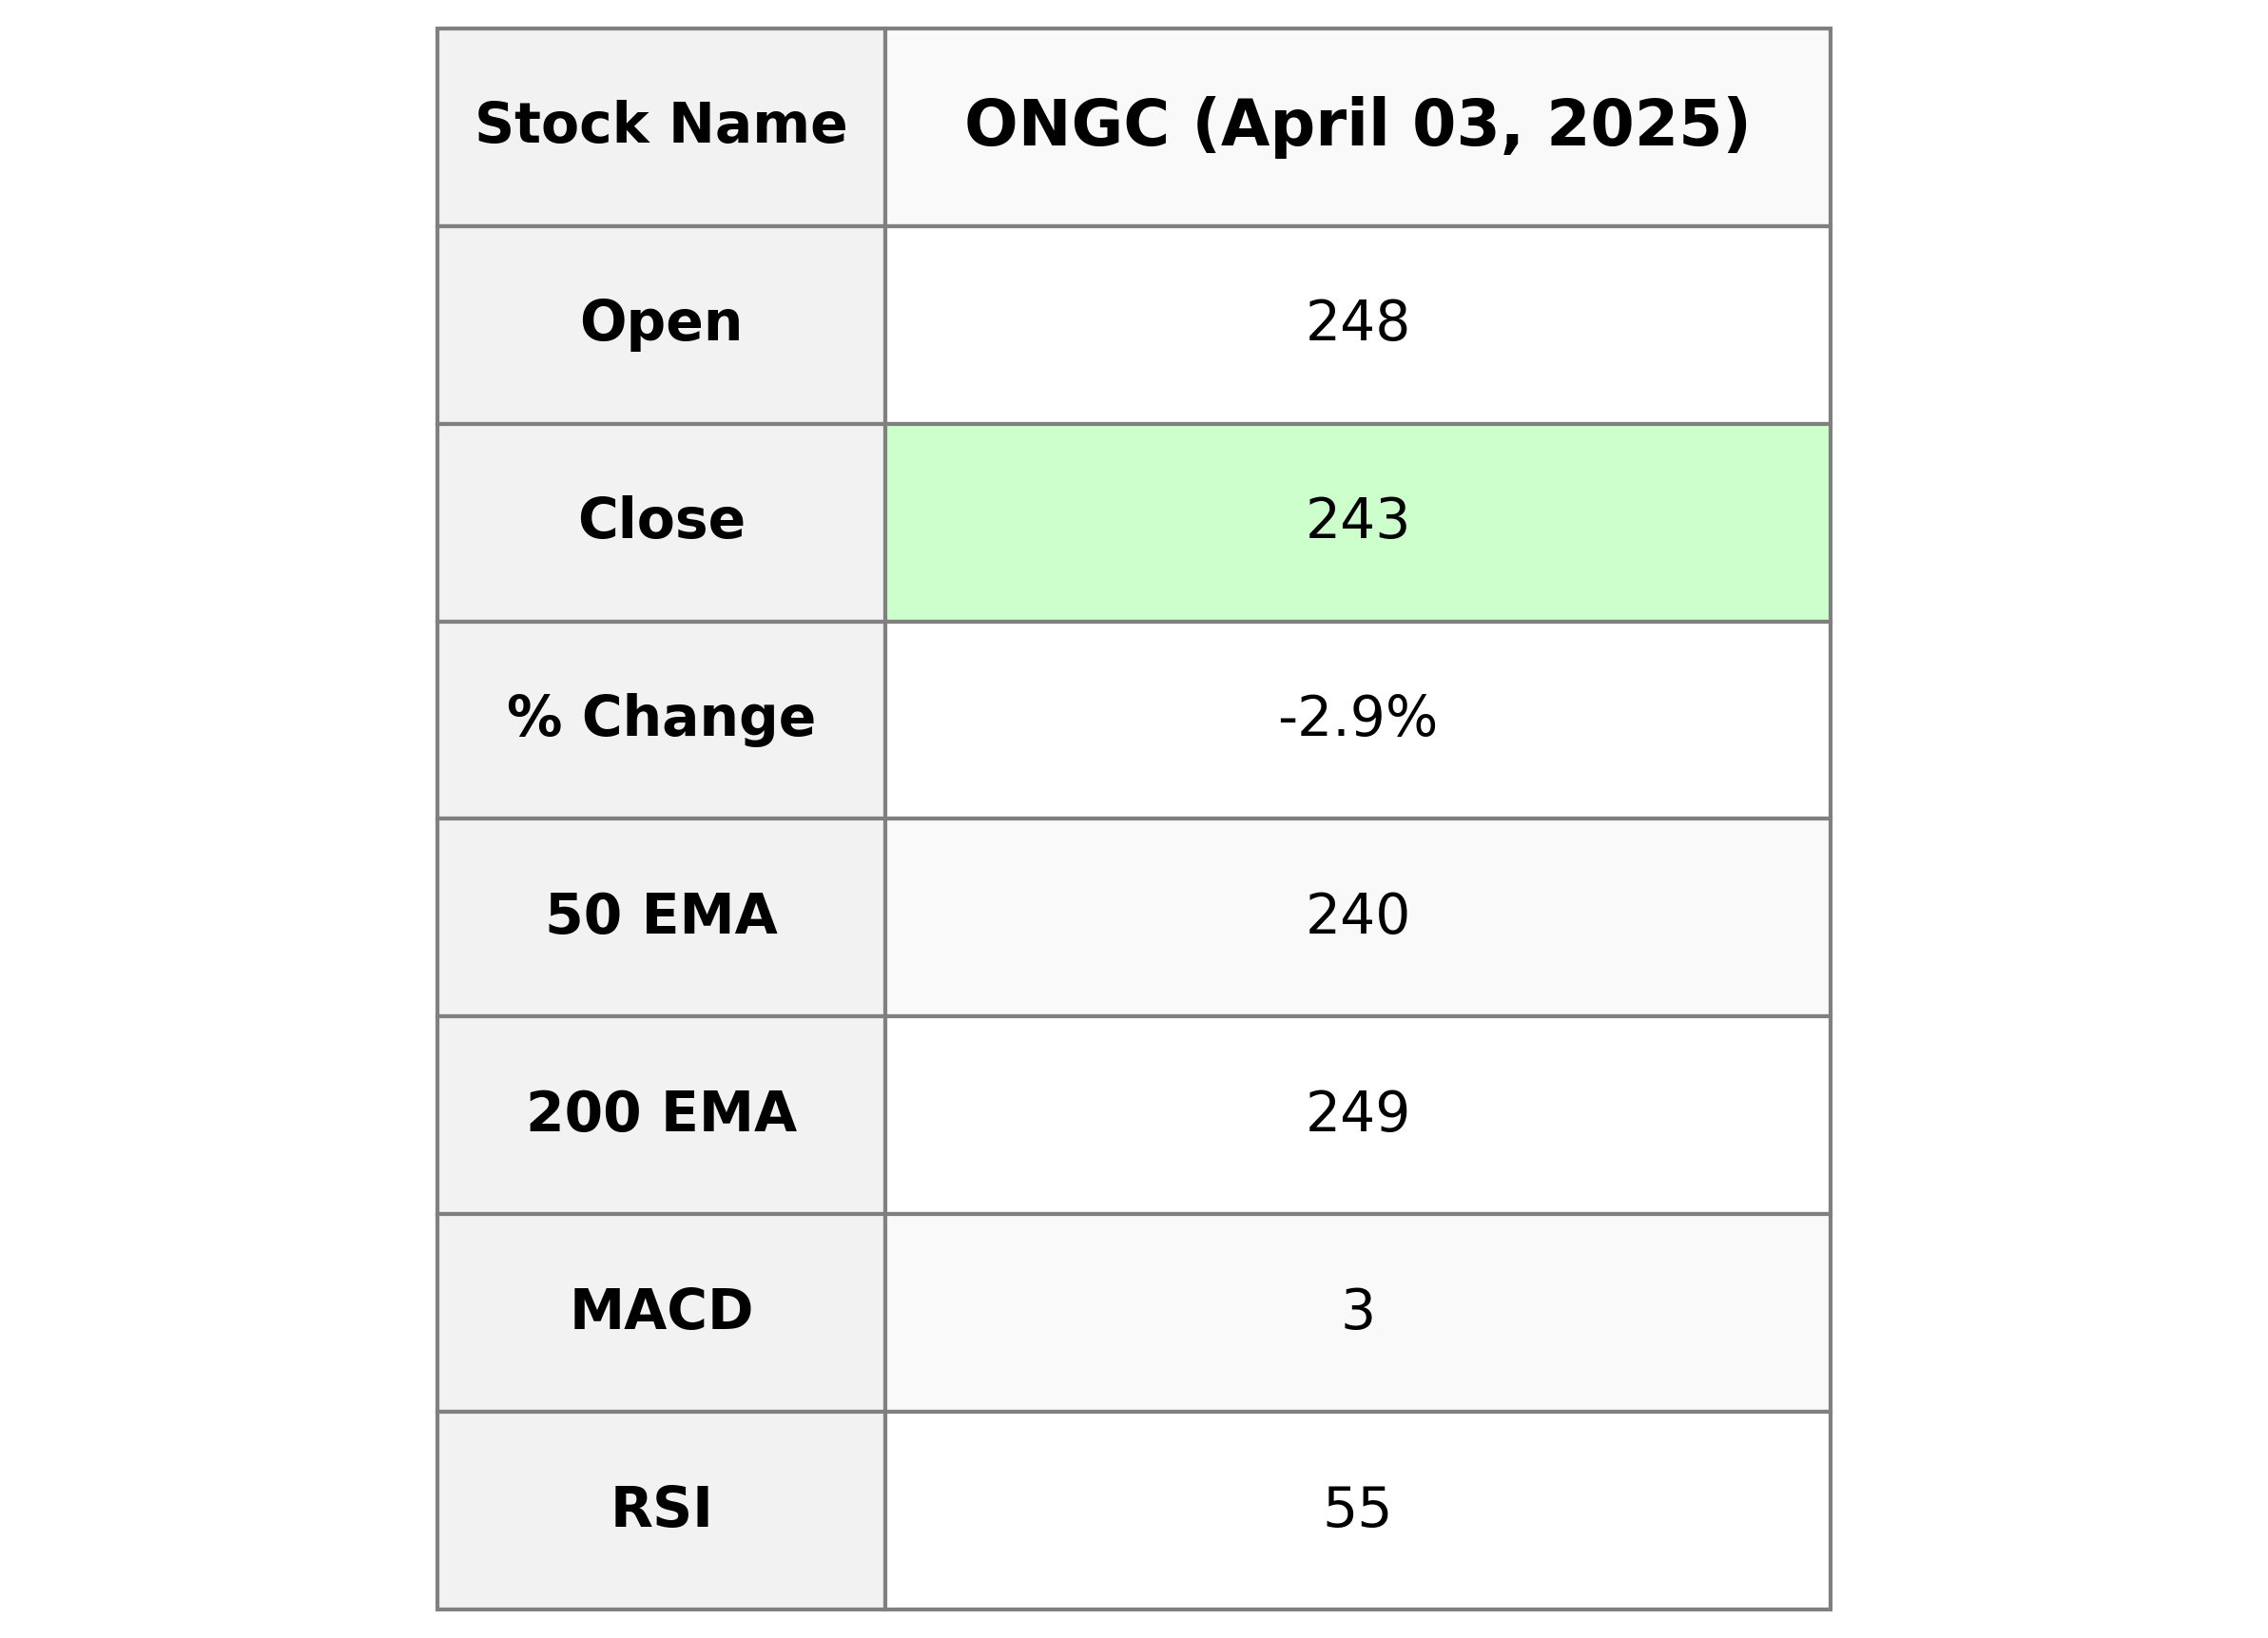
### Performance of ONGC ONGC opened at 248.0, experiencing a daily high of 249.62 and a low of 242.51, before closing at 243.31. The stock saw a decline of 2.92% in percentage terms with a points change of -7.33 from its previous close of 250.64. The current volume stands at 11,136,726, while it maintains a PE Ratio of 7.85 and an EPS of 31.0, showcasing its strong presence in the Energy sector, specifically within the Oil & Gas Integrated industry in India.
Relationship with Key Moving Averages
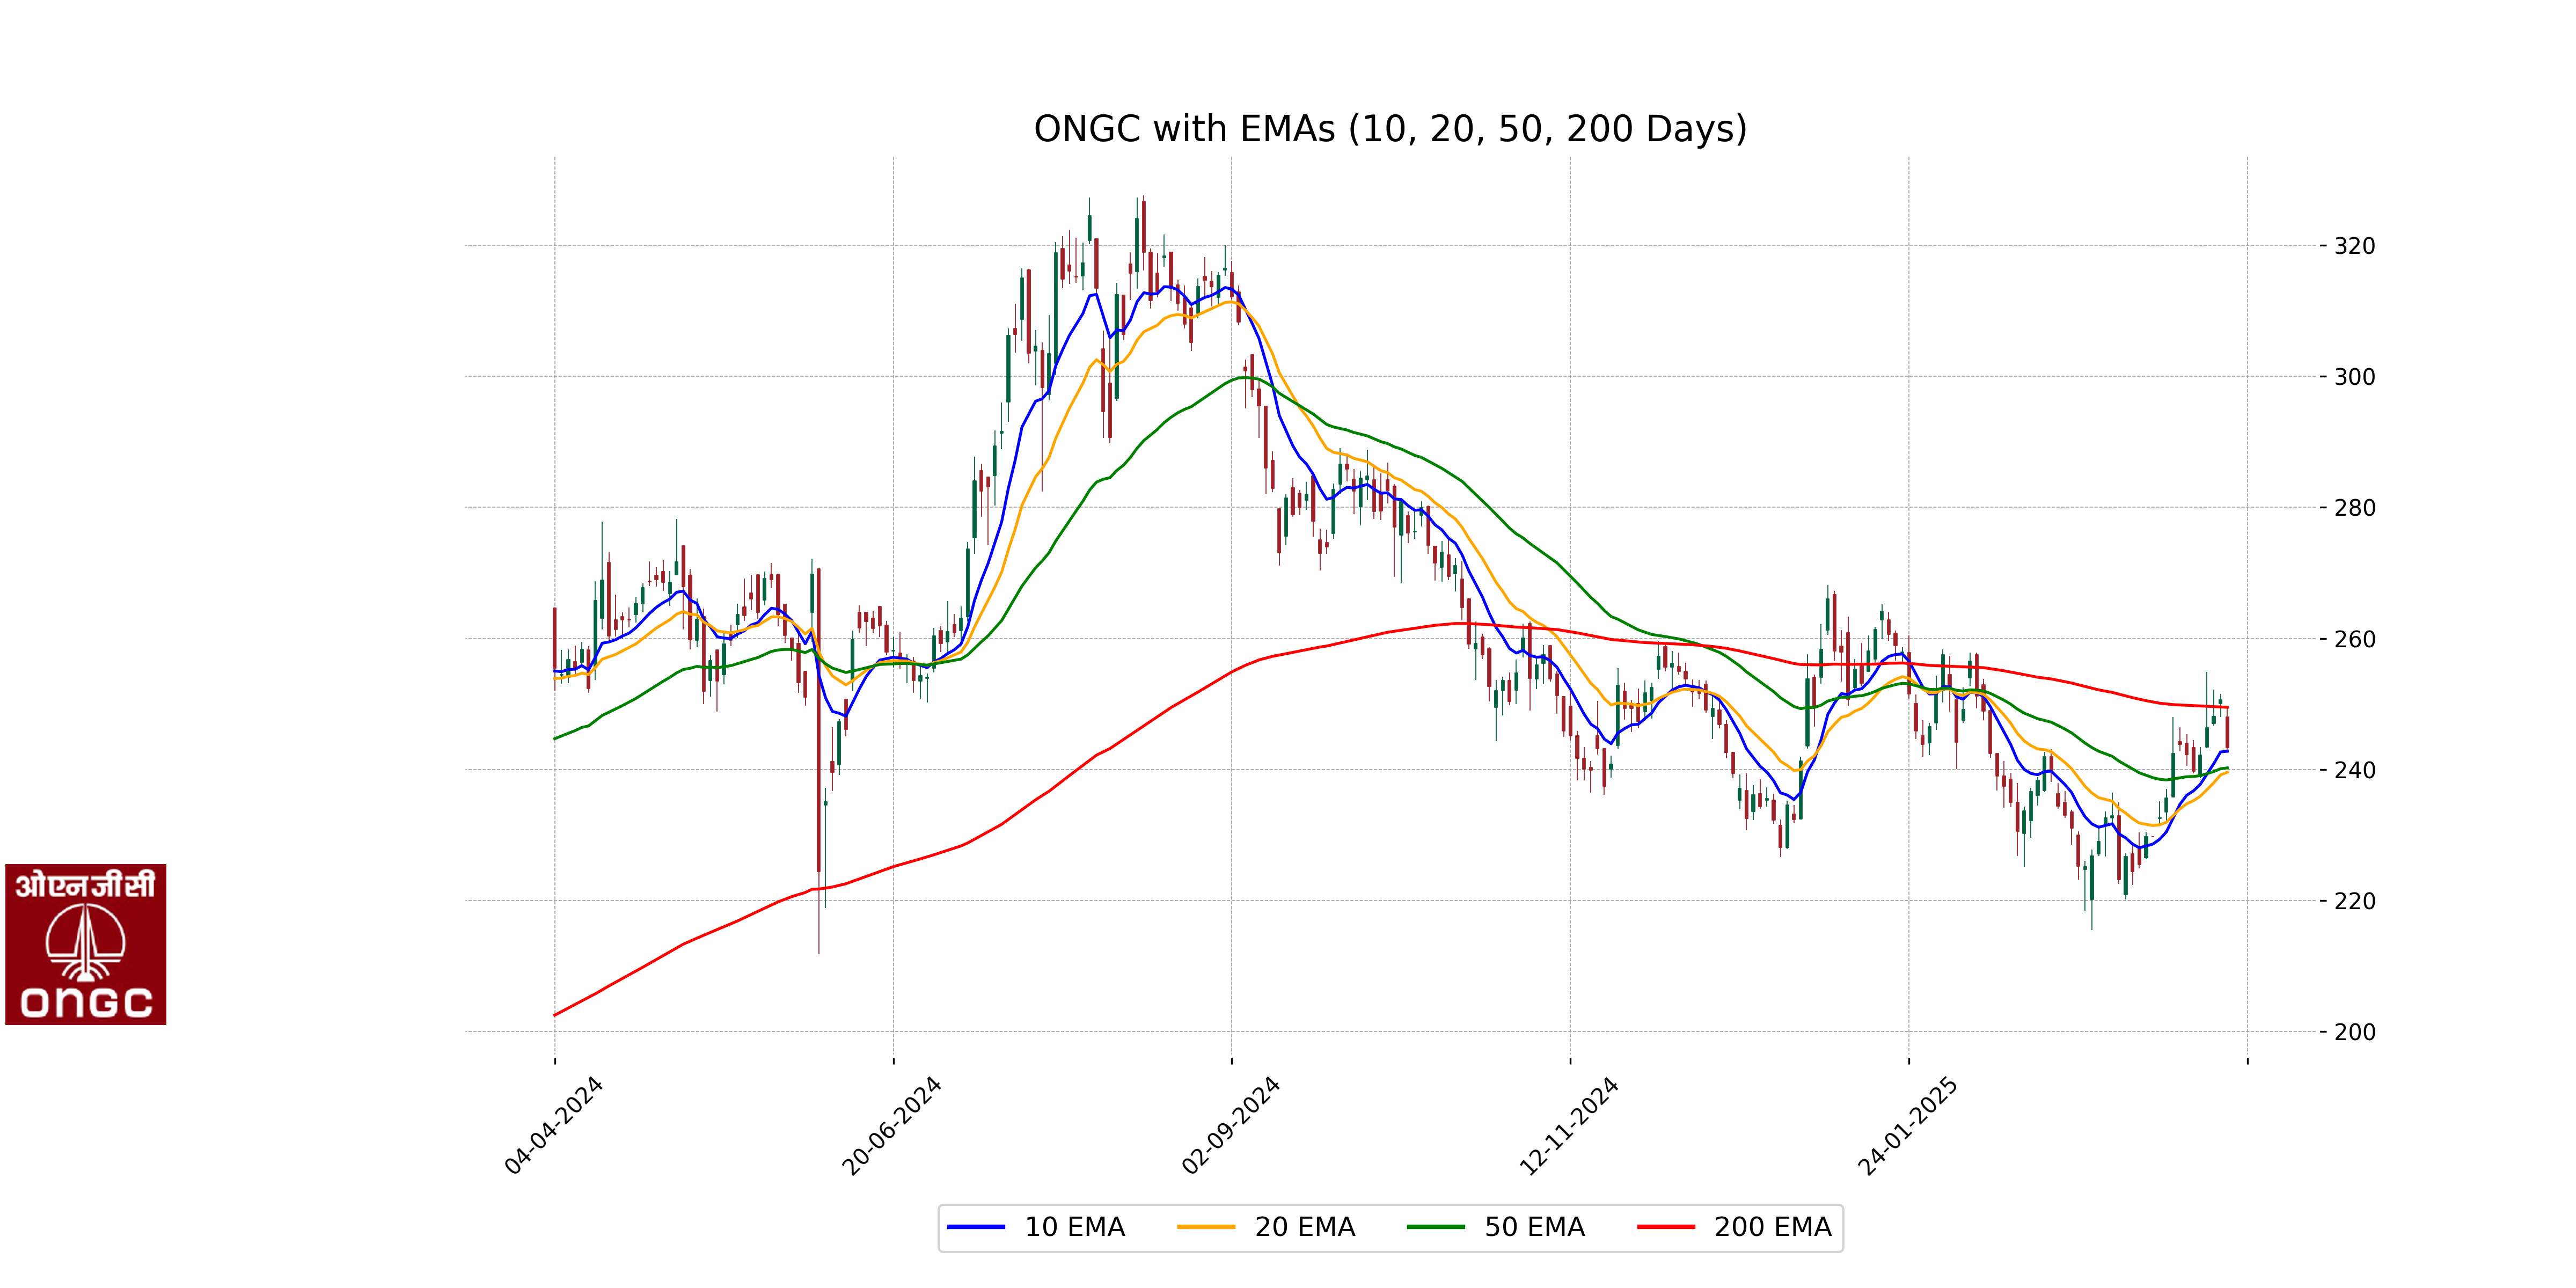
Based on the provided data for ONGC, the current close price of 243.31 is slightly above the 50-day EMA of 240.22 but below the 200-day EMA of 249.47. This suggests a short-term bullish trend while still indicating caution against a longer-term bearish trend, as observed by the position below the 200-day EMA.
Moving Averages Trend (MACD)
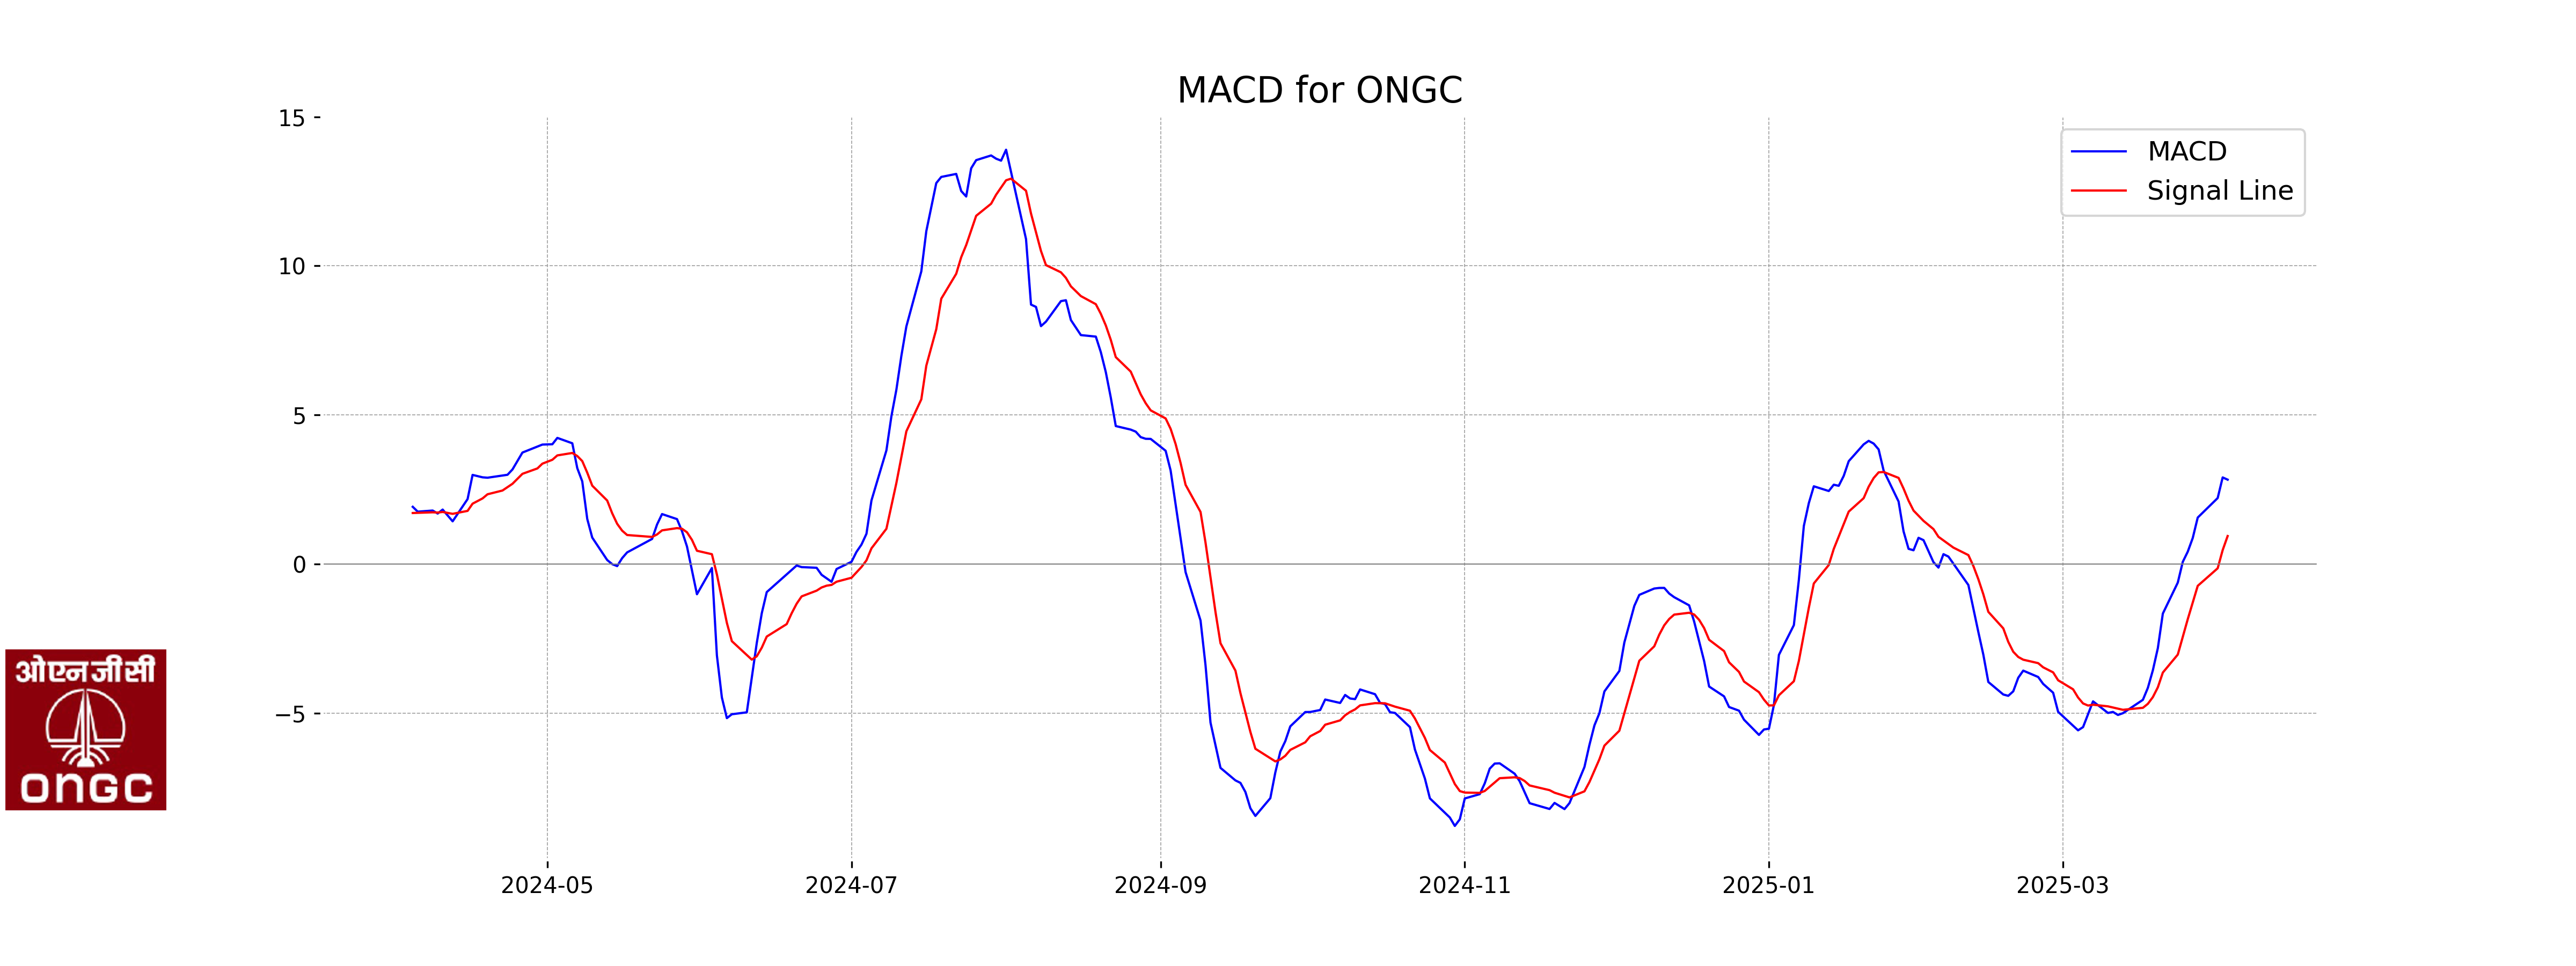
MACD Analysis for ONGC: The MACD for ONGC is 2.83 with a signal line of 0.94, indicating a positive momentum as the MACD line is above the signal line. Despite the recent negative price change, the MACD suggests a potential for bullish reversal or continuation of the upward trend.
RSI Analysis
RSI Analysis for ONGC: The RSI (Relative Strength Index) for ONGC is at 55.08, indicating a neutral market position. RSI values between 30 and 70 suggest that the stock is not currently overbought or oversold, implying a stable trading condition.
Analysis for TCS - April 03, 2025
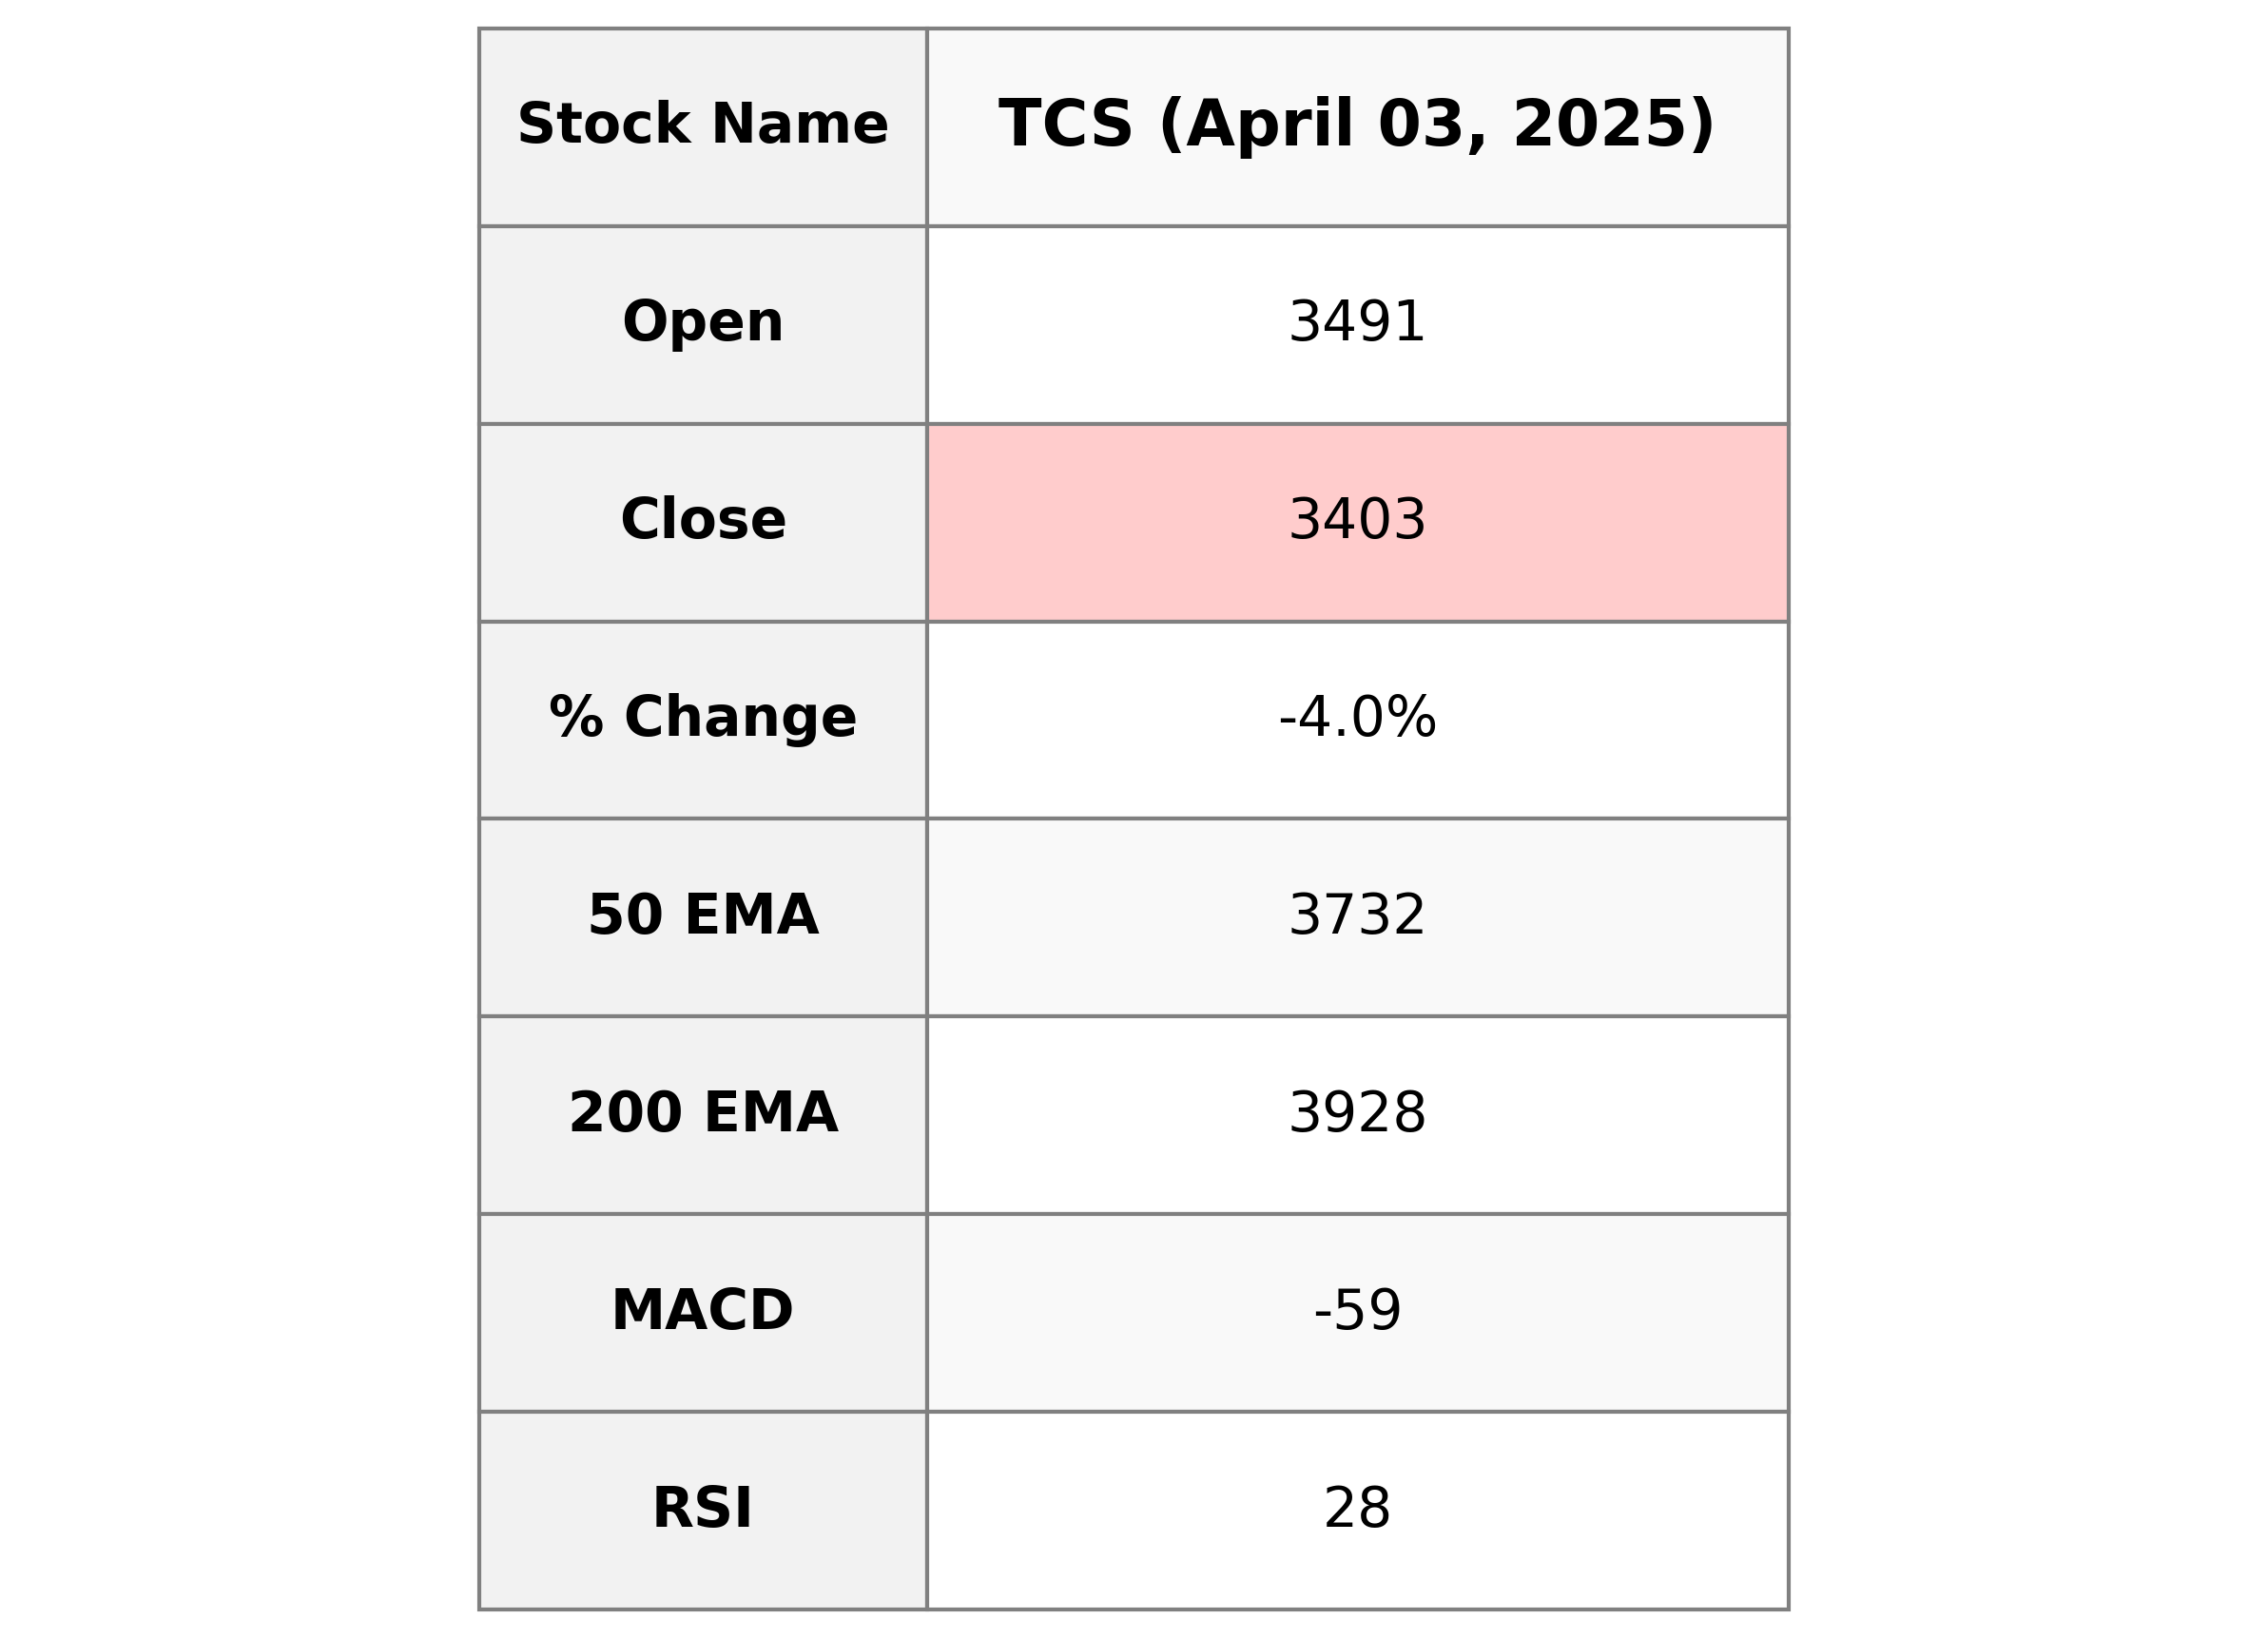
### TCS Performance Overview Tata Consultancy Services (TCS) saw a notable decline in its stock performance, with a percentage change of -3.97% from the previous close. The current close of 3403.15 is significantly below both the 50-EMA and 200-EMA, indicating a bearish trend. The RSI is at 28.41, suggesting the stock is oversold. The technology sector company has a market cap of 12.31 trillion, a PE ratio of 25.27, and an EPS of 134.67.
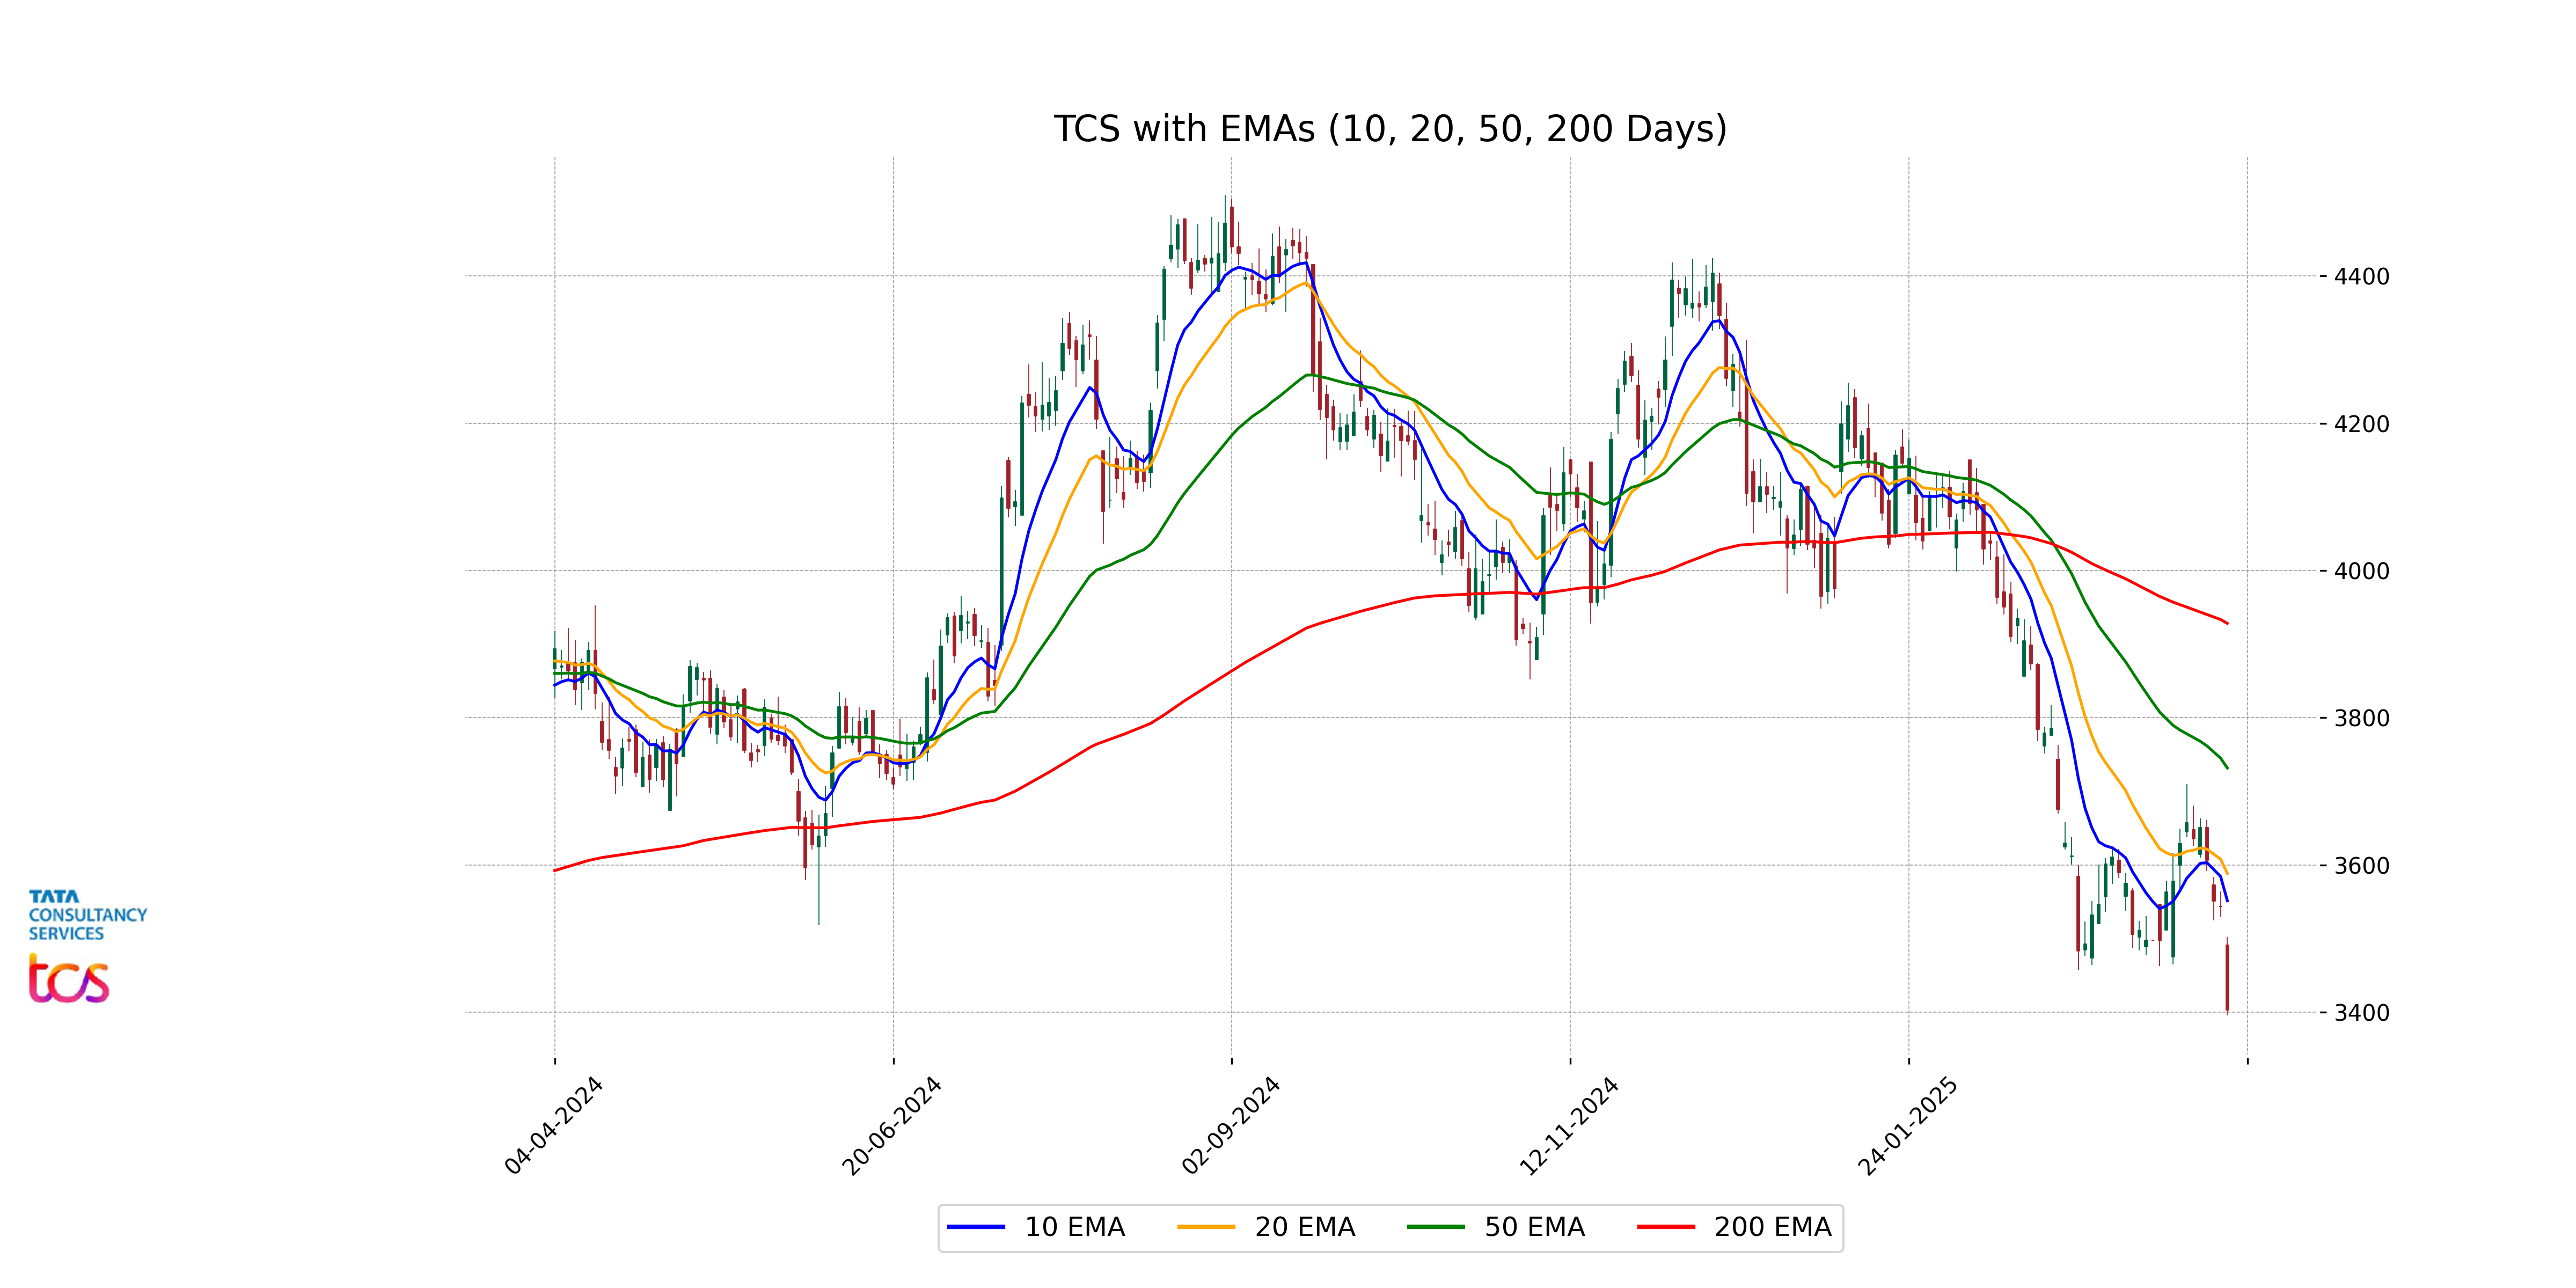
Relationship with Key Moving Averages
The stock price of TCS is trading below its 50-day and 200-day Exponential Moving Averages (EMAs), indicating a bearish short-term and long-term trend. Additionally, it is also below the 10-day and 20-day EMAs, suggesting continued downward pressure in the recent term.
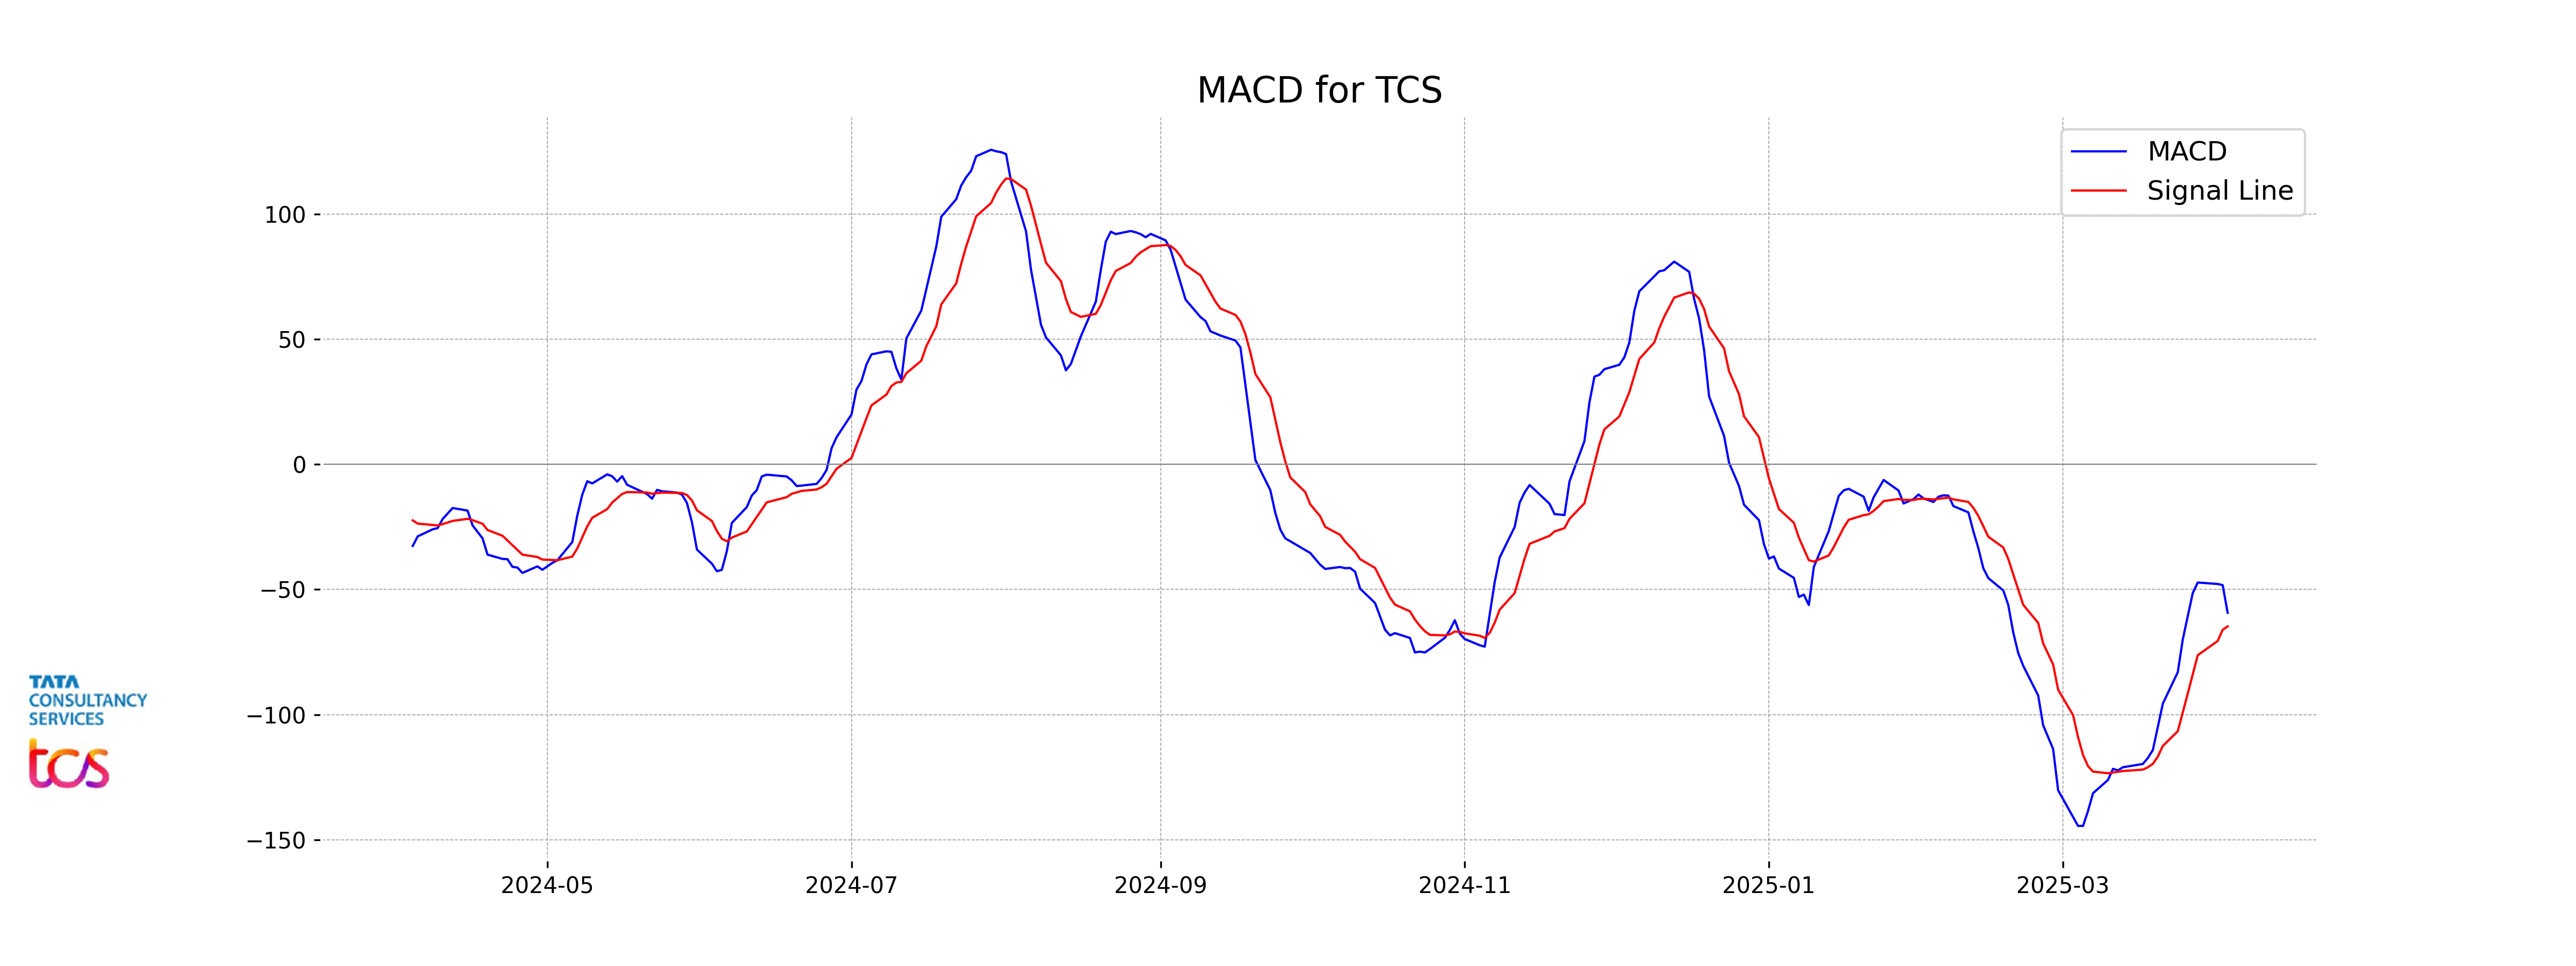
Moving Averages Trend (MACD)
TCS exhibits a negative MACD value of -59.29, which is below the MACD Signal line at -64.74. This suggests that the stock is currently in a bearish trend, indicating potential downward pressure on its price.
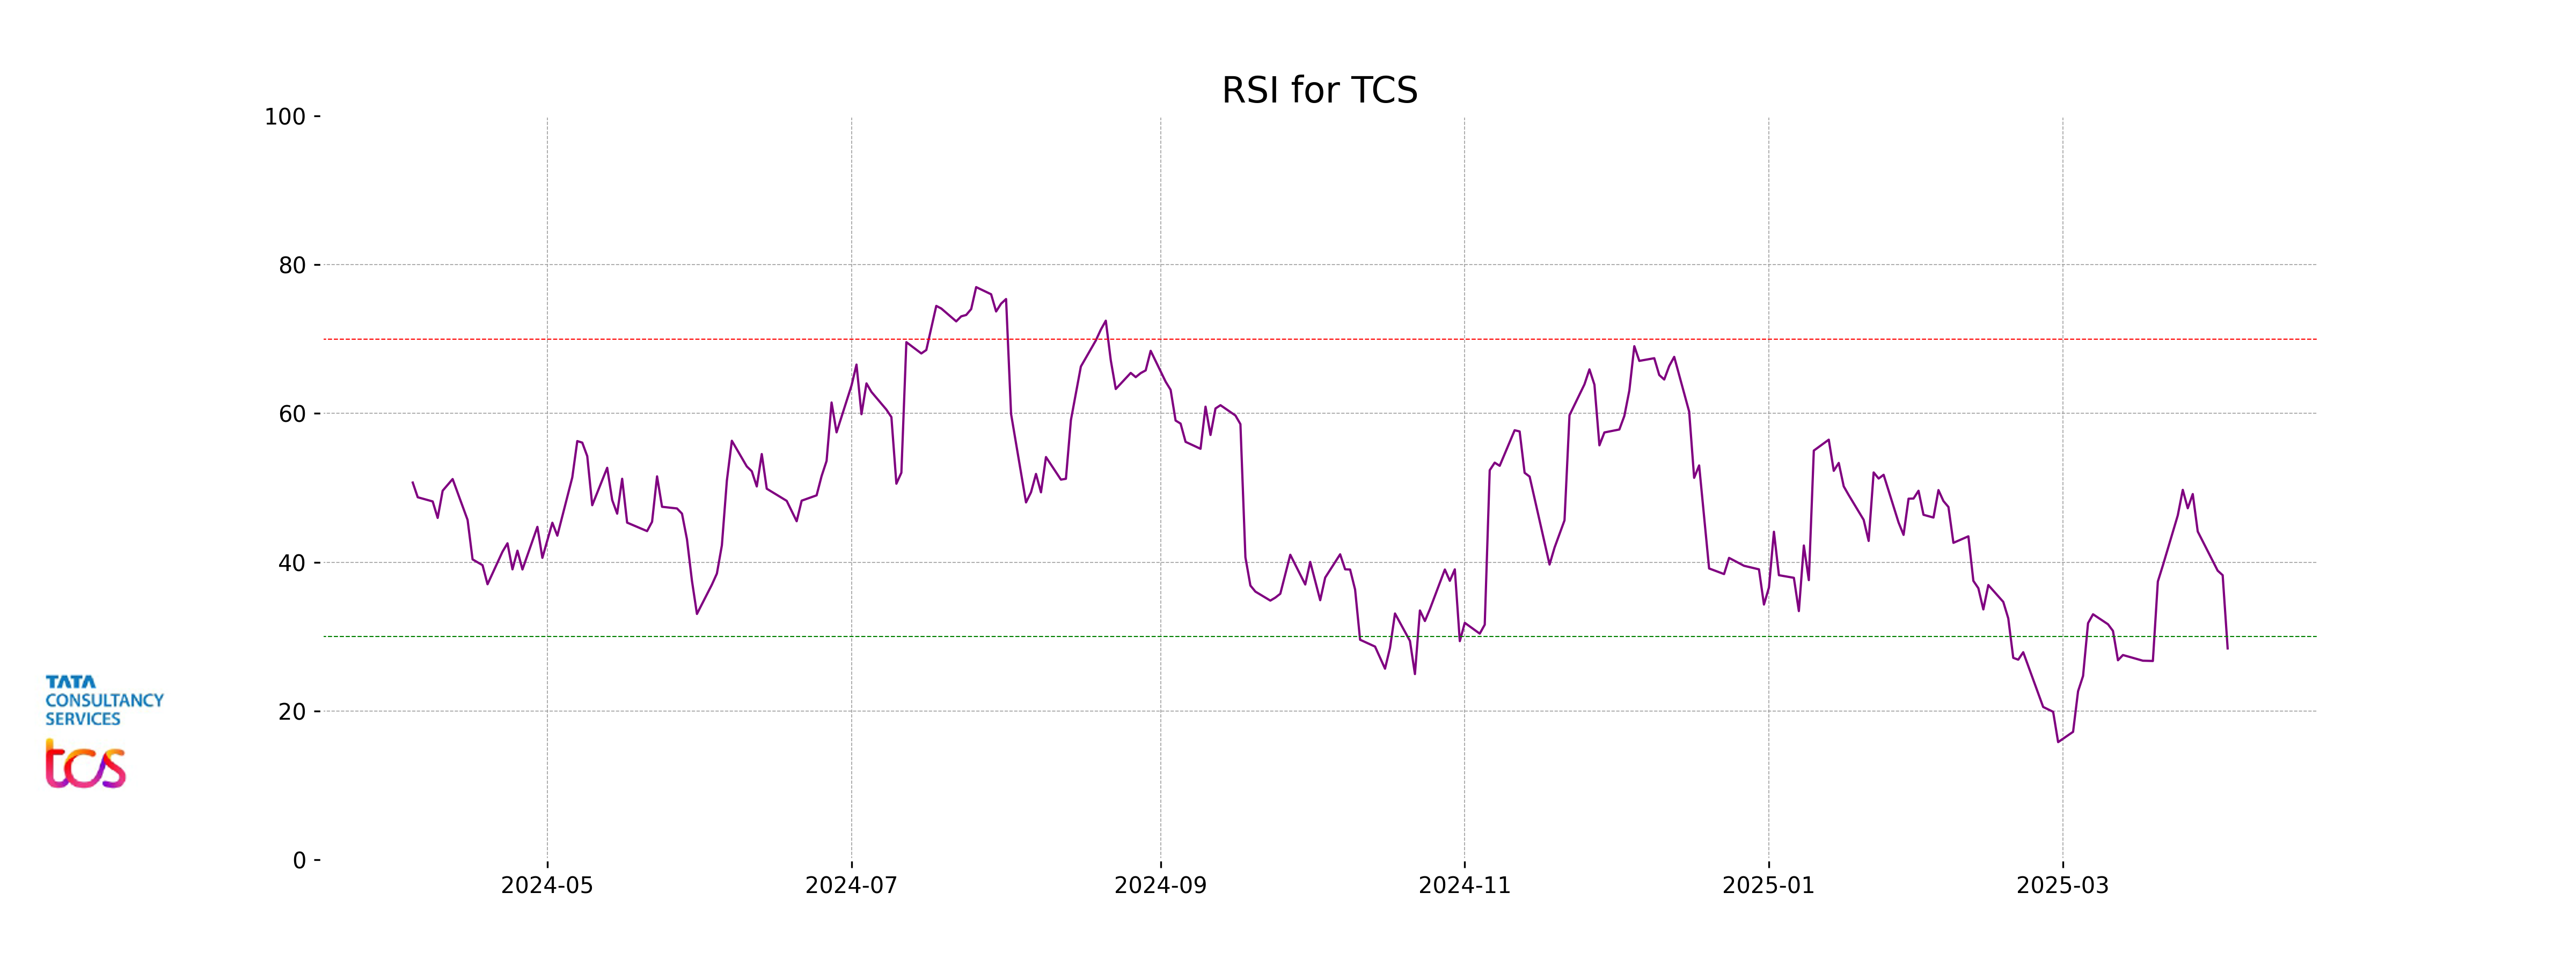
RSI Analysis
The RSI value for TCS is 28.41, which indicates that the stock is currently in an oversold condition. In general, an RSI below 30 suggests that the stock might be undervalued and could be poised for a potential reversal or upward movement. However, it's important to consider other indicators and the overall market condition before making any trading decisions.
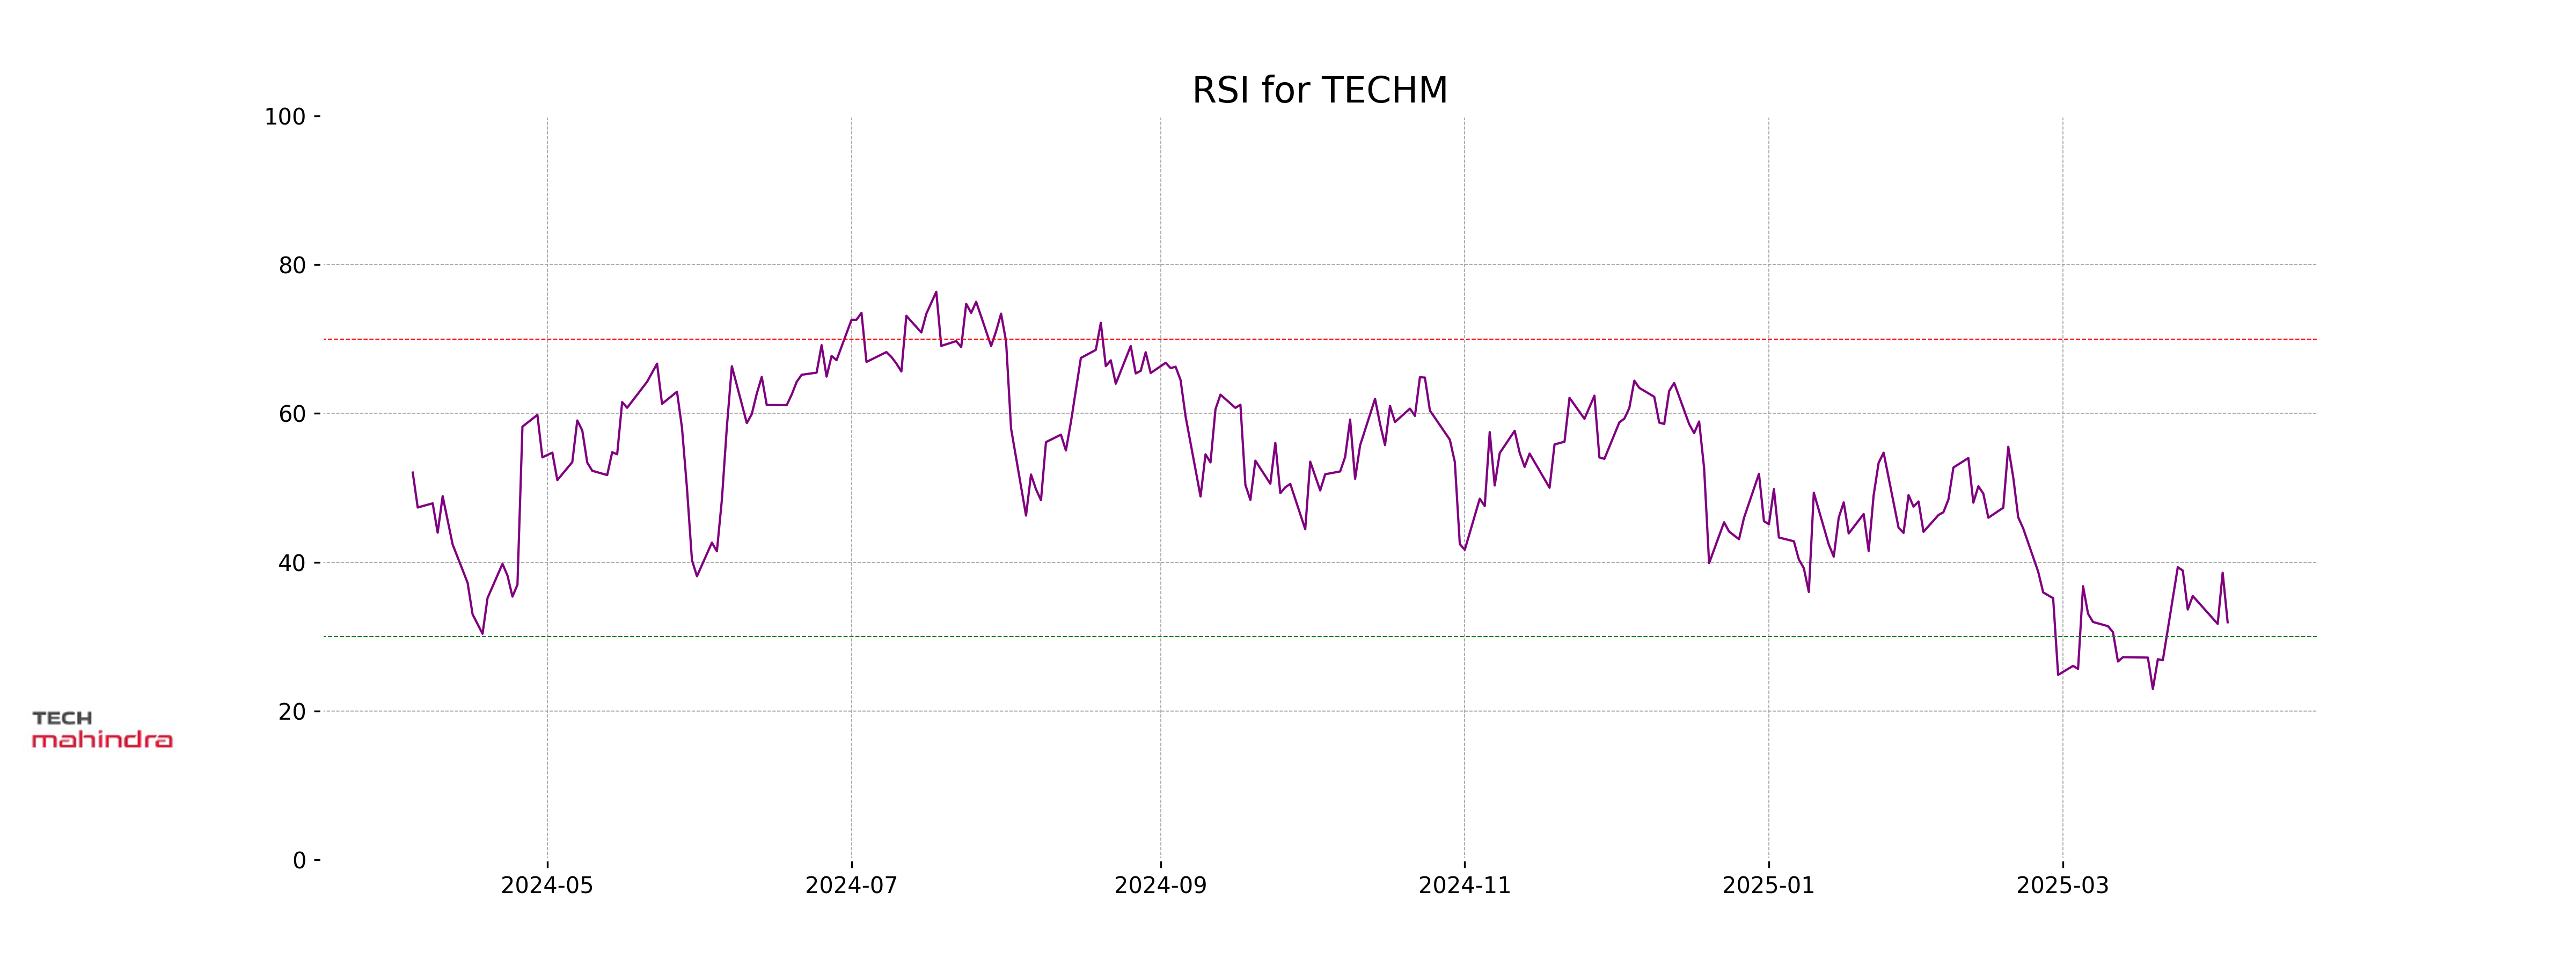
Analysis for Tech Mahindra - April 03, 2025
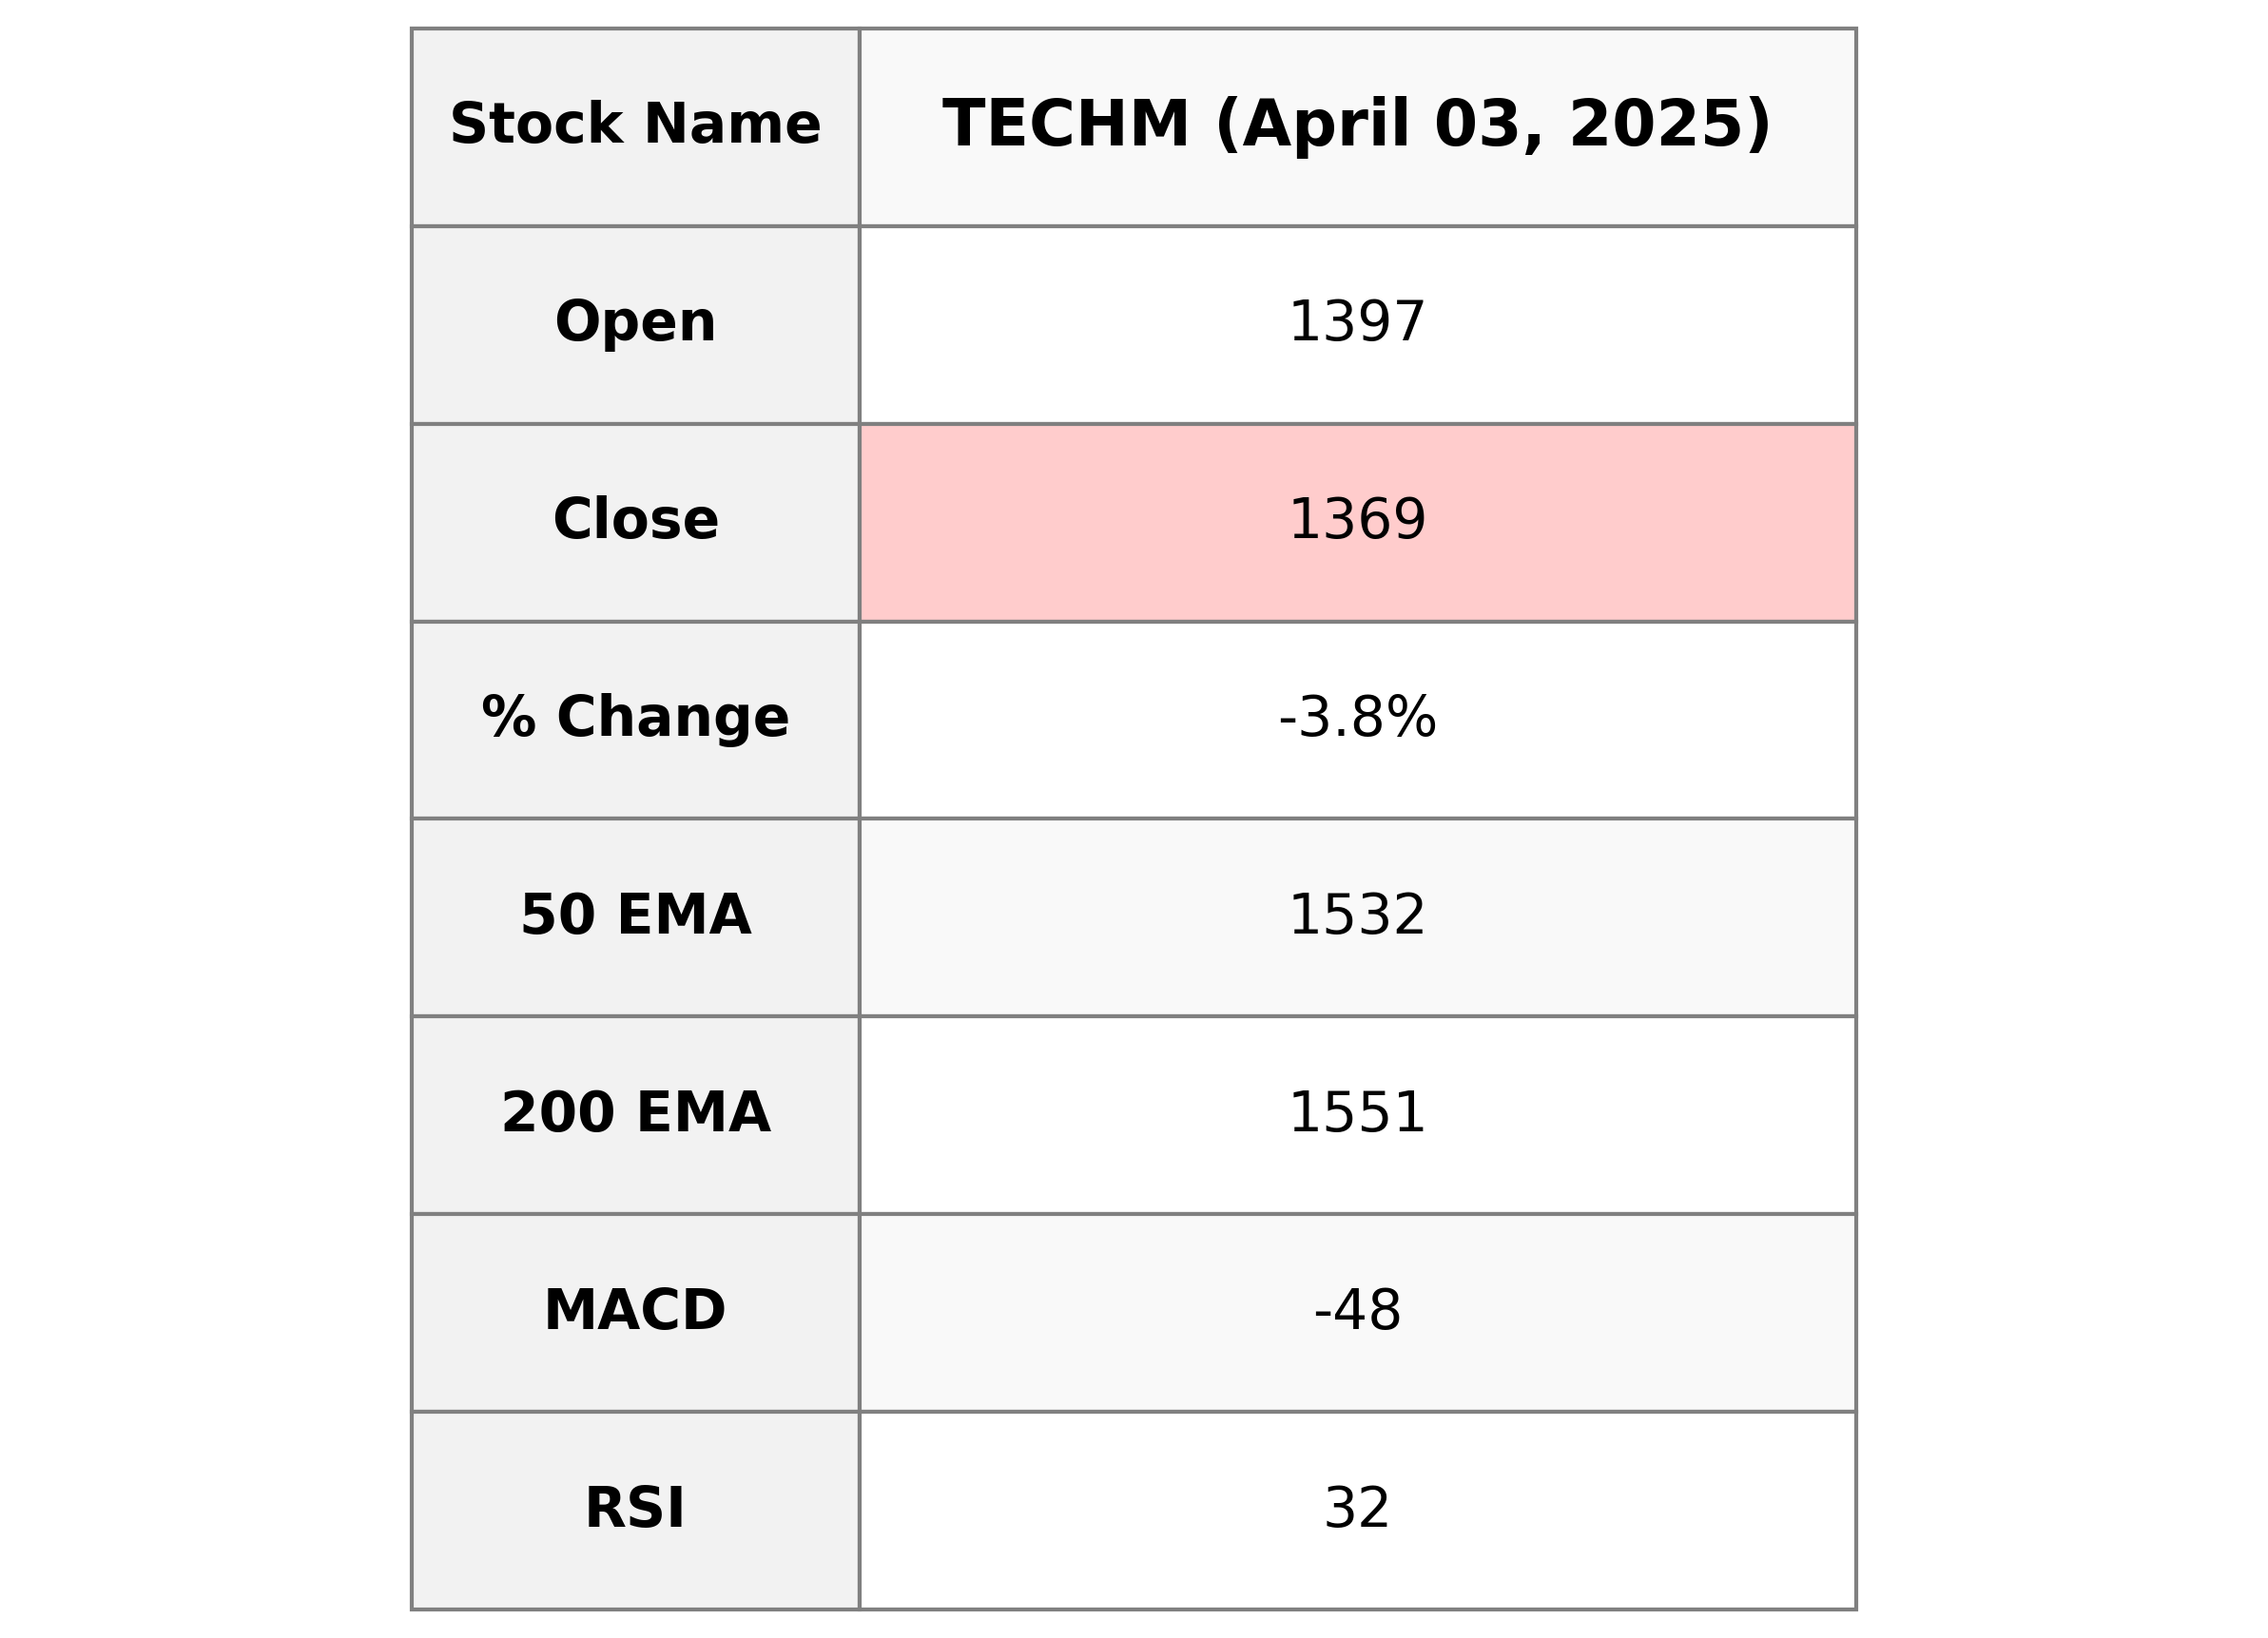
Tech Mahindra experienced a decline in stock performance with a closing price of 1369.35, down from its previous close of 1423.05, amounting to a decrease of 3.77%. The stock's relative strength index (RSI) is at 31.92, indicating potential oversold conditions, while its moving averages show the stock is trading below both its 50-day and 200-day EMAs. The company's market cap stands at 1,212 billion INR within the technology sector, specifically in Information Technology Services.
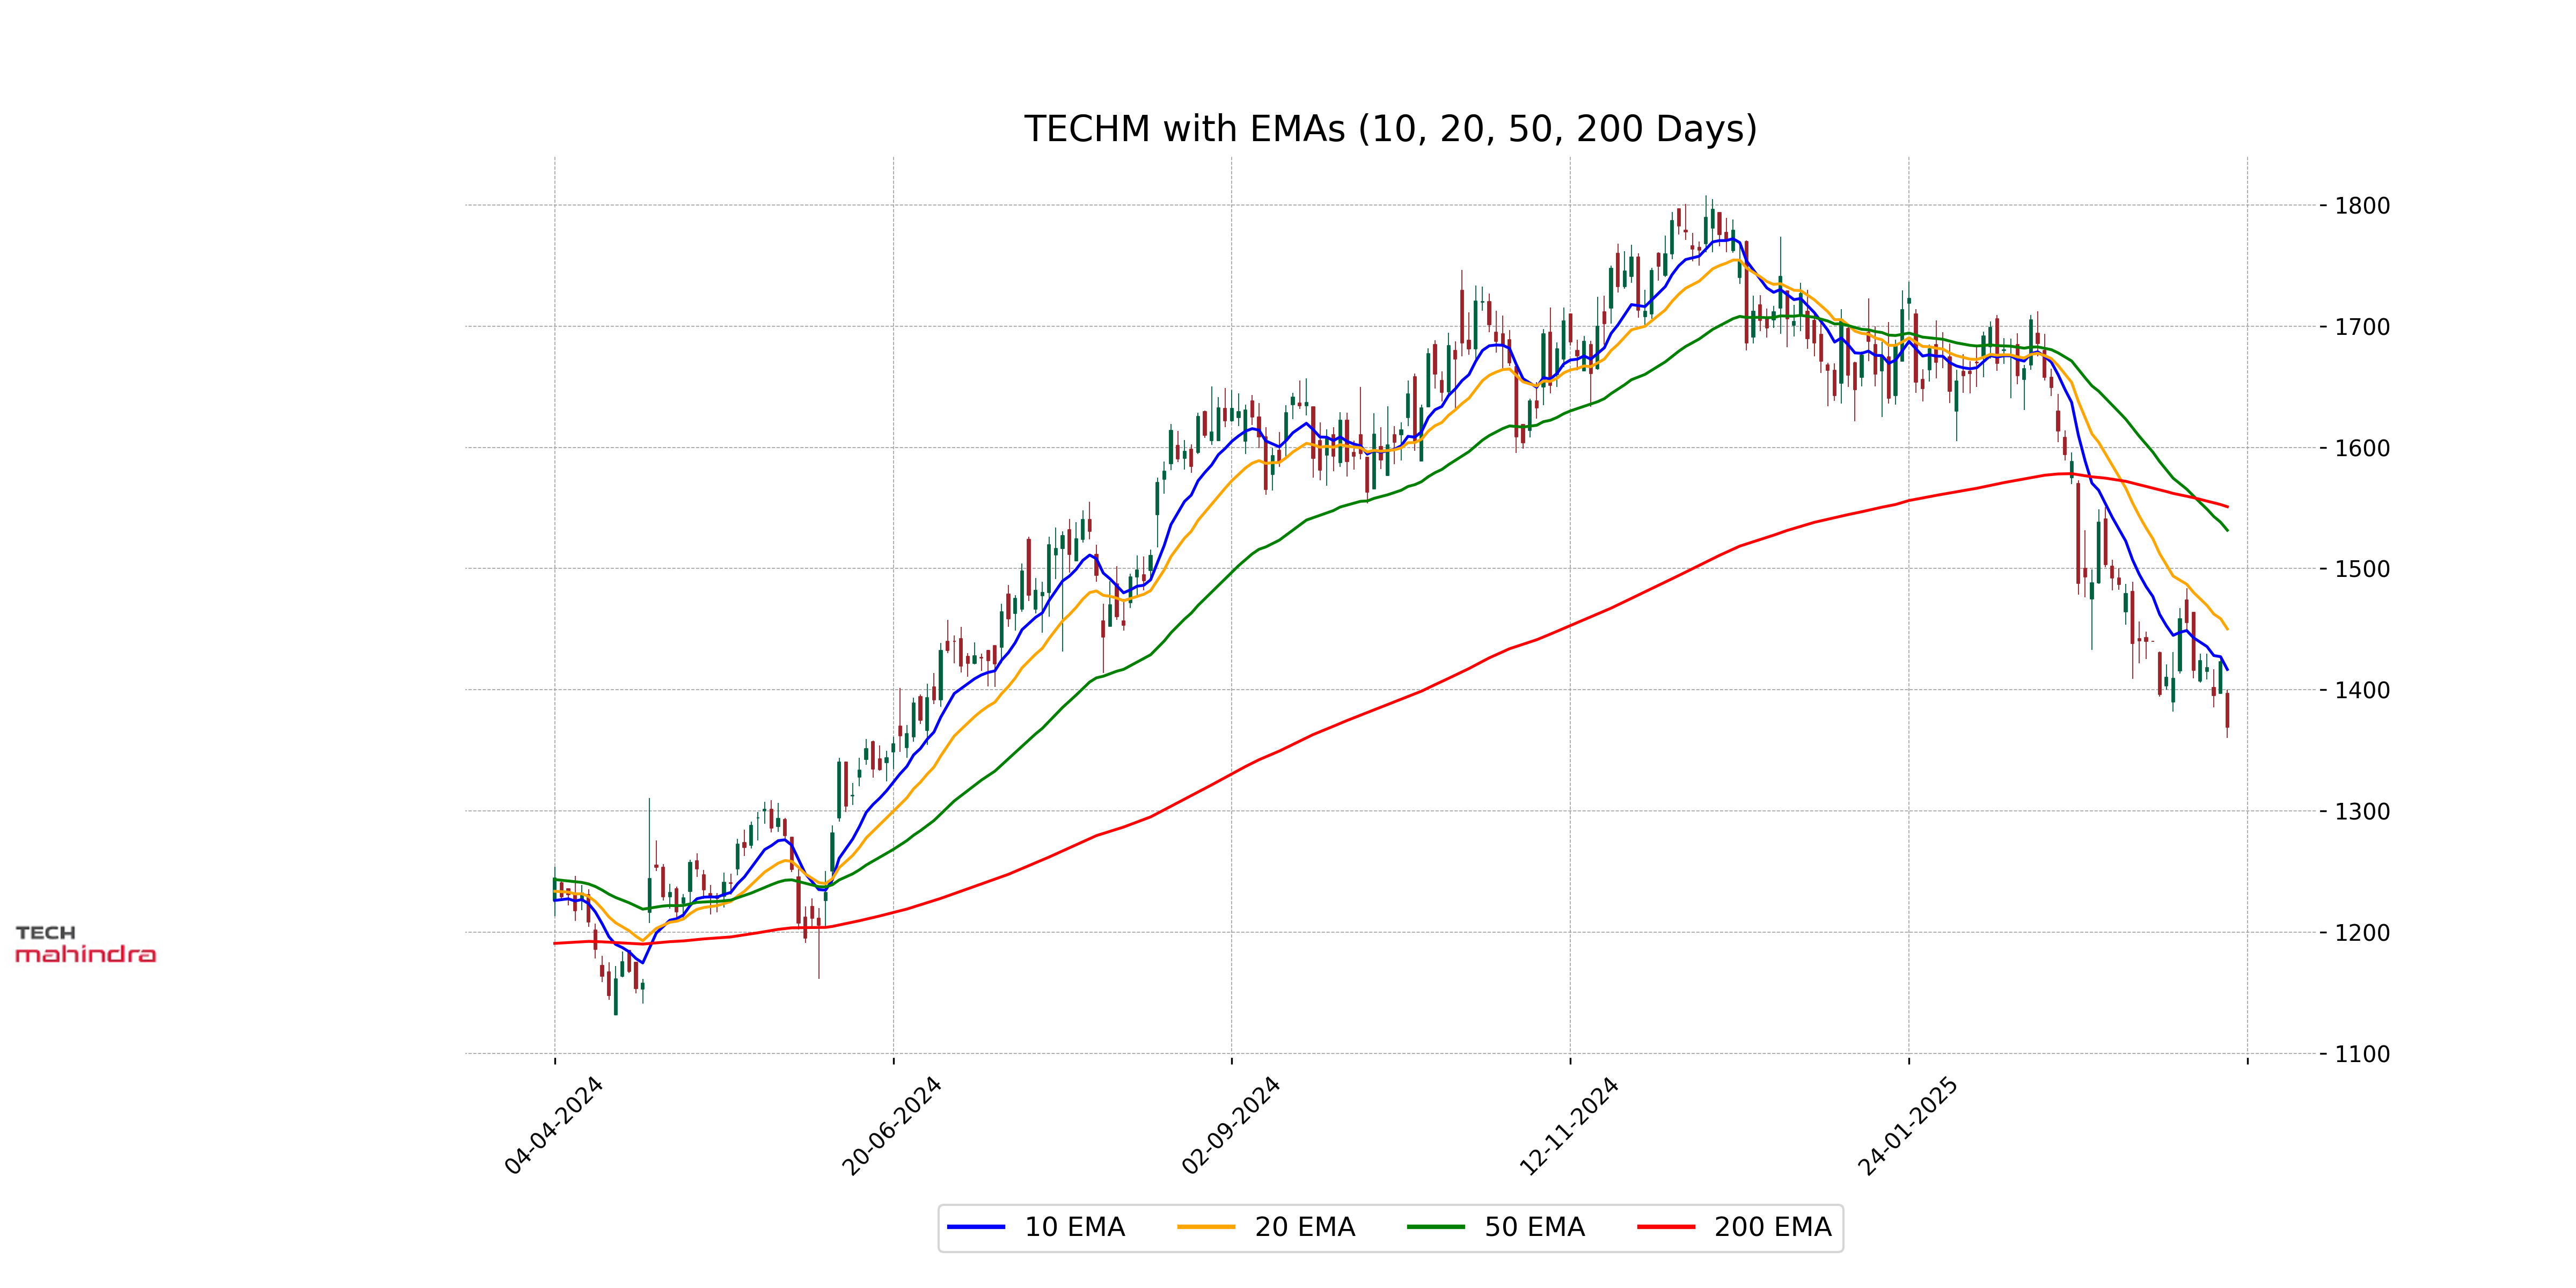
Relationship with Key Moving Averages
Tech Mahindra's stock is trading below its key moving averages, with the current price of 1369.35 significantly under both the 50-day EMA of 1531.64 and the 200-day EMA of 1551.02. This indicates a bearish trend, suggesting potential downward momentum in the short to medium term.
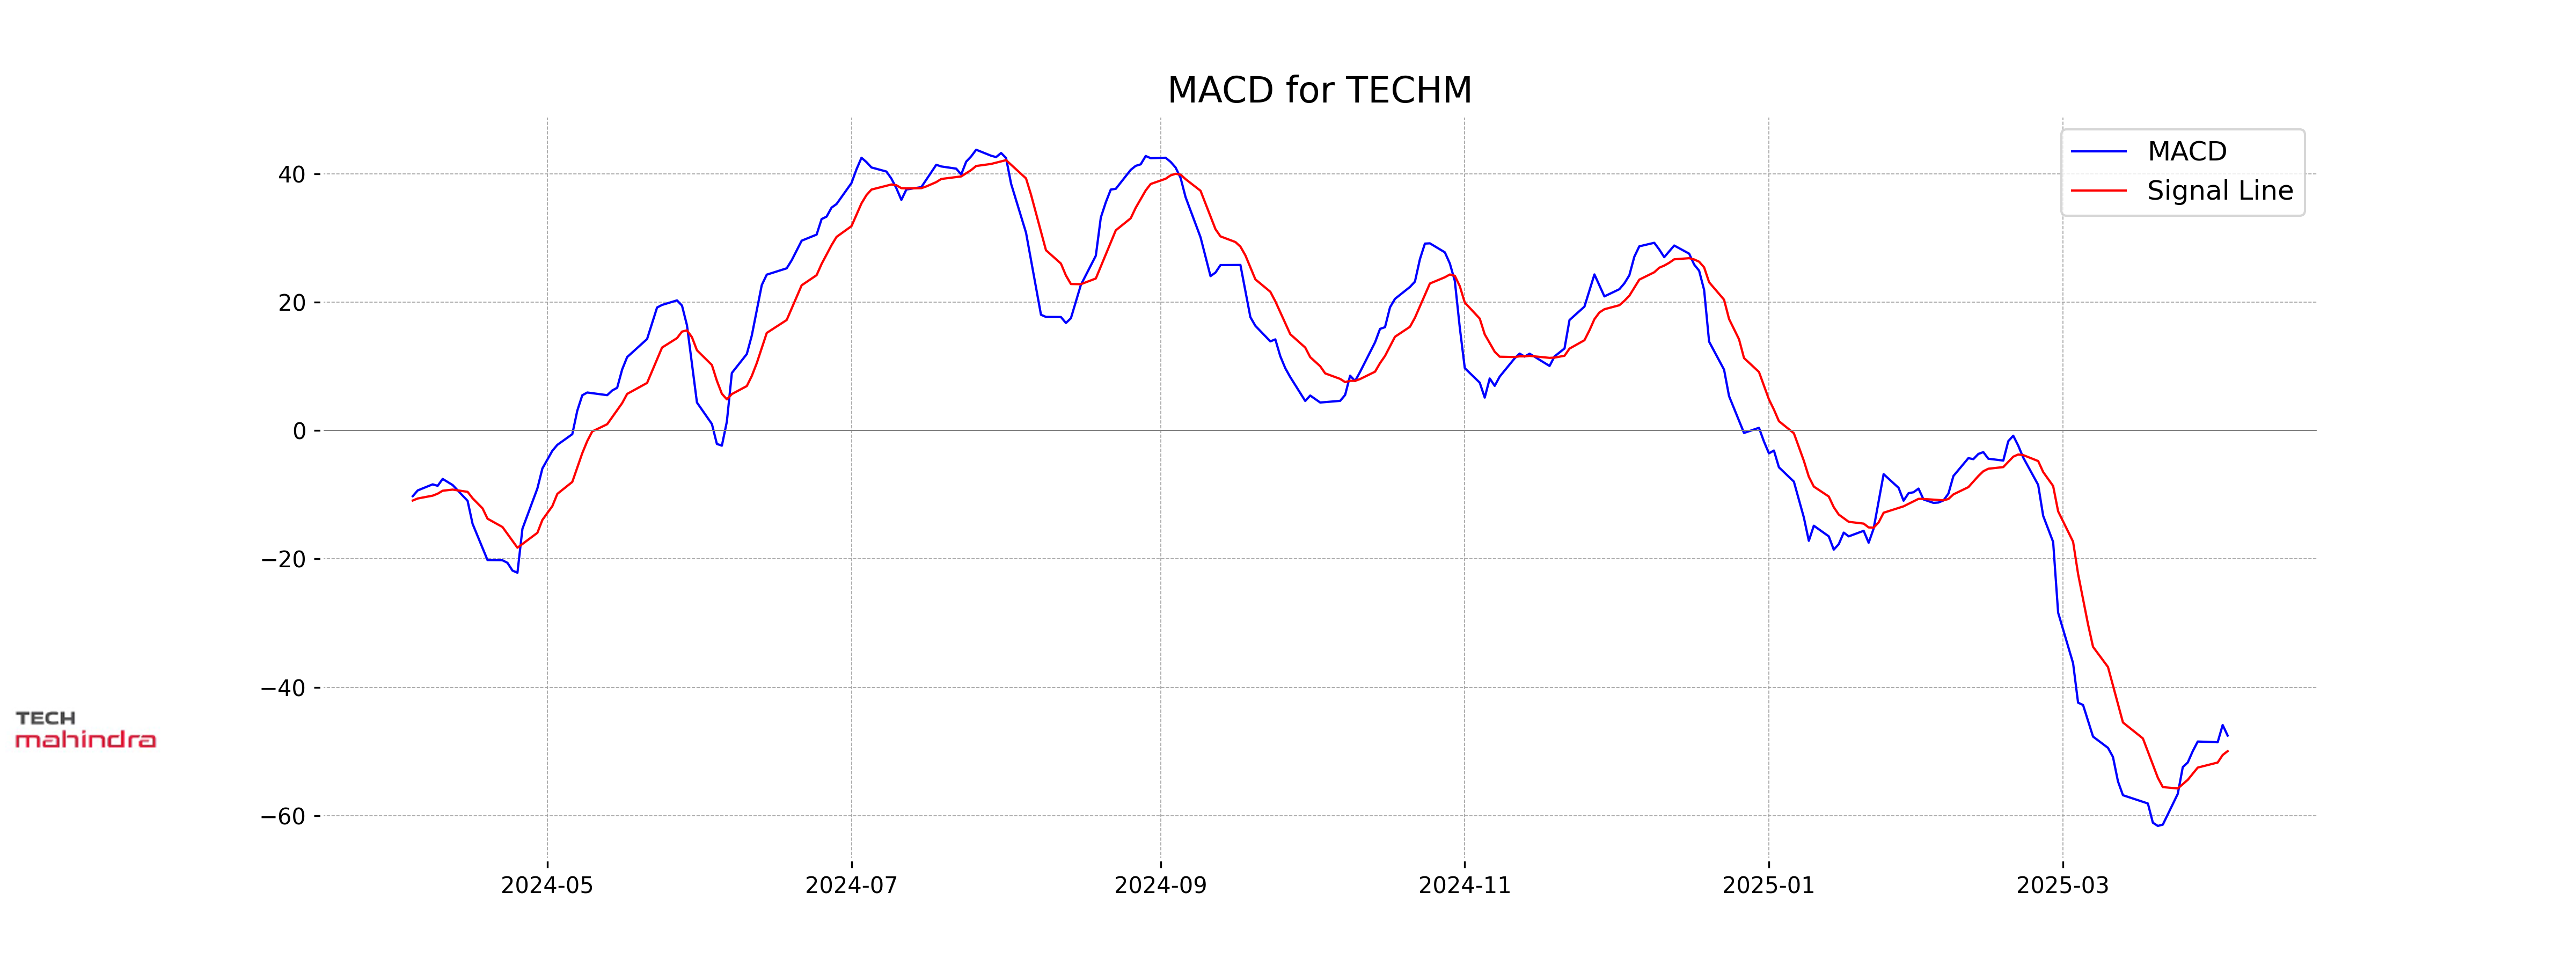
Moving Averages Trend (MACD)
MACD Analysis: Tech Mahindra's MACD is at -47.54, with a signal line at -49.96, indicating a bearish momentum. The MACD is below the signal line, which suggests that the stock might continue in a downtrend.
RSI Analysis
RSI Analysis for Tech Mahindra: The Relative Strength Index (RSI) for Tech Mahindra is 31.92, indicating that the stock is approaching oversold territory. This suggests potential for a price reversal or consolidation, but further analysis is needed to confirm any trading decisions.
Up Next
NSE Nifty 50 Top losers: What are the 5 Biggest Stock losers Today April 03, 2025

New Zealand commits USD 20 bn investment in India under FTA in 15 yrs; on lines of EFTA pact

India, New Zealand conclude FTA talks; pact to offer duty-free access, USD 20 bn FDI

FTA with New Zealand to significantly deepen bilateral economic engagement: Govt

Rupee breaches 91-mark against US dollar for first time in intra-day trade

Microsoft commits USD 17.5 billion investment in India: CEO Satya Nadella

More videos

CBI books Anil Ambani's son, Reliance Home Finance Ltd. in Rs 228 crore bank fraud case

RBI raises FY26 GDP growth projection to 7.3 pc

RBI trims policy interest rate by 25bps to 5.25pc, loans to get cheaper

Rupee slumps to all-time low of 90.25 against US dollar in intra-day trade

Reliance completes merger of Star Television Productions with Jiostar

India to lead emerging market growth with 7pc GDP rise in 2025: Moody’s

Nifty hits record high after 14 months; Sensex nears all-time peak

Reliance stops Russian oil use at its only-for-export refinery to comply with EU sanctions

ED attaches fresh assets worth over Rs 1,400 cr in case against Anil Ambani's Reliance Group

India signs one-year deal to import 2.2 million tonnes of LPG from US